
HBL Engineering Ltd (HBLENGINE)
Stock Analysis Report
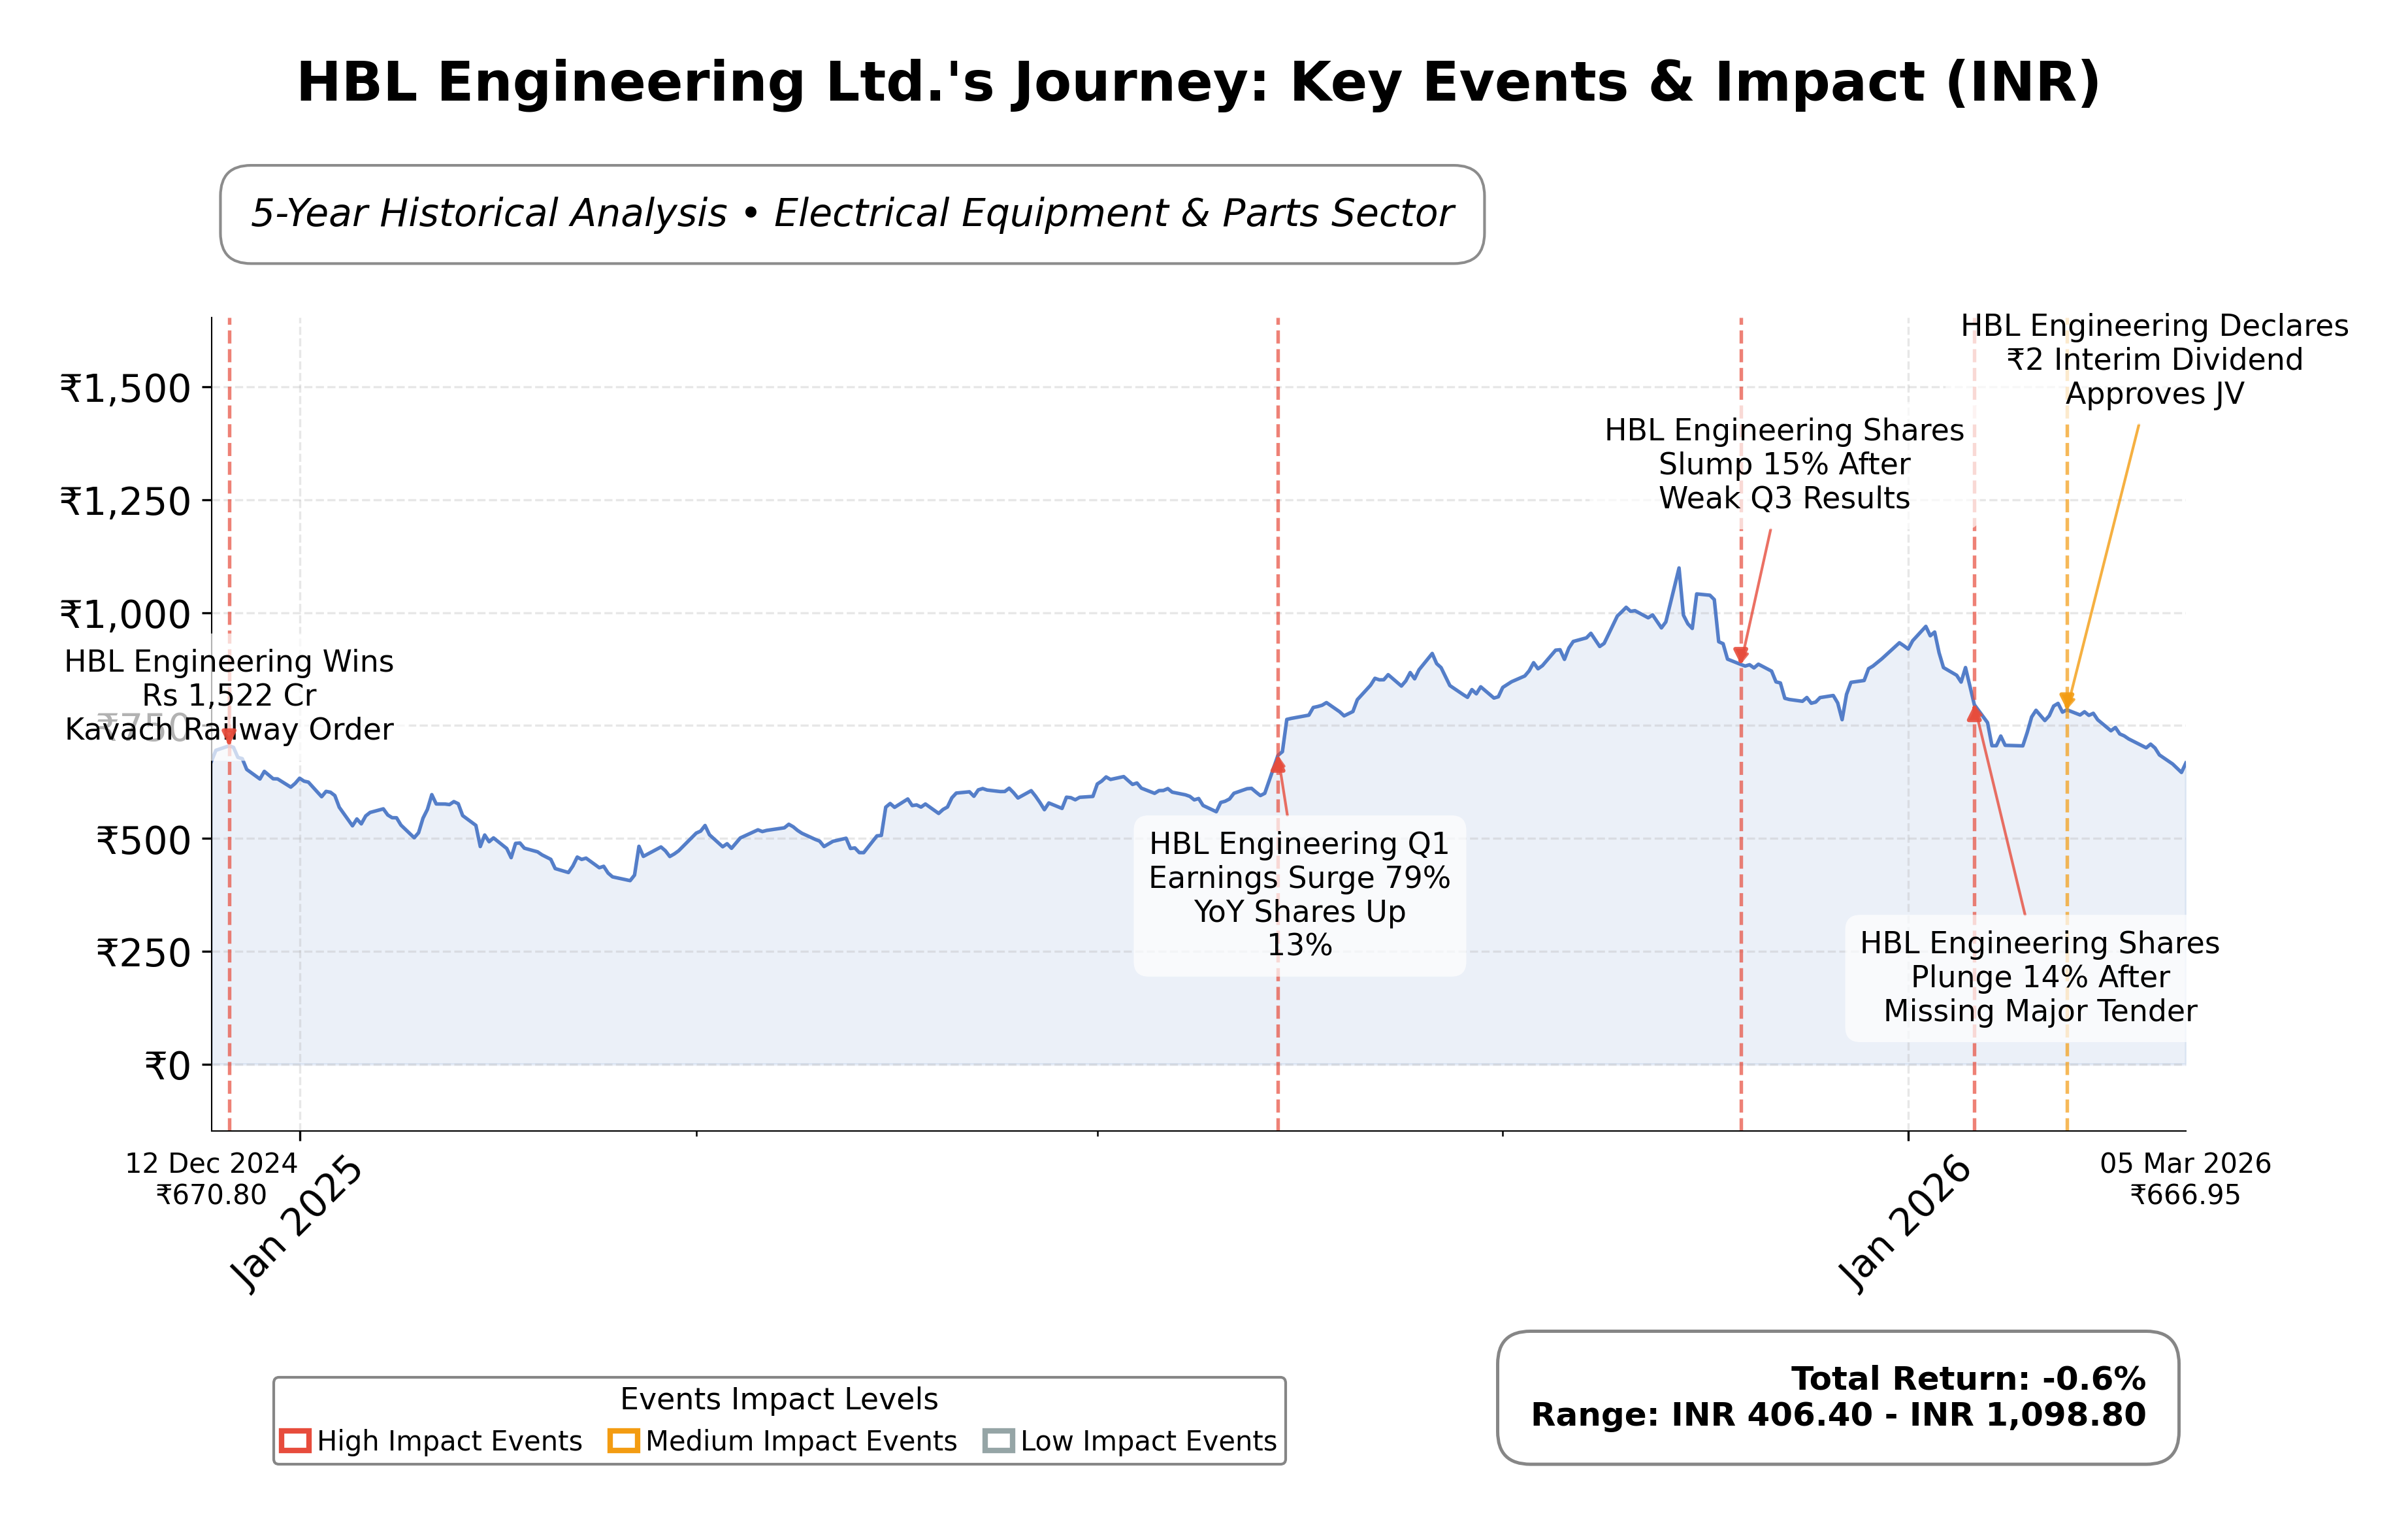
Stock Journey
Key Positives and Key Risks
Pros
- Strong revenue growth of 94% quarterly increase indicating robust operational expansion.
- Healthy profitability with a profit margin of 25.08% and return on equity of 18.68%.
- Reaffirmed CARE A+ credit rating with positive outlook reflecting financial stability.
Cons
- Recent technical analysis shows bearish momentum and significant stock price gap down of 11.93%.
- High price-to-book ratio of 9.90 and price-to-cash-flow ratio of 86.33 suggesting valuation premiums.
- Market volatility and sector competition present risks to near-term performance.
Disclosure: This information is for general awareness and does not constitute investment advice
Report Summary
HBL Engineering Ltd. operates primarily in the engineering and manufacturing sector with a focus on advanced technology solutions including defense electronics, power electronics, and specialized batteries. The company serves critical sectors such as defense, transportation, telecommunications, and energy, positioning itself as a key supplier of innovative and reliable industrial components within India and internationally.
Financially, HBL Engineering reports a market capitalization of approximately â¹194.08 billion with a trailing P/E ratio of 24.67, aligning closely with the industry average. The company demonstrates strong profitability metrics including a gross margin of 58.35%, operating margin of 33.19%, and a profit margin of 25.08%. It maintains a robust return on equity of 18.68% and a healthy current ratio of 3.06, supported by a low debt level relative to equity. The PEG ratio of 0.10 suggests growth potential relative to earnings.
Technically, the stock has experienced a recent shift towards a mildly bearish momentum, with price action showing volatility and a gap down event noted in early March 2026. The company has recently secured significant contracts, such as the KAVACH order, and received reaffirmed credit ratings (CARE A+), reflecting operational strength and creditworthiness. Institutional ownership is substantial at 55.46%, indicating confidence from major shareholders, while insider holdings remain low. Risks include market volatility and sector-specific challenges, but strengths lie in technological innovation and strategic contract wins.
In comparison with regional peers in the Electrical Equipment & Parts industry, HBL Engineering holds a mid-sized market capitalization relative to larger peers like Polycab India Ltd. and Hitachi Energy India Ltd. It exhibits a more moderate P/E ratio and EV/EBITDA multiple, suggesting relatively balanced valuation. Return on equity is competitive within the peer group, though price-to-cash-flow ratios are higher, indicating potential valuation premium or cash flow generation differences. Peers generally show higher P/E and EV/EBITDA ratios, reflecting varied growth expectations and market positioning.
HBL Engineering Ltd. stands as a significant participant navigating a complex industrial landscape marked by rapid technological advancements and evolving sector demands. Recent achievements include strong revenue growth and strategic contract acquisitions, while challenges involve maintaining momentum amid technical market shifts and competitive pressures. The companyâs current strategies and market conditions present pivotal moments that could influence its financial trajectory and market perception. Evaluating the available data suggests a stance that balances recognition of growth potential with caution towards near-term volatility, supporting a measured approach to engagement with the stock.
Company and Industry Overview
Company Basics
Price Performance
Company Size
Shareholding Pattern
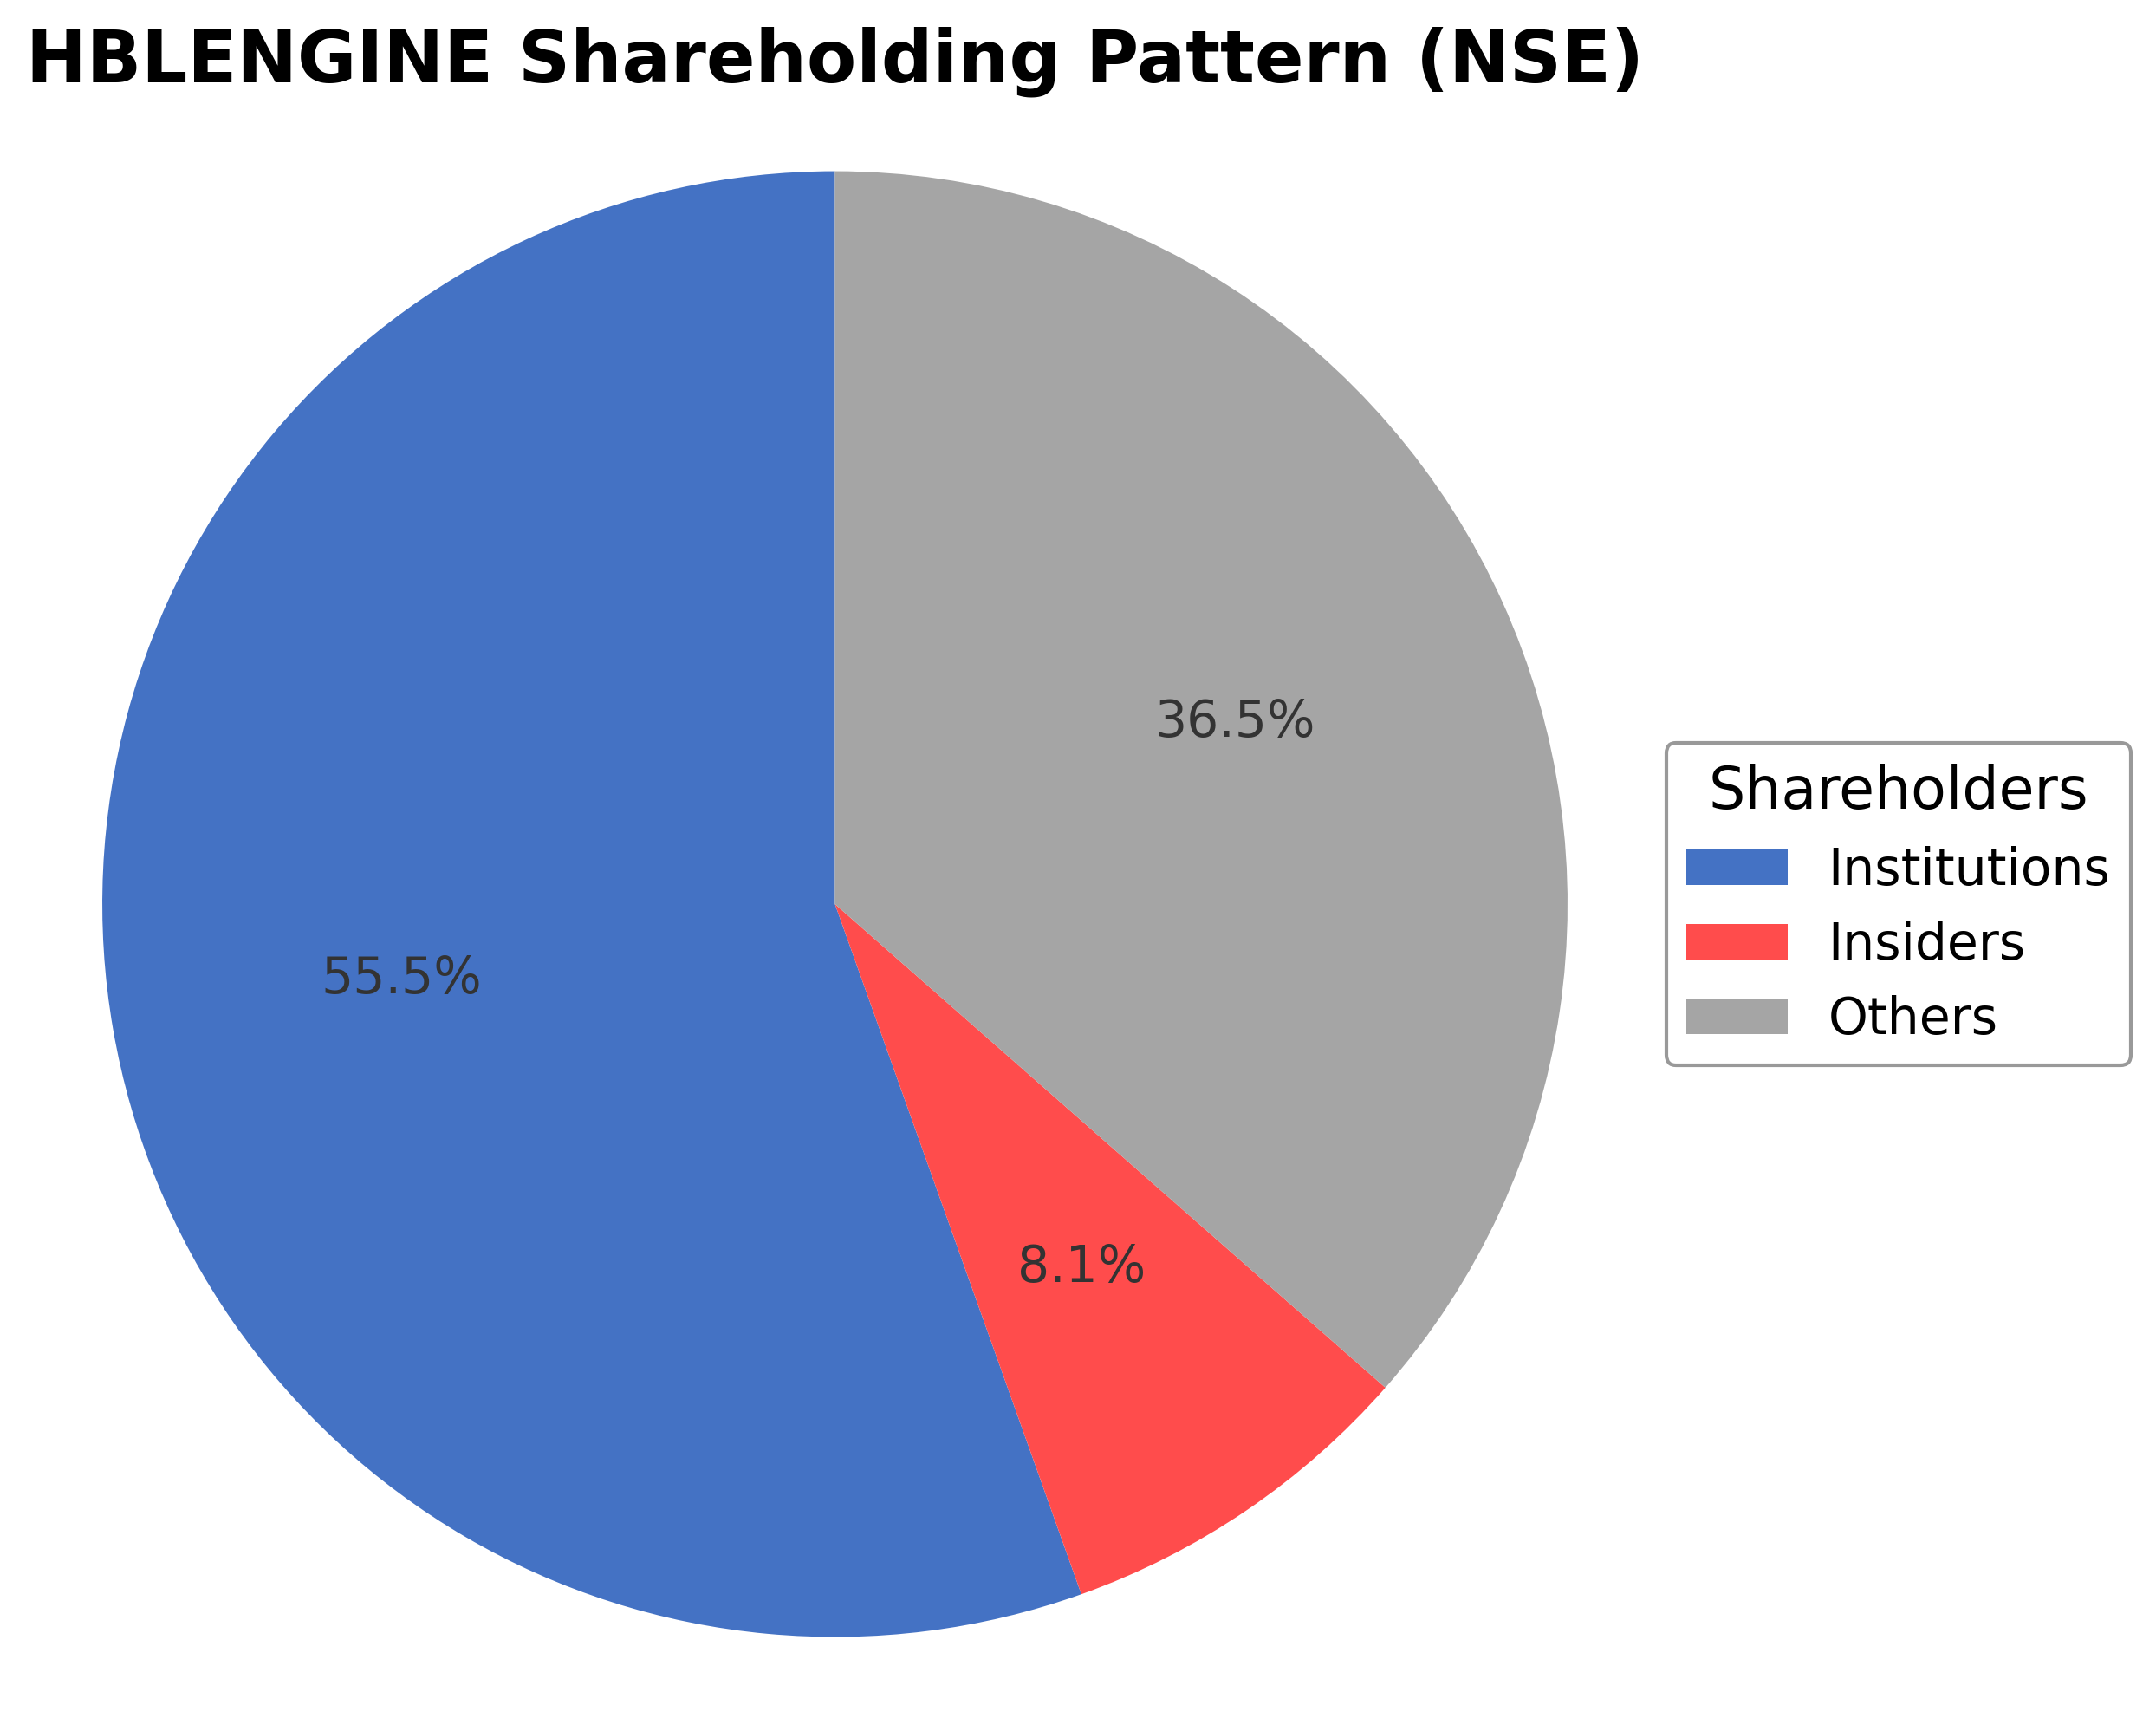
The shareholding structure of HBL Engineering Ltd. comprises approximately 8.07% held by insiders including executives and board members, while institutional investors hold a significant 55.46% stake, reflecting strong institutional interest and confidence. The remaining 36.47% is held by public shareholders including retail investors and employee stock plans. Over the past 12 to 24 months, institutional holdings have shown fluctuations with some accumulation noted in recent quarters, indicating evolving market sentiment. This ownership distribution suggests a governance framework influenced by institutional oversight and a diversified shareholder base, which may impact strategic decisions and corporate actions in alignment with shareholder interests.
Sector and Industry Analysis
HBL Engineering Ltd. operates within the broader industrial engineering sector, which encompasses companies engaged in the design, manufacture, and servicing of machinery, equipment, and related engineering solutions. This sector is characterized by its integral role in supporting infrastructure development, manufacturing, and energy projects globally. The market size is substantial, driven by ongoing industrialization, urbanization, and infrastructure investments, particularly in emerging economies. Key players include large multinational engineering firms and specialized regional companies that provide tailored solutions across sectors such as construction, power generation, and manufacturing.
Industry trends reveal a significant shift towards automation, digitalization, and sustainability. The adoption of Industry 4.0 technologies—such as IoT-enabled machinery, predictive maintenance, and advanced robotics—is transforming operational efficiencies and product offerings. Consumer behavior within this sector is evolving, with clients demanding more integrated, energy-efficient, and environmentally compliant solutions. Emerging opportunities are evident in renewable energy infrastructure, smart manufacturing, and retrofitting existing plants to meet stricter environmental standards. Additionally, the increasing emphasis on lifecycle services and after-sales support is reshaping competitive dynamics.
The regulatory landscape is complex and varies by geography but generally includes stringent safety standards, environmental regulations, and quality certifications. Compliance with international standards such as ISO certifications and local regulatory bodies is mandatory, impacting product design and operational processes. Policy initiatives promoting green energy and infrastructure development create both challenges and incentives, influencing capital allocation and project pipelines. Trade policies and tariffs can also affect supply chains and cost structures within this sector.
Competitive dynamics in the industrial engineering sector are shaped by moderate to high barriers to entry, including capital intensity, technological expertise, and established client relationships. Market structure tends to be oligopolistic at the global level, with a few dominant players, while regional markets may have fragmented competition with numerous smaller firms. Competitive positioning hinges on technological innovation, cost efficiency, customization capabilities, and service quality. Strategic partnerships and mergers are common to enhance capabilities and market reach. For companies like HBL Engineering Ltd., differentiation through niche specialization and strong local presence is critical to maintaining competitive advantage.
Note: Analysis synthesized from industry research, market reports, and regulatory filings. Information is subject to change based on market conditions.
Illustrative Scenario Analysis
DCF Assumptions:
Method: Two-Stage EPS-Priority Model
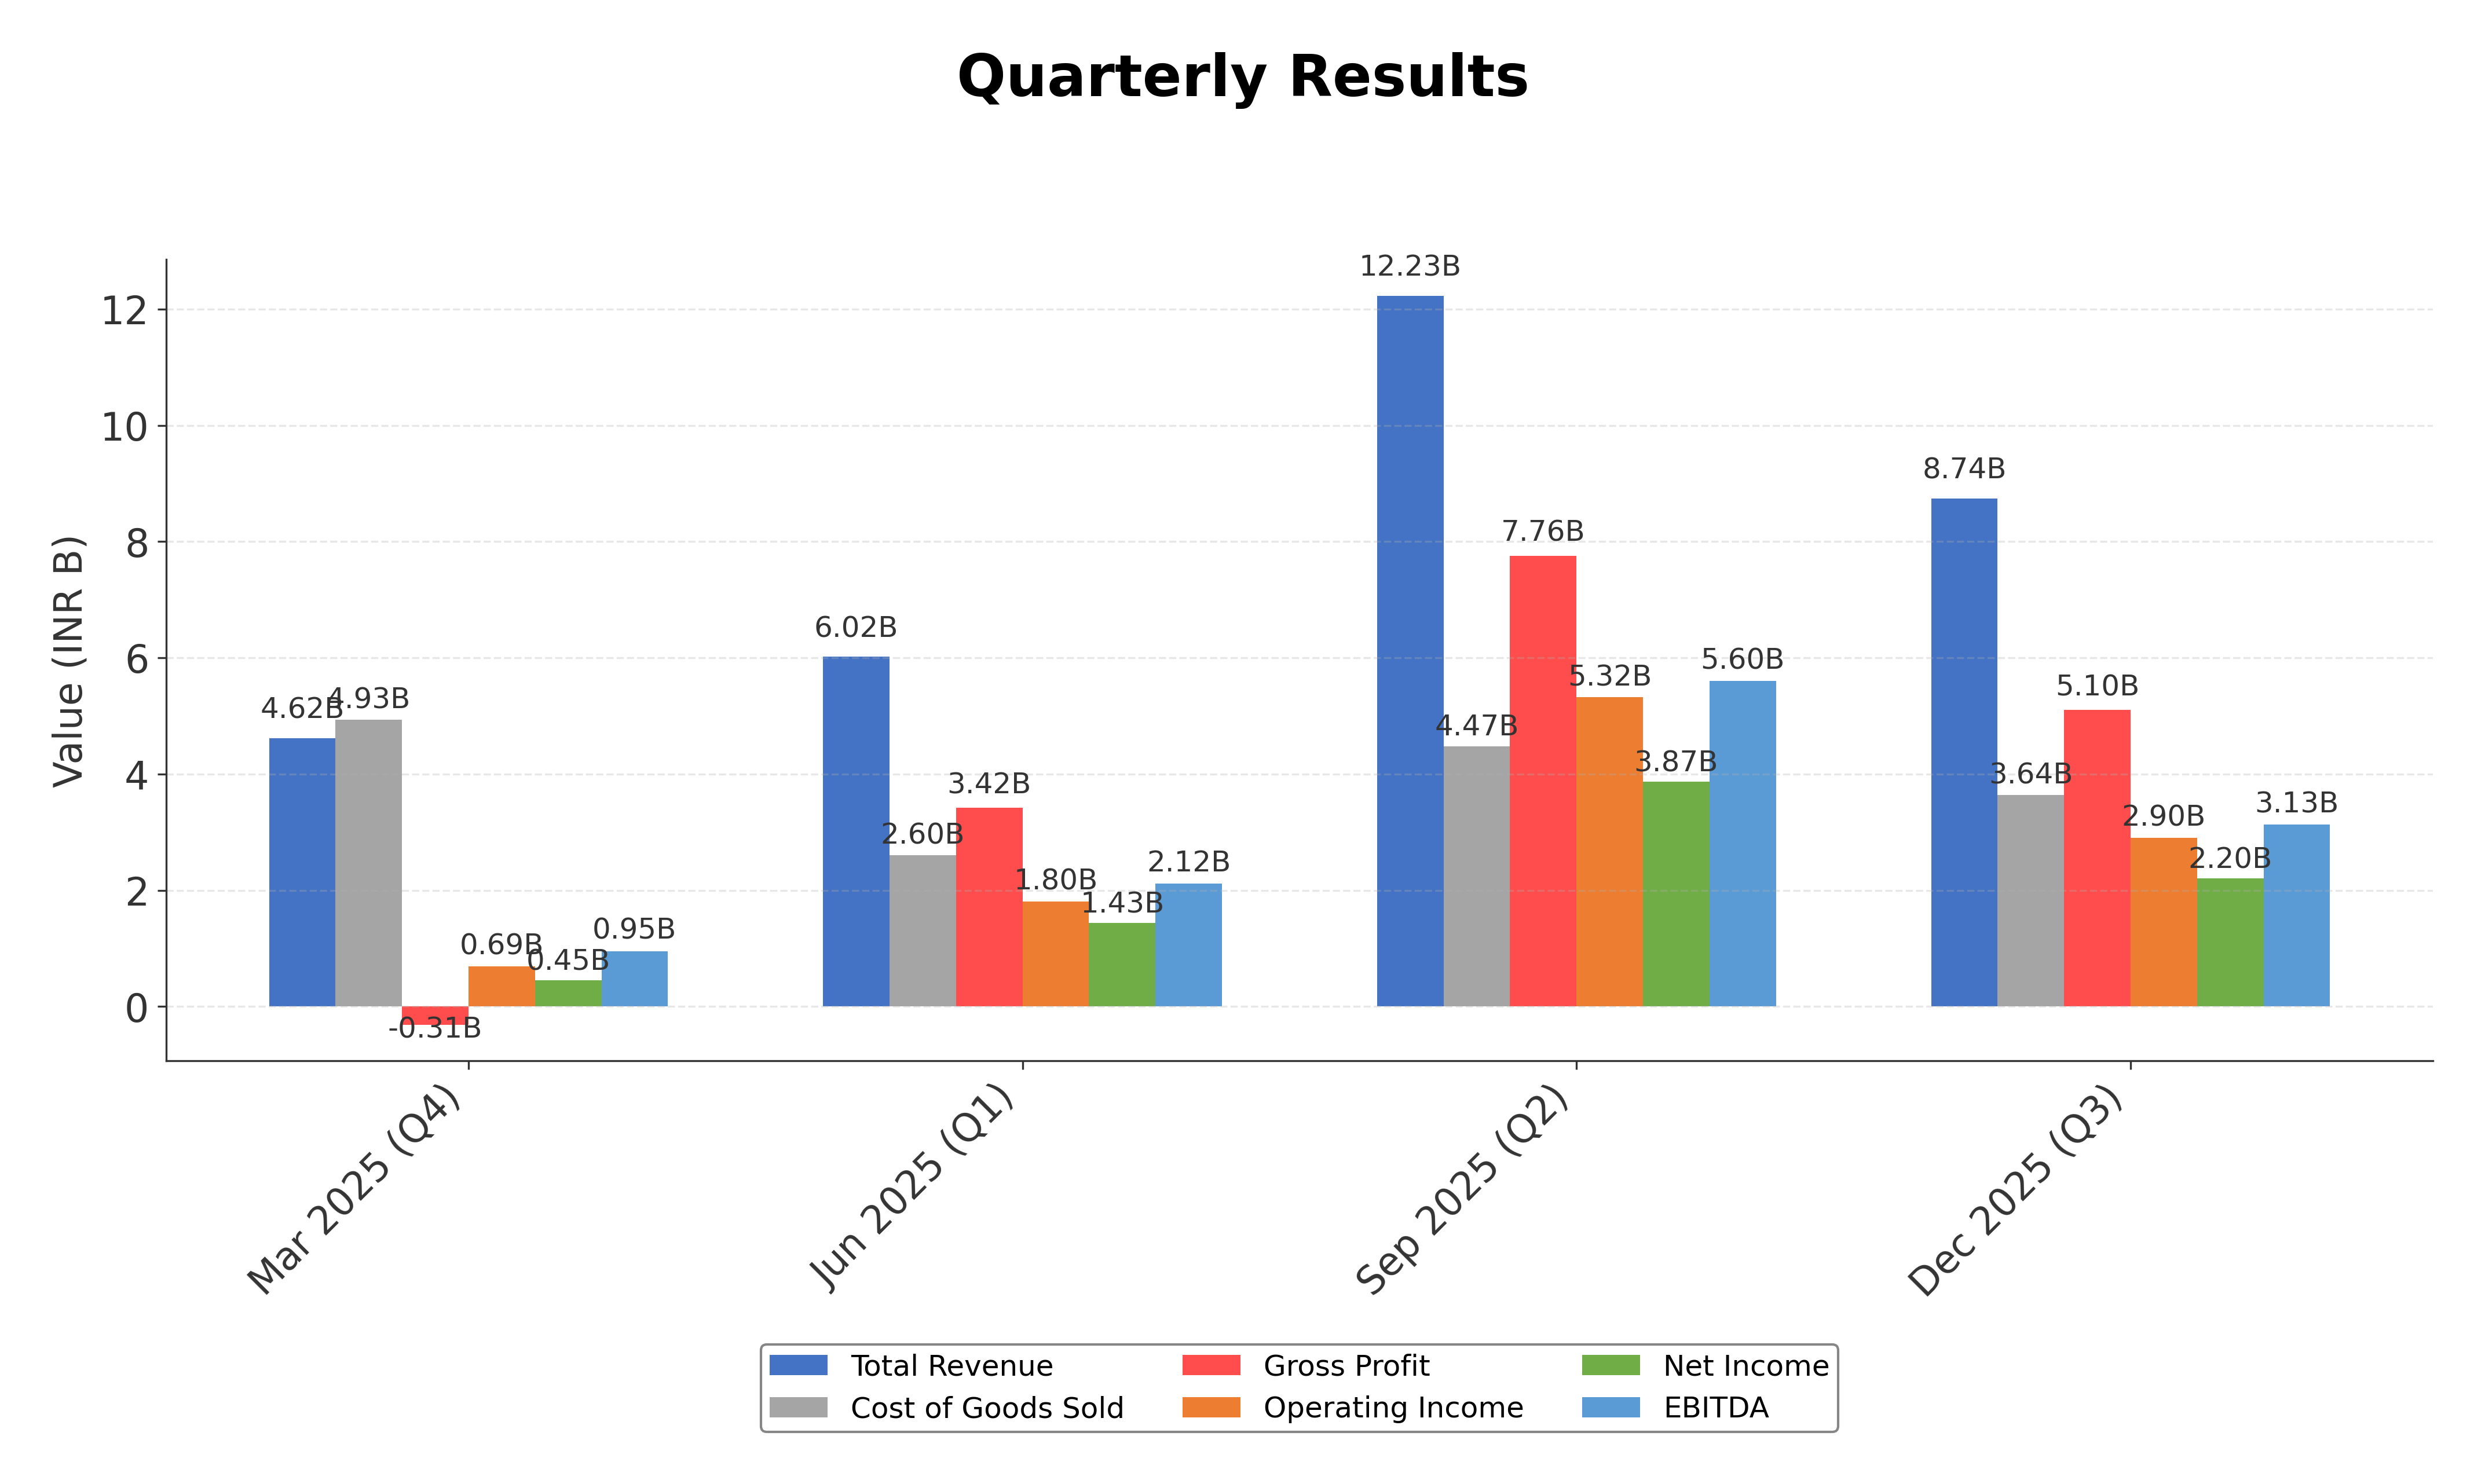
Financials
Peer Analysis
| Company Name | Market Cap | P/E Ratio | P/B Ratio | EV/EBITDA | Price to CFO |
|---|---|---|---|---|---|
| HBL Engineering Ltd. | ₹194.08B | 24.67 | 9.90 | 17.53 | 86.33 |
| Kei Industries Ltd. | ₹485.69B | 56.18 | 7.84 | 41.80 | 192.89 |
| Honeywell Automation India Ltd. | ₹274.05B | 54.35 | 6.54 | 42.62 | 138.97 |
| Hitachi Energy India Ltd. | ₹1.14T | 134.18 | 24.86 | 106.16 | 86.29 |
| CG Power and Industrial Solutions Limited | ₹1.14T | 101.00 | 15.31 | 79.56 | 160.78 |
| Polycab India Ltd. | ₹1.30T | 49.51 | 11.55 | 32.99 | 41.27 |
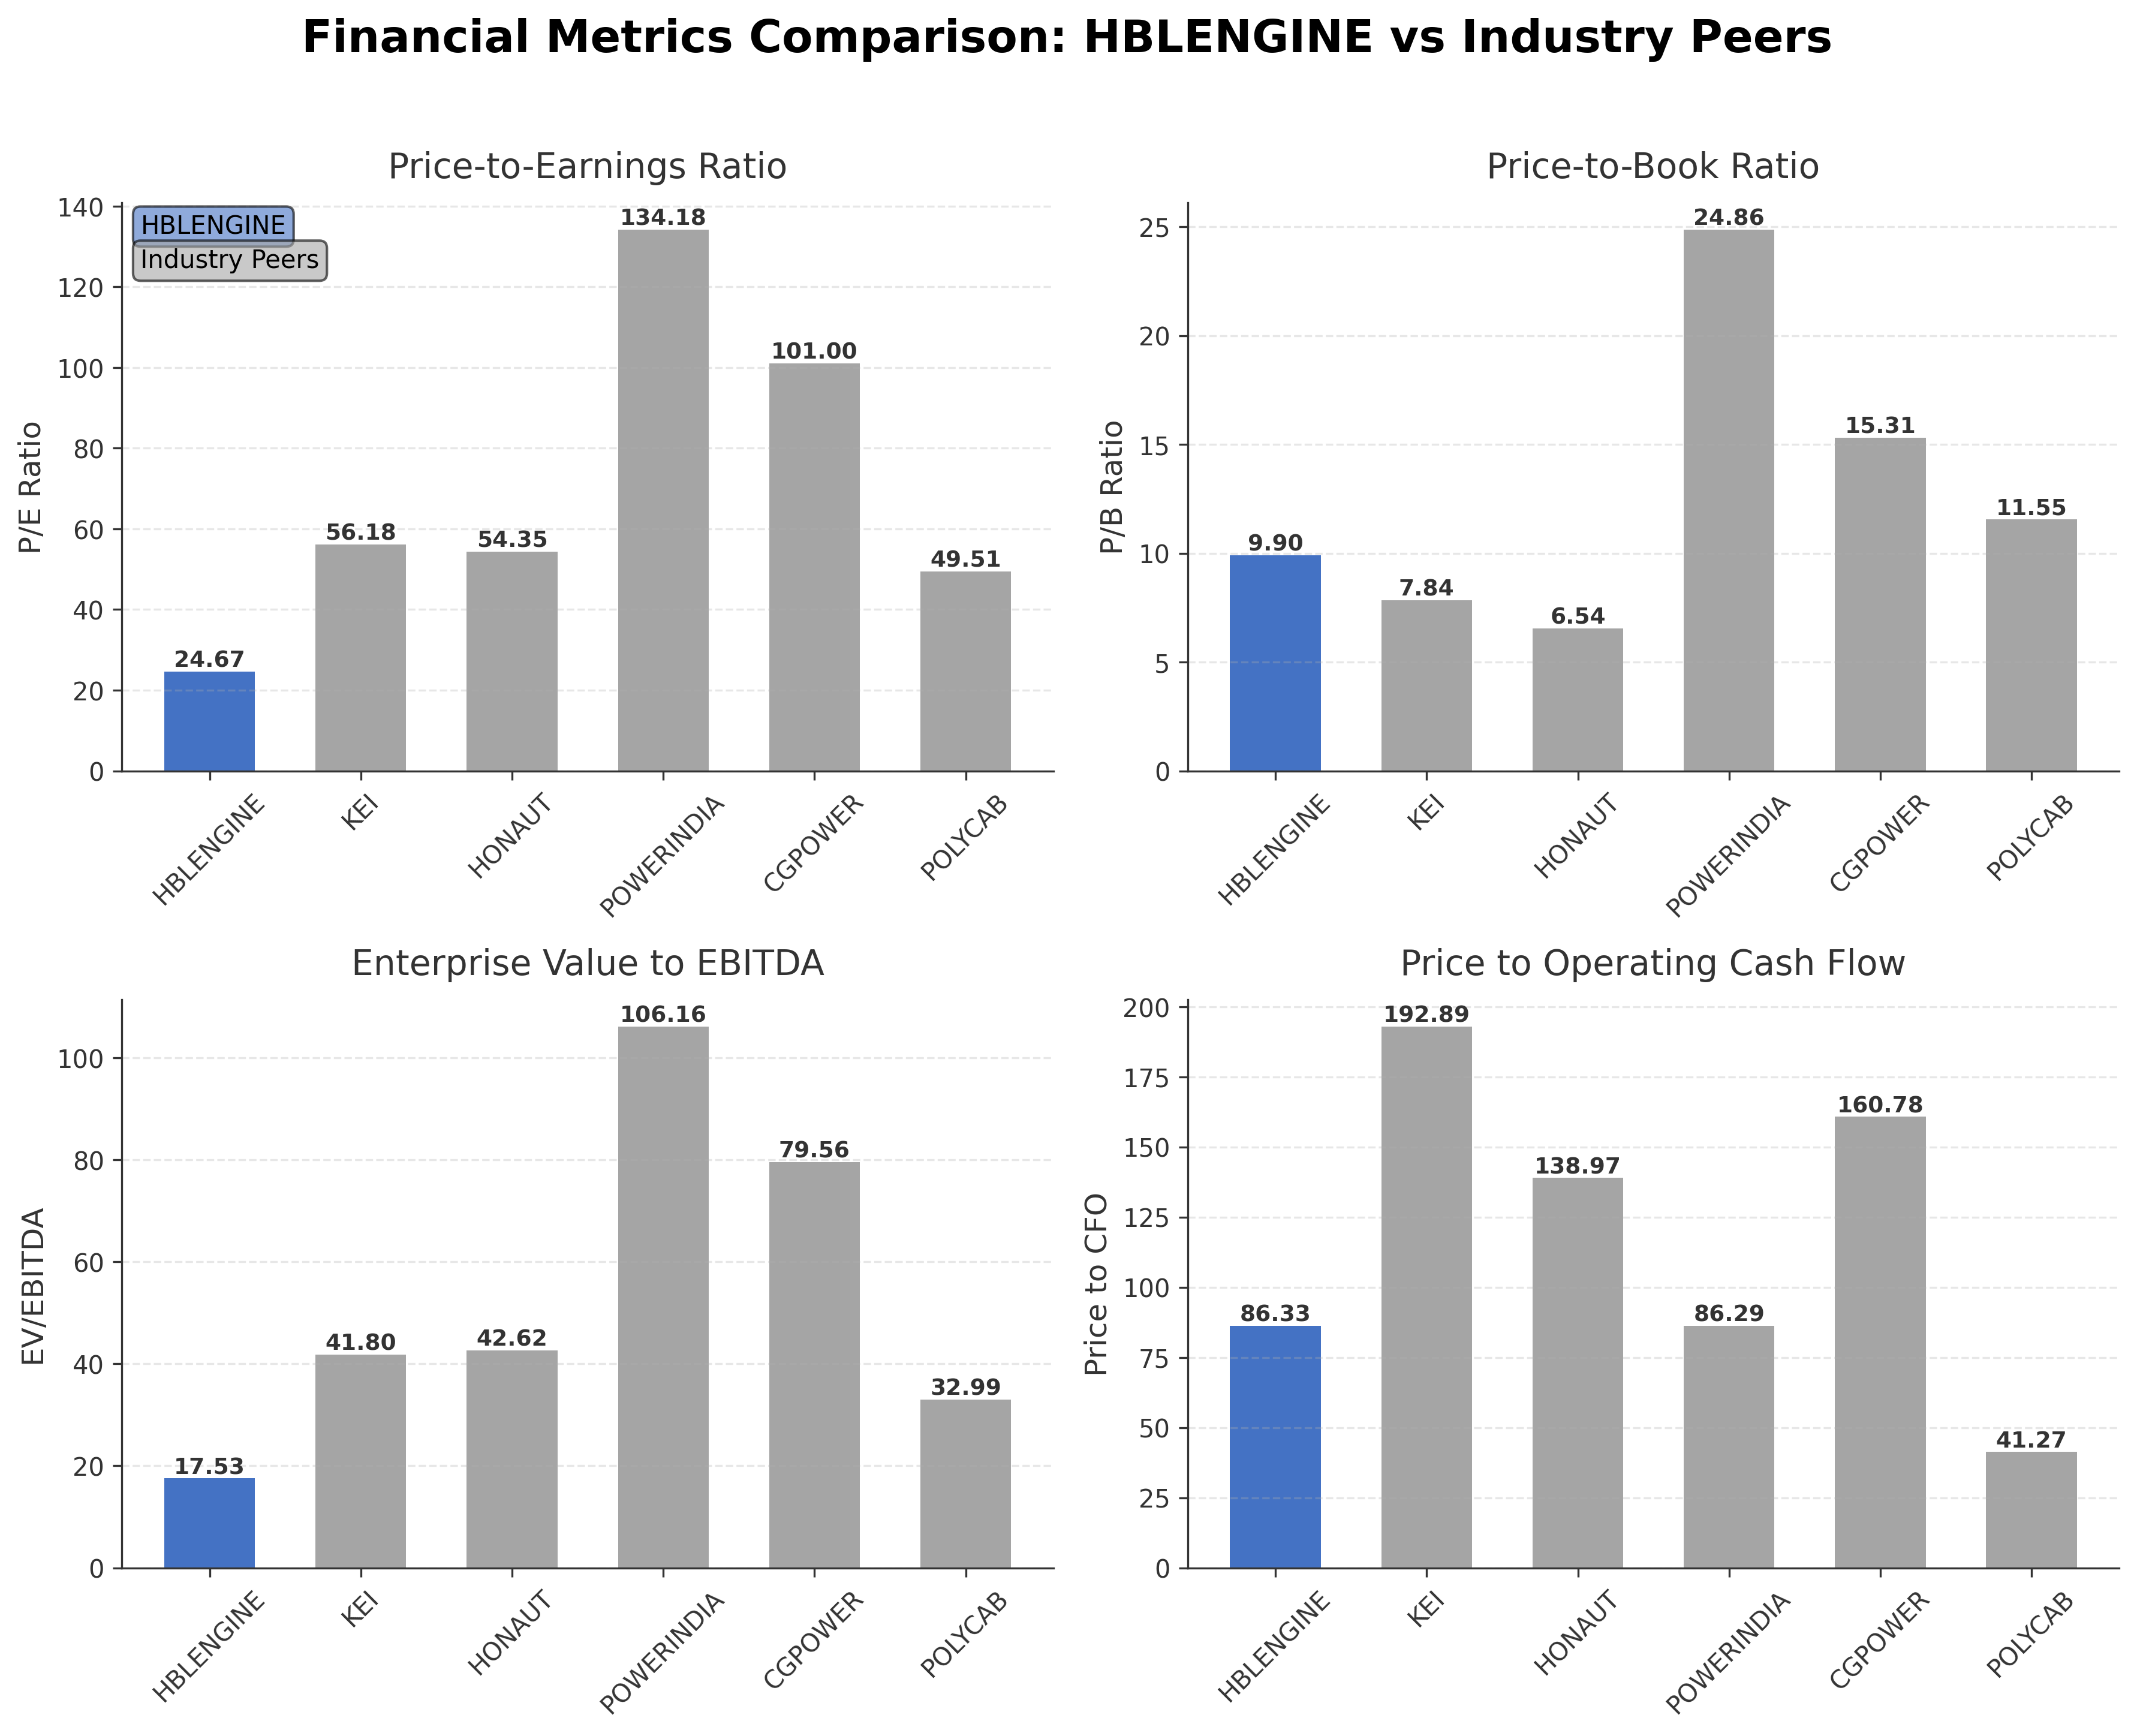
Comparison Analysis: HBL Engineering Ltd. presents a moderate market capitalization relative to its larger peers in the Indian Electrical Equipment & Parts sector. Its P/E ratio of 24.67 is significantly lower than peers such as Hitachi Energy India Ltd. and CG Power, indicating a more conservative valuation. The company’s price-to-book ratio is higher than some peers, suggesting a premium on net asset value. Return on equity is competitive, though slightly below top performers like Polycab India Ltd. Price to cash flow is elevated compared to peers, which may reflect differences in cash generation or valuation perspectives. Overall, HBL Engineering balances valuation and profitability metrics within its peer group.
Financial Metrics Comparison with Peers
Financial Statements
Comprehensive financial data including income, balance sheet, and cash flow metrics
Income Statement
| fiscal_date | 2025-03-31 | 2024-03-31 | 2023-03-31 | 2022-03-31 | 2021-03-31 |
|---|---|---|---|---|---|
| Sales | 19.54B | 22.21B | 13.58B | 12.13B | 8.94B |
| Cost Of Goods | 12.27B | 14.85B | 9.82B | 8.94B | 6.78B |
| Gross Profit | 7.27B | 7.37B | 3.76B | 3.19B | 2.16B |
| Operating Expense Selling General And Administrative | 1.16B | 1.15B | 915.35M | 781.22M | 623.11M |
| Operating Expense Other Operating Expenses | 494.84M | 482.75M | 309.45M | 204.31M | 149.31M |
| Operating Income | 3.48B | 3.84B | 1.17B | 1.08B | 342.95M |
| Non Operating Interest Income | 116.57M | 63.37M | 56.19M | 67.14M | 45.61M |
| Non Operating Interest Expense | 73.77M | 92.63M | 56.84M | 43.33M | 86.97M |
| Pretax Income | 3.74B | 3.77B | 1.30B | 1.22B | 194.22M |
| Income Tax | 973.70M | 964.37M | 313.53M | 286.93M | 56.95M |
| Net Income | 2.76B | 2.80B | 984.45M | 937.10M | 137.27M |
| Eps Basic | 9.99 | 10.11 | 3.55 | 3.39 | 0.44 |
| Eps Diluted | 9.99 | 10.11 | 3.55 | 3.39 | 0.44 |
| Basic Shares Outstanding | 277.19M | 277.19M | 277.19M | 277.19M | 277.19M |
| Diluted Shares Outstanding | 277.19M | 277.19M | 277.19M | 277.19M | 277.19M |
| Ebit | 3.81B | 3.86B | 1.35B | 1.27B | 281.19M |
| Ebitda | 4.27B | 4.57B | 1.70B | 1.55B | 780.60M |
| Net Income Continuous Operations | 3.75B | 4.05B | 1.29B | 1.12B | 248.19M |
| Minority Interests | 4.43M | 5.39M | 2.07M | 1.93M | 0.00 |
| Preferred Stock Dividends | 0.00 | 0.00 | 0.00 | 0.00 | 0.00 |
Data provided by Twelve Data
Balance Sheet
| fiscal_date | 2025-03-31 | 2024-03-31 | 2023-03-31 | 2022-03-31 | 2021-03-31 |
|---|---|---|---|---|---|
| Cash And Cash Equivalents | 1.17B | 2.23B | 1.32B | 497.32M | 263.56M |
| Accounts Receivable | 3.73B | 3.82B | 3.12B | 2.93B | 2.54B |
| Total Assets | 19.79B | 16.54B | 12.94B | 11.33B | 10.36B |
| Total Liabilities | 4.97B | 4.34B | 3.43B | 2.67B | 2.54B |
| Long Term Debt | 205.17M | 276.80M | 445.89M | 381.87M | 200.99M |
| Shareholders Equity | 14.82B | 12.20B | 9.51B | 8.66B | 7.82B |
Data provided by Twelve Data
Cash Flow Statement
| fiscal_date | 2025-03-31 | 2024-03-31 | 2023-03-31 | 2022-03-31 | 2021-03-31 |
|---|---|---|---|---|---|
| Operating Activities Net Income | 3.75B | 4.05B | 1.29B | 1.12B | 248.19M |
| Operating Activities Other Non Cash Items | -62.02M | -286.69M | -21.37M | 62.68M | -52.14M |
| Operating Activities Accounts Receivable | -261.74M | -804.89M | -247.52M | -579.15M | 160.76M |
| Operating Activities Other Assets Liabilities | -1.18B | -496.06M | 5.67M | -219.55M | 427.12M |
| Operating Activities Operating Cash Flow | 2.25B | 2.47B | 1.02B | 382.64M | 783.93M |
| Investing Activities Capital Expenditures | -1.19B | -455.75M | -542.20M | -213.54M | -354.21M |
| Investing Activities Net Acquisitions | -1.81B | -994.80M | -10.00M | -6.55M | -10.01M |
| Investing Activities Purchase Of Investments | 0.00 | N/A | N/A | N/A | N/A |
| Investing Activities Sale Of Investments | 0.00 | N/A | N/A | N/A | N/A |
| Investing Activities Other Investing Activity | -311.35M | -5.39M | -74.00K | 74.00K | 1.00K |
| Investing Activities Investing Cash Flow | -3.31B | -1.46B | -552.27M | -220.01M | -364.22M |
| Financing Activities Long Term Debt Issuance | 167.06M | 91.54M | 0.00 | 41.10M | 15.00M |
| Financing Activities Long Term Debt Payments | -2.74M | N/A | -177.50M | -199.90M | -5.62M |
| Financing Activities Short Term Debt Issuance | -118.41M | 91.73M | -97.44M | 240.33M | 908.49M |
| Financing Activities Other Financing Charges | 180.97M | 204.75M | 151.21M | 117.87M | 92.49M |
| Financing Activities Financing Cash Flow | 226.88M | 388.01M | -123.74M | 102.38M | 982.64M |
| End Cash Position | 1.17B | 2.23B | 1.32B | 497.32M | 263.52M |
| Free Cash Flow | 1.17B | 2.20B | 585.59M | -56.59M | 823.77M |
| Financing Activities Common Dividends | N/A | N/A | N/A | -97.02M | -27.72M |
Data provided by Twelve Data
Technical Analysis
Key Insights
- The stock has recently shifted from a sideways trend to a mildly bearish momentum, with a notable gap down observed in early March 2026.
- Key support levels are identified near ₹650, while resistance is observed around the 50-day moving average at ₹813 and the 200-day moving average at ₹765.
- The current price is trading below the 50-day moving average but above the 200-day moving average, indicating mixed signals in trend strength.
- Momentum indicators such as RSI and MACD show weakening momentum, with RSI trending towards neutral to oversold levels and MACD signaling potential bearish crossover.
- Multi-timeframe analysis reveals short-term bearishness on daily charts, while weekly and monthly charts maintain a longer-term neutral to slightly bullish stance.
- Potential market scenarios include consolidation near support levels or further downside if bearish momentum persists, with recovery possible if price breaks above key moving averages.
Trending News
1. Headline: HBL Engineering Ltd Faces Technical Momentum Shift Amid Bearish Signals
Summary: HBL Engineering Ltd, a key player in the Auto Components & Equipments sector, has experienced a notable shift in its technical parameters, signalling a transition from a sideways trend to a mildly bearish outlook. This change is underscored by weakening price momentum and mixed signals from ...
Sentiment: positive
2. Headline: HBL Engineering Ltd Opens with Significant Gap Down Amid Market Concerns
Summary: HBL Engineering Ltd witnessed a sharp decline at market open on 2 Mar 2026, opening with a significant gap down of 11.93%, reflecting heightened market conce...
Sentiment: negative
3. Headline: Cristiano Ronaldo Invests $7.5 Million in Herbalife's Pro2col™ Technology, Acquires 10% Equity Stake
Summary: /PRNewswire/ -- Herbalife Ltd., a premier health and wellness company, community and platform, today announced global sports icon Cristiano Ronaldo acquired a...
Sentiment: positive
4. Headline: HBL Engineering Ltd is Rated Hold
Summary: HBL Engineering Ltd is rated 'Hold' by MarketsMOJO, with this rating last updated on 05 Jan 2026. However, the analysis and financial metrics discussed here reflect the stock's current position as of 19 February 2026, providing investors with the latest insights into the company’s performance ...
Sentiment: neutral
5. Headline: HBL Engineering receives affirmation in credit ratings from CARE | Capital Market News
Summary: Find Latest Business News On Capital Market | Top News On News Today Business | Latest News Business | Management Interviews & More.
Sentiment: positive
6. Headline: HBL Engineering Limited Receives Reaffirmed CARE A+ Credit Rating with Positive Outlook
Summary: HBL Engineering Limited received reaffirmed credit ratings from CARE Ratings Limited on February 17, 2026, maintaining CARE A+ with positive outlook for long-term facilities and CARE A1+ for short-term facilities. The company's credit limits were adjusted with long-term facilities reduced to ...
Sentiment: positive
Summary: In FY26 so far, the stock has surged 58%, rising from Rs 472 to Rs 746.MF Holdings - Jun ’25: 0.21% | Sept ’25: 0.29% | Dec ’25: 0.35%FII Holdings - Jun ’25: 4.83% | Sept ’25: 7.10% | Dec ’25: 5.87% HBL Engineering
Sentiment: positive
8. Headline: HBL Engineering Shares Rally 4% on Securing a KAVACH Order - Equitypandit
Summary: HBL Engineering Limited shares climbed nearly 4% after the company announced that it has secured a LoA from Banaras Locomotive Works
Sentiment: positive
9. Headline: HBL Engineering Limited Secures ₹800.36 Crore Contract for On-board KAVACH Equipment Supply | InvestyWise
Summary: HBL Engineering Limited has received a Letter of Acceptance from Banaras Locomotive Works (BLW) for a substantial contract.…
Sentiment: positive
10. Headline: HBL Engineering - Explosive Growth: 10 large-cap stocks with stellar YoY sales gains | The Economic Times
Summary: The company reported sales of Rs 874 crore in December 2025, up from Rs 450 crore a year ago, marking a 94% year-on-year increase. HBL Engineering
Sentiment: positive
Powered by Brave
Recent Updates
News Summary
Recent updates on HBL Engineering Ltd. indicate a stable but cautious market stance with the company rated as 'Hold' by MarketsMOJO. Despite a significant stock price decline of 27% noted by Simply Wall St, the company maintains strong growth fundamentals supported by a threefold increase in Q3FY26 net profit and robust revenue growth. The reaffirmation of CARE A+ credit rating with a positive outlook further emphasizes financial stability. These developments highlight a balance between operational strength and market volatility, with ongoing contract wins and credit affirmations underpinning confidence amid fluctuating stock performance.
News Sentiment
Sentiment across recent news is predominantly neutral to positive, with credit rating affirmations and contract awards contributing positively, while technical momentum shifts and price volatility introduce caution. The overall tone suggests measured optimism tempered by market dynamics, reflecting a complex interplay of growth prospects and risk factors.
Source List
- https://www.marketsmojo.com/news/stock-recommendation/hbl-engineering-ltd-is-rated-hold-3864340
- https://simplywall.st/stocks/in/capital-goods/nse-hblengine/hbl-engineering-shares/news/hbl-engineering-limited-nsehblengine-stocks-pounded-by-27-bu
- https://www.marketsmojo.com/news/stock-recommendation/hbl-engineering-ltd-is-rated-hold-3846713
- https://www.cnbctv18.com/market/earnings/hbl-engineering-q3-profit-jumps-over-threefold-revenue-dividend-share-price-ws-l-19844880.htm
- https://scanx.trade/stock-market-news/stocks/hbl-engineering-limited-receives-reaffirmed-care-a-credit-rating-with-positive-outlook/32954002
Analytical Overview
Analysis Summary
Valuation Metrics: HBL Engineering's trailing P/E ratio of 24.67 aligns closely with the industry average of 24.67, indicating valuation in line with sector norms. The price-to-book ratio of 9.90 is relatively high, suggesting a premium valuation compared to book value.
Growth Trajectory: The company exhibits strong revenue growth with a 94% quarterly revenue increase and a threefold rise in quarterly net income, supported by positive cash flow trends and a PEG ratio of 0.10 indicating favorable growth relative to earnings.
Financial Health: Financial health appears robust with a current ratio of 3.06, low total debt of ₹872.4 million relative to equity, and positive operating and free cash flows, reflecting solid liquidity and manageable leverage.
Sector Specific Factors: The company benefits from opportunities in defense and industrial sectors, supported by government contracts and technological innovation, though it faces challenges from market volatility and competitive pressures within the electrical equipment industry.
India Specific Factors: Operating within India, HBL Engineering is influenced by regulatory frameworks favoring defense manufacturing and infrastructure development, alongside growing domestic demand for advanced industrial solutions, which may support sustained growth.
Investment Conclusion
Supporting Factors: Strong revenue and profit growth with a 94% increase in quarterly revenue and a threefold rise in net income.
Risk Factors: Recent technical momentum shift towards bearish signals and stock price volatility.
SWOT Analysis
Strengths
- Strong revenue growth with a 94% quarterly increase.
- Robust profitability margins including a 25.08% profit margin.
- Reaffirmed CARE A+ credit rating with positive outlook.
- Significant institutional ownership at 55.46% supporting governance.
Weaknesses
- High price-to-book ratio of 9.90 indicating premium valuation.
- Relatively high price-to-cash-flow ratio of 86.33.
- Low insider ownership at 8.07%, potentially limiting insider alignment.
- Recent technical indicators show bearish momentum shifts.
Opportunities
- Growing demand in defense and industrial sectors in India.
- Strategic contract wins such as the KAVACH equipment supply.
- Favorable regulatory environment supporting domestic manufacturing.
- Expansion potential in telecommunications and energy sectors.
Threats
- Market volatility leading to significant stock price fluctuations.
- Competitive pressures within the electrical equipment industry.
- Economic uncertainties impacting industrial capital expenditures.
- Potential risks from changes in government defense spending policies.
Company Description
HBL Engineering Ltd. is a prominent player in the engineering and manufacturing sector, primarily focused on the design and production of advanced technology solutions. The company has established its core expertise in the development of defense electronics, power electronics, and specialized batteries, catering to the needs of various industrial applications. HBL Engineering Ltd. plays a vital role in the defense sector, supplying critical components and systems that support military operations and national security initiatives. Additionally, the company serves the transportation, telecommunications, and energy sectors, providing innovative and reliable products that enhance operational efficiency and sustainability. With a commitment to technological advancement and quality manufacturing, HBL Engineering Ltd. is significant in advancing critical infrastructure and supporting industrial growth, both domestically and internationally. The company's impact on these sectors underscores its importance within the engineering industry and the broader financial markets.