
Happiest Minds Technologies Ltd (HAPPSTMNDS)
Stock Analysis Report
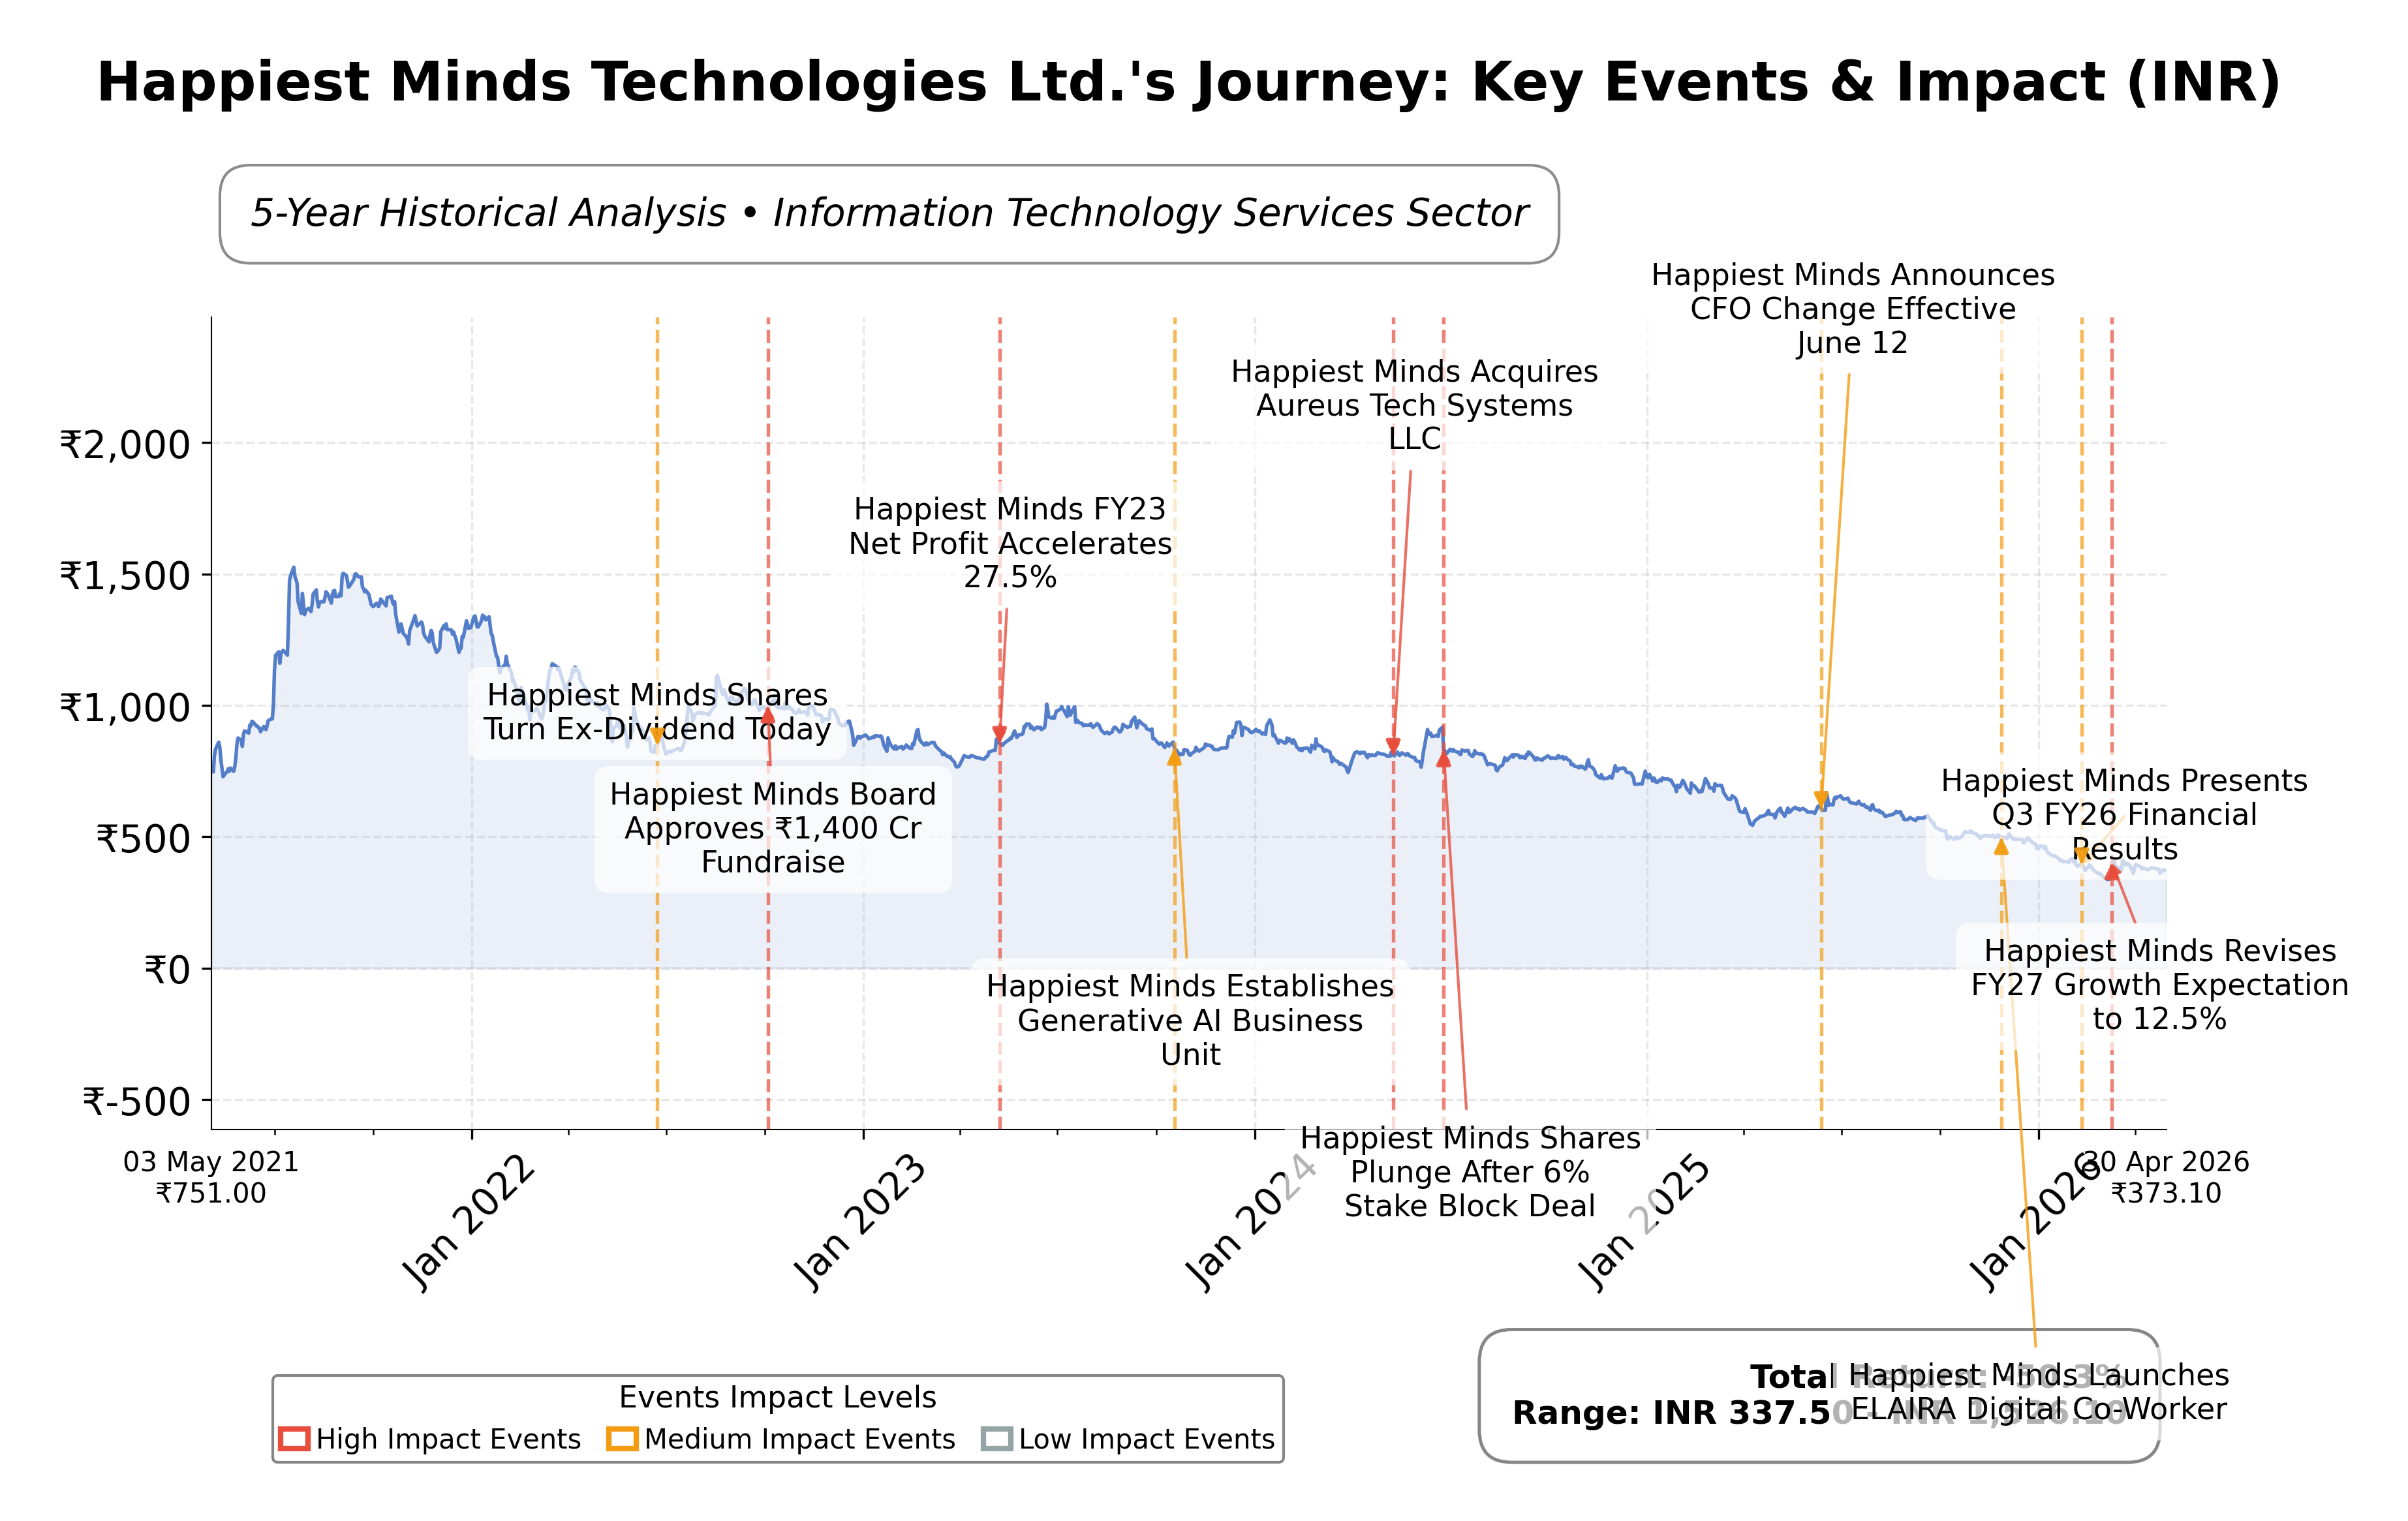
Stock Journey
Key Positives and Key Risks
Pros
- Revenue growth of 10.7% quarter-over-quarter indicates strong business momentum.
- Robust cash reserves of INR 16.5 billion provide financial flexibility.
- Low debt-to-equity ratio of 0.28 reflects conservative leverage and manageable risk.
Cons
- Trailing P/E ratio of 29.31 is higher than many peers, suggesting premium valuation.
- Recent institutional investor reductions signal cautious market sentiment.
- Negative PEG ratio (-1.58) raises concerns about earnings growth sustainability.
Disclosure: This information is for general awareness and does not constitute investment advice
Report Summary
Happiest Minds Technologies Ltd. is an Indian-based digital transformation and IT solutions provider listed on the NSE in the Technology sector. Founded in 2011 and headquartered in Bangalore, the company offers services including digital business, product engineering, infrastructure management, and security solutions. It serves diverse sectors such as education, banking, insurance, retail, and e-commerce, positioning itself as a partner in enabling organizations to leverage emerging technologies like AI, cloud computing, IoT, and big data analytics. The company emphasizes agile methodologies to deliver tailored digital solutions, reflecting its competitive stance in the Indian and global IT services industry.
Financially, Happiest Minds reported trailing twelve months (TTM) revenue of approximately INR 22.56 billion with a gross margin of 33.27%, operating margin of 14.47%, and net profit margin of 8.22%. The company’s return on equity (ROE) stands at 11.7%, and return on assets (ROA) at 5.3%, indicating moderate profitability and efficient asset utilization. Operating cash flow for the TTM period was INR 2.36 billion, with levered free cash flow at INR 1.85 billion, underscoring positive cash generation. The current ratio of 1.73 and a debt-to-equity ratio of 0.28 reflect a stable liquidity position and manageable leverage.
Valuation metrics show a trailing price-to-earnings (P/E) ratio of 29.31 and a forward P/E of 17.93, with a price-to-book (P/B) ratio of 3.32 and an enterprise value to EBITDA (EV/EBITDA) multiple of 11.79. The market capitalization is approximately INR 54.27 billion. The stock trades near INR 373.30, within a 52-week range of INR 674.85 to INR 330.20, representing a downside risk of about 81% from the 52-week high. These valuation levels suggest the stock is priced at a premium relative to some peers, reflecting expectations of growth but also potential valuation challenges.
Key strengths include strong cash reserves of over INR 16.5 billion, low debt levels, and consistent revenue growth of 10.7% quarter-over-quarter. Risks involve regulatory and competitive pressures in the IT services sector, recent institutional investor reductions in holdings, and a negative PEG ratio indicating earnings growth concerns. Recent strategic actions include maintaining a healthy dividend payout ratio of approximately 50%, and the company has seen mixed analyst sentiment with upgrades and downgrades reflecting evolving market views.
Technically, the stock is trading below its 200-day moving average of INR 476.16 and near the 50-day moving average of INR 377.56, with momentum indicators showing mixed signals. Recent news highlights both positive growth trends and valuation concerns. Overall, the data suggests a cautious stance with conditions warranting close monitoring of operational performance and market developments.
Company and Industry Overview
Company Basics
Price Performance
Company Size
Shareholding Pattern
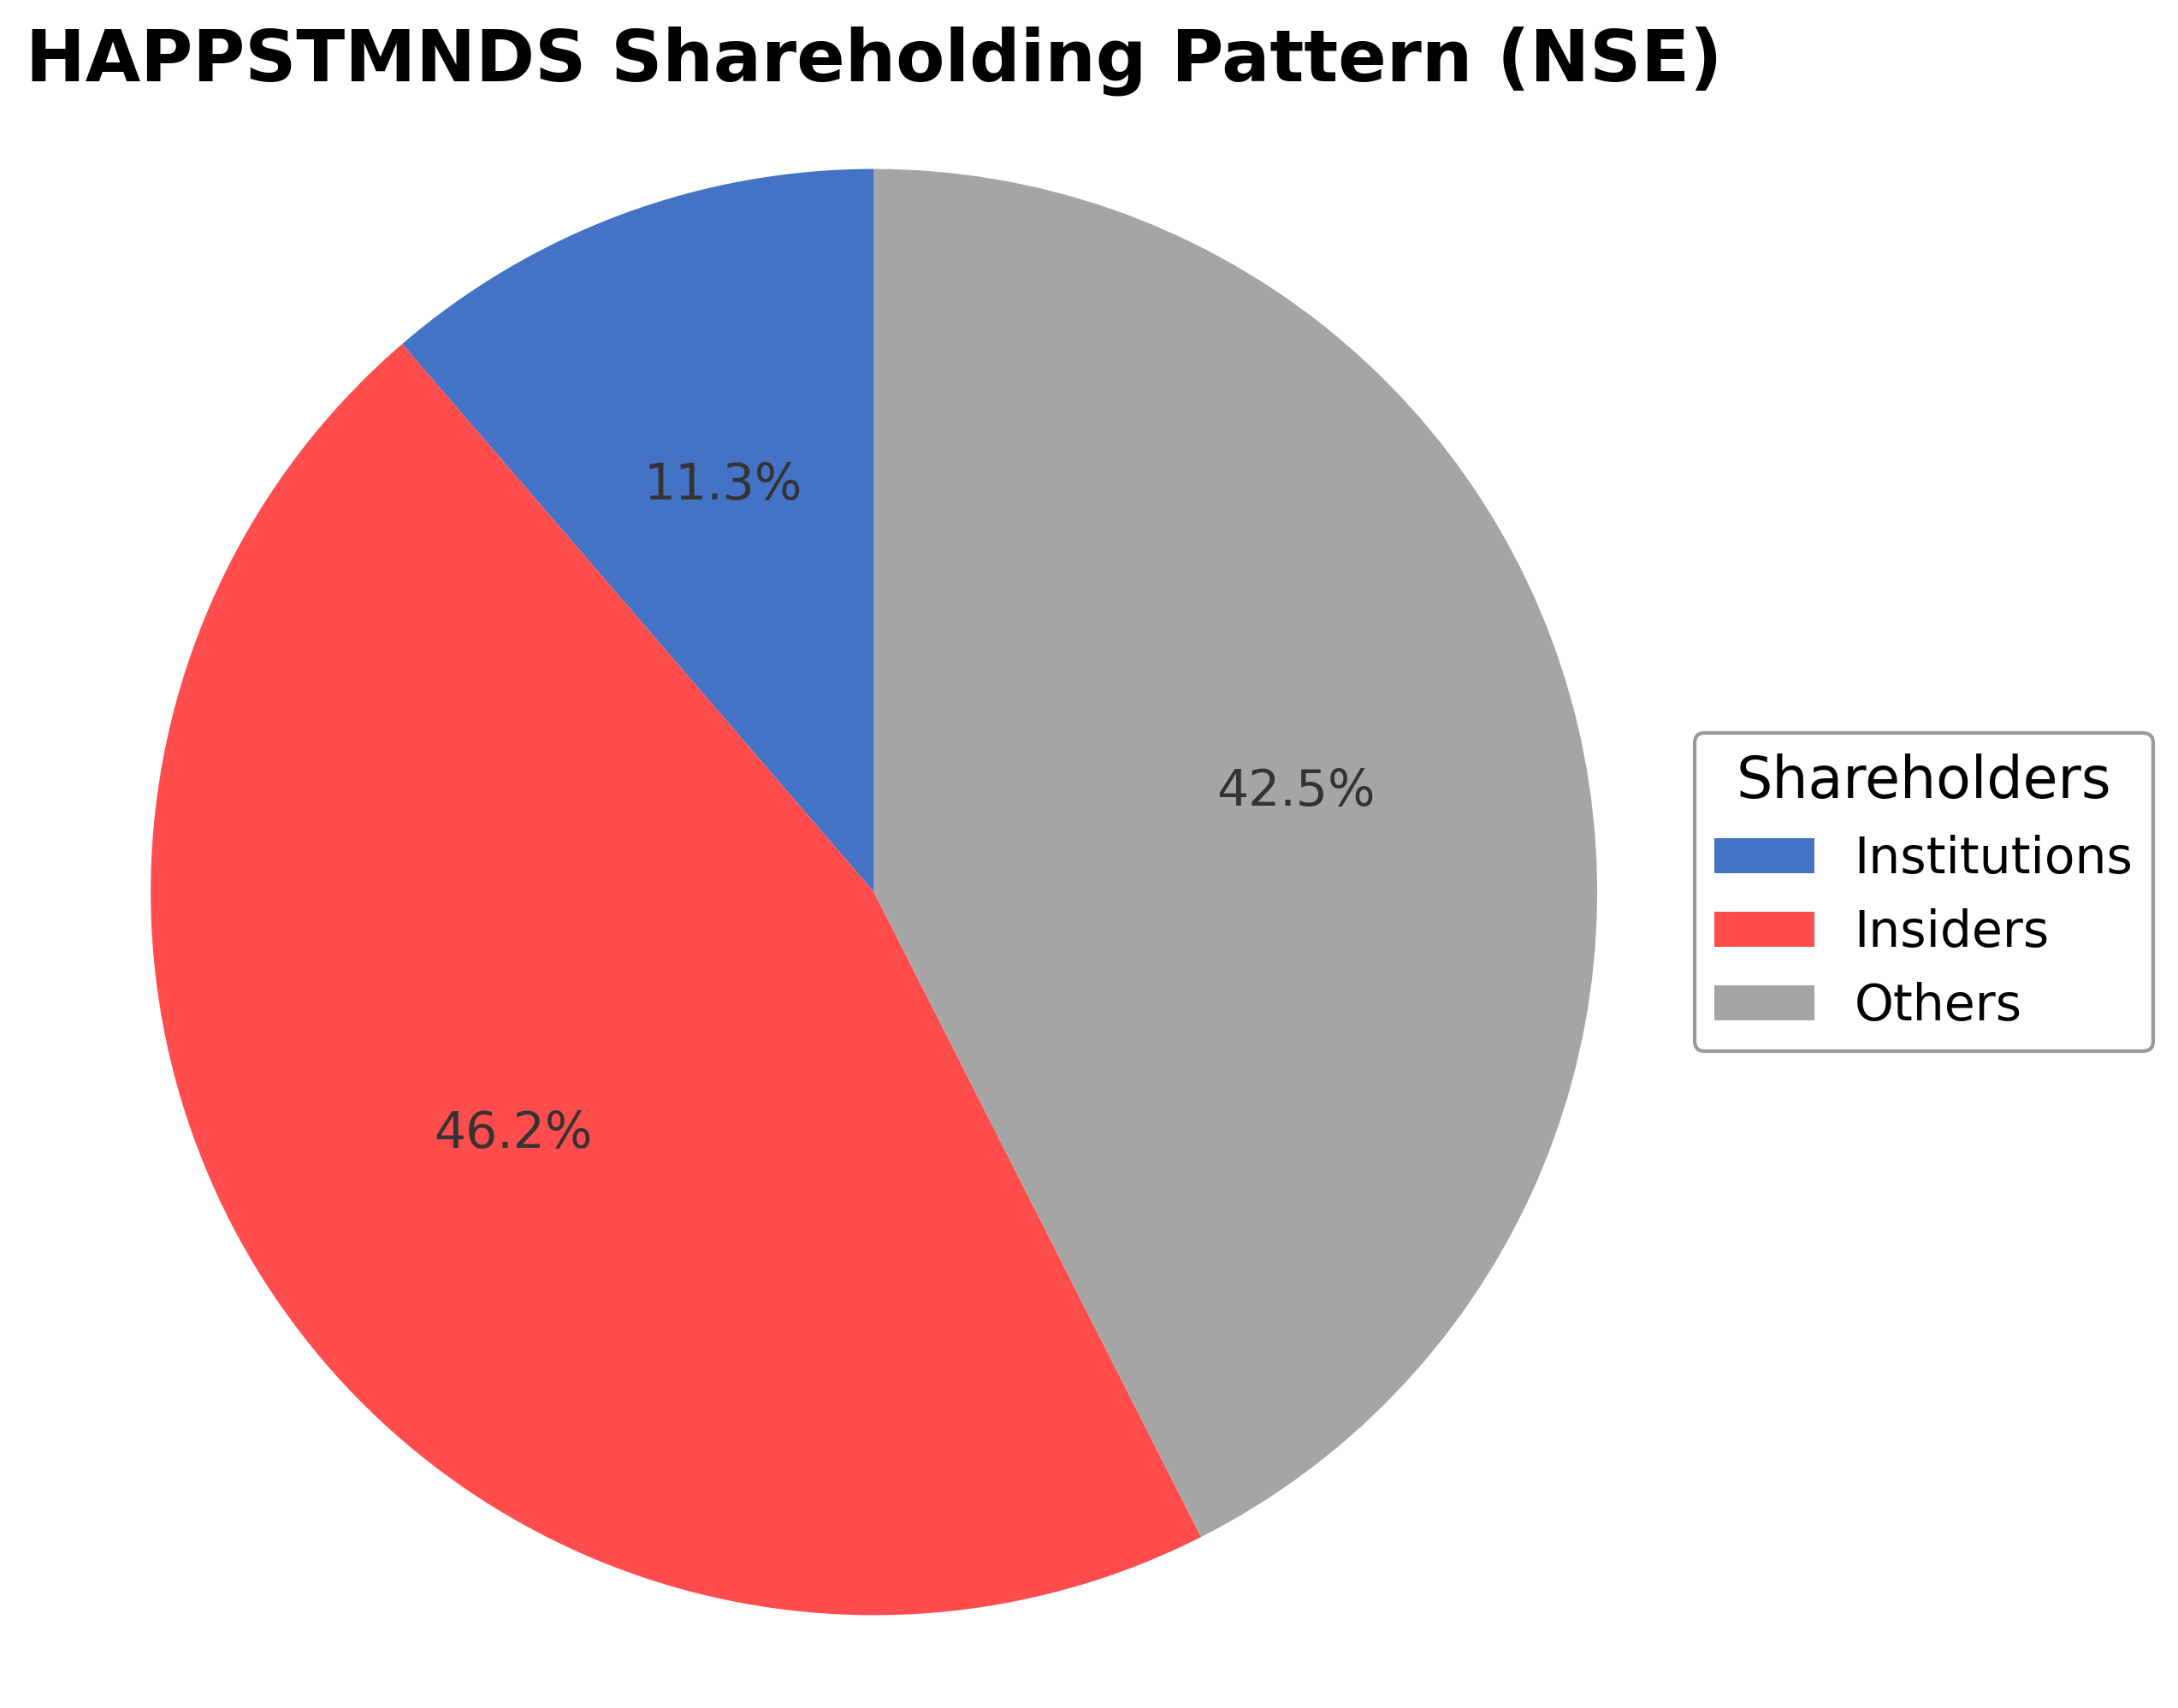
Happiest Minds Technologies Ltd. exhibits a shareholding structure dominated by insiders holding 46.16%, institutional investors at 11.31%, and public shareholders comprising 42.53%. Over the past 12 to 24 months, promoter holdings have decreased by approximately 9%, indicating some reduction in insider ownership. Institutional investors have trimmed their positions recently, with over 30 mutual fund schemes reducing holdings in March 2026, reflecting cautious sentiment. Major funds have shown distribution trends, which may influence governance dynamics and strategic decisions. This ownership pattern suggests a balanced market perception, with significant insider control tempered by active institutional participation, impacting future corporate actions and strategic direction.
Sector and Industry Analysis
The Indian IT services sector is a significant contributor to the national economy, with a market size exceeding $200 billion and a steady growth trajectory driven by digital transformation and increased adoption of cloud, AI, and automation technologies. Major players include Tata Consultancy Services, Infosys, Wipro, and HCL Technologies, which dominate the landscape with extensive global footprints and diversified service portfolios. The sector benefits from a large skilled workforce and strong export revenues, positioning India as a global IT hub.
Industry trends highlight a shift towards digital engineering, product development, and specialized services such as cybersecurity and data analytics, reflecting evolving client demands for innovation and agility. Competitive dynamics are shaped by the need for continuous upskilling, investment in emerging technologies, and strategic partnerships, creating high barriers to entry for new firms. Mid-sized companies like Happiest Minds Technologies focus on niche digital and product engineering services to differentiate themselves and capture growth in specialized segments.
The regulatory environment for the IT sector in India includes data protection laws, export-import policies, and labor regulations that influence operational practices and compliance costs. Recent emphasis on data privacy and cybersecurity regulations is prompting firms to enhance governance frameworks and invest in secure infrastructure. Government initiatives promoting digital India and IT exports provide a supportive backdrop, although evolving global trade policies and visa regulations remain key factors affecting the sector’s outlook.
Note: Analysis synthesized from industry research, market reports, and regulatory filings. Information is subject to change based on market conditions.
Financial Ratios Dashboard
Illustrative Scenario Analysis
DCF Assumptions:
Method: Two-Stage EPS-Priority Model
Financials
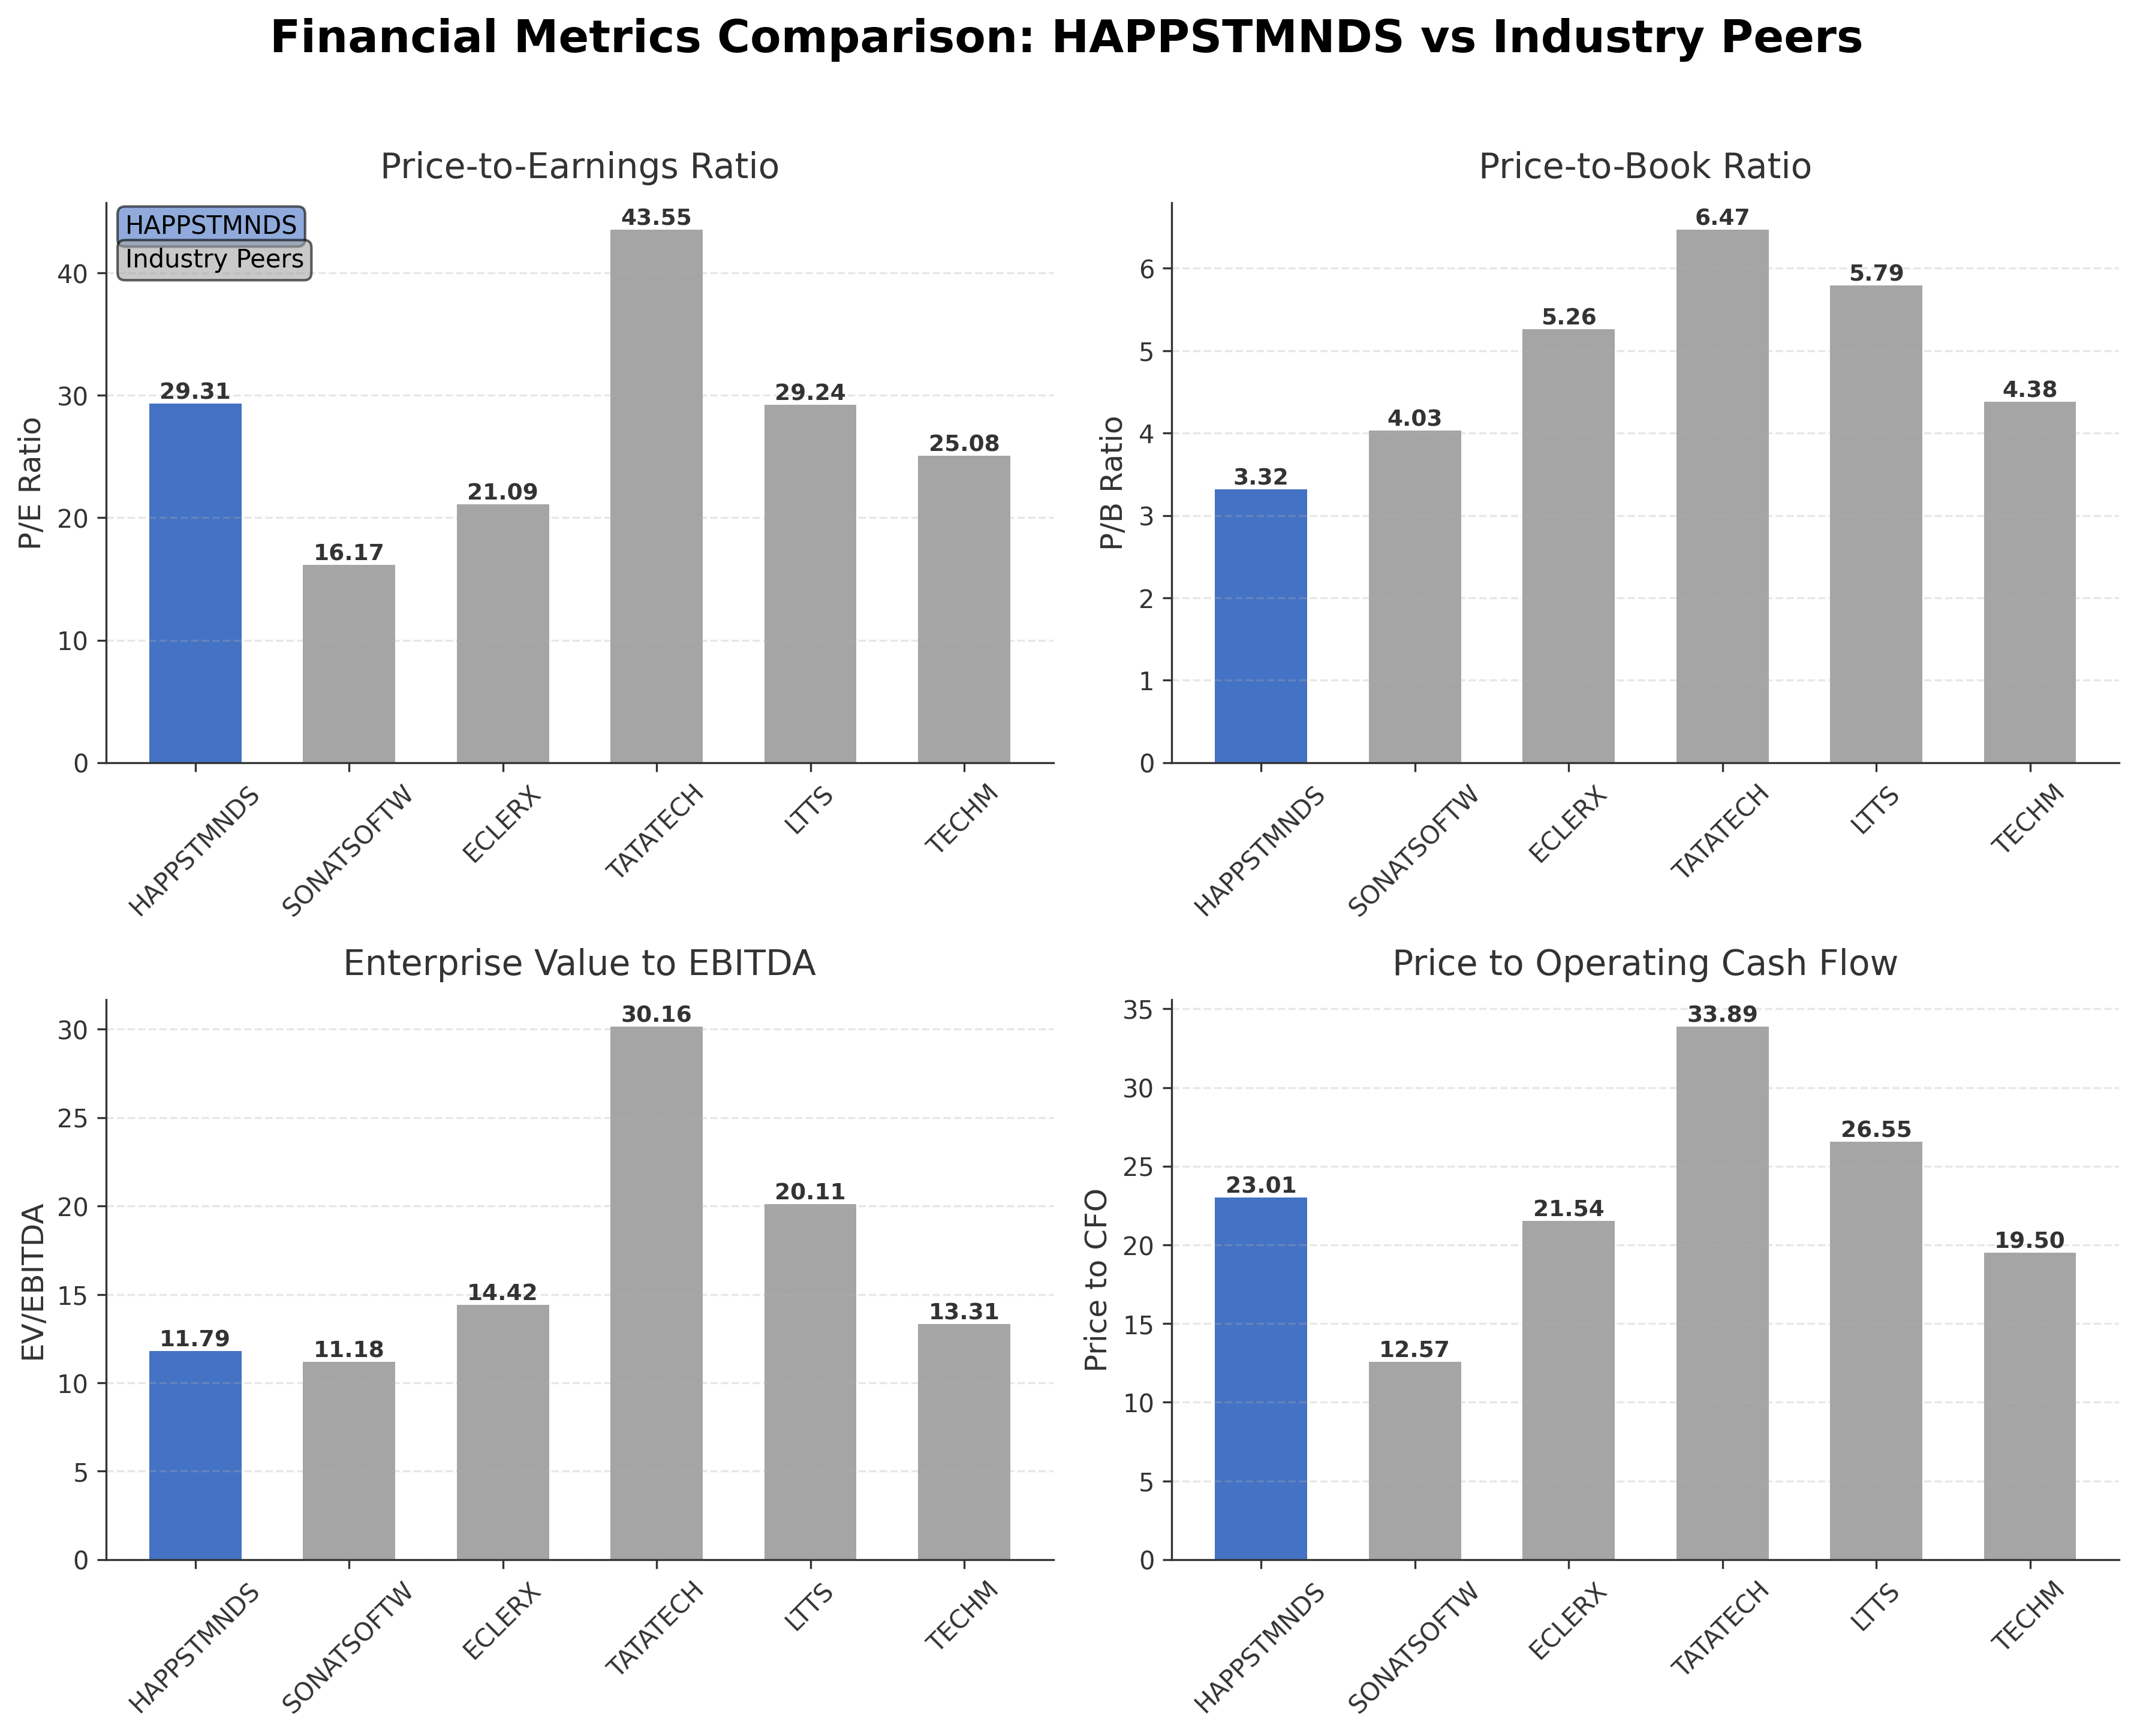
Peer Analysis
| Company Name | Market Cap | P/E Ratio | P/B Ratio | EV/EBITDA | Price to CFO |
|---|---|---|---|---|---|
| Happiest Minds Technologies Ltd. | ₹54.27B | 29.31 | 3.32 | 11.79 | 23.01 |
| Sonata Software Ltd. | ₹71.13B | 16.17 | 4.03 | 11.18 | 12.57 |
| Eclerx Services Ltd. | ₹136.80B | 21.09 | 5.26 | 14.42 | 21.54 |
| Tata Technologies Ltd. | ₹231.10B | 43.55 | 6.47 | 30.16 | 33.89 |
| L&T Technology Services Ltd. | ₹358.25B | 29.24 | 5.79 | 20.11 | 26.55 |
| Tech Mahindra Ltd. | ₹1.20T | 25.08 | 4.38 | 13.31 | 19.50 |
Comparison Analysis: Happiest Minds Technologies Ltd. trades at a higher P/E ratio of 29.31 compared to several peers such as Sonata Software (16.17) and Tech Mahindra (25.08), indicating a relatively premium valuation. Its P/B ratio of 3.32 is lower than many peers like Tata Technologies (6.47) and L&T Technology Services (5.79), suggesting a more moderate book value pricing. The EV/EBITDA multiple of 11.79 is competitive but below the higher multiples seen in Tata Technologies and LTTS. Return on equity at 11.7% is modest compared to peers who generally report ROEs between 17% and 25%. Price to CFO is elevated at 23.01, indicating higher cash flow valuation. Overall, Happiest Minds shows mixed valuation signals with premium earnings multiples but moderate book and cash flow metrics relative to its industry peers.
Financial Metrics Comparison with Peers
Financial Statements
Comprehensive financial data including income, balance sheet, and cash flow metrics
Income Statement
| fiscal_date | 2025-03-31 | 2024-03-31 | 2023-03-31 | 2022-03-31 | 2021-03-31 |
|---|---|---|---|---|---|
| Sales | 20.61B | 16.25B | 14.29B | 10.94B | 7.73B |
| Cost Of Goods | 13.01B | 9.67B | 7.72B | 5.83B | 4.24B |
| Gross Profit | 7.60B | 6.58B | 6.57B | 5.10B | 3.49B |
| Operating Expense Selling General And Administrative | 402.30M | 246.10M | 173.10M | 124.20M | 70.20M |
| Operating Expense Other Operating Expenses | 2.86B | 2.35B | 2.32B | 1.98B | 1.10B |
| Operating Income | 2.66B | 2.78B | 3.17B | 2.27B | 1.78B |
| Non Operating Interest Income | 897.50M | 795.80M | 261.00M | 63.60M | 83.80M |
| Non Operating Interest Expense | 994.90M | 422.70M | 218.60M | 83.00M | 62.10M |
| Pretax Income | 2.55B | 3.35B | 3.10B | 2.46B | 1.86B |
| Income Tax | 708.00M | 862.90M | 788.70M | 646.50M | 235.60M |
| Net Income | 1.85B | 2.48B | 2.31B | 1.81B | 1.62B |
| Eps Basic | 12.26 | 16.73 | 16.13 | 12.84 | 11.75 |
| Eps Diluted | 12.26 | 16.73 | 16.01 | 12.55 | 11.45 |
| Basic Shares Outstanding | 150.57M | 148.46M | 143.18M | 141.16M | 138.30M |
| Diluted Shares Outstanding | 150.57M | 148.46M | 143.18M | 141.16M | 138.30M |
| Ebit | 3.55B | 3.77B | 3.32B | 2.54B | 1.92B |
| Ebitda | 4.43B | 4.21B | 3.71B | 2.72B | 2.13B |
| Net Income Continuous Operations | 2.55B | 3.35B | 3.10B | 2.46B | 1.86B |
| Minority Interests | 0.00 | 0.00 | 0.00 | 0.00 | 0.00 |
| Preferred Stock Dividends | 0.00 | 0.00 | 0.00 | 0.00 | 0.00 |
Source: Financial statements and regulatory filings
Balance Sheet
| fiscal_date | 2025-03-31 | 2024-03-31 | 2023-03-31 | 2022-03-31 | 2021-03-31 |
|---|---|---|---|---|---|
| Cash And Cash Equivalents | 1.19B | 1.15B | 699.90M | 672.90M | 858.30M |
| Accounts Receivable | 3.58B | 2.54B | 2.13B | 1.67B | 1.22B |
| Total Assets | 33.59B | 22.48B | 16.41B | 11.25B | 9.22B |
| Total Liabilities | 17.84B | 7.68B | 8.02B | 4.59B | 3.76B |
| Long Term Debt | 3.85B | 1.50B | 1.60B | 584.30M | 488.40M |
| Shareholders Equity | 15.75B | 14.80B | 8.39B | 6.66B | 5.46B |
Source: Financial statements and regulatory filings
Cash Flow Statement
| fiscal_date | 2025-03-31 | 2024-03-31 | 2023-03-31 | 2022-03-31 | 2021-03-31 |
|---|---|---|---|---|---|
| Operating Activities Net Income | 2.55B | 3.35B | 3.10B | 2.46B | 1.86B |
| Operating Activities Stock Based Compensation | 0.00 | 4.70M | 12.00M | 30.00M | 29.70M |
| Operating Activities Other Non Cash Items | 218.80M | -513.30M | 13.90M | 64.50M | -49.10M |
| Operating Activities Accounts Receivable | -208.10M | -450.60M | -250.40M | -451.60M | -46.10M |
| Operating Activities Other Assets Liabilities | -207.30M | -26.70M | -498.30M | -252.80M | -232.60M |
| Operating Activities Operating Cash Flow | 2.36B | 2.36B | 2.38B | 1.85B | 1.56B |
| Investing Activities Capital Expenditures | -74.70M | -81.90M | -1.31B | -5.70M | -7.80M |
| Investing Activities Net Intangibles | -35.10M | -20.70M | -83.50M | -34.60M | -1.90M |
| Investing Activities Net Acquisitions | -7.36B | 0.00 | -1.10B | 0.00 | -602.50M |
| Investing Activities Purchase Of Investments | -3.75B | -5.54B | -5.78B | -4.38B | -6.93B |
| Investing Activities Sale Of Investments | 2.74B | 256.80M | 4.72B | 3.45B | 4.62B |
| Investing Activities Investing Cash Flow | -8.45B | -5.36B | -3.47B | -934.60M | -2.91B |
| Financing Activities Long Term Debt Issuance | 2.41B | 800.00M | 1.69B | 0.00 | 598.10M |
| Financing Activities Long Term Debt Payments | -533.40M | -260.80M | -260.90M | -205.30M | -125.60M |
| Financing Activities Short Term Debt Issuance | 5.33B | -143.90M | 461.70M | 401.20M | 421.30M |
| Financing Activities Common Stock Issuance | 18.50M | 4.87B | 14.70M | 17.10M | 1.06B |
| Financing Activities Common Dividends | -858.80M | -860.40M | -571.50M | -683.00M | N/A |
| Financing Activities Other Financing Charges | -140.10M | -165.90M | -203.40M | -186.10M | -30.00M |
| Financing Activities Financing Cash Flow | 6.22B | 4.24B | 1.13B | -656.10M | 1.93B |
| End Cash Position | 1.19B | 1.09B | -12.00M | 672.90M | 858.30M |
| Free Cash Flow | 2.25B | 2.02B | 677.60M | 1.64B | 1.42B |
| Investing Activities Other Investing Activity | N/A | N/A | N/A | N/A | 700.00K |
Source: Financial statements and regulatory filings
Technical Analysis
Key Insights
- The current trend shows the stock trading below its 200-day moving average of INR 476.16, indicating a longer-term bearish trend, while it is near the 50-day moving average of INR 377.56, suggesting short-term consolidation.
- Key support levels are observed near the 52-week low of INR 330.20, with resistance around the 52-week high of INR 674.85 and the 200-day moving average at INR 476.16.
- The stock price is currently slightly below the 50-day moving average and well below the 200-day moving average, indicating mixed momentum across different timeframes.
- Momentum indicators such as RSI and MACD show neutral to slightly bearish readings, reflecting subdued buying pressure and limited upward momentum.
- Multi-timeframe analysis reveals a bearish trend on the monthly chart, consolidation on the weekly chart, and mixed signals on the daily chart.
- Potential market scenarios include continued range-bound trading between support and resistance levels or a possible test of lower support if negative momentum persists.
Trending News
1. Headline: Happiest Minds Technologies Limited Share Price & Analysis | MarketNetra
Summary: Happiest Minds Technologies Limited (HAPPSTMNDS) share price ₹372, fundamentals and daily price analysis. NSE-listed stock updated every trading day.
Sentiment: neutral
2. Headline: Happiest Minds Technologies Valuation Shifts Signal Price Attractiveness Challenges
Summary: Happiest Minds Technologies Ltd has witnessed a notable shift in its valuation parameters, moving from a fair to an expensive rating, reflecting evolving investor perceptions amid a challenging market backdrop. This article analyses the recent changes in key valuation metrics such as the price-to-earnings (P/E) and price-to-book value (P/BV) ratios, comparing them with historical averages and peer benchmarks to assess the stock...
Sentiment: positive
3. Headline: Happiest Minds Technologies Ltd is Rated Hold
Summary: Happiest Minds Technologies Ltd is rated 'Hold' by MarketsMOJO, with this rating last updated on 06 April 2026. However, the analysis and financial metrics discussed below reflect the stock's current position as of 18 April 2026, providing investors with an up-to-date view of the company’s ...
Sentiment: neutral
Summary: MF schemes holding reduced to 13 in March 2026 from 41 in February 2026; MF market value stood at Rs 385 crore.CY26 performance: -17% Happiest Minds Technologies
Sentiment: negative
5. Headline: Happiest Minds Technologies Ltd. Share Price, Stock Price, Live Sensex, Bids Offers, Buy Sell and More - Goodreturns
Summary: Get Happiest Minds Technologies Ltd. Share Price, Stock Price of Happiest Minds Technologies Ltd., Happiest Minds Technologies Ltd. Live Prices on BSE and NSE, historical charts, buy and sell, performance and reports.
Sentiment: neutral
Recent Updates
News Summary
As of April 30, 2026. Happiest Minds Technologies Ltd continues to demonstrate steady growth in its core IT services business, with Q4 FY26 revenues reaching INR 545 crores, reflecting a 31% increase driven by strong deal closures. The company maintains a healthy dividend payout ratio of approximately 50%, supporting shareholder returns. Institutional investors have recently reduced holdings, with mutual fund schemes trimming positions significantly in March 2026. Despite valuation challenges reflected in a higher P/E ratio and a negative PEG ratio, the company’s cash reserves remain robust at over INR 16.5 billion, and debt levels are manageable. Operationally, the firm is focused on digital transformation, product engineering, and infrastructure services, with a strategic vision targeting $1 billion in revenues by 2031.
News Sentiment
The overall sentiment from recent updates is mixed to neutral with positive undertones from strong revenue growth and strategic initiatives. Positive news includes above-industry growth rates and stable dividend policies, while negative sentiment arises from institutional selling and valuation concerns. The downgrade by some analysts contrasts with technical upgrades, reflecting cautious market views. The balance of these factors suggests a watchful stance with attention to operational execution and market dynamics.
Source List
- https://www.screener.in/company/HAPPSTMNDS/consolidated/
- https://www.alphaspread.com/security/nse/happstmnds/investor-relations
- https://www.happiestminds.com/press-releases/happiest-minds-accelerates-to-31-growth-in-q4-reports-revenues-of-%E2%82%B9545-crores-driven-by-strong-deal-closures/
Analytical Overview
Analysis Summary
Happiest Minds Technologies’ valuation metrics show a trailing P/E of 29.31 and forward P/E of 17.93, which are above the industry average P/E of approximately 29.31 but higher than many peers, indicating a relatively premium valuation. Revenue growth is solid at 10.7% quarter-over-quarter, supported by positive cash flow trends with operating cash flow of INR 2.36 billion and free cash flow of INR 1.85 billion, demonstrating operational strength. The company maintains a healthy financial position with a debt-to-equity ratio of 0.28 and a current ratio of 1.73, reflecting manageable leverage and liquidity. Sector-specific challenges include competitive pressures and evolving technology demands, while opportunities arise from digital transformation trends and expanding service offerings. Considering India-specific factors, regulatory environment stability and growing IT spending support the company’s growth prospects.
Overall Business and Market Assessment
Supporting Factors: consistent revenue growth, strong cash flow generation, and a stable financial position with low leverage
Risk Factors: valuation premium relative to peers, recent institutional selling, and potential margin pressures
SWOT Analysis
Strengths
- Strong revenue growth with a 10.7% quarterly increase.
- Robust cash reserves exceeding INR 16.5 billion.
- Low debt-to-equity ratio of 0.28 indicating prudent leverage management.
- Diverse service offerings across digital transformation and IT solutions.
Weaknesses
- Valuation metrics such as P/E ratio are higher than many industry peers.
- Negative PEG ratio suggests concerns about earnings growth sustainability.
- Recent reduction in promoter and institutional holdings.
- Operating margin at 14.47% is moderate compared to some competitors.
Opportunities
- Growing demand for digital transformation services in India and globally.
- Expansion into emerging technologies like AI, cloud, and IoT.
- Potential to increase market share through strategic partnerships.
- Vision to achieve $1 billion revenue by 2031.
Threats
- Intense competition within the IT services sector.
- Regulatory changes impacting technology and data management.
- Market volatility affecting investor sentiment and stock valuation.
- Potential macroeconomic headwinds slowing IT spending.
Company Description
Happiest Minds Technologies Ltd. is a digital transformation and IT solutions provider, focusing on enhancing the digital experience for businesses worldwide. Founded in 2011, this Indian-based company offers an array of services including digital business, product engineering, infrastructure management, and security solutions. Its primary function is to enable organizations to harness emerging technologies such as artificial intelligence, cloud computing, Internet of Things (IoT), and big data analytics to improve operational efficiencies and innovate business processes. Happiest Minds serves a diverse range of sectors, including education, banking, insurance, retail, and e-commerce, aiding them in navigating the digital shift. Its emphasis on "Digital Born Agile" methodologies ensures rapid deployment of solutions tailored to modern enterprise needs. As a significant player within the tech industry, Happiest Minds Technologies showcases the rising prowess of IT services firms from India, contributing to global technology advancements. The company is renowned for its customer-centric approach and robust digital solutions, which play a critical role in maintaining its competitive edge in an ever-evolving digital landscape.