


Gujarat State Petronet Ltd (GSPL)
Stock Analysis Report
Stock Journey
Key Positives and Key Risks
Pros
- Strong cash position of INR 48.2 billion against low total debt of INR 1.4 billion supports financial stability.
- Valuation metrics such as trailing P/E of 14.85 and EV/EBITDA of 5.84 are moderate and in line with industry averages, indicating reasonable pricing.
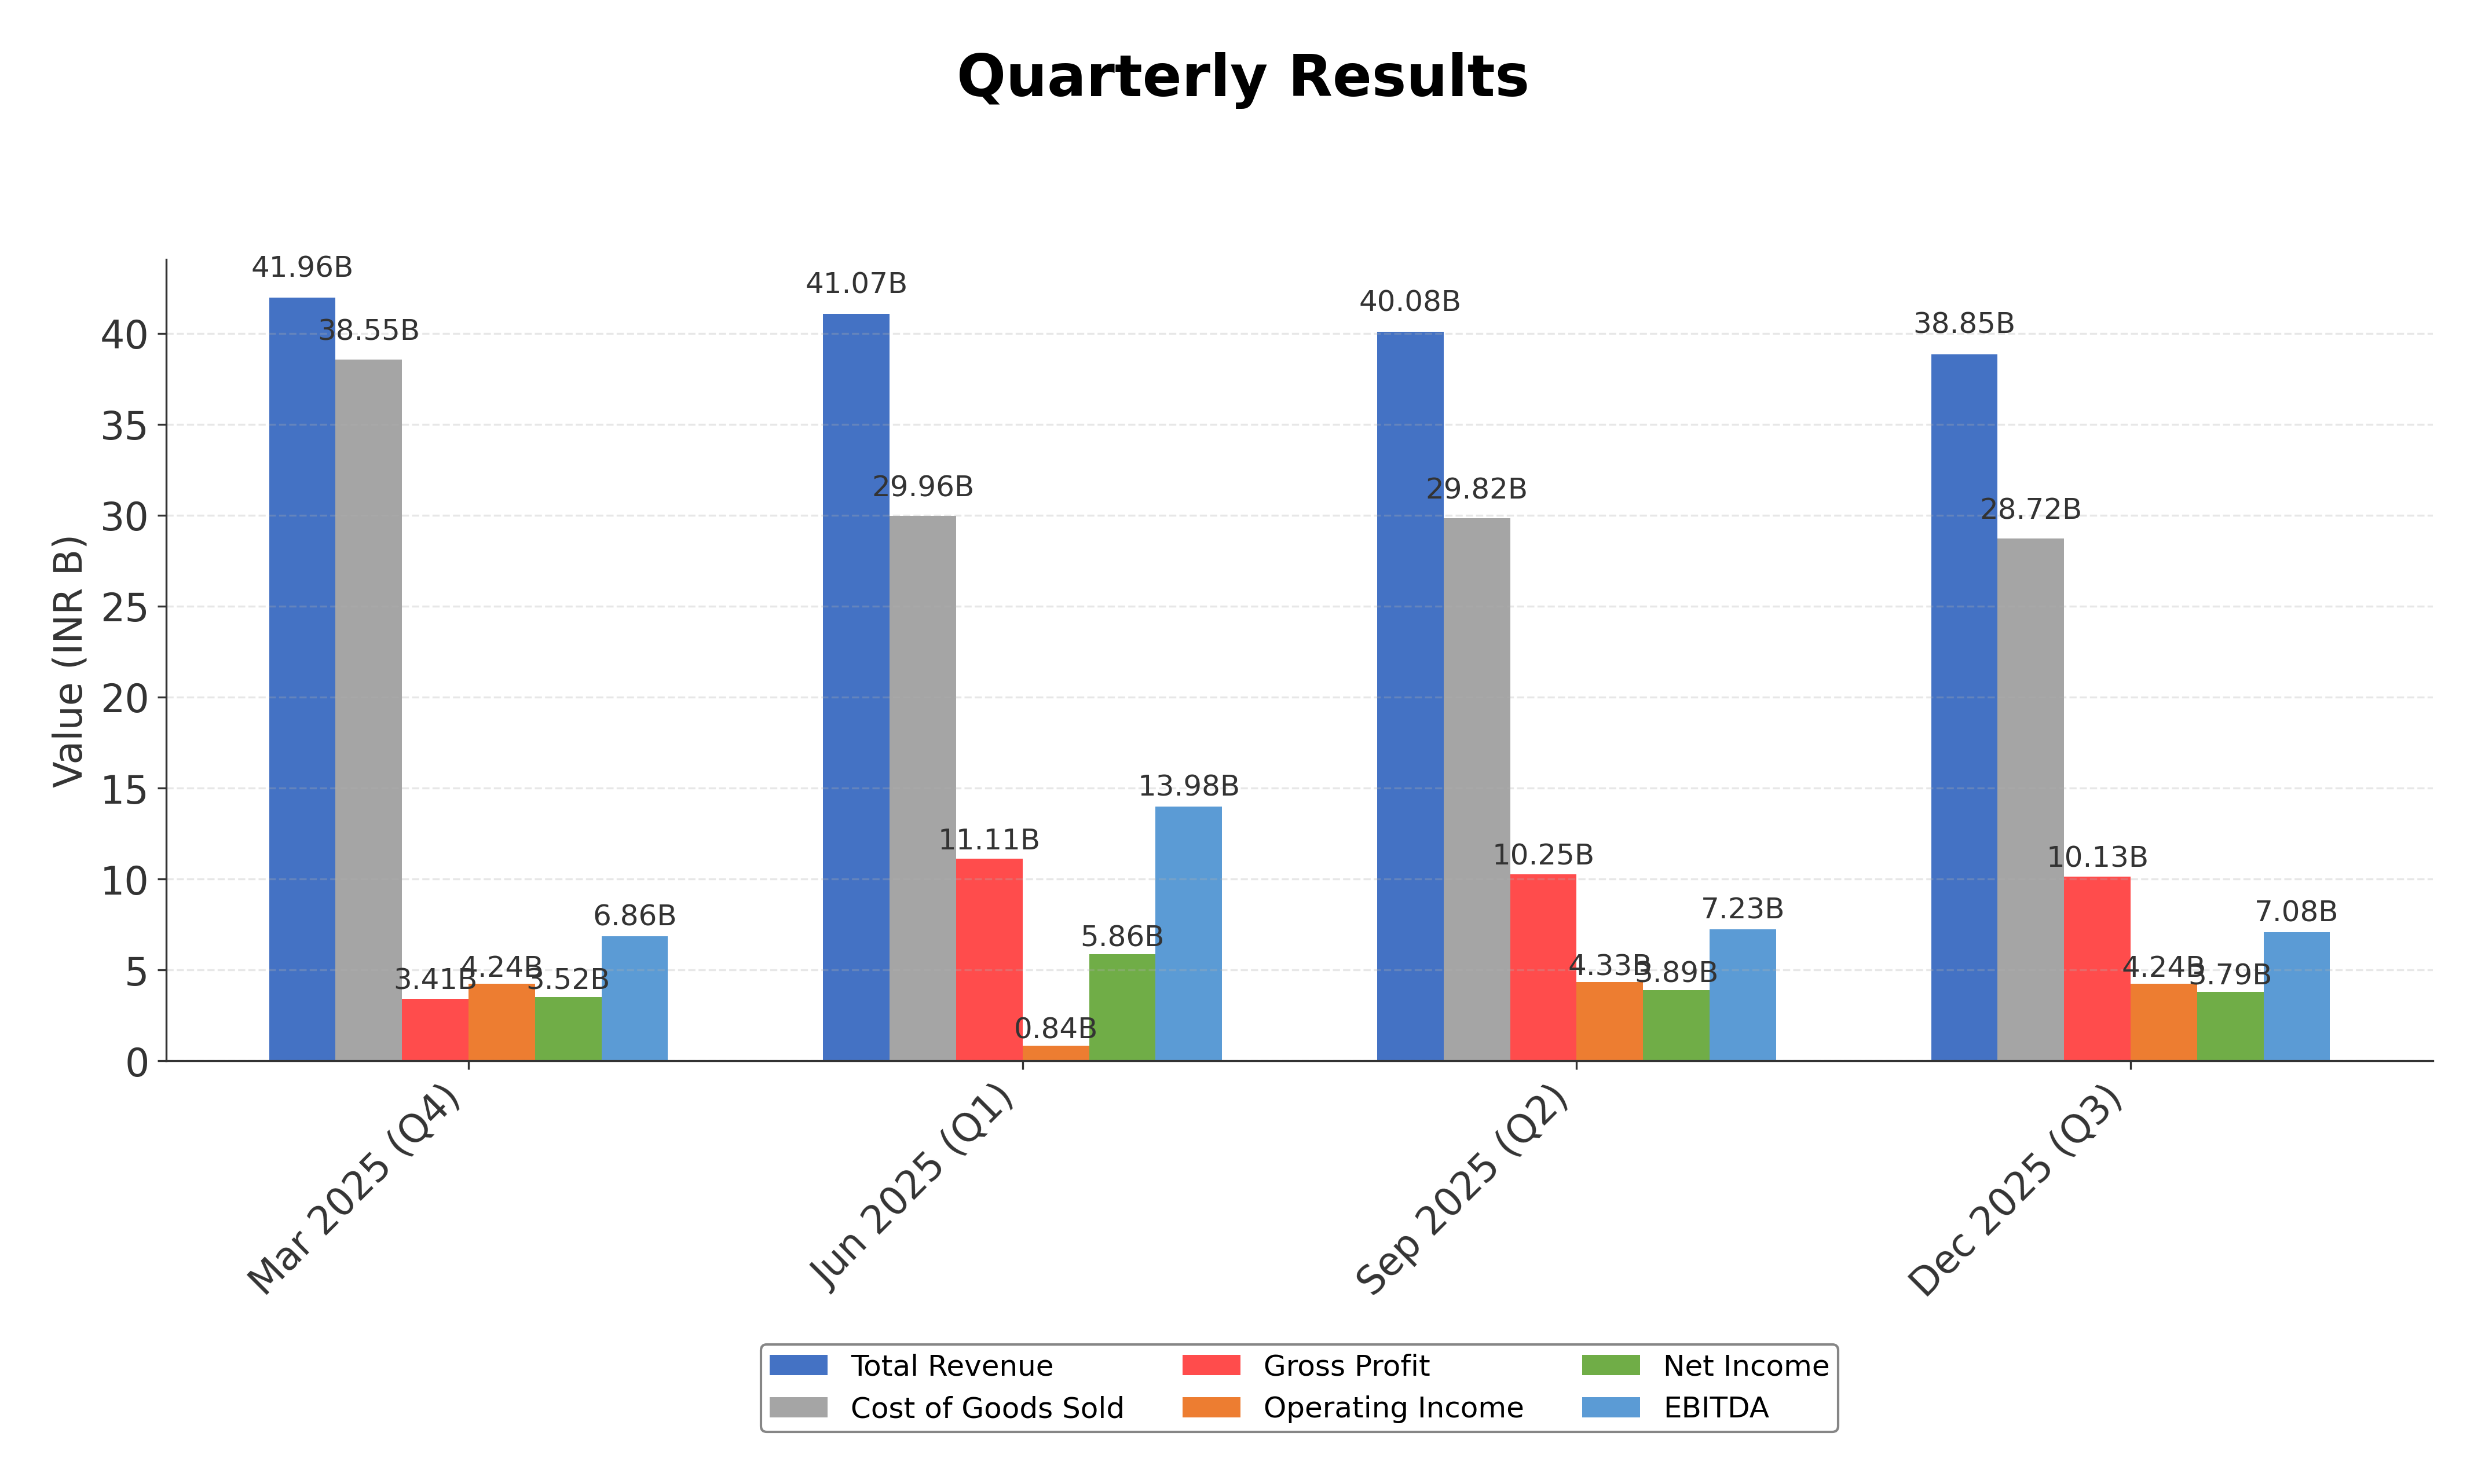
- Positive quarterly earnings growth of 9.7% year-over-year reflects improving profitability despite recent revenue decline.
Cons
- Recent quarterly revenue declined by 10.9%, signaling potential near-term growth challenges.
- Return on equity of 7.14% is modest compared to peers, indicating limited profitability efficiency.
- Stock price trading below the 200-day moving average of INR 294 suggests medium-term technical weakness.
Disclosure: This information is for general awareness and does not constitute investment advice
Report Summary
Gujarat State Petronet Ltd. (GSPL) operates as a leading natural gas transmission company in India, primarily engaged in developing and managing an extensive network of high-pressure natural gas pipelines. Listed on the NSE under the Utilities sector, GSPL plays a critical role in facilitating the distribution of natural gas across Gujarat and adjoining regions, serving power, residential, industrial, and commercial sectors. The company’s strategic positioning in the regulated gas industry underscores its importance in India's energy infrastructure and transition towards cleaner fuel sources.
Financially, GSPL reported trailing twelve months (TTM) revenue of approximately INR 162.9 billion with a gross margin of 26.07%, an operating margin of 10.92%, and a net profit margin of 6.46%. The return on equity (ROE) stands at 7.14%, and return on assets (ROA) at 5.34%, reflecting moderate profitability and asset efficiency. The company generated operating cash flow of INR 24.31 billion and levered free cash flow of INR 11.11 billion, indicating solid cash generation capabilities relative to its net income of INR 10.52 billion.
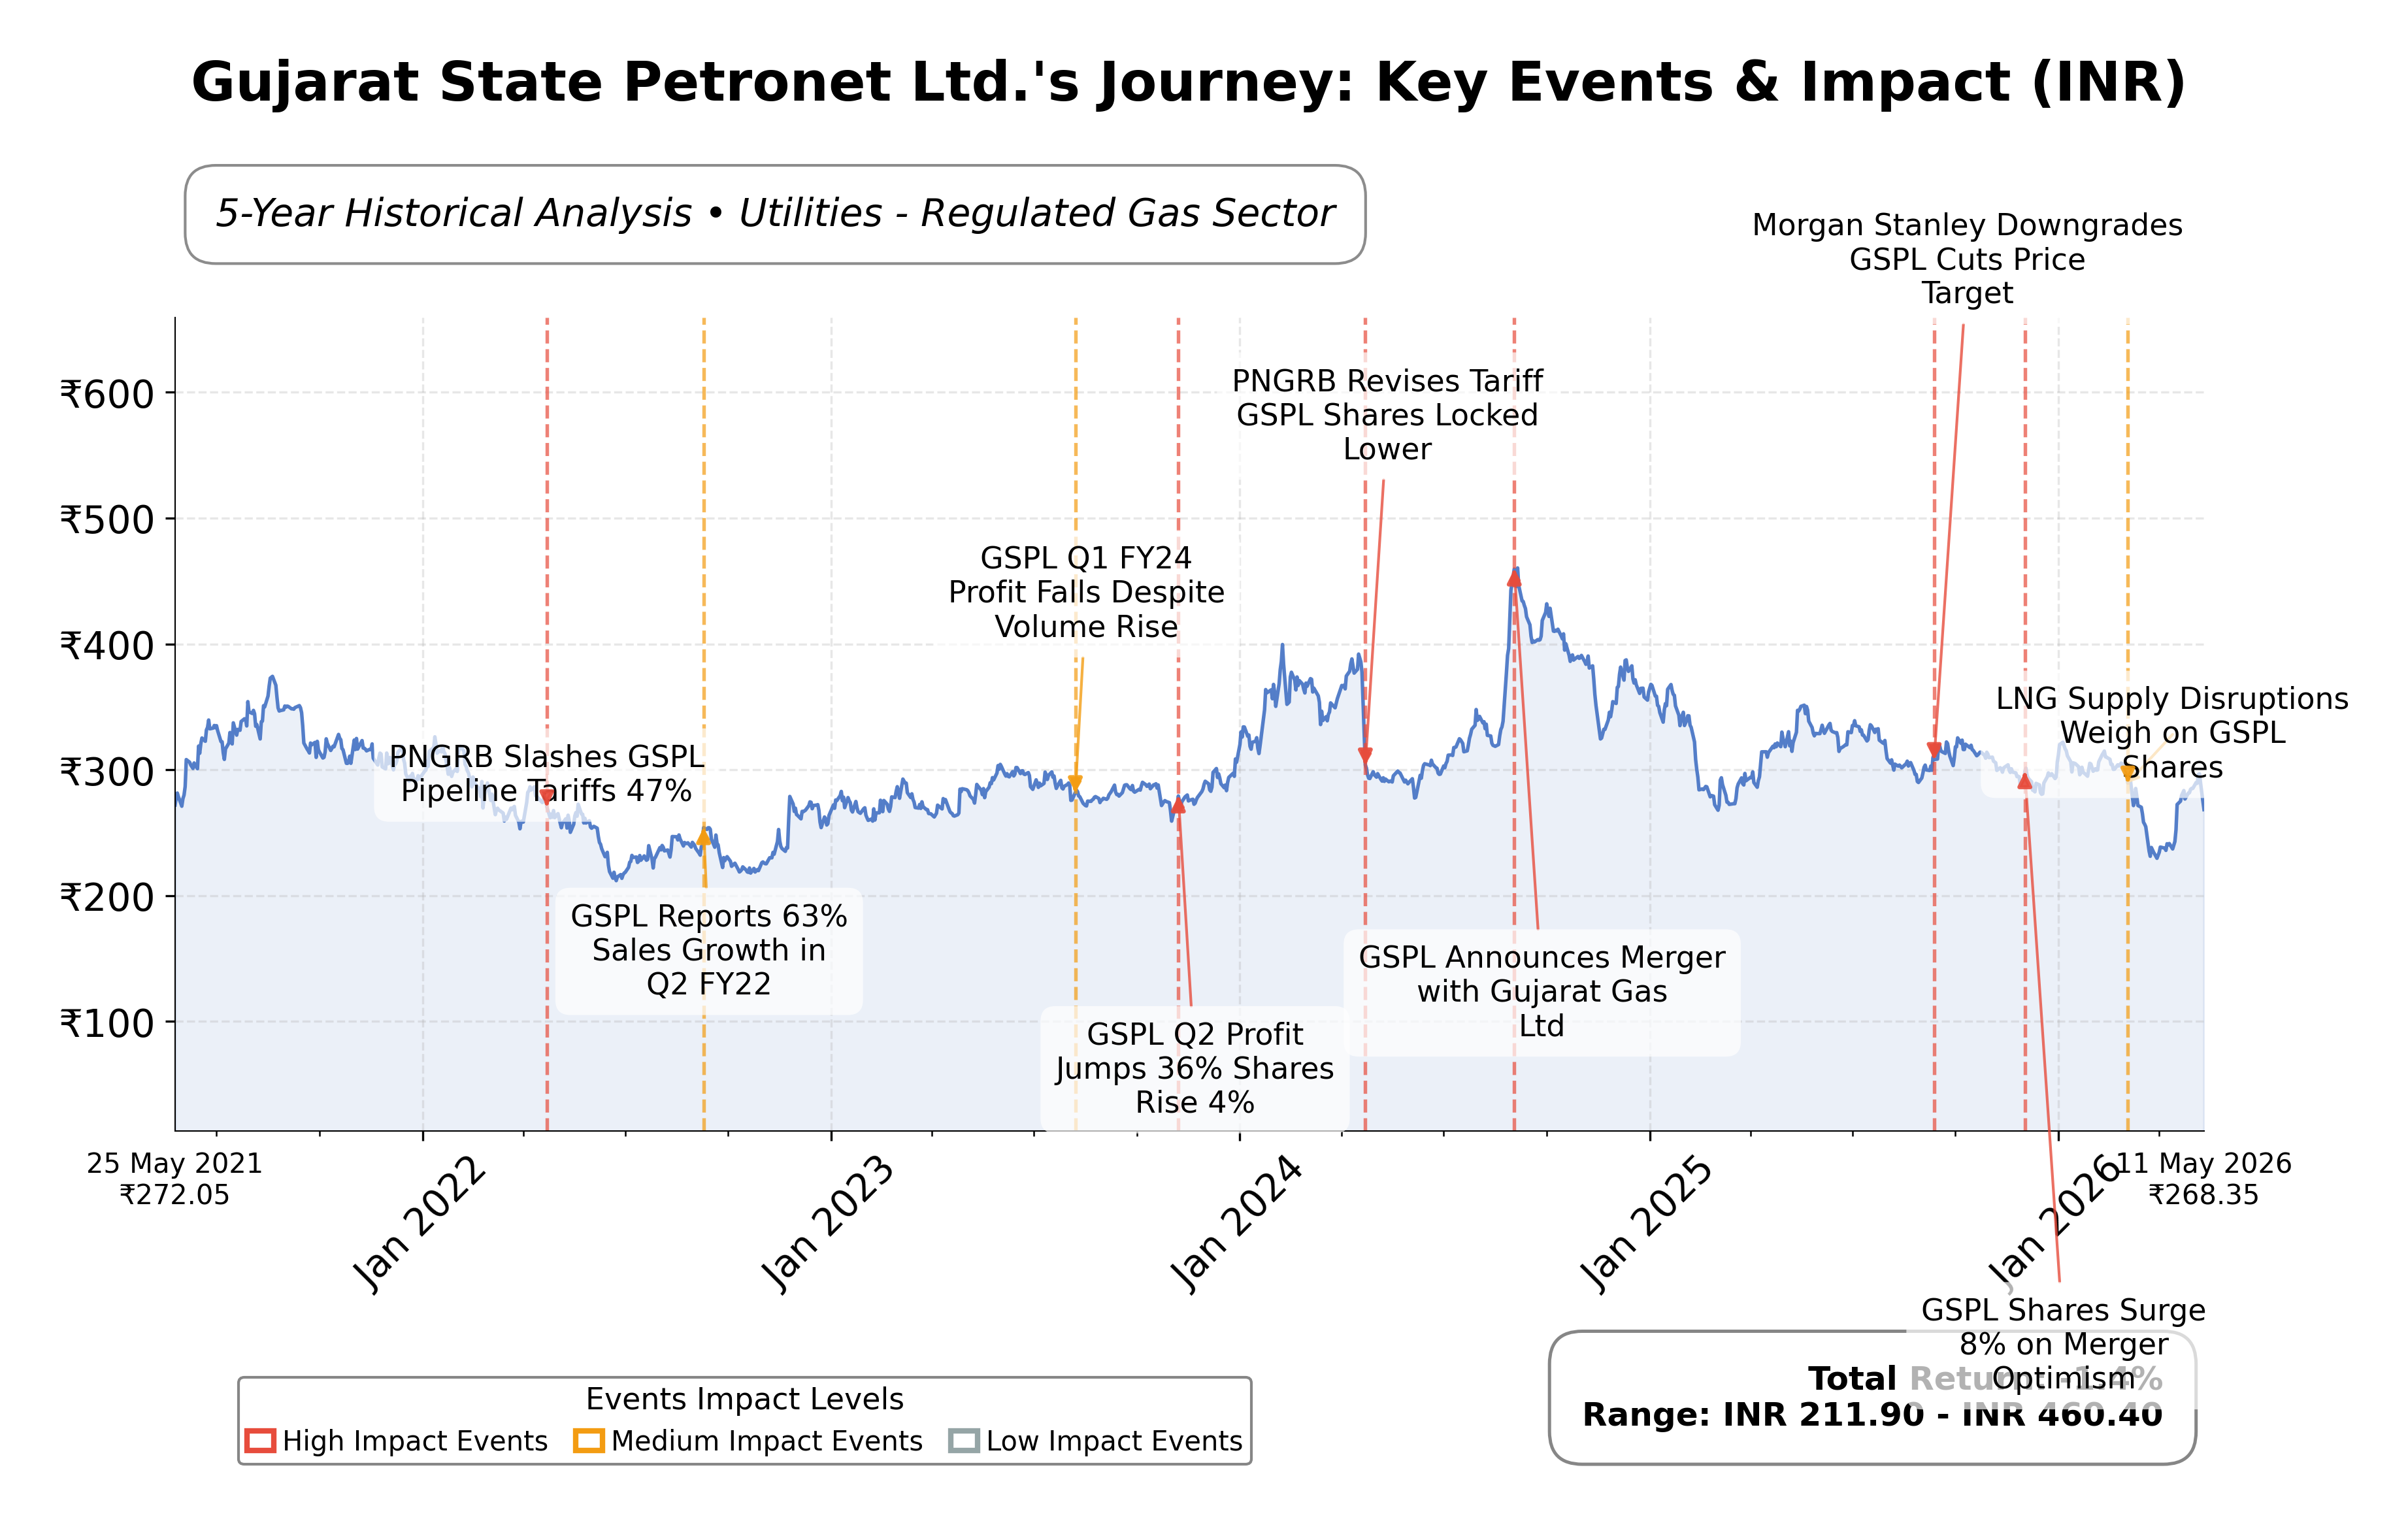
Valuation metrics show GSPL trading at a trailing price-to-earnings (P/E) ratio of 14.85 and a forward P/E of 13.30, with a price-to-book (P/B) ratio of 1.31 and an enterprise value to EBITDA (EV/EBITDA) multiple of 5.84. The market capitalization is approximately INR 151.4 billion. The stock’s 52-week price range is INR 226.35 to INR 348, with the current price of INR 268.35 positioned closer to the lower end of this range, suggesting some valuation discount relative to its recent highs.
Key strengths include GSPL’s strong cash position of INR 48.2 billion against a low total debt of INR 1.4 billion, resulting in a debt-to-equity ratio of 0.88 and a current ratio of 1.50, which supports financial stability. The company benefits from market leadership in Gujarat’s gas transmission segment and recent strategic restructuring involving a merger and demerger within the GSPC Group to streamline operations. Risks include regulatory changes in the energy sector, competitive pressures from other gas utilities, and recent quarterly revenue decline of 10.9%, which may impact near-term growth.
Technically, GSPL’s price is trading below its 200-day moving average of INR 294 but above the 50-day average of INR 263.8, with momentum indicators showing mixed signals. Recent news highlights institutional buying interest, notably SBI Mutual Fund’s 5.29% stake acquisition, and corporate restructuring events. Overall, the data suggests a cautious stance with potential for accumulation as the company navigates sector dynamics and integration efforts.
Company and Industry Overview
Company Basics
Price Performance
Company Size
Shareholding Pattern
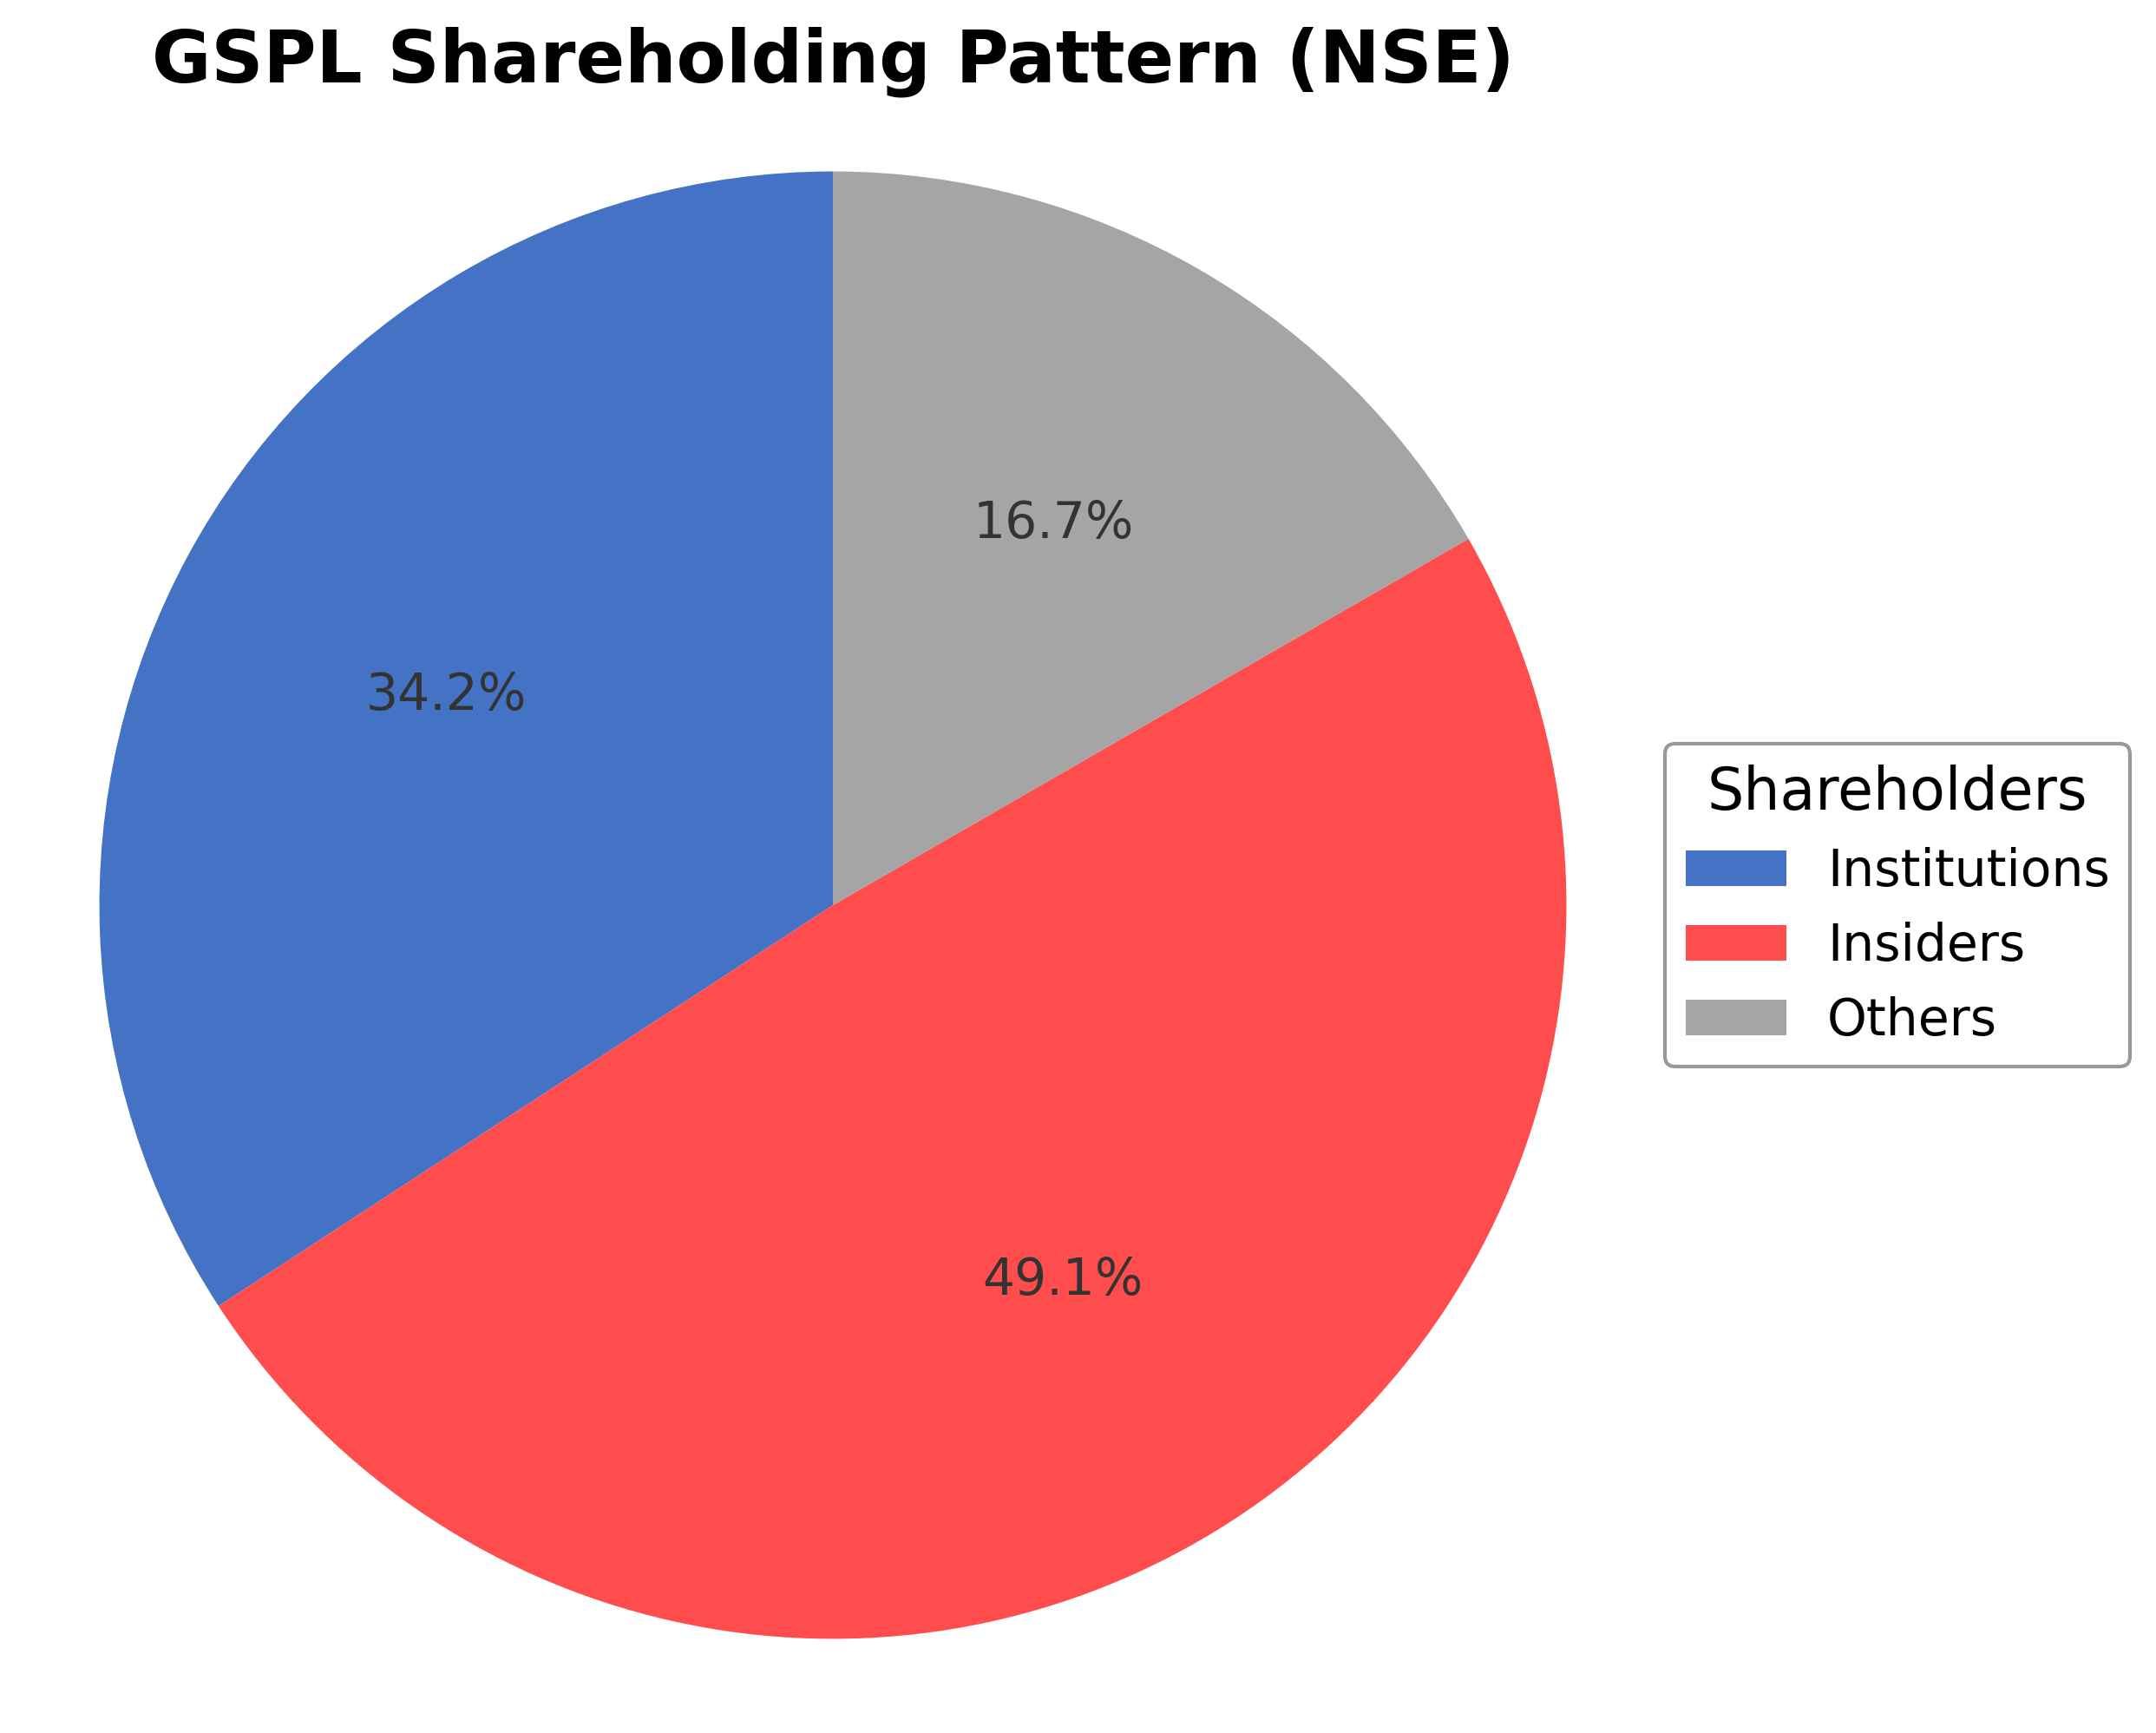
The ownership structure of Gujarat State Petronet Ltd. comprises insiders holding approximately 49.12% of shares, institutional investors owning about 34.20%, and the remaining 16.68% held by public and other shareholders. Over the past 12 to 24 months, there has been notable institutional accumulation, exemplified by SBI Mutual Fund's recent acquisition of a 5.29% stake, indicating growing confidence among major asset managers. Promoter holdings remain significant, reflecting stable governance and strategic control. This shareholding pattern suggests a balanced market sentiment with strong institutional backing, which may positively influence corporate governance and strategic initiatives in the regulated gas sector.
Sector and Industry Analysis
The gas distribution sector in India has witnessed steady growth driven by increasing energy demand and government initiatives to expand natural gas infrastructure. The market size is expanding as urbanization and industrialization boost consumption, with transmission volumes rising consistently. Key players include state-owned entities like Gujarat State Petronet Ltd (GSPL), along with private and public sector companies operating regional gas pipelines and city gas distribution networks.
Industry trends highlight a shift towards cleaner energy sources, with natural gas gaining preference over coal and oil due to environmental concerns. Technological advancements in pipeline infrastructure and digital monitoring are enhancing operational efficiency. Barriers to entry remain high given the capital-intensive nature of pipeline projects, regulatory approvals, and the need for long-term contracts, which favor established players with strong government linkages and regional dominance.
The regulatory environment is shaped by policies from the Petroleum and Natural Gas Regulatory Board (PNGRB) and the Ministry of Petroleum and Natural Gas, focusing on tariff frameworks, open access, and pipeline capacity allocation. Recent reforms aim to increase transparency and competition while promoting the use of natural gas in various sectors. These regulations impact investment decisions and operational strategies, encouraging expansion of pipeline networks and integration with city gas distribution systems.
Note: Analysis synthesized from industry research, market reports, and regulatory filings. Information is subject to change based on market conditions.
Financial Ratios Dashboard
Illustrative Scenario Analysis
DCF Assumptions:
Method: Two-Stage EPS-Priority Model
Financials
Peer Analysis
| Company Name | Market Cap | P/E Ratio | P/B Ratio | EV/EBITDA | Price to CFO |
|---|---|---|---|---|---|
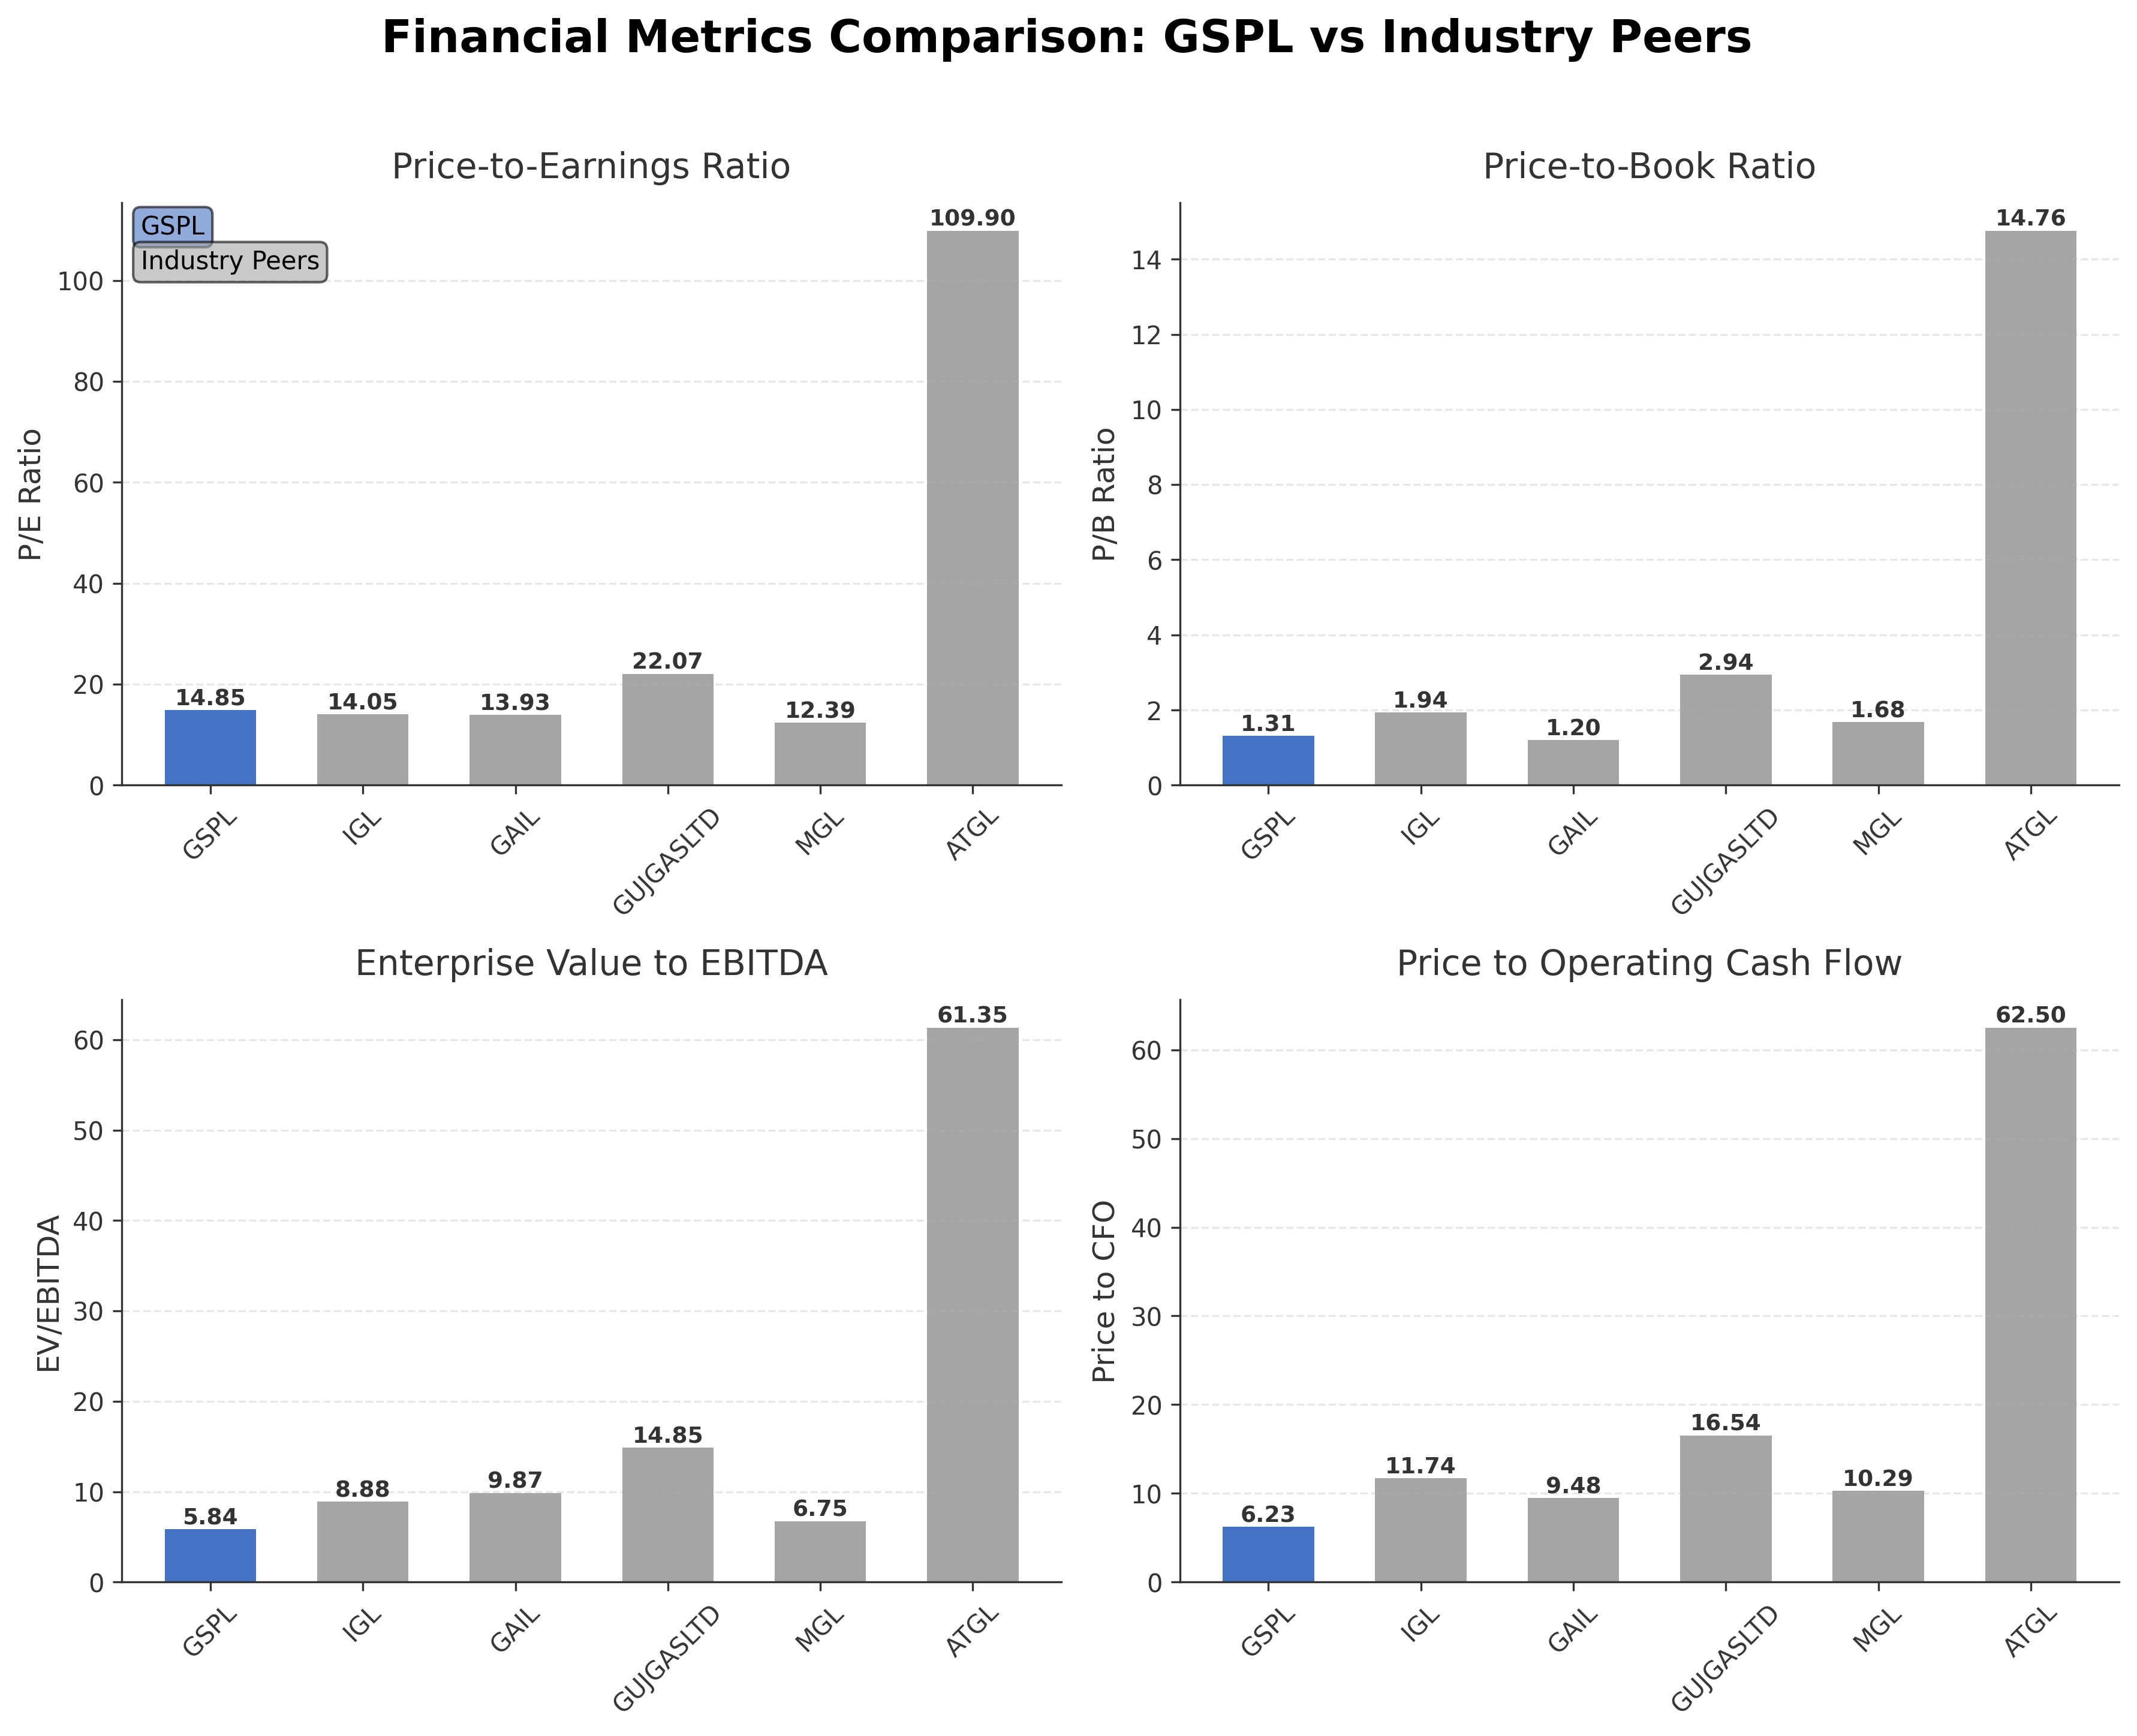
| Gujarat State Petronet Ltd. | ₹151.41B | 14.85 | 1.31 | 5.84 | 6.23 |
| Indraprastha Gas Ltd. | ₹216.87B | 14.05 | 1.94 | 8.88 | 11.74 |
| GAIL (India) Limited | ₹1.07T | 13.93 | 1.20 | 9.87 | 9.48 |
| Gujarat Gas Limited | ₹256.77B | 22.07 | 2.94 | 14.85 | 16.54 |
| Mahanagar Gas Ltd. | ₹104.19B | 12.39 | 1.68 | 6.75 | 10.29 |
| Adani Total Gas Limited | ₹717.96B | 109.90 | 14.76 | 61.35 | 62.50 |
Comparison Analysis: Gujarat State Petronet Ltd. trades at a moderate valuation relative to its regional peers, with a trailing P/E of 14.85 and EV/EBITDA of 5.84, which are lower than those of Gujarat Gas Limited and Adani Total Gas Limited but slightly higher than Mahanagar Gas Ltd. Its P/B ratio of 1.31 is among the lowest in the peer group, indicating a relatively conservative market valuation. GSPL's return on equity of 7.14% is below the peer average, suggesting room for improvement in profitability. The company’s price-to-cash-flow ratio of 6.23 is also lower than most peers, reflecting potentially undervalued cash flow generation. Overall, GSPL presents a valuation profile that is more conservative compared to higher-priced peers, with stable fundamentals in the regulated gas utilities sector.
Financial Metrics Comparison with Peers
Financial Statements
Comprehensive financial data including income, balance sheet, and cash flow metrics
Income Statement
| fiscal_date | 2025-03-31 | 2024-03-31 | 2023-03-31 | 2022-03-31 | 2021-03-31 |
|---|---|---|---|---|---|
| Sales | 172.76B | 172.07B | 180.26B | 179.18B | 114.93B |
| Cost Of Goods | 137.03B | 130.25B | 136.75B | 138.09B | 73.77B |
| Gross Profit | 35.73B | 41.82B | 43.51B | 41.09B | 41.15B |
| Operating Expense Selling General And Administrative | 552.35M | 529.57M | 597.46M | 659.94M | 683.80M |
| Operating Expense Other Operating Expenses | 5.80B | 4.87B | 3.90B | 3.21B | 2.51B |
| Operating Income | 20.12B | 27.47B | 30.62B | 29.25B | 30.36B |
| Non Operating Interest Income | 2.89B | 1.47B | 887.88M | 497.52M | 591.99M |
| Non Operating Interest Expense | 373.69M | 320.82M | 436.34M | 856.13M | 2.07B |
| Pretax Income | 22.34B | 29.35B | 31.25B | 29.57B | 29.36B |
| Income Tax | 5.97B | 7.51B | 7.83B | 7.26B | 7.43B |
| Net Income | 16.37B | 21.84B | 23.42B | 22.31B | 21.92B |
| Eps Basic | 19.69 | 29.41 | 29.09 | 29.04 | 28.48 |
| Eps Diluted | 19.69 | 29.41 | 29.09 | 29.04 | 28.48 |
| Basic Shares Outstanding | 564.21M | 564.21M | 564.21M | 564.21M | 564.18M |
| Diluted Shares Outstanding | 564.21M | 564.21M | 564.21M | 564.21M | 564.18M |
| Ebit | 22.72B | 29.67B | 31.68B | 30.42B | 31.43B |
| Ebitda | 29.91B | 35.78B | 37.93B | 36.38B | 36.88B |
| Net Income Continuous Operations | 22.95B | 29.29B | 31.22B | 29.03B | 28.97B |
| Minority Interests | -5.26B | -5.24B | -7.01B | -5.93B | -5.86B |
| Preferred Stock Dividends | 0.00 | 0.00 | 0.00 | 0.00 | 0.00 |
Source: Financial statements and regulatory filings
Balance Sheet
| fiscal_date | 2025-03-31 | 2024-03-31 | 2023-03-31 | 2022-03-31 | 2021-03-31 |
|---|---|---|---|---|---|
| Cash And Cash Equivalents | 3.68B | 9.24B | 8.10B | 935.73M | 3.61B |
| Accounts Receivable | 9.66B | 10.07B | 10.06B | 9.62B | 9.06B |
| Total Assets | 208.07B | 190.56B | 173.16B | 152.94B | 141.69B |
| Total Liabilities | 52.52B | 46.73B | 46.28B | 47.77B | 57.10B |
| Long Term Debt | 1.04B | 1.07B | 1.21B | 5.12B | 11.60B |
| Shareholders Equity | 155.55B | 143.83B | 126.88B | 105.17B | 84.59B |
Source: Financial statements and regulatory filings
Cash Flow Statement
| fiscal_date | 2025-03-31 | 2024-03-31 | 2023-03-31 | 2022-03-31 | 2021-03-31 |
|---|---|---|---|---|---|
| Operating Activities Net Income | 22.95B | 29.29B | 31.22B | 29.03B | 28.97B |
| Operating Activities Other Non Cash Items | -2.39B | -1.08B | -381.49M | 564.96M | 1.62B |
| Operating Activities Accounts Receivable | 273.81M | -59.37M | -1.08B | -1.37B | -2.56B |
| Operating Activities Other Assets Liabilities | 3.48B | 165.36M | 2.20B | 652.12M | 1.42B |
| Operating Activities Operating Cash Flow | 24.31B | 28.31B | 31.96B | 28.88B | 29.44B |
| Investing Activities Capital Expenditures | -9.76B | -12.53B | -12.78B | -12.92B | -8.57B |
| Investing Activities Purchase Of Investments | -12.71B | -2.66B | 0.00 | -1.69B | -3.85B |
| Investing Activities Sale Of Investments | 0.00 | 592.00K | 0.00 | 403.44M | 974.42M |
| Investing Activities Other Investing Activity | -7.69B | -7.62B | -6.27B | 409.15M | 13.61M |
| Investing Activities Investing Cash Flow | -30.16B | -22.81B | -19.05B | -13.79B | -11.43B |
| Financing Activities Common Dividends | -4.60B | -4.92B | -1.76B | -1.76B | -1.53B |
| Financing Activities Financing Cash Flow | -4.60B | -4.92B | -7.41B | -15.30B | -18.57B |
| End Cash Position | 3.68B | 9.24B | 8.10B | 904.20M | 3.61B |
| Free Cash Flow | 17.65B | 15.50B | 20.62B | 14.56B | 20.41B |
| Financing Activities Long Term Debt Payments | N/A | 0.00 | -5.65B | -15.29B | -24.74B |
| Financing Activities Long Term Debt Issuance | N/A | N/A | 0.00 | 1.75B | 7.69B |
| Operating Activities Stock Based Compensation | N/A | N/A | N/A | 0.00 | -129.00K |
| Investing Activities Net Acquisitions | N/A | N/A | N/A | 0.00 | 0.00 |
| Financing Activities Common Stock Issuance | N/A | N/A | N/A | 0.00 | 8.26M |
Source: Financial statements and regulatory filings
Technical Analysis
Key Insights
- GSPL is currently in a consolidation phase with price action fluctuating between support near ₹260 and resistance around ₹290.
- The key support level is identified at approximately ₹260, while resistance is near the 52-week high of ₹348.
- The stock price is trading slightly above the 50-day moving average (₹263.82) but below the 200-day moving average (₹294.04), indicating mixed medium- to long-term momentum.
- Momentum indicators show RSI near neutral levels around 50, MACD close to its signal line, and Stochastic oscillators indicating no strong directional bias.
- On daily and weekly timeframes, the stock exhibits sideways movement with no clear breakout, while monthly trends suggest a mild downward bias given the recent price decline from the 52-week high.
- Potential market scenarios include a range-bound movement between ₹260 and ₹290, with a breakout above ₹290 possibly signaling renewed upward momentum, whereas a drop below ₹260 could lead to further downside.
Trending News
Summary: Gujarat Gas Share Price: Find the latest news on Gujarat Gas Stock Price. Get all the information on Gujarat Gas with historic price charts for NSE / BSE. Experts & Broker view also get the Gujarat Gas Ltd. buy/sell tips detailed news, announcements, Forecasts, Analysts, Valuation, Earning ...
Sentiment: neutral
2. Headline: GSFC Q4 profit down 27% to ₹52 crore, revenue rises to ₹2,668 crore - The HinduBusinessLine
Summary: GSFC reports Q4 profit down 27% to ₹52 crore, while total income rises to ₹2,668 crore amid rising expenses.
Sentiment: negative
3. Headline: Stocks To Watch Today: Maruti Suzuki, LIC, Eicher Motors, LG Electronics, NTPC Green And Nykaa
Summary: Here's a look at stocks that are likely to be in focus during the trading session on Friday.
Sentiment: neutral
Summary: While some exploration, refining, ... a few stocks, including Gujarat State Petronet, continued to face selling pressure. The BSE Energy index rose 0.36% to 11,672.14. The Nifty 50 was up 0.16% at 23,697.05, and the S&P BSE Sensex gained 0.07% to 75,370.64 as of around 11:13 AM. Top Gainers in the Energy Sector · Asian Energy Services rose 1.87% on BSE to ₹361.95. Gandhar Oil Refinery gained 2.23–2.48%. Bharat Coking Coal Ltd...
Sentiment: positive
Summary: The Indian stock market displayed mixed performance this morning, with the SENSEX inching up by 0.02% to 75,335.74 and the NIFTY 50 rising by 0.14% to 23,691.30. Despite this, several stocks faced significant declines. Jubilant Foodworks, Gujarat State Petronet, and Bosch emerged as the top ...
Sentiment: negative
Recent Updates
News Summary
As of May 2, 2026. Gujarat State Petronet Ltd. underwent significant corporate restructuring as part of the GSPC Group’s Scheme of Arrangement, merging with Gujarat State Petroleum Corporation into Gujarat Gas Limited, now renamed Gujarat Energy Limited. The gas transmission business was demerged into GSPL Transmission Limited, which will be separately listed on stock exchanges. This restructuring consolidates energy businesses, diversifies investments into gas trading, power generation, LNG terminal operations, and city gas distribution. Additionally, SBI Mutual Fund acquired a 5.29% stake in GSPL, signaling strong institutional interest and confidence in the company’s prospects. The new shareholding structure maintains approximately 56% ownership by the Government of Gujarat and related entities across the merged and demerged companies, supporting governance continuity.
News Sentiment
The overall sentiment from recent updates is mixed to positive. The corporate restructuring and merger reflect strategic efforts to streamline operations and diversify energy assets, which may enhance operational efficiency and market positioning. Institutional buying by SBI Mutual Fund adds a positive tone, indicating confidence in GSPL’s future. However, the demerger and listing of the transmission business introduce transitional risks and market uncertainties. The balanced government ownership suggests stability in governance but also implies regulatory oversight. Collectively, the news points to a phase of transformation with cautious optimism regarding long-term growth.
Source List
- https://indianexpress.com/article/cities/ahmedabad/gspc-gspl-merge-into-gujarat-gas-entity-to-be-renamed-gujarat-energy-limited-10667472/
- https://www.investywise.com/gujarat-state-petronet-stake-acquisition-by-sbi-mutual-fund/
Analytical Overview
Analysis Summary
Gujarat State Petronet Ltd. trades at a trailing P/E of 14.85 and a forward P/E of 13.30, which are broadly in line with the industry average of 14.85, indicating valuation consistency with sector peers. The PEG ratio of 1.54 suggests moderate growth expectations relative to earnings. Revenue growth has declined by 10.9% in the most recent quarter, but positive quarterly earnings growth of 9.7% year-over-year indicates improving profitability. Operating cash flow of INR 24.31 billion and levered free cash flow of INR 11.11 billion demonstrate healthy cash generation supporting financial flexibility. The company maintains a low debt level with a debt-to-equity ratio of 0.88 and a current ratio of 1.50, reflecting sound financial health.
Sector-specific challenges include regulatory risks inherent in the Indian utilities and gas transmission industry, as well as competition from other energy sources and infrastructure providers. Opportunities arise from India's increasing focus on cleaner energy and natural gas adoption, which aligns with GSPL's core business. India’s regulatory environment favors infrastructure development, but evolving policies require careful monitoring. Consumer trends towards cleaner fuels and government initiatives supporting gas pipeline expansion present growth avenues.
Overall Business and Market Assessment
Supporting Factors: No data
Risk Factors: the recent revenue decline, regulatory uncertainties, and the transitional impact of corporate restructuring and demerger activities
SWOT Analysis
Strengths
- Gujarat State Petronet Ltd. has a strong market position as a leading natural gas transmission company in Gujarat.
- The company maintains robust cash reserves of over INR 48 billion with low debt, supporting financial stability.
- Consistent operating cash flow and positive earnings growth demonstrate operational efficiency.
- Strategic restructuring enhances focus on core transmission business and diversifies energy assets.
Weaknesses
- Recent quarterly revenue declined by 10.9%, indicating near-term growth challenges.
- Return on equity at 7.14% is modest compared to industry peers, reflecting limited profitability.
- Stock price currently trades below the 200-day moving average, suggesting medium-term price weakness.
- Dependence on regulatory environment exposes the company to policy-related risks.
Opportunities
- India’s increasing adoption of natural gas and cleaner energy supports long-term demand growth.
- Government initiatives to expand gas pipeline infrastructure provide expansion potential.
- Strategic mergers and demergers create focused business units with clearer growth strategies.
- Institutional investor interest, such as SBI Mutual Fund’s stake acquisition, may enhance capital access.
Threats
- Regulatory changes or delays could impact project approvals and operational costs.
- Competition from other energy sources and pipeline operators may pressure margins.
- Market volatility and sector-specific risks could affect stock price performance.
- Economic fluctuations in India may influence energy demand and investment cycles.
Company Description
Gujarat State Petronet Ltd. is a prominent natural gas transmission company in India. It focuses on developing and operating a wide network of high-pressure natural gas pipelines, ensuring the efficient and reliable movement of gas across the region. Key to India’s energy infrastructure, the company facilitates the distribution of natural gas to various sectors, including power, residential, industrial, and commercial users, thereby supporting energy security and economic development. By leveraging strategic partnerships and advanced technology, Gujarat State Petronet Ltd. contributes significantly to the energy ecosystem, enabling India to adopt cleaner fuel options. Headquartered in Gujarat, one of the most industrially advanced states in India, the company plays a crucial role in advancing both regional and national industrial growth by ensuring robust pipeline connectivity, which is indispensable for large-scale industrial operations. Its commitment to sustainability and innovation makes it an integral part of India's journey towards a carbon-neutral future.