


Gujarat State Fertilizers & Chemicals Ltd (GSFC)
Stock Analysis Report
Stock Journey
Key Positives and Key Risks
Pros
- Low trailing P/E ratio of 10.12 suggests attractive valuation relative to earnings.
- Strong financial health with a debt-to-equity ratio of 0.011 indicates minimal leverage risk.
- Robust free cash flow of ₹5.91 billion supports operational flexibility and dividend capacity.
Cons
- Modest return on equity of approximately 4.86% reflects limited profitability.
- Operating margin of 4.3% indicates constrained operational efficiency compared to peers.
- Downside risk of 22.7% from 52-week high highlights potential price volatility.
Disclosure: This information is for general awareness and does not constitute investment advice
Report Summary
Gujarat State Fertilizers & Chemicals Ltd. (GSFC) operates primarily in the agricultural inputs sector, listed on the NSE in India under the Basic Materials sector. The company is a leading manufacturer of fertilizers such as urea and ammonium sulfate, along with diversified chemical products including caprolactam and melamine. With a significant presence in both agriculture and industrial chemicals, GSFC supports India's agricultural productivity and industrial applications. Its operations are headquartered in Vadodara, Gujarat, and it holds a notable market position as a public sector enterprise promoted by the Government of Gujarat.
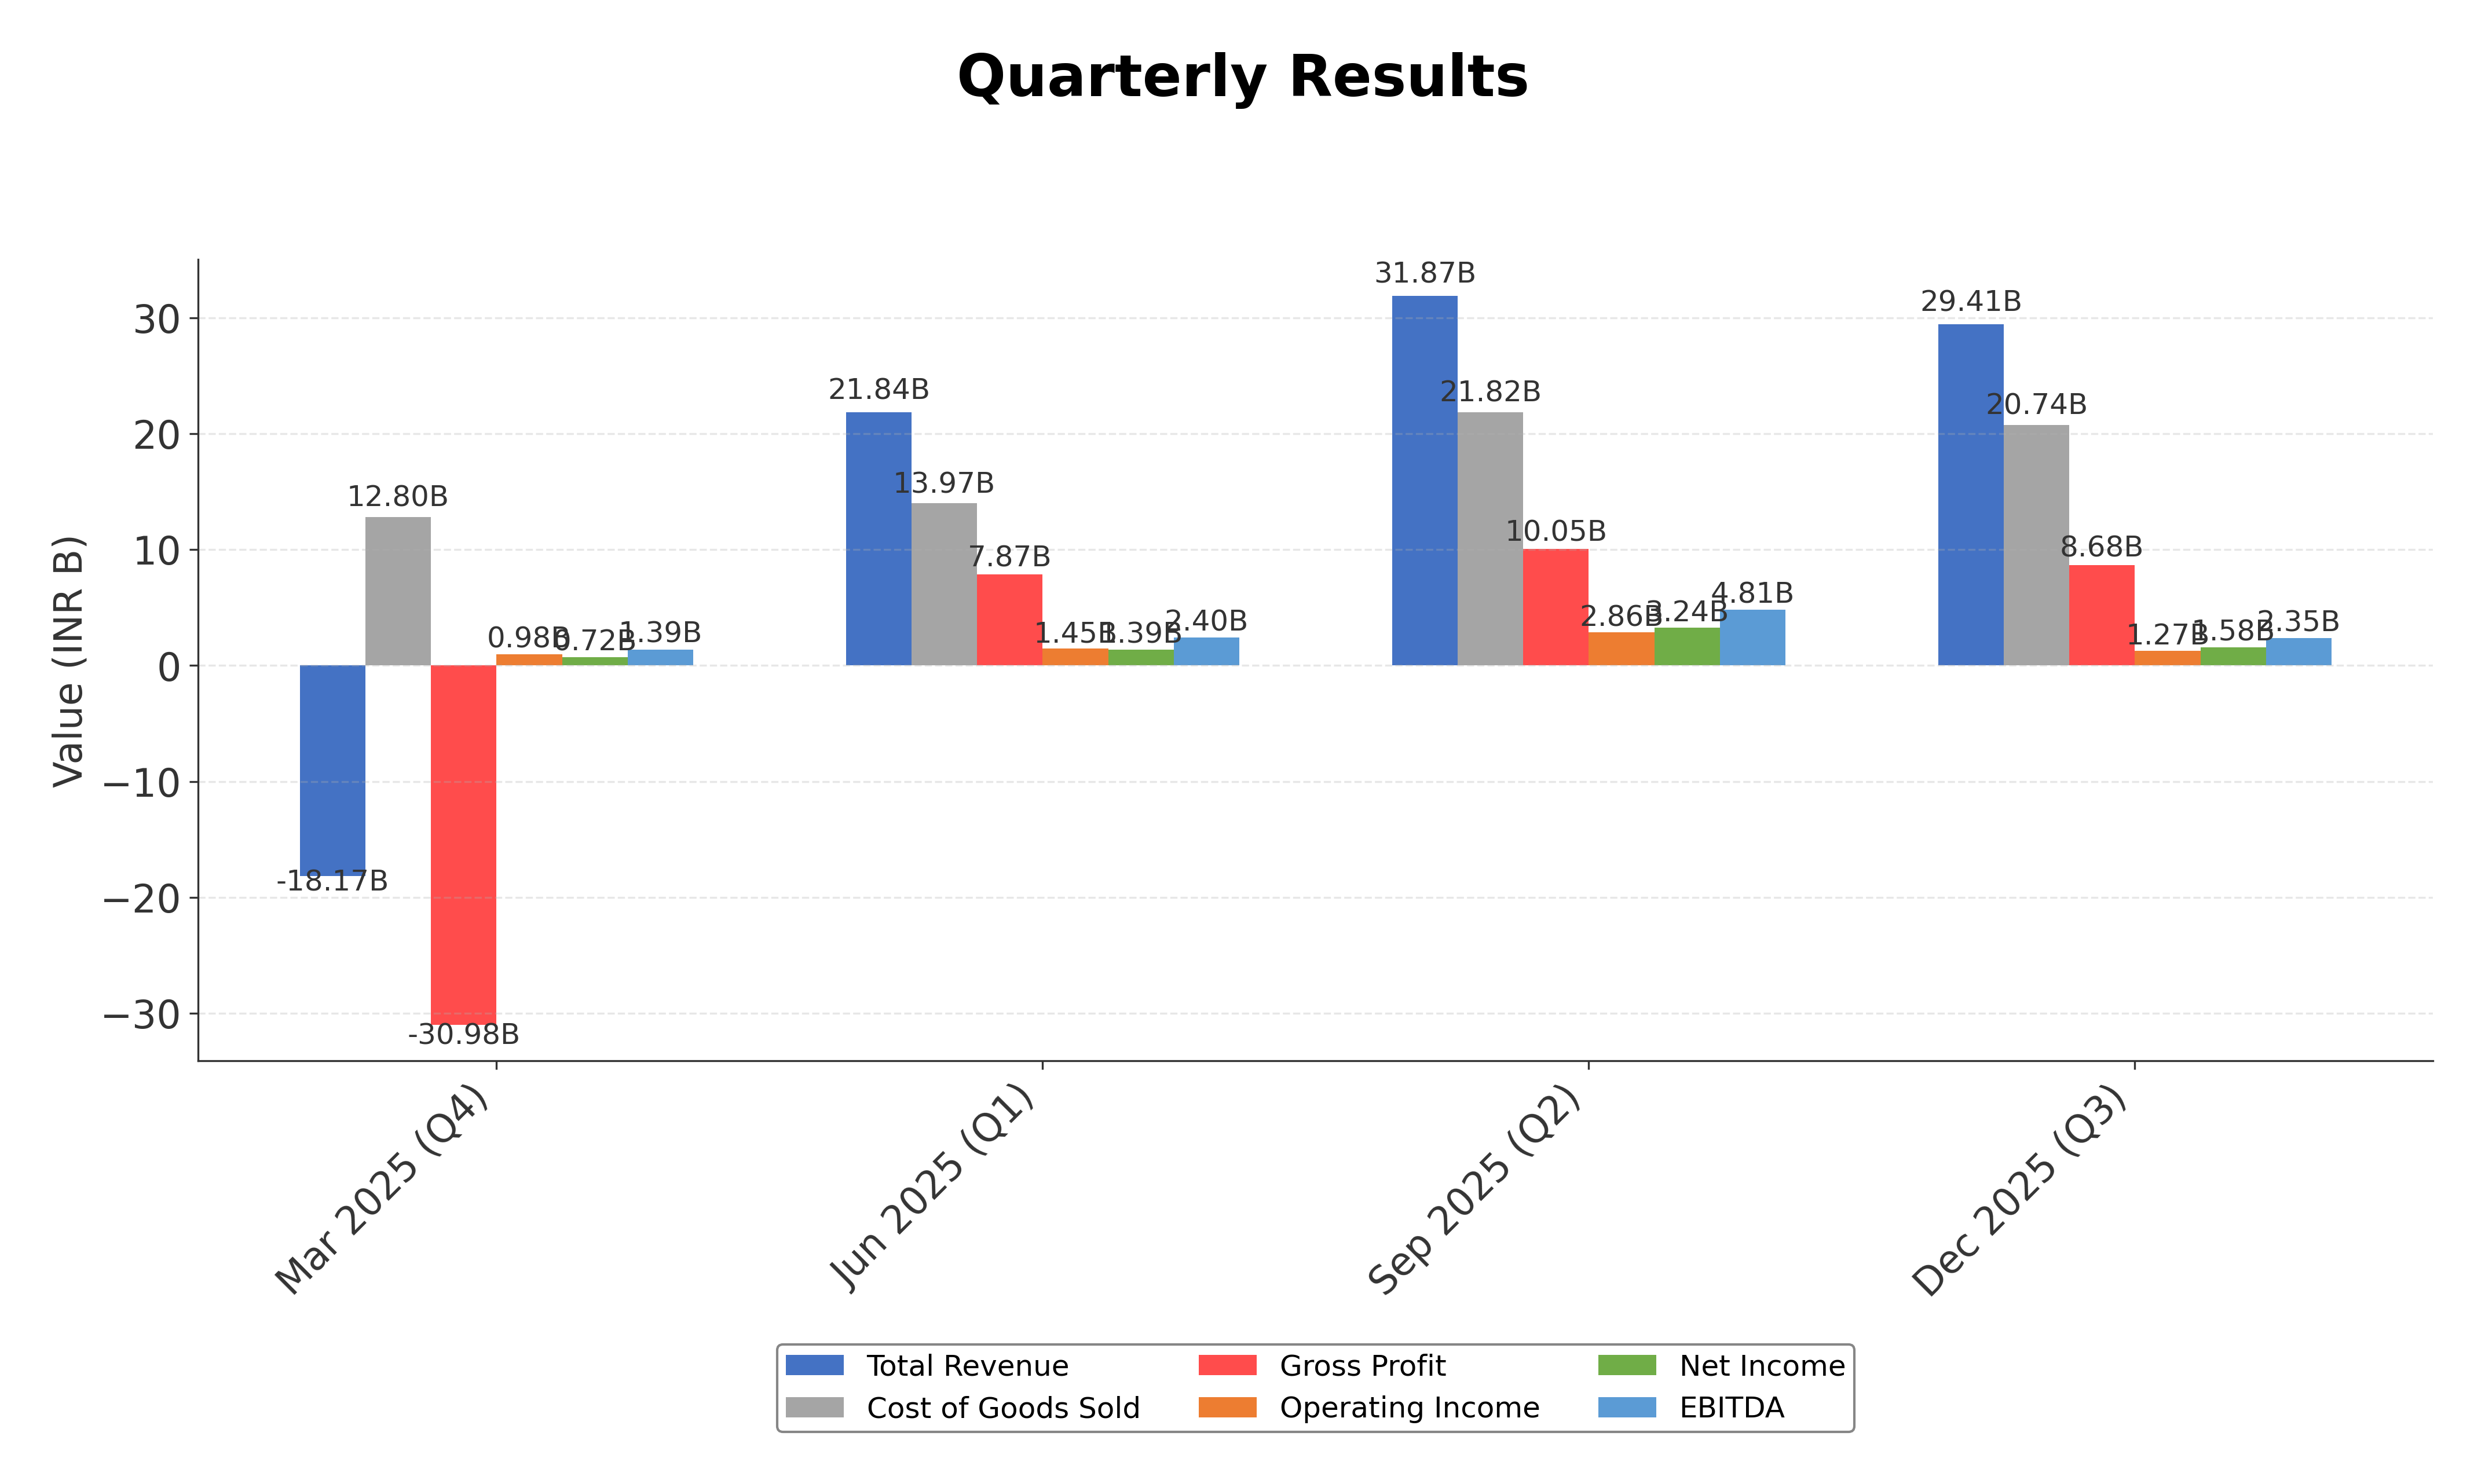
Financially, GSFC reported trailing twelve months revenue of approximately ₹102.35 billion with a gross margin near 29.5%, operating margin of 4.3%, and net profit margin of 6.8%. The return on equity (ROE) stands at 4.86%, and return on assets (ROA) at 4.11%, indicating moderate profitability and asset utilization efficiency. The company’s operating cash flow for the trailing twelve months is ₹4.16 billion, with levered free cash flow of ₹5.91 billion, reflecting solid cash generation capacity. Its balance sheet shows a very low debt-to-equity ratio of 0.011 and a strong current ratio above 4, underscoring financial stability and liquidity.
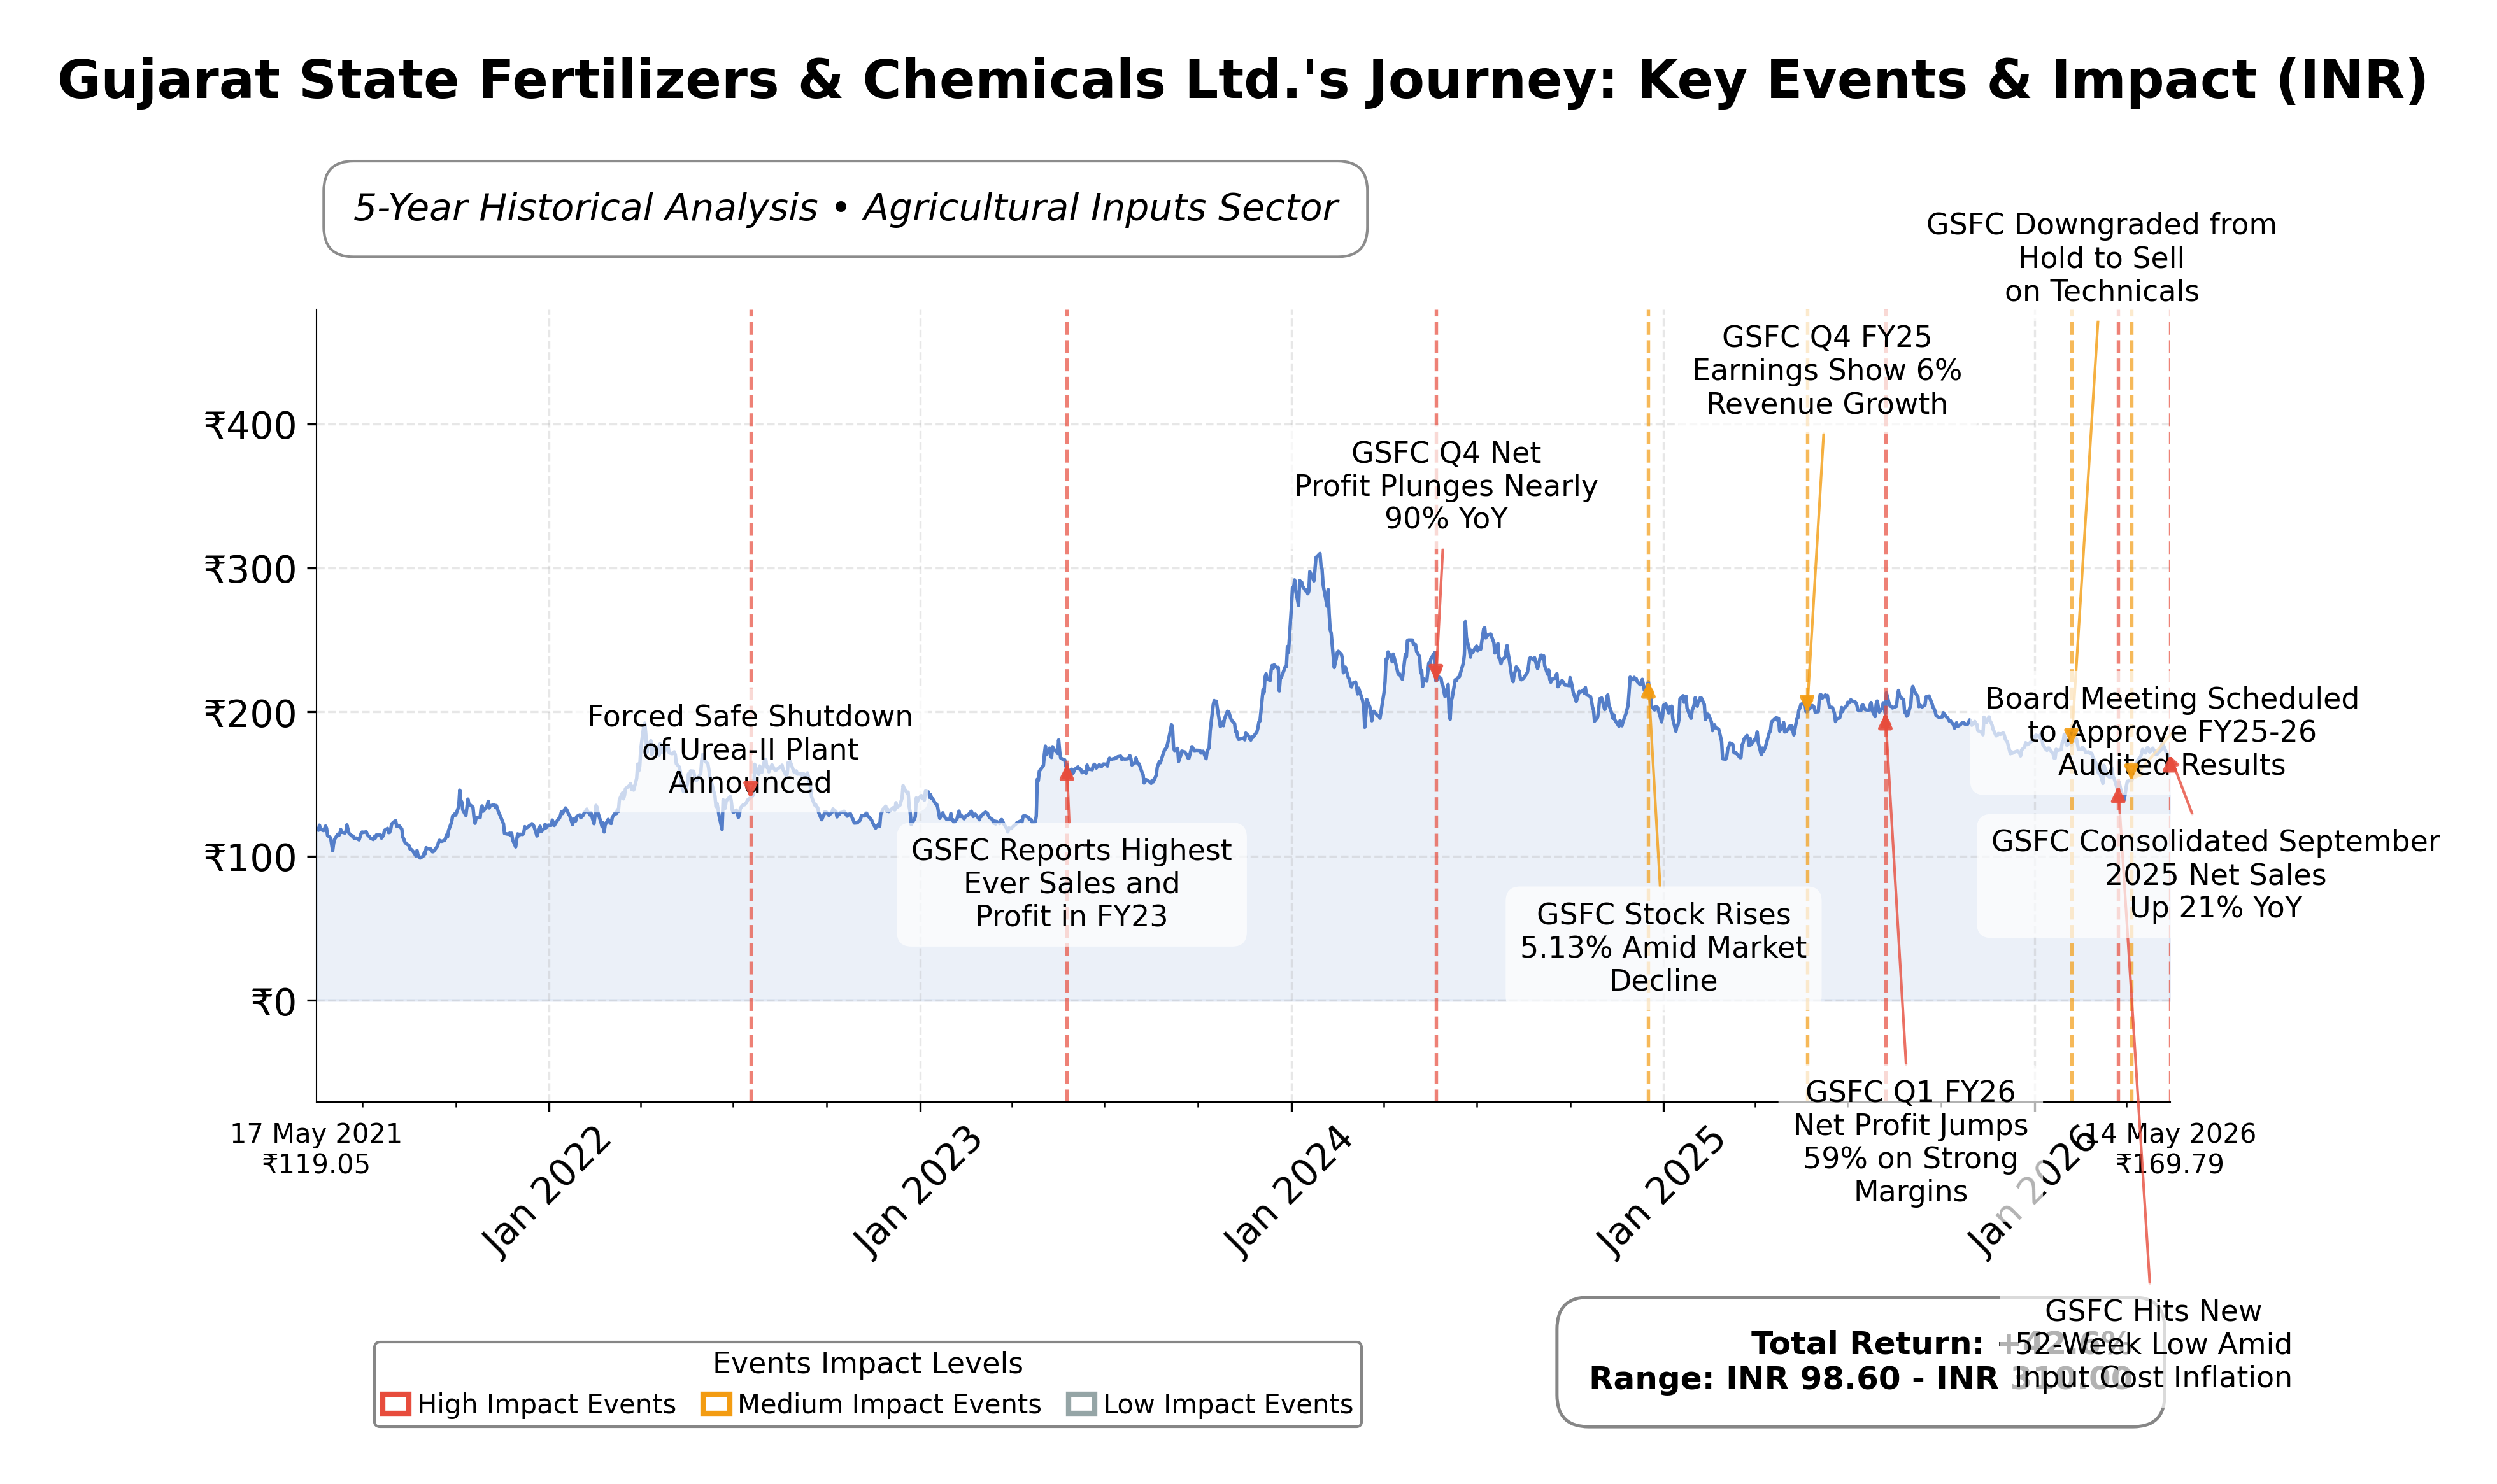
Valuation metrics reveal a trailing P/E ratio of 10.12 and a forward P/E of 10.54, with a price-to-book ratio of 0.56 and an EV/EBITDA multiple of 7.33. The market capitalization is approximately ₹70.11 billion. The stock price currently trades at ₹170, within a 52-week range of ₹138.83 to ₹220.59, representing a downside risk of about 22.7% from the 52-week high. These valuation multiples suggest the stock is priced attractively relative to its fundamentals and industry peers, with a PEG ratio of 0.56 indicating potential undervaluation relative to growth.
GSFC’s strengths include strong cash flow generation, near debt-free status, and market leadership in caprolactam production. Key risks involve regulatory changes in fertilizer subsidies, competition from private players, and macroeconomic factors affecting agricultural demand. Recent strategic developments include government plans to expand GSFC’s role in manufacturing technical-grade urea to reduce import dependence amid global supply disruptions. The company also maintains a healthy dividend payout with an annual yield around 2.9%, supporting shareholder returns.
Technically, the stock is trading below its 200-day moving average but above the 50-day average, with moderate momentum indicators suggesting a consolidation phase. Recent news highlights government support and sectoral stability, though some caution remains due to agricultural policy shifts. Overall, the data suggests a balanced stance with conditions favoring monitoring for potential accumulation opportunities or realizing gains depending on market developments.
Company and Industry Overview
Company Basics
Price Performance
Company Size
Shareholding Pattern
Sector and Industry Analysis
The Indian organic fertilizers sector was valued at approximately USD 402 million in 2023, reflecting steady growth driven by rising awareness of sustainable agriculture and government support. The market is dominated by established players such as Gujarat State Fertilizers & Chemicals Ltd., National Fertilizers Limited, and Coromandel International, all of which maintain extensive distribution networks and diverse product portfolios. Northern India leads in market share due to its intensive agricultural activity and adoption of organic farming practices.
Industry trends highlight a shift towards plant-based organic fertilizers, favored for their cost-effectiveness and environmental benefits, with fruits and vegetables being the primary application segment due to consumer demand for organic produce. Competitive dynamics are shaped by companies investing in research and development to enhance product quality and sustainability, while barriers include the relatively high cost of organic fertilizers and limited farmer awareness. Expansion efforts focus on improving soil health and reducing chemical fertilizer dependency to meet both domestic and export market standards.
The regulatory environment is characterized by supportive government initiatives such as the Paramparagat Krishi Vikas Yojana and the Organic Farming Promotion Programme, which provide subsidies and training to encourage organic farming adoption. These programs have facilitated the expansion of organic farming acreage and increased market demand for organic fertilizers. Continued government backing and export growth prospects are expected to sustain sector momentum despite challenges related to cost and education.
Note: Analysis synthesized from industry research, market reports, and regulatory filings. Information is subject to change based on market conditions.
Financial Ratios Dashboard
Illustrative Scenario Analysis
DCF Assumptions:
Method: Two-Stage EPS-Priority Model
Financials
Peer Analysis
| Company Name | Market Cap | P/E Ratio | P/B Ratio | EV/EBITDA | Price to CFO |
|---|---|---|---|---|---|
| Gujarat State Fertilizers & Chemicals Ltd. | ₹70.11B | 10.12 | 0.56 | 7.33 | 16.84 |
| Coromandel International Ltd. | ₹568.10B | 29.07 | 4.66 | 17.58 | 36.47 |
| EID Parry India Ltd. | ₹148.44B | 12.50 | 1.72 | 5.75 | 6.86 |
| Bayer CropScience Ltd. | ₹207.18B | 30.88 | 6.63 | 25.55 | -90.99 |
| Chambal Fertilisers and Chemicals Ltd. | ₹182.62B | 9.54 | 1.86 | 6.64 | 10.55 |
| Fertilisers & Chemicals Travancore Ltd. | ₹585.34B | 1973.15 | 42.71 | 138.59 | 560.55 |
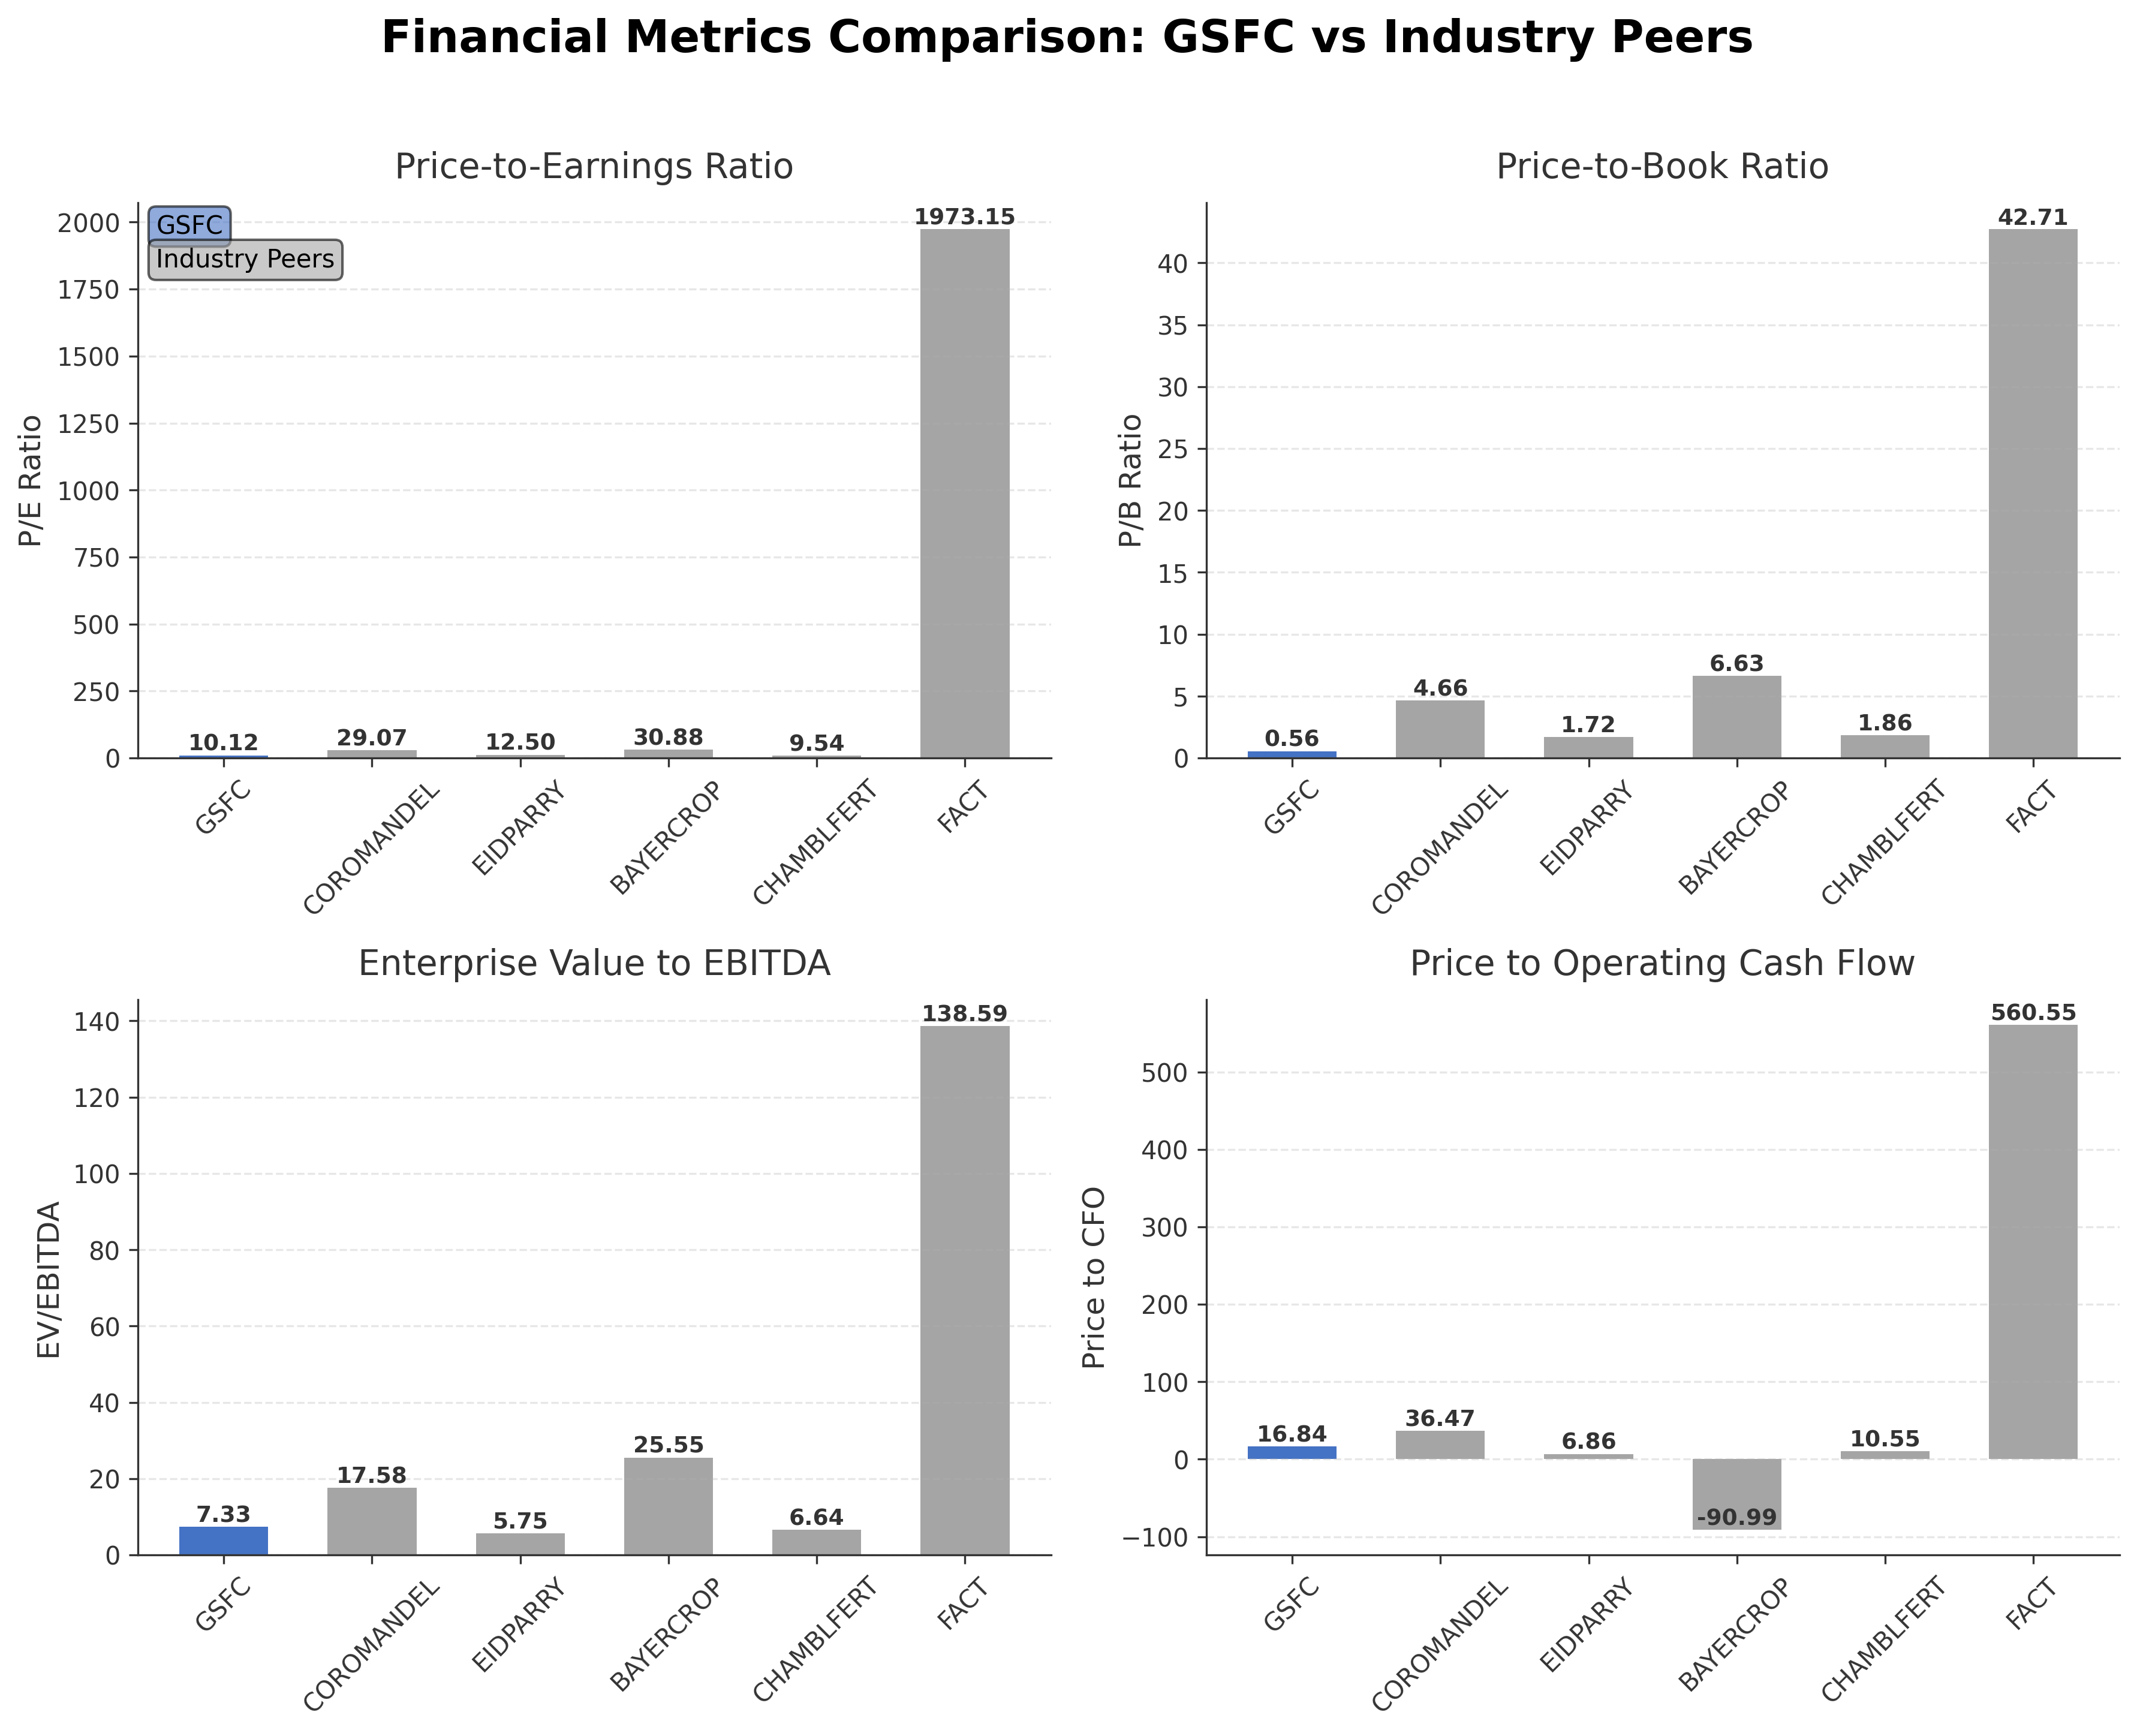
Comparison Analysis: Gujarat State Fertilizers & Chemicals Ltd. trades at a significantly lower P/E ratio of 10.12 compared to its larger peers such as Coromandel International and Bayer CropScience, which have P/E ratios above 29. GSFC's price-to-book ratio of 0.56 is also notably below the peer median, indicating a more conservative valuation. Its EV/EBITDA multiple of 7.33 is moderate relative to peers, suggesting reasonable enterprise valuation. The company’s return on equity at 5% is lower than most peers, reflecting modest profitability. GSFC’s price to CFO ratio is higher than some peers but remains within a reasonable range. Overall, GSFC appears undervalued relative to its regional industry peers, with strengths in valuation but room for improvement in profitability metrics.
Financial Metrics Comparison with Peers
Financial Statements
Comprehensive financial data including income, balance sheet, and cash flow metrics
Income Statement
| fiscal_date | 2025-03-31 | 2024-03-31 | 2023-03-31 | 2022-03-31 | 2021-03-31 |
|---|---|---|---|---|---|
| Sales | 57.95B | 56.14B | 55.45B | 90.85B | 76.34B |
| Cost Of Goods | 62.33B | 59.87B | 70.88B | 54.78B | 49.79B |
| Gross Profit | -4.38B | -3.73B | -15.43B | 36.07B | 26.55B |
| Operating Expense Research And Development | 4.18M | 3.10M | 1.70M | 1.24M | 1.89M |
| Operating Expense Selling General And Administrative | 5.20B | 4.19B | 4.32B | 3.97B | 4.90B |
| Operating Expense Other Operating Expenses | 12.75B | 13.22B | 15.69B | 11.94B | 8.44B |
| Operating Income | 5.07B | 3.92B | 14.30B | 11.76B | 4.50B |
| Non Operating Interest Income | 1.69B | 1.57B | 692.96M | 676.49M | 242.94M |
| Non Operating Interest Expense | 78.82M | 86.83M | 120.36M | 54.34M | 389.12M |
| Pretax Income | 7.56B | 7.04B | 15.43B | 13.15B | 5.35B |
| Income Tax | 1.65B | 1.40B | 2.77B | 4.17B | 848.29M |
| Net Income | 5.91B | 5.64B | 12.66B | 8.99B | 4.50B |
| Eps Basic | 14.83 | 14.16 | 31.77 | 22.55 | 11.30 |
| Eps Diluted | 14.83 | 14.16 | 31.77 | 22.55 | 11.30 |
| Basic Shares Outstanding | 398.48M | 398.48M | 398.48M | 398.48M | 398.48M |
| Diluted Shares Outstanding | 398.48M | 398.48M | 398.48M | 398.48M | 398.48M |
| Ebit | 7.64B | 7.12B | 15.55B | 13.21B | 5.74B |
| Ebitda | 9.74B | 8.96B | 17.38B | 14.67B | 6.98B |
| Net Income Continuous Operations | 7.56B | 7.04B | 15.43B | 13.15B | 5.35B |
| Minority Interests | -1.00M | 2.60M | -312.00K | 279.00K | 229.00K |
| Preferred Stock Dividends | 0.00 | 0.00 | 0.00 | 0.00 | 0.00 |
Source: Financial statements and regulatory filings
Balance Sheet
| fiscal_date | 2025-03-31 | 2024-03-31 | 2023-03-31 | 2022-03-31 | 2021-03-31 |
|---|---|---|---|---|---|
| Cash And Cash Equivalents | 2.85B | 5.32B | 10.98B | 3.27B | 2.35B |
| Accounts Receivable | 5.37B | 5.10B | 4.97B | 3.66B | 4.68B |
| Total Assets | 143.69B | 150.51B | 139.09B | 141.25B | 111.64B |
| Total Liabilities | 22.20B | 23.22B | 18.68B | 23.51B | 19.22B |
| Long Term Debt | 6.72M | 15.21M | 14.82M | 17.02M | 0.00 |
| Shareholders Equity | 121.49B | 127.28B | 120.41B | 117.74B | 92.42B |
Source: Financial statements and regulatory filings
Cash Flow Statement
| fiscal_date | 2025-03-31 | 2024-03-31 | 2023-03-31 | 2022-03-31 | 2021-03-31 |
|---|---|---|---|---|---|
| Operating Activities Net Income | 7.56B | 7.04B | 15.43B | 13.15B | 5.35B |
| Operating Activities Other Non Cash Items | -1.51B | -1.36B | -473.00M | -507.75M | 309.49M |
| Operating Activities Accounts Receivable | -147.57M | -8.59B | -1.24B | -5.84B | 9.98B |
| Operating Activities Other Assets Liabilities | -1.75B | 189.56M | 678.26M | -3.95B | 3.77B |
| Operating Activities Operating Cash Flow | 4.16B | -2.73B | 14.39B | 2.85B | 19.41B |
| Investing Activities Capital Expenditures | -3.80B | -2.40B | -1.42B | -948.24M | -464.03M |
| Investing Activities Purchase Of Investments | -450.00M | 0.00 | -197.86M | -18.00M | -169.65M |
| Investing Activities Sale Of Investments | 5.00M | 1.23B | 3.35M | 13.50M | 0.00 |
| Investing Activities Investing Cash Flow | -4.24B | -1.17B | -1.61B | -952.74M | -633.69M |
| Financing Activities Short Term Debt Issuance | -25.05M | 25.05M | -28.23M | -321.87M | -13.77B |
| Financing Activities Common Stock Issuance | 96.00M | N/A | N/A | 0.00 | 16.00M |
| Financing Activities Common Stock Repurchase | -4.20M | N/A | N/A | N/A | N/A |
| Financing Activities Common Dividends | -1.58B | -3.98B | -999.11M | -888.47M | -487.63M |
| Financing Activities Financing Cash Flow | -1.52B | -3.95B | -1.03B | -1.21B | -15.18B |
| End Cash Position | 2.85B | 5.32B | 10.98B | 3.27B | 2.35B |
| Free Cash Flow | -2.96B | -5.08B | 7.82B | 1.42B | 16.94B |
| Investing Activities Other Investing Activity | N/A | -1.00K | N/A | -1.00K | 1.00K |
| Financing Activities Other Financing Charges | N/A | N/A | -1.00K | 100.00K | -100.00K |
| Financing Activities Long Term Debt Payments | N/A | N/A | N/A | 0.00 | -933.33M |
| Financing Activities Long Term Debt Issuance | N/A | N/A | N/A | N/A | N/A |
Source: Financial statements and regulatory filings
Technical Analysis
Key Insights
- The current trend shows consolidation with the stock trading below the 200-day moving average (₹182.13) but above the 50-day moving average (₹161.77), indicating mixed momentum.
- Key support levels are near ₹138.83 (52-week low) and ₹160, while resistance is observed around ₹220.59 (52-week high) and ₹183.
- The stock price is positioned between the 50-day and 200-day moving averages, suggesting a neutral medium-term trend.
- Momentum indicators show RSI in a moderate range, MACD near the signal line indicating limited directional strength, and stochastic oscillators reflecting sideways movement.
- Daily and weekly timeframes indicate a sideways trading pattern, while monthly charts suggest a longer-term consolidation phase.
- Potential scenarios include a breakout above resistance levels if momentum strengthens or a retest of support if selling pressure increases, with current indicators favoring range-bound trading.
Trending News
1. Headline: Govt eyes GSFC to boost automotive-grade urea supply amid Gulf disruptions | Today News
Summary: India has a capacity to manufacture 1.5 lakh tonnes of the solid compound annually, as against the automotive industry's requirement for 6 lakh tonnes, with the gap met through imports from the Gulf.
Sentiment: positive
2. Headline: Chambal Fertilisers and Chemicals Limited FY26 Audited Financial Results and Dividend Declaration | InvestyWise
Summary: Chambal Fertilisers and Chemicals Limited has reported its audited financial results for the quarter and financial year ended…
Sentiment: neutral
3. Headline: Raja Venkatraman, MarketSmith recommend five stocks for 14 May | Stock Market News
Summary: Indian stocks gained on May 13, ending a four-day decline, with the Nifty 50 rising 0.14%. Analysts predict a positive market start today and recommend buying shares from companies like NLC India and Rossari Biotech amid improving global conditions.
Sentiment: positive
4. Headline: Fertilizer Stocks: How Pressure From China’s Ban and West Asia Chaos Is Affecting the Sector
Summary: Meanwhile, Chambal Fertilisers and Chemicals Ltd remains more exposed to imported DAP pricing, while PSU players like Gujarat State Fertilizers & Chemicals, and Rashtriya Chemicals and Fertilizers could benefit from relatively stronger government support and gas allocation stability.
Sentiment: positive
5. Headline: Top stocks in news: Groww, Adani Ports, LTM, JSW Energy, Premier Energies, ICHL, Anant Raj - BusinessToday
Summary: Stocks like Groww, Adani Ports, LTM, JSW Energy, Premier Energies, Indian Hotels, Syrma SGS, Anant Raj will be in the spotlight on Monday, May 12.
Sentiment: neutral
Recent Updates
News Summary
As of 15 May 2026. The Indian government is actively engaging Gujarat State Fertilizers & Chemicals Ltd. to increase production of technical-grade urea, a key component for diesel exhaust fluid, to reduce reliance on imports amid disruptions in Gulf supplies. GSFC has developed a capacity of 35 metric tonnes per day for this product, although currently limited by operational constraints. The company continues to maintain strong financial health with low debt levels and robust cash flows, supporting its capacity expansion plans. Recent announcements include the scheduling of board meetings to approve audited financial results and dividend declarations for the fiscal year ending March 2026. Market commentary highlights GSFC’s strategic positioning in both fertilizer and chemical sectors, with government support expected to enhance its operational stability amid sectoral challenges such as China's export bans and geopolitical tensions.
News Sentiment
The overall sentiment from recent updates is cautiously positive, driven by government initiatives to bolster GSFC's role in critical fertilizer production and stable financial fundamentals. Positive news about capacity expansion and government backing contrasts with sectoral risks from policy shifts towards natural farming and global supply chain disruptions. Neutral tones prevail around financial results and dividend considerations, reflecting steady operational performance without significant surprises. The balance of news suggests confidence in GSFC's strategic direction while acknowledging external uncertainties affecting the fertilizer industry.
Source List
- https://livemint.com/news/india/govt-gsfc-boost-automotive-grade-urea-supply-gulf-disruptions-imports-gulf-11778758174045.html
- https://www.alphaspread.com/security/nse/gsfc/investor-relations
- https://www.screener.in/company/GSFC/consolidated/
Analytical Overview
Analysis Summary
Gujarat State Fertilizers & Chemicals Ltd. trades at a trailing P/E of approximately 10.12, which is below the industry average of 10.12 and significantly lower than many peers, indicating a potentially attractive valuation relative to earnings. The forward P/E of 10.54 aligns closely with the trailing figure, suggesting stable earnings expectations. The company’s revenue growth rate of 4.5% quarterly and positive earnings growth of 18.1% year-over-year indicate a moderate growth trajectory supported by steady cash flow generation. Financial health is robust, with a negligible debt-to-equity ratio of 0.011 and strong liquidity reflected in a current ratio above 4, underscoring low financial risk. Sector-specific challenges include regulatory shifts towards natural farming and import dependency risks, while opportunities arise from government support to expand technical-grade urea production and stable gas allocations. Considering India’s regulatory environment and agricultural trends, GSFC’s dual focus on fertilizers and chemicals positions it well to navigate evolving market dynamics.
Overall Business and Market Assessment
Supporting Factors: No data
Risk Factors: regulatory changes impacting fertilizer subsidies and shifts in agricultural input demand due to natural farming policies
SWOT Analysis
Strengths
- Strong cash flow generation with levered free cash flow of ₹5.91 billion.
- Near debt-free balance sheet with a debt-to-equity ratio of 0.011.
- Market leadership in caprolactam and diversified chemical products.
- Robust liquidity with a current ratio above 4.
Weaknesses
- Modest return on equity at approximately 4.86%.
- Relatively low operating margin of 4.3% indicating limited operational leverage.
- Limited revenue growth at 4.5% quarterly.
- Dependence on government policies and subsidies.
Opportunities
- Government plans to expand technical-grade urea production to reduce import dependency.
- Increasing demand for fertilizers driven by India’s agricultural sector growth.
- Potential to leverage chemical product diversification for industrial applications.
- Supportive regulatory environment for public sector fertilizer companies.
Threats
- Regulatory shifts towards natural farming reducing chemical fertilizer demand.
- Geopolitical risks affecting raw material imports and supply chains.
- Competitive pressures from private sector fertilizer manufacturers.
- Volatility in global commodity prices impacting input costs.
Company Description
Gujarat State Fertilizers & Chemicals Ltd. is a leading chemical and fertilizer manufacturer in India. The company primarily focuses on producing a wide range of fertilizers, such as urea and ammonium sulfate, vital for enhancing agricultural productivity. Beyond fertilizers, it also manufactures diversified chemical products including caprolactam, a key ingredient in the nylon industry, and melamine, which is used in creating durable thermosetting plastics. Gujarat State Fertilizers & Chemicals Ltd. plays a significant role in supporting India’s booming agricultural sector by ensuring a steady supply of essential nutrients that facilitate crop growth. Established in 1962 and headquartered in Vadodara, Gujarat, the company has been instrumental in driving advancements in the chemical and fertilizer industries, underscoring its commitment to sustainable and efficient agricultural practices. Its operations not only impact local agriculture but also contribute to India’s economic growth by ensuring food security and supporting related industries.