
Grm Overseas Ltd (GRMOVER)
Stock Analysis Report
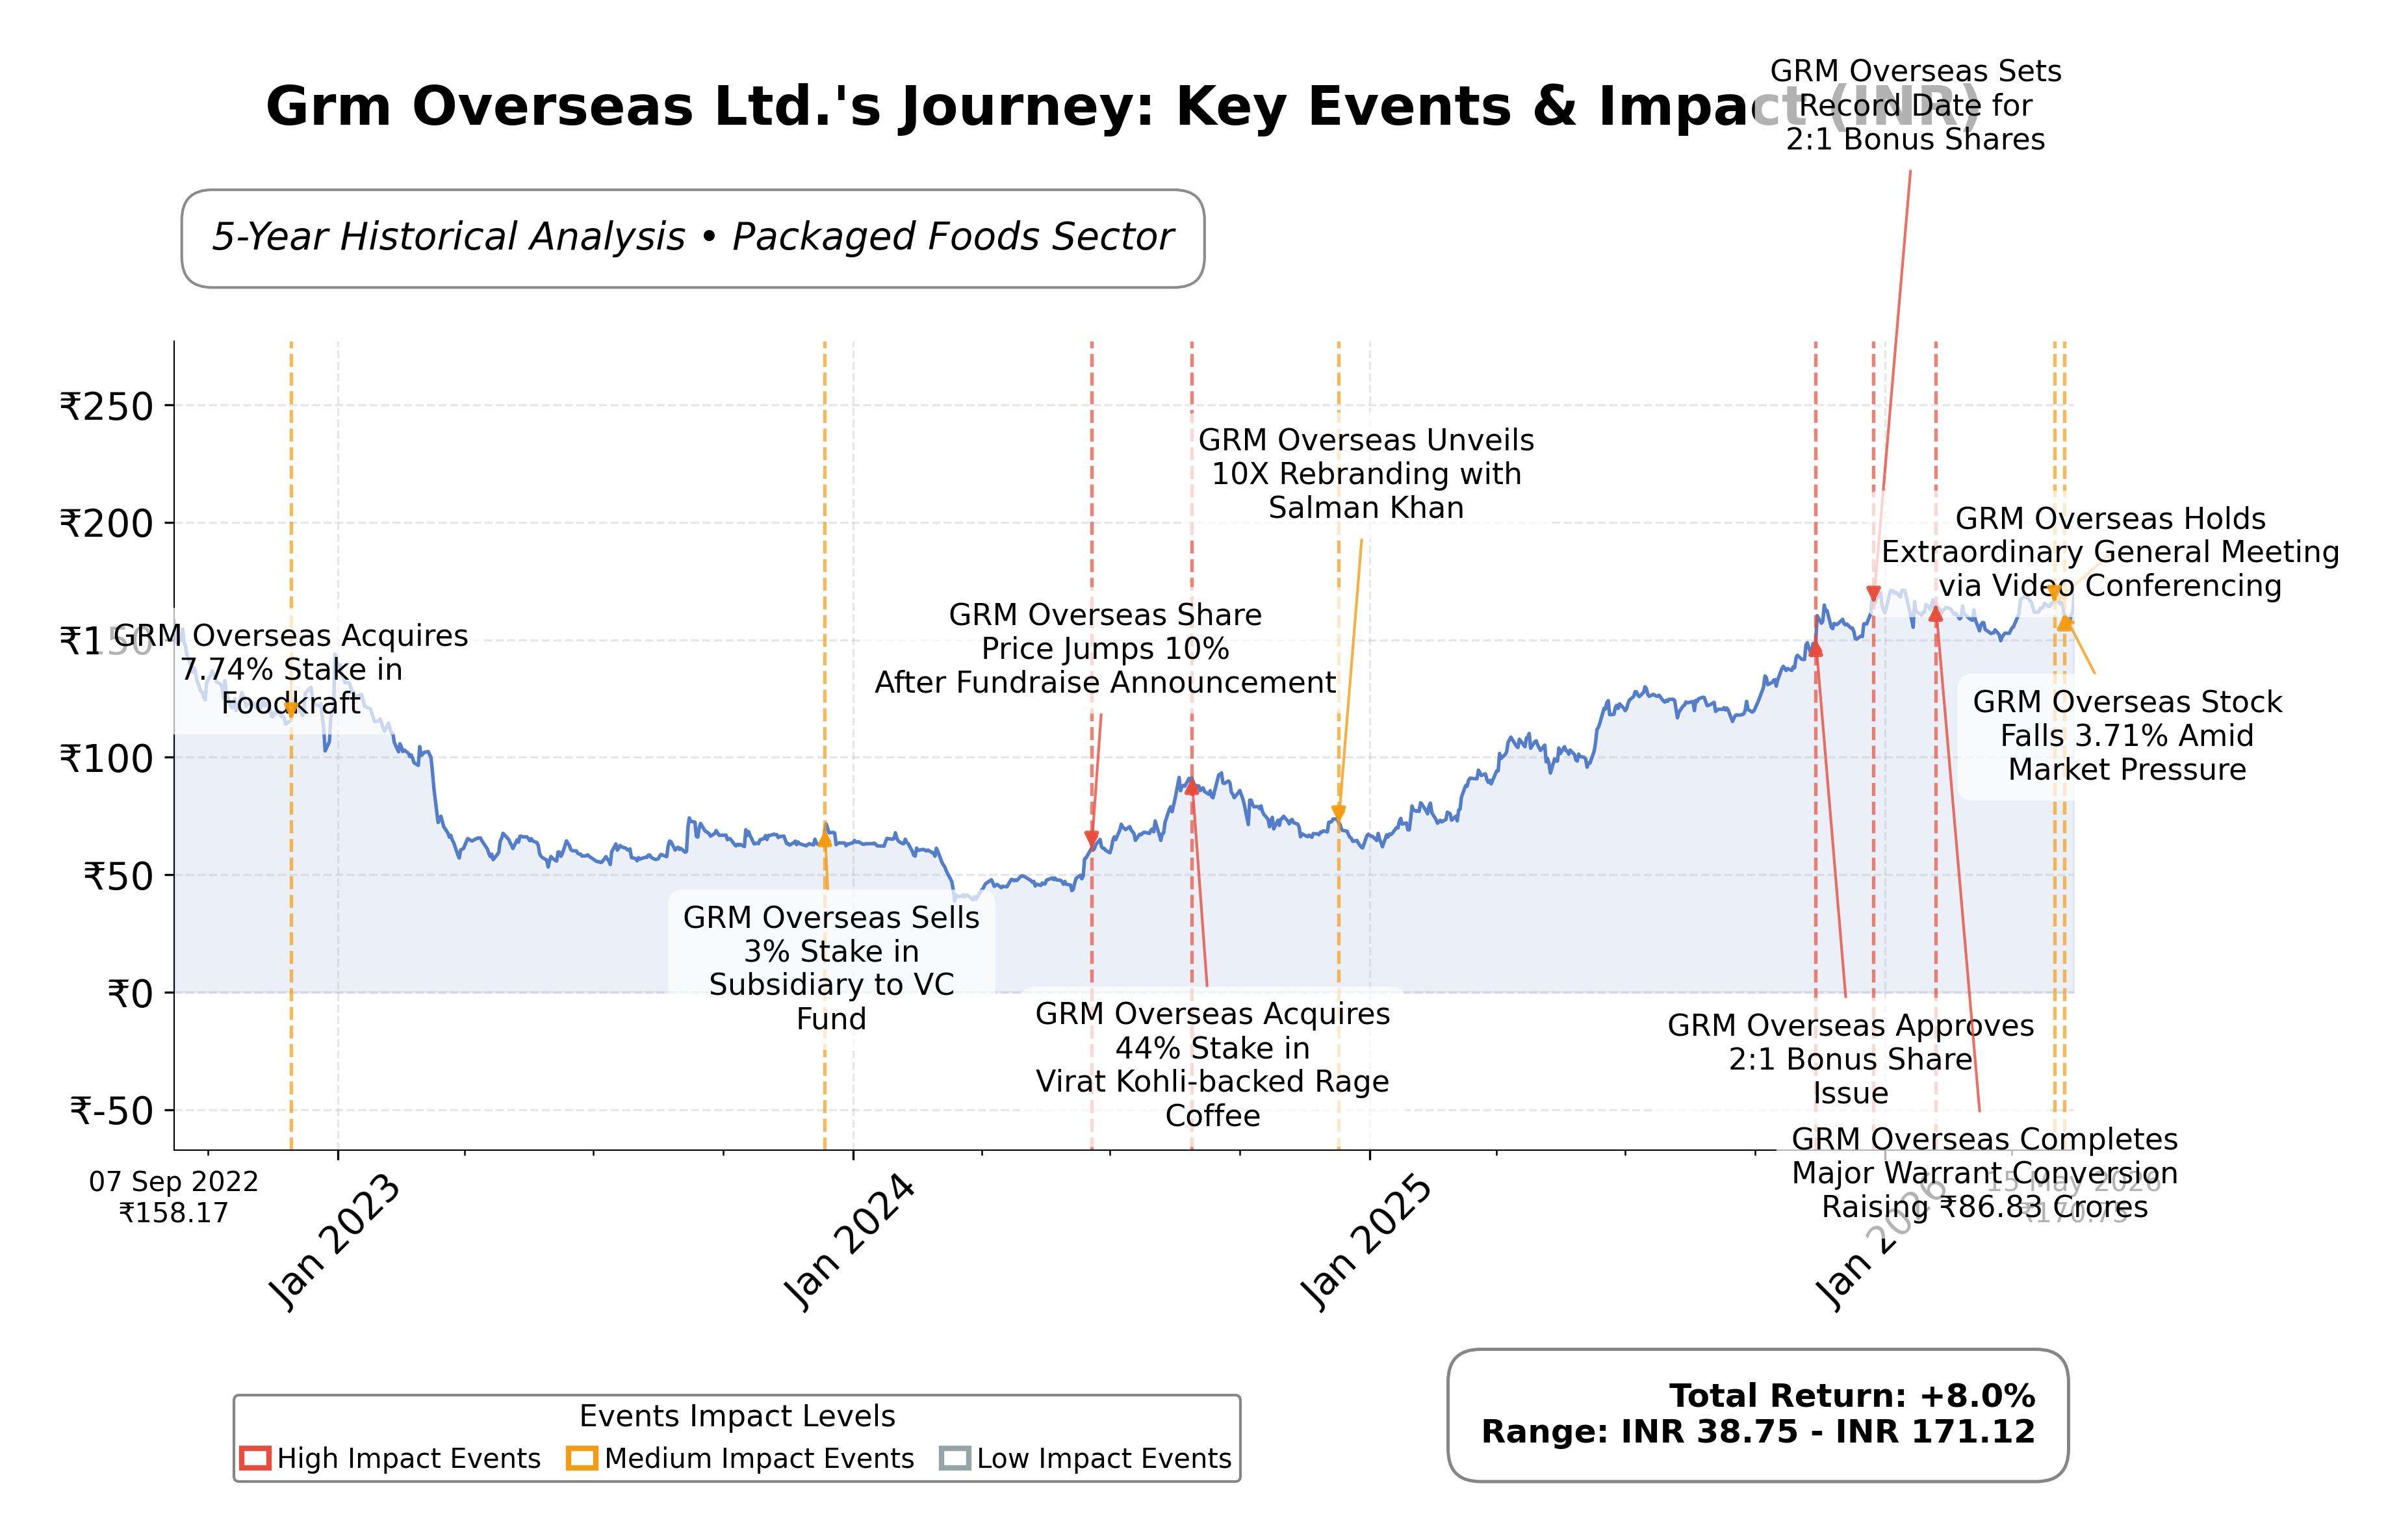
Stock Journey
Key Positives and Key Risks
Pros
- Strong revenue growth of 30% quarterly and earnings growth of 42.2% year-over-year indicating robust business expansion.
- Healthy liquidity position with a current ratio of 2.13 supporting operational stability.
- Competitive return on equity at 14.15% reflecting efficient capital utilization.
Cons
- High trailing P/E ratio of 50.48 suggests the stock is trading at a premium valuation relative to earnings.
- Modest operating cash flow of INR 85.7 million TTM compared to market capitalization may limit financial flexibility.
- Debt-to-equity ratio of 44.14% indicates moderate leverage that could constrain future borrowing capacity.
Disclosure: This information is for general awareness and does not constitute investment advice
Report Summary
Grm Overseas Ltd. operates primarily in the agri-business sector with a focus on processing and marketing premium basmati rice. Listed on the NSE under the Consumer Defensive sector, the company serves both domestic and international markets, leveraging advanced milling technologies and innovative packaging solutions. Its product portfolio caters to retail consumers and hospitality sectors, positioning it as a significant player in the packaged foods industry. The company’s strategic emphasis on quality and supply chain stability supports its role in enhancing agricultural exports and meeting global demand for premium rice varieties.
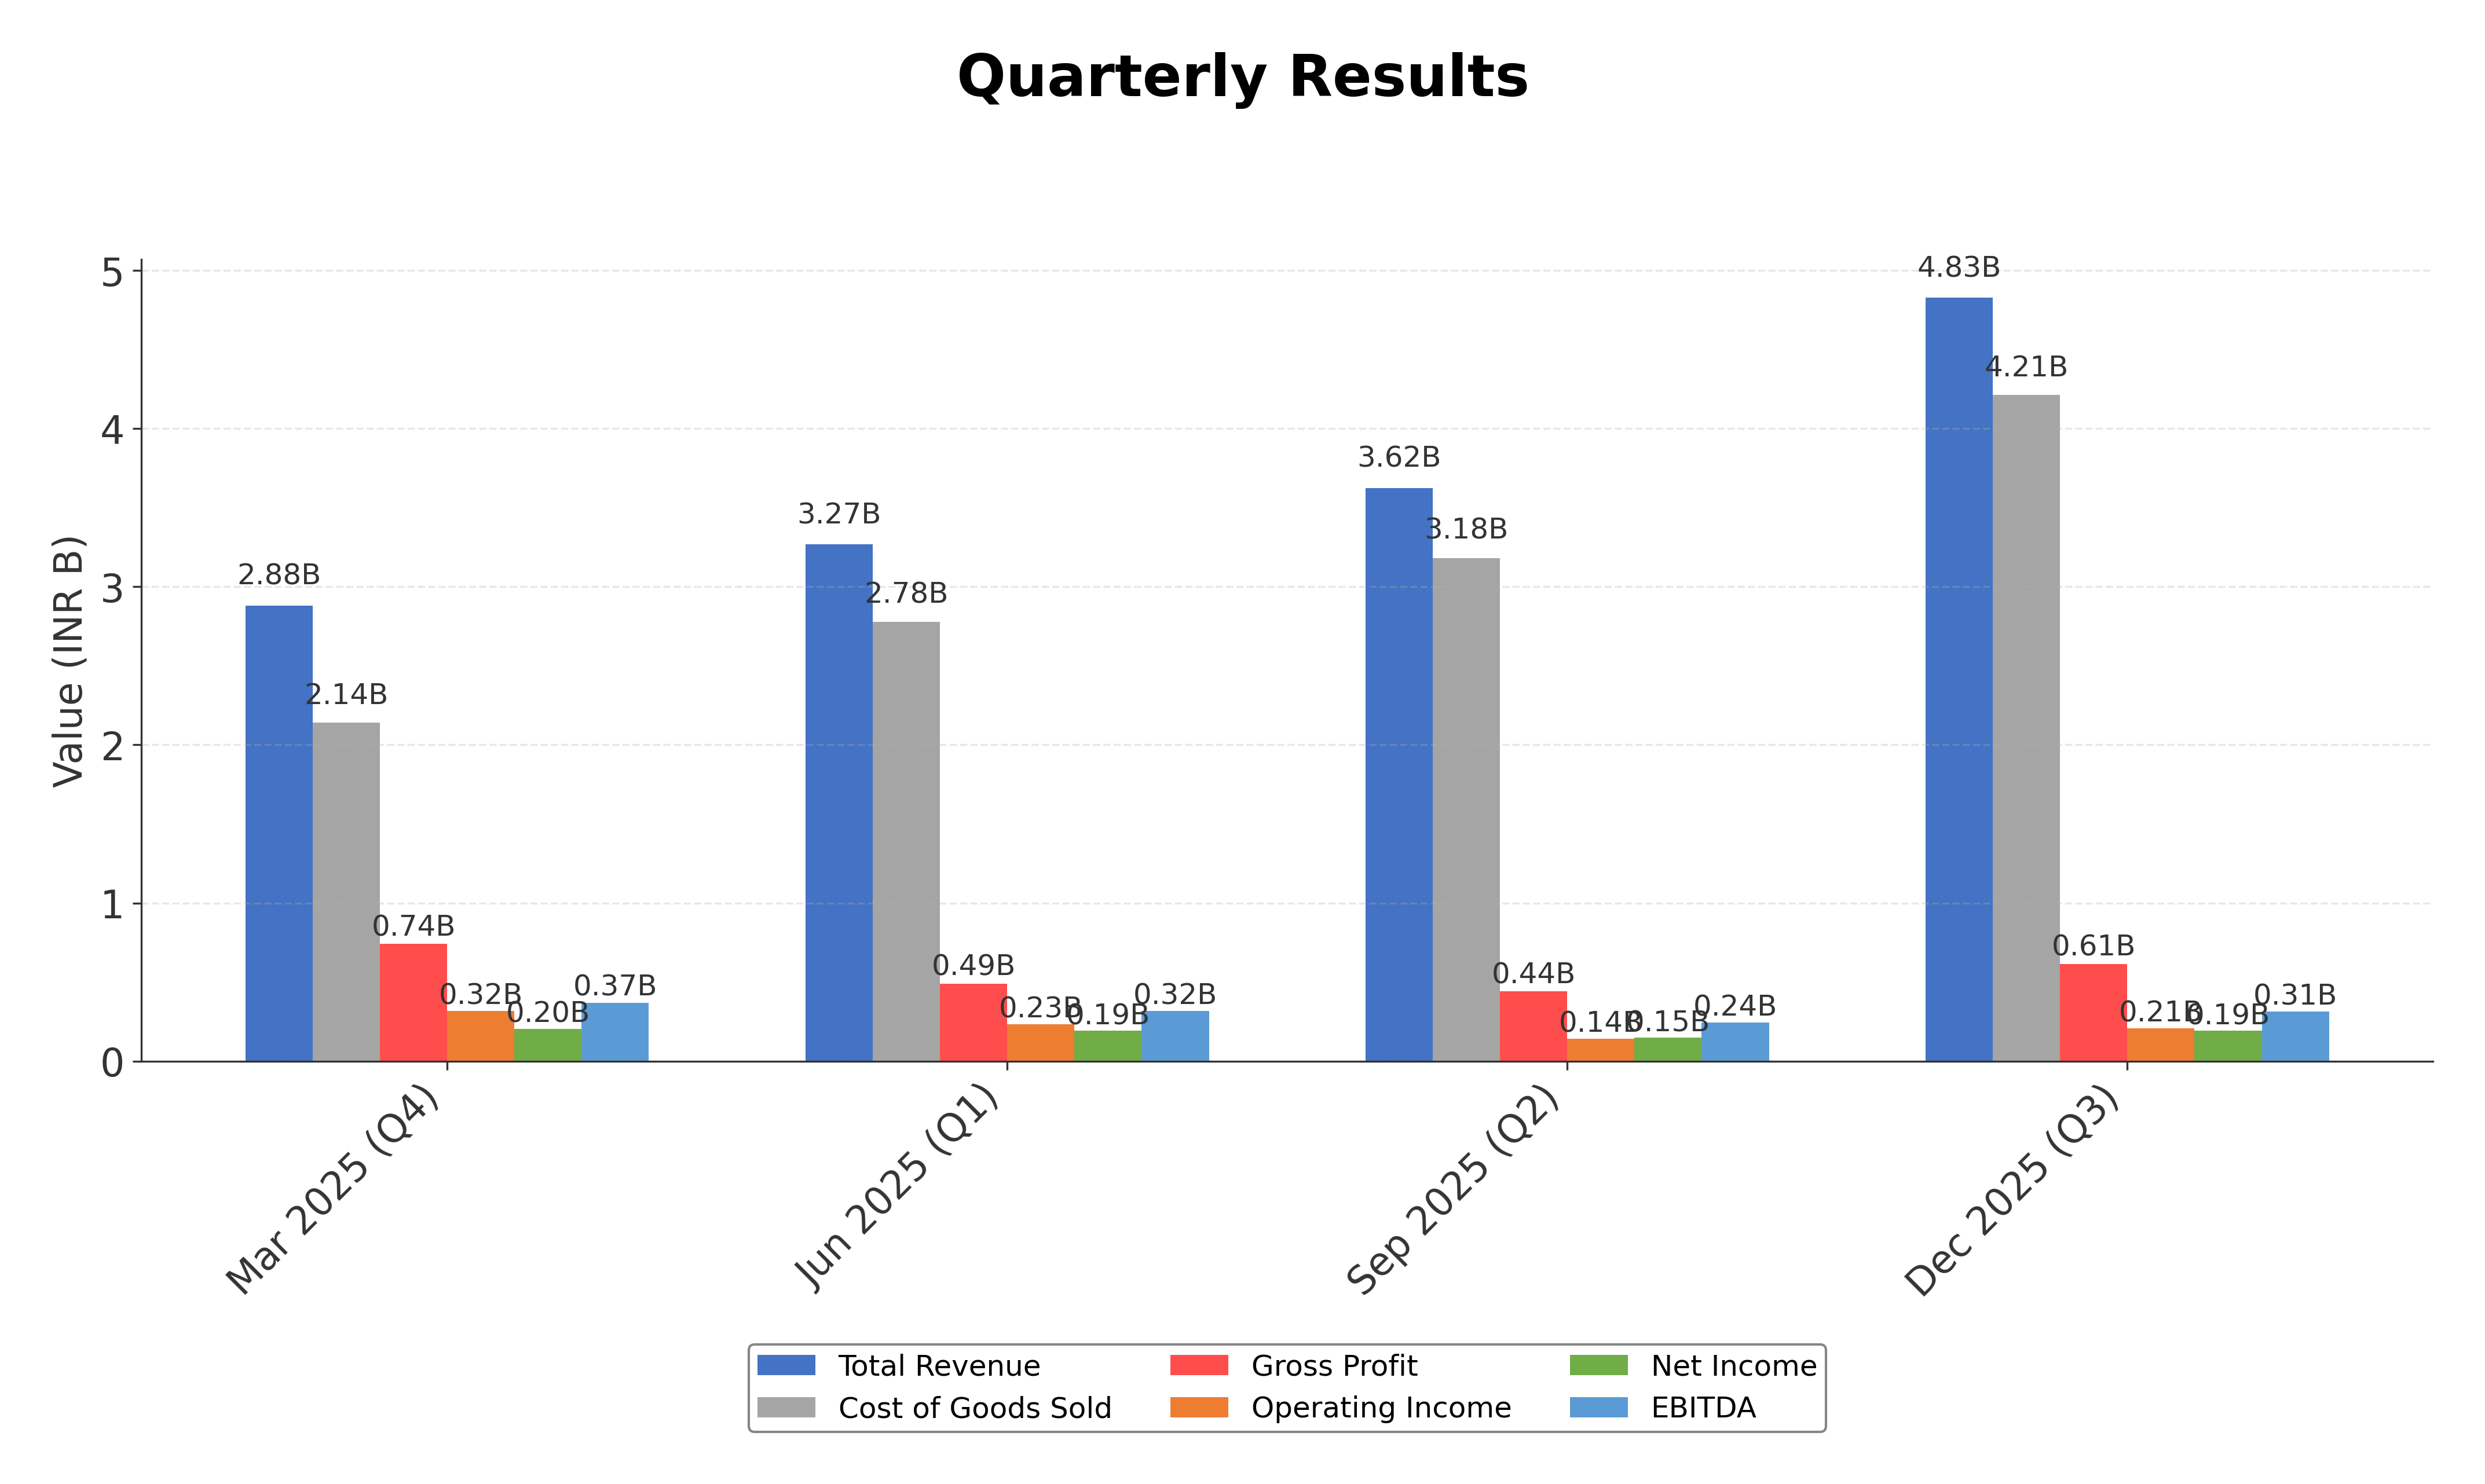
Financially, Grm Overseas Ltd. reported trailing twelve months (TTM) revenue of approximately INR 14.63 billion with a gross margin of 12.74%, operating margin of 4.27%, and net profit margin of 4.99%. The company’s return on equity (ROE) stands at 14.15%, and return on assets (ROA) at 6.65%, indicating moderate profitability and efficient asset utilization. EBITDA for the period was INR 1.24 billion, and net income to common shareholders was INR 729.5 million, reflecting steady earnings growth with quarterly revenue growth of 30% and quarterly earnings growth year-over-year of 42.2%.
Valuation metrics show a trailing price-to-earnings (P/E) ratio of 50.48, price-to-book (P/B) ratio of 6.22, and an enterprise value to EBITDA (EV/EBITDA) multiple of 34.20, suggesting the stock is priced at a premium relative to earnings and book value. The market capitalization is approximately INR 35.43 billion, with the stock trading at INR 171, near its 52-week high of INR 185.45 and well above its 52-week low of INR 93.03. The PEG ratio of 1.28 indicates valuation relative to earnings growth.
Key strengths include a strong current ratio of 2.13, indicating solid short-term liquidity, and a manageable debt-to-equity ratio of 44.14%, reflecting moderate leverage. The company’s strategic initiatives include shareholder approval for entry into new business sectors and director reappointment, signaling governance stability and growth orientation. Risks involve the competitive packaged foods market, regulatory challenges in agri-business, and sensitivity to commodity price fluctuations. Recent technical momentum shows mixed signals with some short-term price declines amid overall positive longer-term trends.
The company’s current trajectory reflects a nuanced technical setup with price action near key moving averages and momentum indicators showing mild bullishness. Market sentiment appears cautious with recent price volatility, suggesting conditions for careful monitoring. The data indicates a balanced environment where accumulation or realization of gains could be considered depending on evolving market factors.
Company and Industry Overview
Company Basics
Price Performance
Company Size
Shareholding Pattern
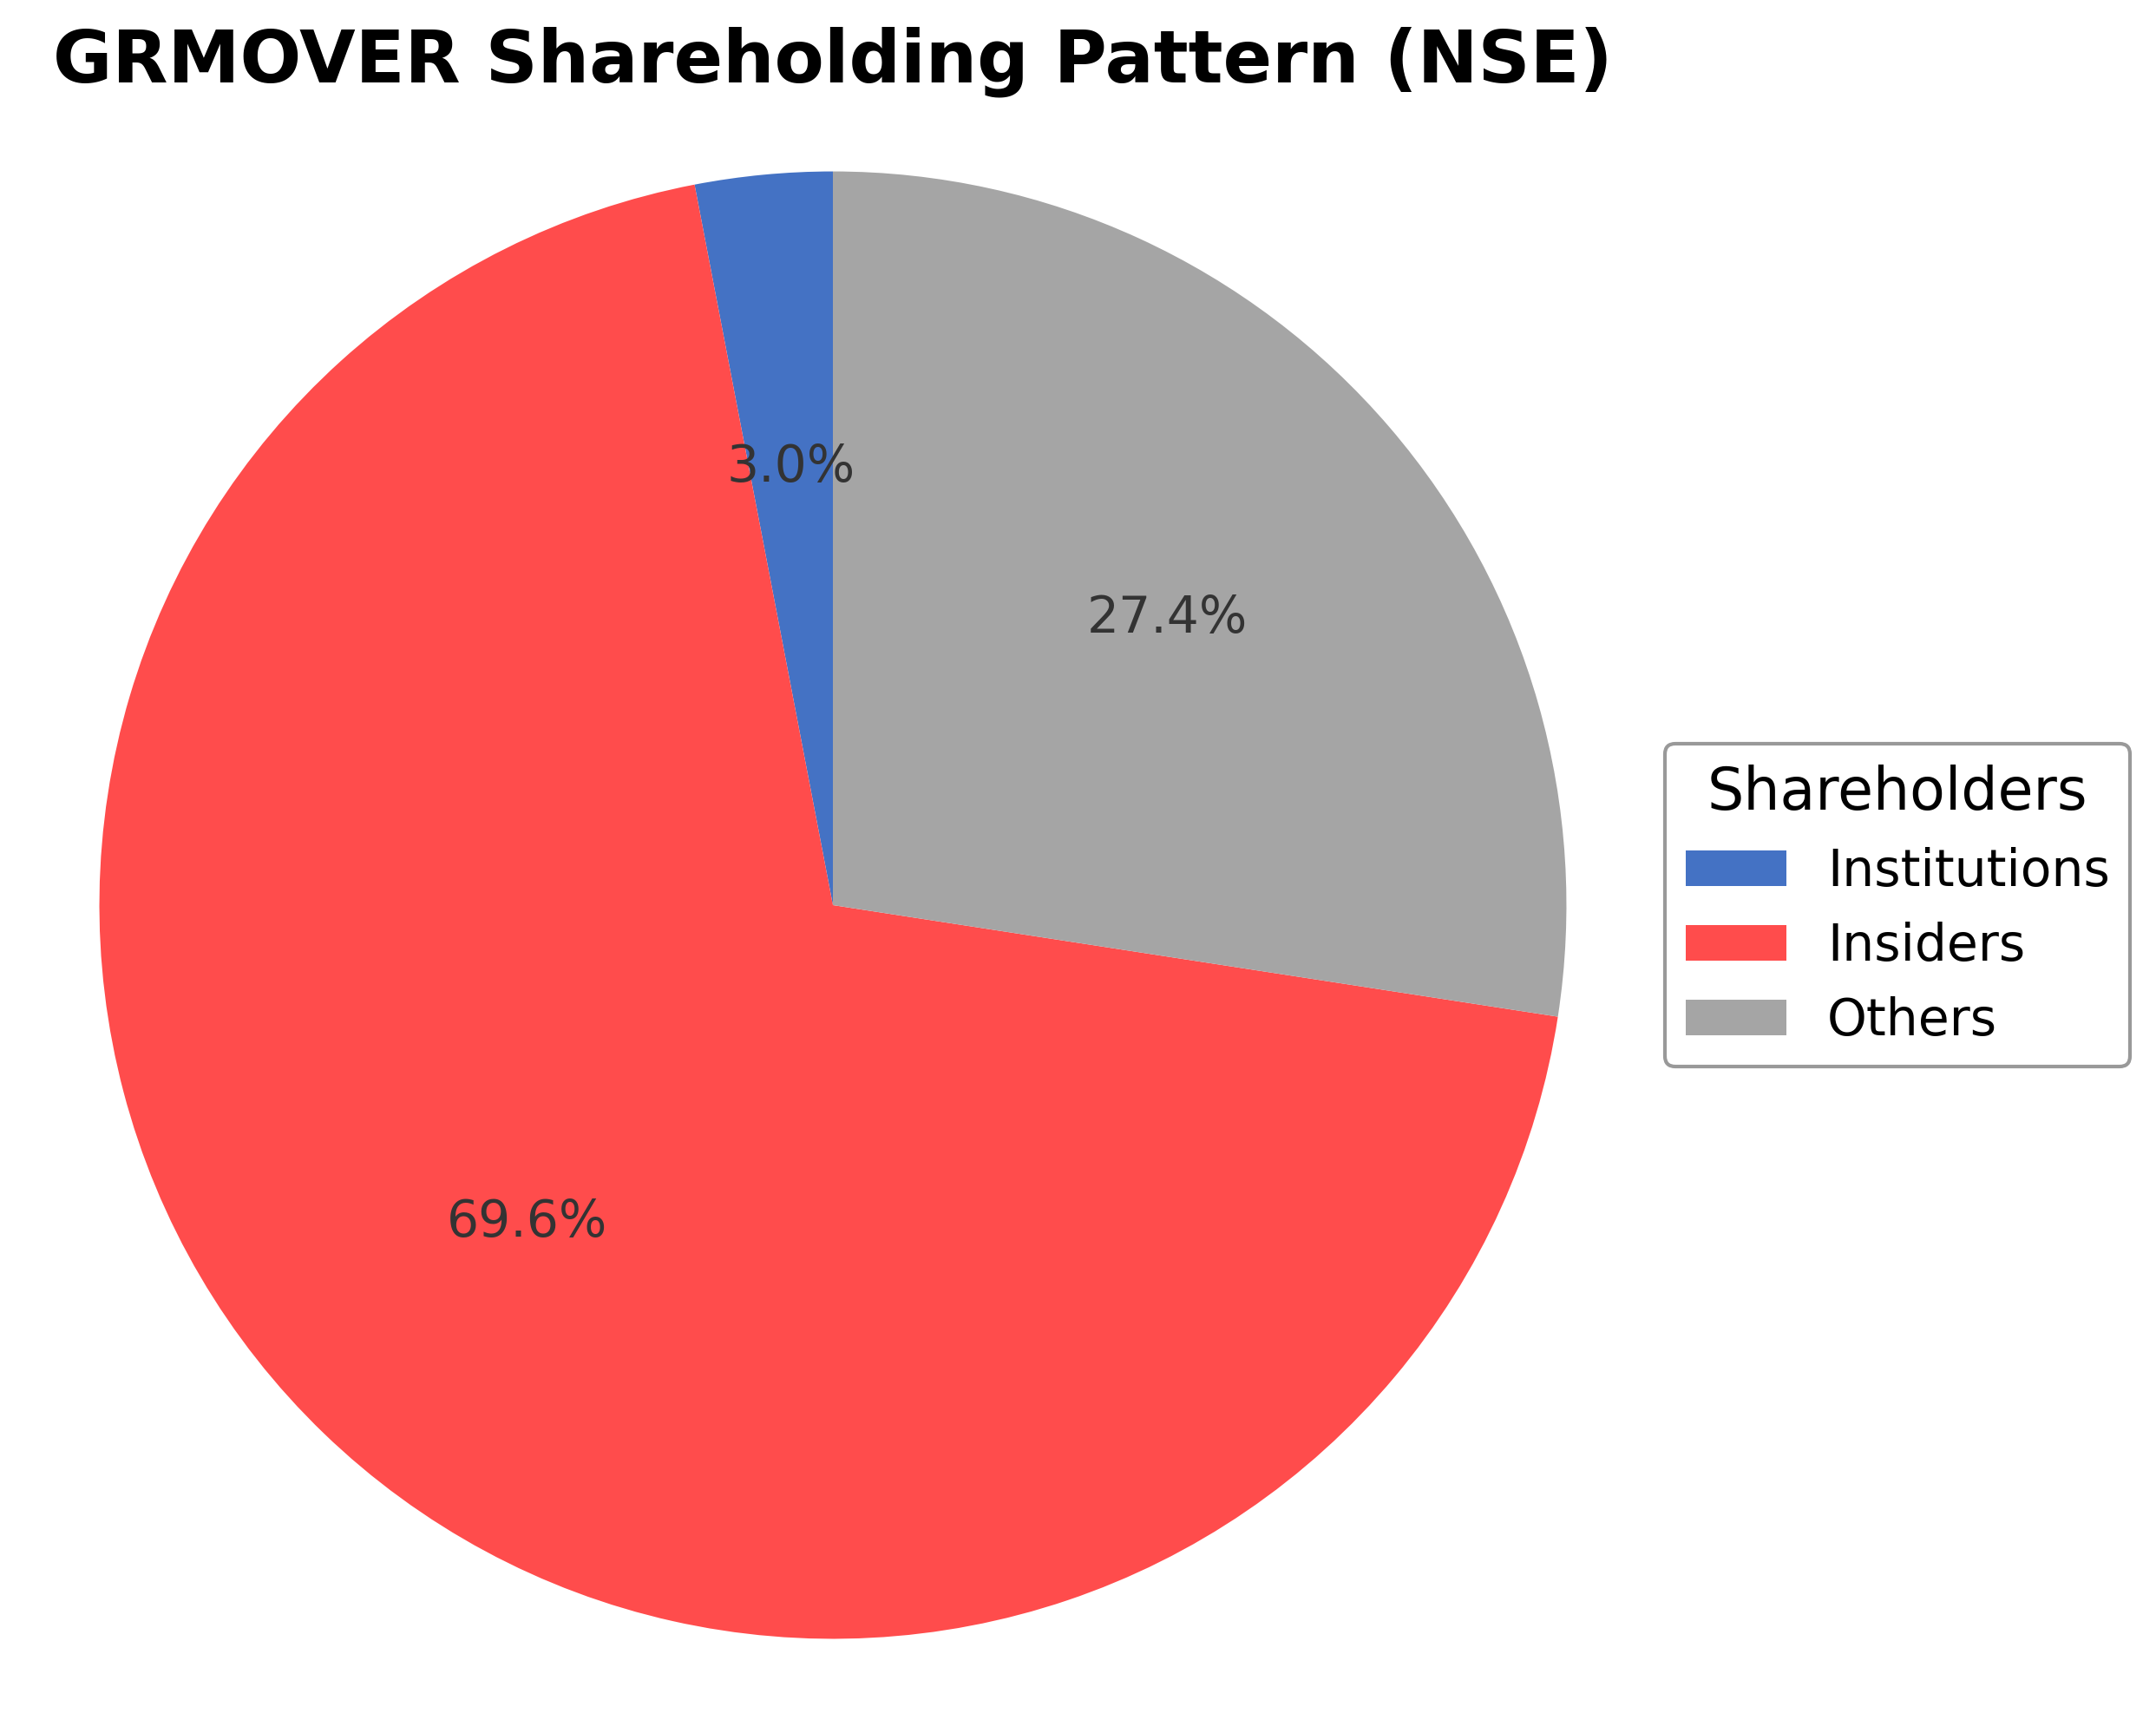
The shareholding structure of Grm Overseas Ltd. is dominated by insiders, including executives and board members, who hold approximately 69.55% of the shares, reflecting strong promoter control. Institutional investors own a modest 3.02%, indicating limited but stable institutional participation, while the public and other shareholders account for around 27.43%. Over the past 12 to 24 months, there have been no significant shifts in major ownership stakes, suggesting steady governance and shareholder confidence. Institutional accumulation appears limited, with no major funds reported increasing or decreasing positions recently. This ownership pattern suggests a governance framework heavily influenced by promoters, with moderate external oversight, which could impact strategic decisions and corporate direction. The current structure supports continuity but may limit broader market influence on company policies.
Sector and Industry Analysis
The food processing sector in India is a significant contributor to the economy, with a market size estimated in the hundreds of billions of dollars and a growth trajectory driven by rising consumer demand, urbanization, and increasing exports. The sector encompasses a wide range of products including processed fruits and vegetables, dairy, meat, and packaged foods. Key players include both large multinational corporations and numerous domestic companies such as GRM Overseas Ltd., which operate across various segments of the value chain.
Industry trends highlight a shift towards value-added and convenience foods, driven by changing consumer lifestyles and preferences for healthier and ready-to-eat options. Technological advancements and supply chain improvements have enhanced product quality and shelf life, while barriers to entry remain moderate due to capital intensity and regulatory compliance requirements. Competitive dynamics are shaped by product innovation, branding, and distribution network expansion, with companies focusing on export markets to diversify revenue streams.
The regulatory landscape for the food processing industry is governed by multiple agencies including the Food Safety and Standards Authority of India (FSSAI), which enforces standards on food quality, safety, and labeling. Recent regulations emphasize traceability, hygiene, and packaging norms to protect consumer health and boost exports. Government initiatives such as the Mega Food Parks Scheme and incentives for cold chain infrastructure aim to improve sector efficiency and competitiveness, supporting a positive outlook for sustained growth.
Note: Analysis synthesized from industry research, market reports, and regulatory filings. Information is subject to change based on market conditions.
Financial Ratios Dashboard
Illustrative Scenario Analysis
DCF Assumptions:
Method: Two-Stage EPS-Priority Model
Financials
Peer Analysis
| Company Name | Market Cap | P/E Ratio | P/B Ratio | EV/EBITDA | Price to CFO |
|---|---|---|---|---|---|
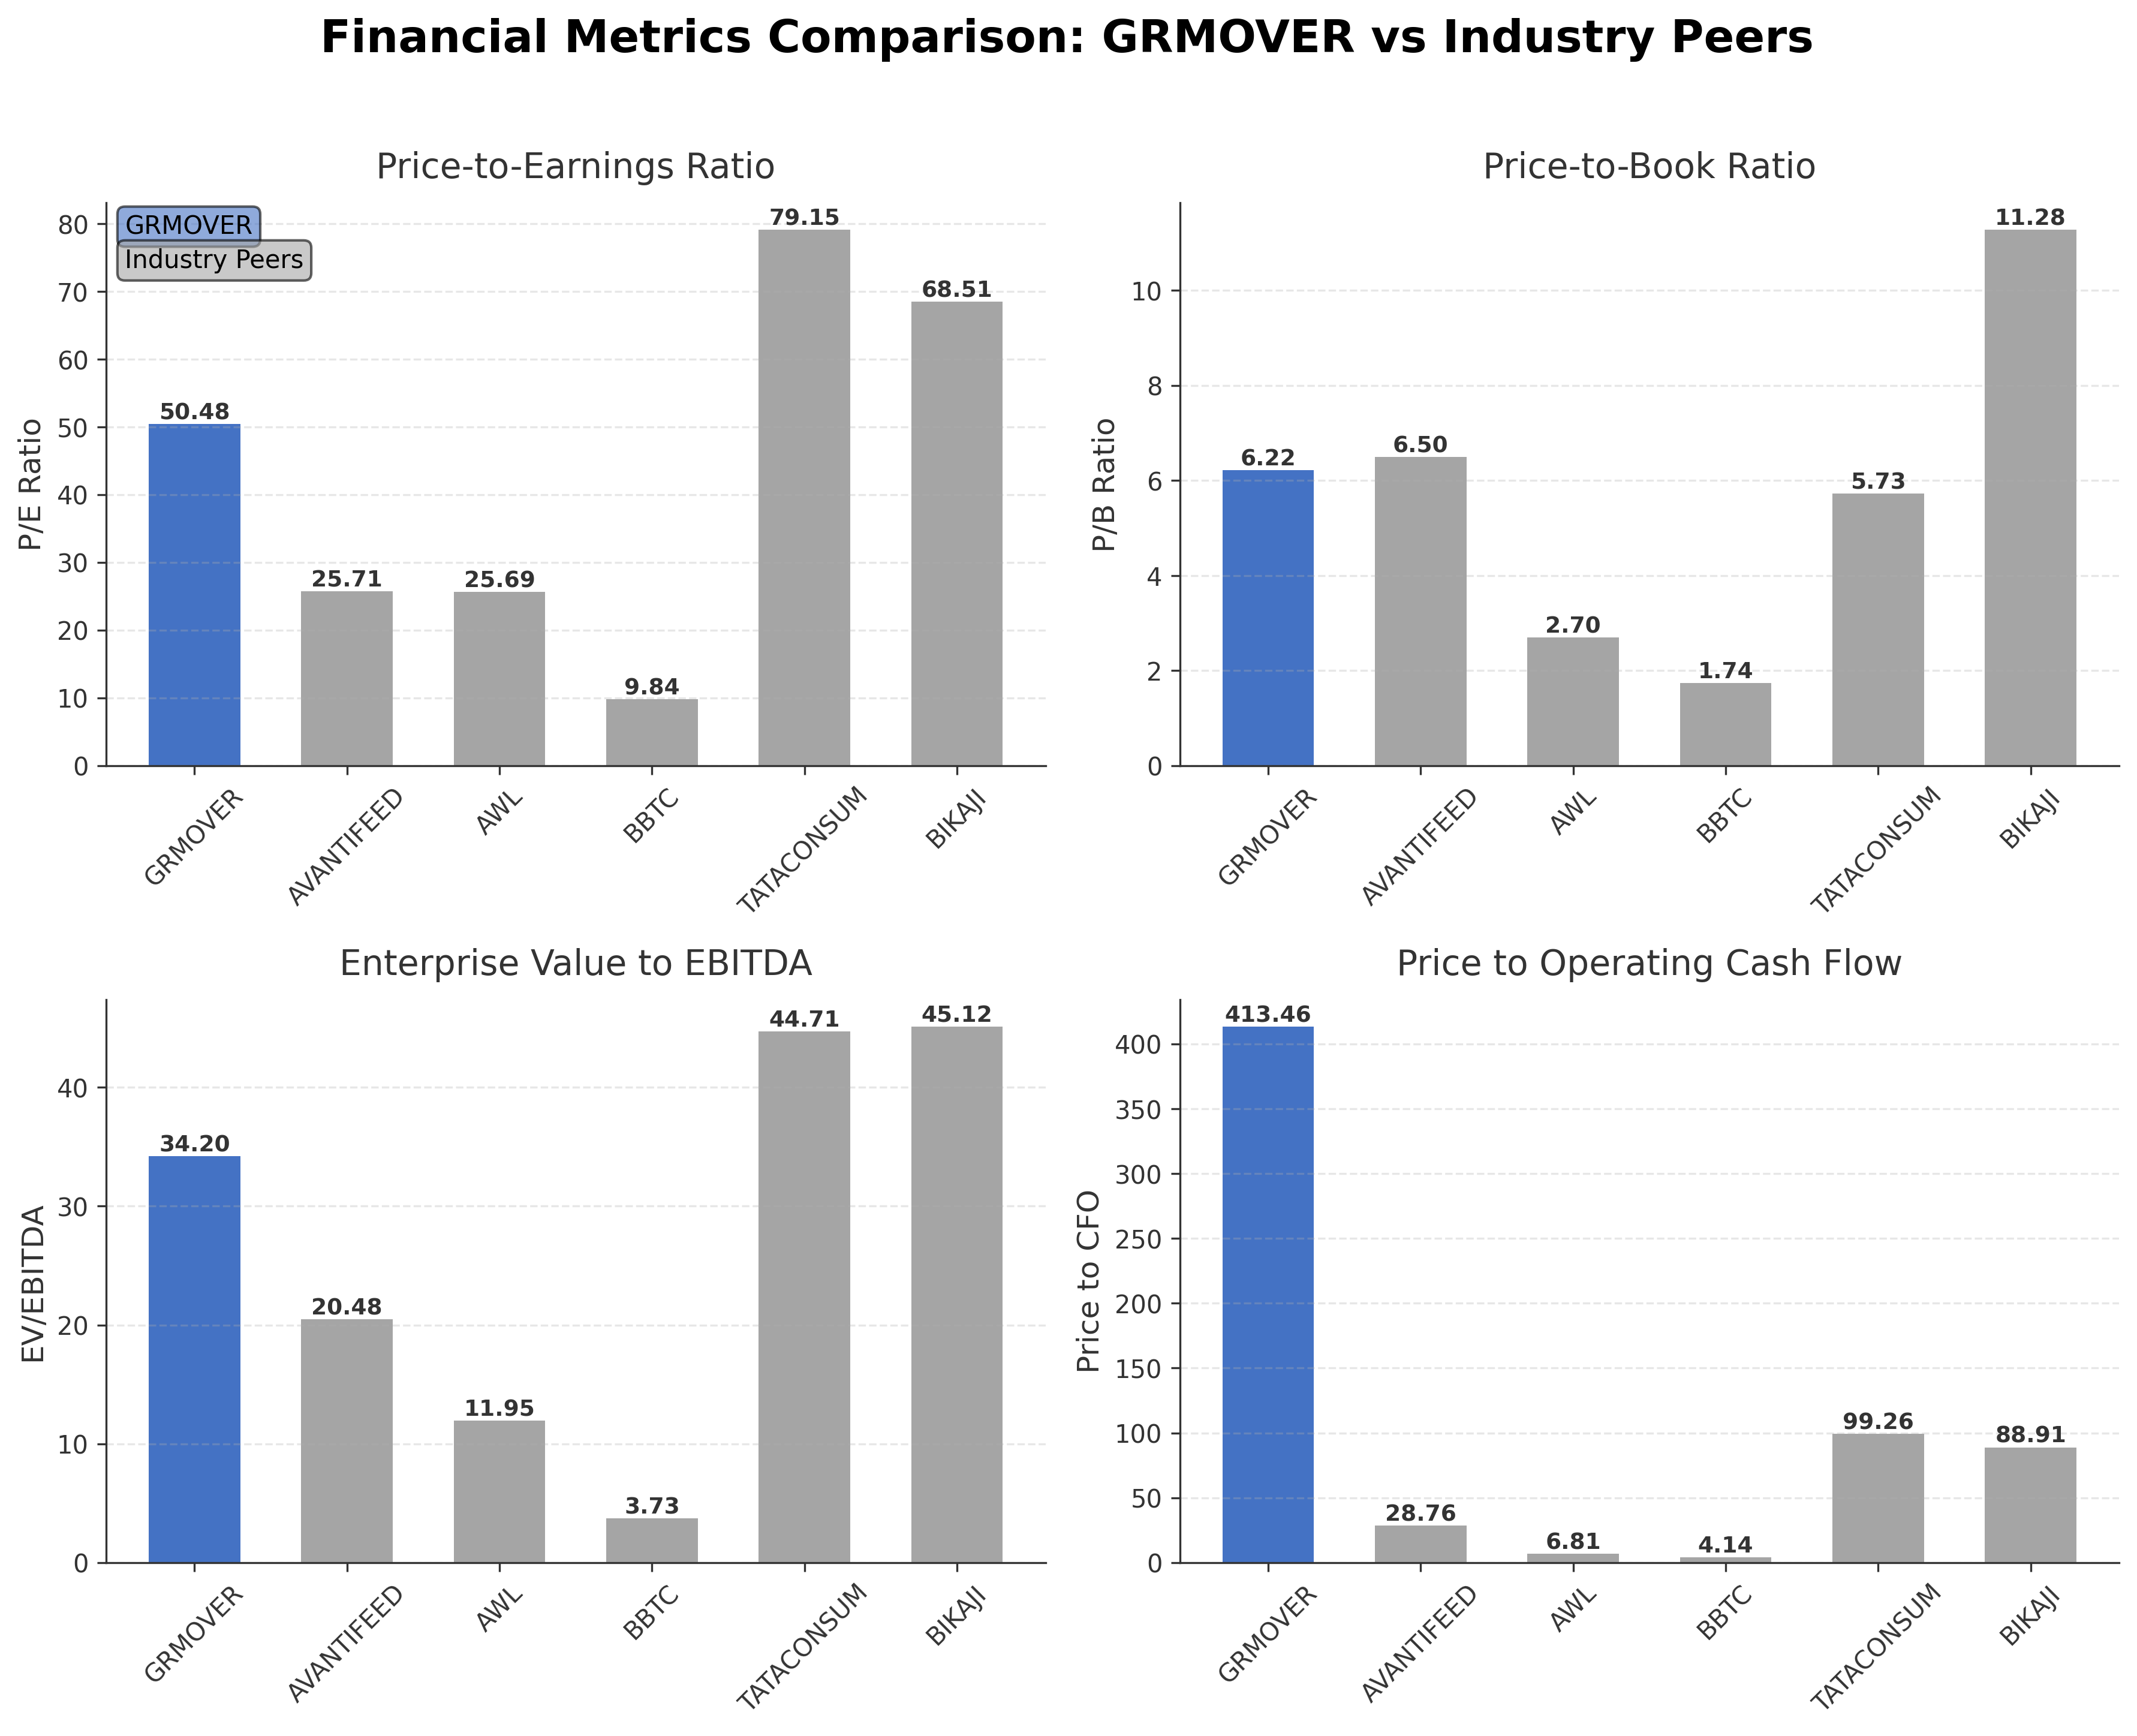
| Grm Overseas Ltd. | ₹35.43B | 50.48 | 6.22 | 34.20 | 413.46 |
| Avanti Feeds Ltd. | ₹195.54B | 25.71 | 6.50 | 20.48 | 28.76 |
| Ador Welding Ltd. | ₹267.53B | 25.69 | 2.70 | 11.95 | 6.81 |
| Bombay Burmah Trading Corporation Limited | ₹108.95B | 9.84 | 1.74 | 3.73 | 4.14 |
| Tata Consumer Products Ltd. | ₹1.16T | 79.15 | 5.73 | 44.71 | 99.26 |
| Bikaji Foods International Ltd. | ₹168.43B | 68.51 | 11.28 | 45.12 | 88.91 |
Comparison Analysis: Grm Overseas Ltd. trades at a higher P/E ratio of 50.48 compared to most peers, indicating a premium valuation relative to earnings. Its P/B ratio of 6.22 is moderate within the peer group, higher than Ador Welding and Bombay Burmah but lower than Bikaji Foods. The EV/EBITDA multiple of 34.20 is elevated, suggesting the stock is valued richly relative to operating cash flow. The price to CFO ratio is significantly higher than peers, reflecting lower operating cash flow relative to price. Return on equity at 14.15% is competitive, comparable to Bombay Burmah and Bikaji Foods, but below Avanti Feeds. Overall, Grm Overseas shows strengths in profitability but trades at a premium valuation compared to regional industry peers.
Financial Metrics Comparison with Peers
Financial Statements
Comprehensive financial data including income, balance sheet, and cash flow metrics
Income Statement
| fiscal_date | 2025-03-31 | 2024-03-31 | 2023-03-31 | 2022-03-31 | 2021-03-31 |
|---|---|---|---|---|---|
| Sales | 13.45B | 12.88B | 13.54B | 11.10B | 7.90B |
| Cost Of Goods | 11.24B | 11.24B | 11.36B | 8.95B | 5.97B |
| Gross Profit | 2.21B | 1.63B | 2.17B | 2.16B | 1.93B |
| Operating Expense Selling General And Administrative | 212.34M | 120.61M | 160.81M | 184.26M | 178.84M |
| Operating Expense Other Operating Expenses | 1.10B | 931.04M | 1.19B | 1.20B | 1.12B |
| Operating Income | 764.94M | 689.07M | 953.66M | 899.49M | 645.56M |
| Non Operating Interest Income | 10.32M | N/A | N/A | N/A | 563.00K |
| Non Operating Interest Expense | 169.49M | 194.07M | 182.60M | 110.16M | 93.83M |
| Pretax Income | 847.42M | 804.58M | 874.00M | 1.14B | 588.50M |
| Income Tax | 235.05M | 197.39M | 245.38M | 291.13M | 134.31M |
| Net Income | 612.36M | 607.19M | 628.62M | 845.23M | 454.18M |
| Eps Basic | 3.37 | 9.96 | 10.45 | 14.01 | 7.57 |
| Eps Diluted | 2.92 | 9.96 | 10.45 | 14.01 | 7.57 |
| Basic Shares Outstanding | 180.00M | 60.00M | 60.00M | 59.85M | 60.00M |
| Diluted Shares Outstanding | 180.00M | 60.00M | 60.00M | 59.85M | 60.00M |
| Ebit | 1.02B | 998.65M | 1.06B | 1.25B | 682.33M |
| Ebitda | 1.05B | 987.09M | 1.10B | 1.28B | 711.12M |
| Net Income Continuous Operations | 847.42M | 804.58M | 874.00M | 1.14B | 588.50M |
| Minority Interests | -6.41M | -9.38M | -1.85M | -6.84M | -1.95M |
| Preferred Stock Dividends | 0.00 | 0.00 | 0.00 | 0.00 | 0.00 |
Source: Financial statements and regulatory filings
Balance Sheet
| fiscal_date | 2025-03-31 | 2024-03-31 | 2023-03-31 | 2022-03-31 | 2021-03-31 |
|---|---|---|---|---|---|
| Cash And Cash Equivalents | 494.19M | 65.52M | 31.39M | 76.13M | 47.20M |
| Accounts Receivable | 4.80B | 4.82B | 4.03B | 4.04B | 2.53B |
| Total Assets | 9.11B | 7.70B | 7.84B | 6.67B | 4.15B |
| Total Liabilities | 4.82B | 4.38B | 5.09B | 4.60B | 2.80B |
| Long Term Debt | 15.93M | 1.47M | 3.38M | 4.43M | 126.00K |
| Shareholders Equity | 4.28B | 3.33B | 2.75B | 2.07B | 1.35B |
Source: Financial statements and regulatory filings
Cash Flow Statement
| fiscal_date | 2025-03-31 | 2024-03-31 | 2023-03-31 | 2022-03-31 | 2021-03-31 |
|---|---|---|---|---|---|
| Operating Activities Net Income | 847.42M | 804.58M | 874.00M | 1.14B | 588.50M |
| Operating Activities Other Non Cash Items | 157.81M | 189.91M | -187.50M | 128.21M | 116.50M |
| Operating Activities Accounts Receivable | 43.70M | -808.51M | 82.65M | -1.60B | -27.62M |
| Operating Activities Other Assets Liabilities | -963.23M | 953.49M | -1.18B | -860.98M | -533.21M |
| Operating Activities Operating Cash Flow | 85.70M | 1.14B | -406.98M | -1.20B | 144.16M |
| Investing Activities Capital Expenditures | -65.11M | -21.93M | -49.37M | -45.74M | -8.82M |
| Investing Activities Net Acquisitions | -100.00M | N/A | N/A | N/A | N/A |
| Investing Activities Purchase Of Investments | -2.88M | -26.36M | -5.18M | -28.13M | -1.00M |
| Investing Activities Sale Of Investments | 80.39M | 1.24M | 0.00 | 12.70M | 665.00K |
| Investing Activities Investing Cash Flow | -87.60M | -47.05M | -54.55M | -61.18M | -9.15M |
| Financing Activities Long Term Debt Issuance | 14.46M | N/A | 178.00K | 5.99M | N/A |
| Financing Activities Long Term Debt Payments | -303.88M | -200.05M | N/A | N/A | -224.13M |
| Financing Activities Short Term Debt Issuance | -303.88M | -198.14M | 747.41M | 1.50B | -223.04M |
| Financing Activities Common Stock Issuance | 340.12M | 0.00 | 0.00 | 672.00K | 8.66M |
| Financing Activities Other Financing Charges | -1.00K | -1.00K | 169.40M | 25.68M | 100.11M |
| Financing Activities Financing Cash Flow | -253.18M | -398.19M | 889.98M | 1.38B | -435.65M |
| End Cash Position | 494.19M | 65.52M | 31.39M | 76.13M | 47.20M |
| Free Cash Flow | 548.22M | 449.32M | -939.23M | -1.20B | 341.45M |
| Investing Activities Other Investing Activity | N/A | 1.00K | N/A | -1.00K | 1.00K |
| Financing Activities Common Dividends | N/A | N/A | -27.00M | -159.00M | -97.25M |
Source: Financial statements and regulatory filings
Technical Analysis
Key Insights
- The current trend shows a mild bullish momentum with recent price action near the 50-day moving average at approximately ₹159.89 and above the 200-day moving average at ₹149.15, indicating medium to long-term support.
- Key support levels are identified near ₹150 and ₹160, while resistance is observed around the recent 52-week high near ₹185.
- The stock price is currently above the 10-day moving average, suggesting short-term upward momentum, but recent declines indicate some volatility.
- Momentum indicators show RSI in a neutral to slightly bullish range, MACD indicates a mild bullish crossover, and stochastic oscillators present mixed signals, reflecting indecision.
- Multi-timeframe analysis reveals daily charts showing consolidation, weekly charts indicating an overall uptrend, and monthly charts confirming longer-term strength.
- Potential market scenarios include a continuation of the current consolidation phase with possible upward breakout if resistance near ₹185 is breached, or a pullback toward support levels if selling pressure intensifies.
Trending News
Summary: IOB Share Price: Find the latest news on IOB Stock Price. Get all the information on IOB with historic price charts for NSE / BSE. Experts & Broker view also get the IOB Ltd. buy/sell tips detailed news, announcements, Forecasts, Analysts, Valuation, Earning forecasts, Estimates, Recommendations, ...
Sentiment: neutral
2. Headline: KKR-backed ambulance giant GMR valued at $3 billion as shares fall in NYSE debut | Reuters
Summary: Emergency medical services heavyweight GMR Solutions was valued at $3.01 billion after its shares fell 10% in its New York Stock Exchange debut on Wednesday, adding to a string of subdued listings in recent weeks.
Sentiment: negative
3. Headline: GRM Overseas Ltd is Rated Hold
Summary: GRM Overseas Ltd is rated 'Hold' by MarketsMOJO, with this rating last updated on 05 Feb 2026. However, the analysis and financial metrics discussed here reflect the stock's current position as of 12 May 2026, providing investors with an up-to-date view of the company’s fundamentals, returns, ...
Sentiment: neutral
4. Headline: Why is GRM Overseas Ltd falling/rising?
Summary: GRM Overseas Ltd has been under pressure in the short term, with the stock falling by 5.93% over the past week and 7.07% in the last month. This contrasts with the broader Sensex, which declined by a more modest 1.62% and 1.98% respectively over the same periods.
Sentiment: negative
5. Headline: GRM Overseas Ltd Technical Momentum Shifts Amid Mixed Indicator Signals
Summary: GRM Overseas Ltd, a small-cap player in the Other Agricultural Products sector, has experienced a nuanced shift in its technical momentum, moving from a bullish to a mildly bullish stance. Despite a day-on-day price decline of 2.34%, the stock’s technical indicators present a complex picture, ...
Sentiment: positive
Recent Updates
News Summary
As of 2026-05-02. Grm Overseas Ltd conducted an Extraordinary General Meeting on May 2, 2026, where shareholders approved the company’s entry into new business sectors and reappointed a director, indicating strategic growth initiatives and leadership continuity. The meeting was attended by 158 members via video conference, demonstrating active shareholder engagement. The voting results published confirm strong shareholder support for these proposals, reflecting confidence in the company’s governance and future direction. These developments are material as they may influence the company’s expansion and operational focus going forward.
News Sentiment
The overall sentiment from recent updates is cautiously positive, driven by shareholder approval of strategic initiatives and leadership reappointment. The active participation in the EGM and transparent communication of voting results contribute to a constructive governance outlook. Neutral tones arise from the absence of immediate financial impact announcements, while positive sentiment is anchored in the company’s forward-looking expansion plans. This balanced sentiment suggests stable investor confidence without significant near-term volatility.
Source List
- https://tipranks.com/news/company-announcements/grm-overseas-publishes-voting-results-of-may-2-egm
- https://whalesbook.com/corporate-news/English/agriculture/GRM-Overseas-Shareholders-Back-New-Sectors-Director-Reappointment/69f5e7889d1c9066481d7c97
Analytical Overview
Analysis Summary
Grm Overseas Ltd.’s valuation metrics show a trailing P/E ratio of 50.48, which is elevated compared to the industry average, reflecting a premium pricing relative to earnings. The absence of a forward P/E limits forward-looking valuation assessment, but the PEG ratio of 1.28 suggests valuation is somewhat aligned with growth expectations. The company’s revenue growth rate of 30% quarterly and positive earnings growth of 42.2% year-over-year indicate a robust growth trajectory supported by improving cash flow trends, although operating cash flow remains modest relative to price.
Financial health is moderate, with a debt-to-equity ratio of 44.14% indicating manageable leverage, and a strong current ratio of 2.13 reflecting good liquidity. Operating cash flow is positive but relatively low at INR 85.7 million TTM, while free cash flow is stronger at INR 606 million, supporting operational sustainability. Sector-specific challenges include commodity price volatility and regulatory compliance in agri-business, while opportunities arise from expanding health-focused product lines and global demand for premium rice.
Considering the Indian market environment, regulatory frameworks governing agricultural exports and consumer trends toward healthier food products are relevant factors. Economic outlook improvements and rising health awareness support growth potential, while competitive pressures in the packaged foods sector require strategic agility.
Overall Business and Market Assessment
Supporting Factors: strong revenue and earnings growth, a solid liquidity position, and strategic shareholder support for expansion initiatives
Risk Factors: the high valuation multiples relative to peers, potential commodity price fluctuations, and the company’s modest operating cash flow
SWOT Analysis
Strengths
- Strong revenue growth of 30% quarterly and earnings growth of 42.2% year-over-year.
- Robust liquidity with a current ratio of 2.13 indicating good short-term financial health.
- Competitive return on equity at 14.15% demonstrating effective use of shareholder capital.
- Strategic shareholder approval for expansion into new sectors and leadership continuity.
Weaknesses
- High trailing P/E ratio of 50.48 suggesting premium valuation relative to earnings.
- Modest operating cash flow of INR 85.7 million TTM compared to market capitalization.
- Debt-to-equity ratio of 44.14% indicating moderate leverage which may constrain flexibility.
- Limited institutional ownership at 3.02% potentially reducing external oversight.
Opportunities
- Expansion into health-focused product lines addressing rising demand for healthier foods.
- Growing global demand for premium basmati rice supporting export potential.
- Innovative packaging solutions enhancing product differentiation in competitive markets.
- Favorable Indian regulatory environment for agricultural exports and food safety.
Threats
- Volatility in commodity prices impacting raw material costs and margins.
- Intense competition in the packaged foods sector from established and emerging players.
- Regulatory changes or trade restrictions affecting export markets.
- Potential market volatility impacting stock price and investor sentiment.
Company Description
Grm Overseas Ltd. is a prominent player in the agri-business sector, primarily known for processing and marketing high-quality basmati rice. The company's operations encompass the production, milling, and distribution of rice, catering to both domestic and international markets. Grm Overseas Ltd. leverages modern milling technologies to ensure premium quality, aligning with the demands of a diverse customer base that includes retail consumers as well as hospitality sectors. The firm is also active in developing innovative packaging solutions and offers a variety of rice products that emphasize flavor and authenticity, ideal for culinary use in various global cuisines. Its commitment to quality and market adaptation positions Grm Overseas Ltd. as an influential contributor to the food industry. By ensuring a stable supply chain, the company supports food security and addresses global consumer needs efficiently. Grm Overseas Ltd.’s market presence not only boosts agricultural exports but also enhances its footprint in regions with a demand for premium rice varieties, thereby significantly impacting trade dynamics in the agri-business sector.