


GK Energy Limited (GKENERGY)
Stock Analysis Report
Stock Journey
Key Positives and Key Risks
Pros
- Return on equity of 37.26% indicates strong profitability and efficient capital use.
- Revenue growth of 35.2% quarter-over-quarter demonstrates robust business expansion.
- Current ratio of 2.95 reflects strong liquidity and ability to meet short-term obligations.
Cons
- Negative free cash flow of ₹-612.64 million suggests potential cash generation issues.
- Price to cash flow ratio of 52.61 is significantly higher than peers, indicating valuation concerns.
- Operating margin contraction despite revenue growth may pressure future profitability.
Disclosure: This information is for general awareness and does not constitute investment advice
Report Summary
GK Energy Limited is a publicly traded company on the NSE, specializing in engineering, procurement, and commissioning (EPC) services for solar-powered agricultural water pump systems. Operating within the Utilities sector, specifically Renewable Utilities, the company holds a leading position as India’s largest pure-play EPC provider in this niche. Its business model supports the government’s PM KUSUM scheme, focusing on sustainable agricultural practices and rural electrification across multiple Indian states. GK Energy’s operations extend to over 7,500 villages with a cumulative installation of more than 164,500 renewable energy systems.
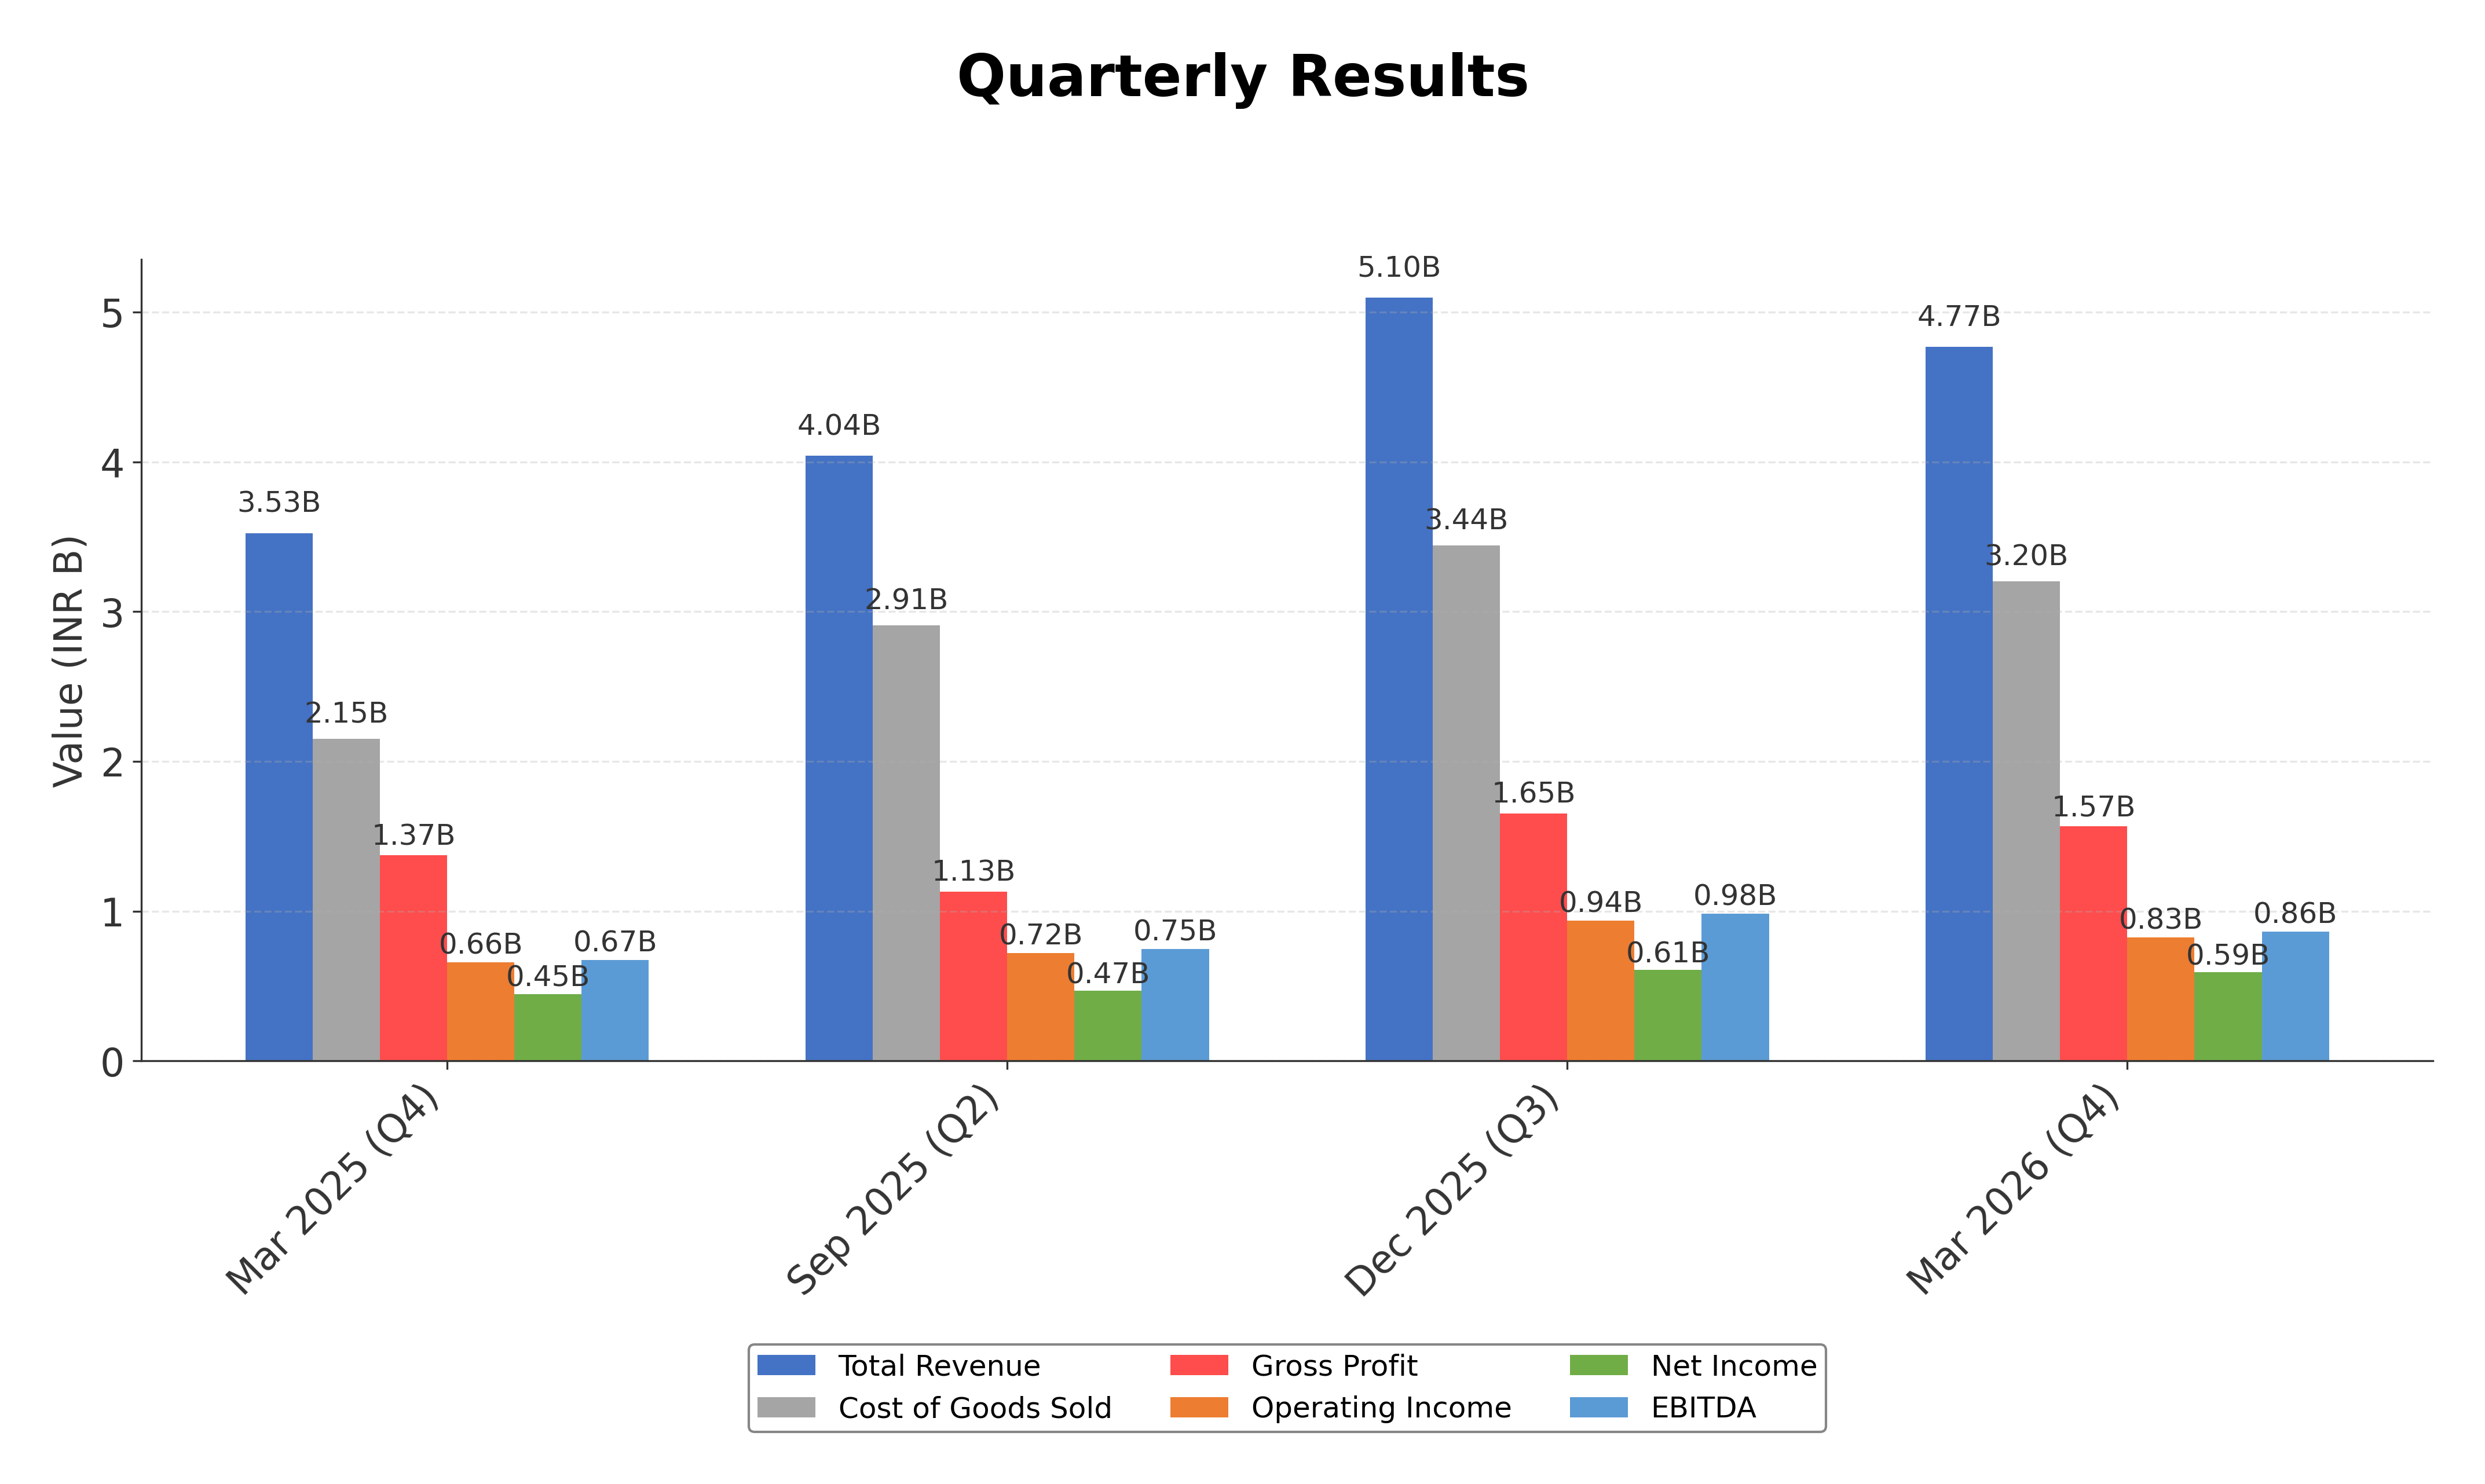
Financially, GK Energy reported trailing twelve-month revenue of approximately ₹17.15 billion with a gross margin of 32.86%, operating margin of 17.35%, and net profit margin of 11.91%. The company’s return on equity (ROE) stands at 37.26%, and return on assets (ROA) at 20.21%, indicating efficient use of equity and assets to generate profits. Its EBITDA margin and net income growth reflect strong operational performance, supported by a quarterly revenue growth rate of 35.2% and quarterly earnings growth of 32.2% year-over-year.
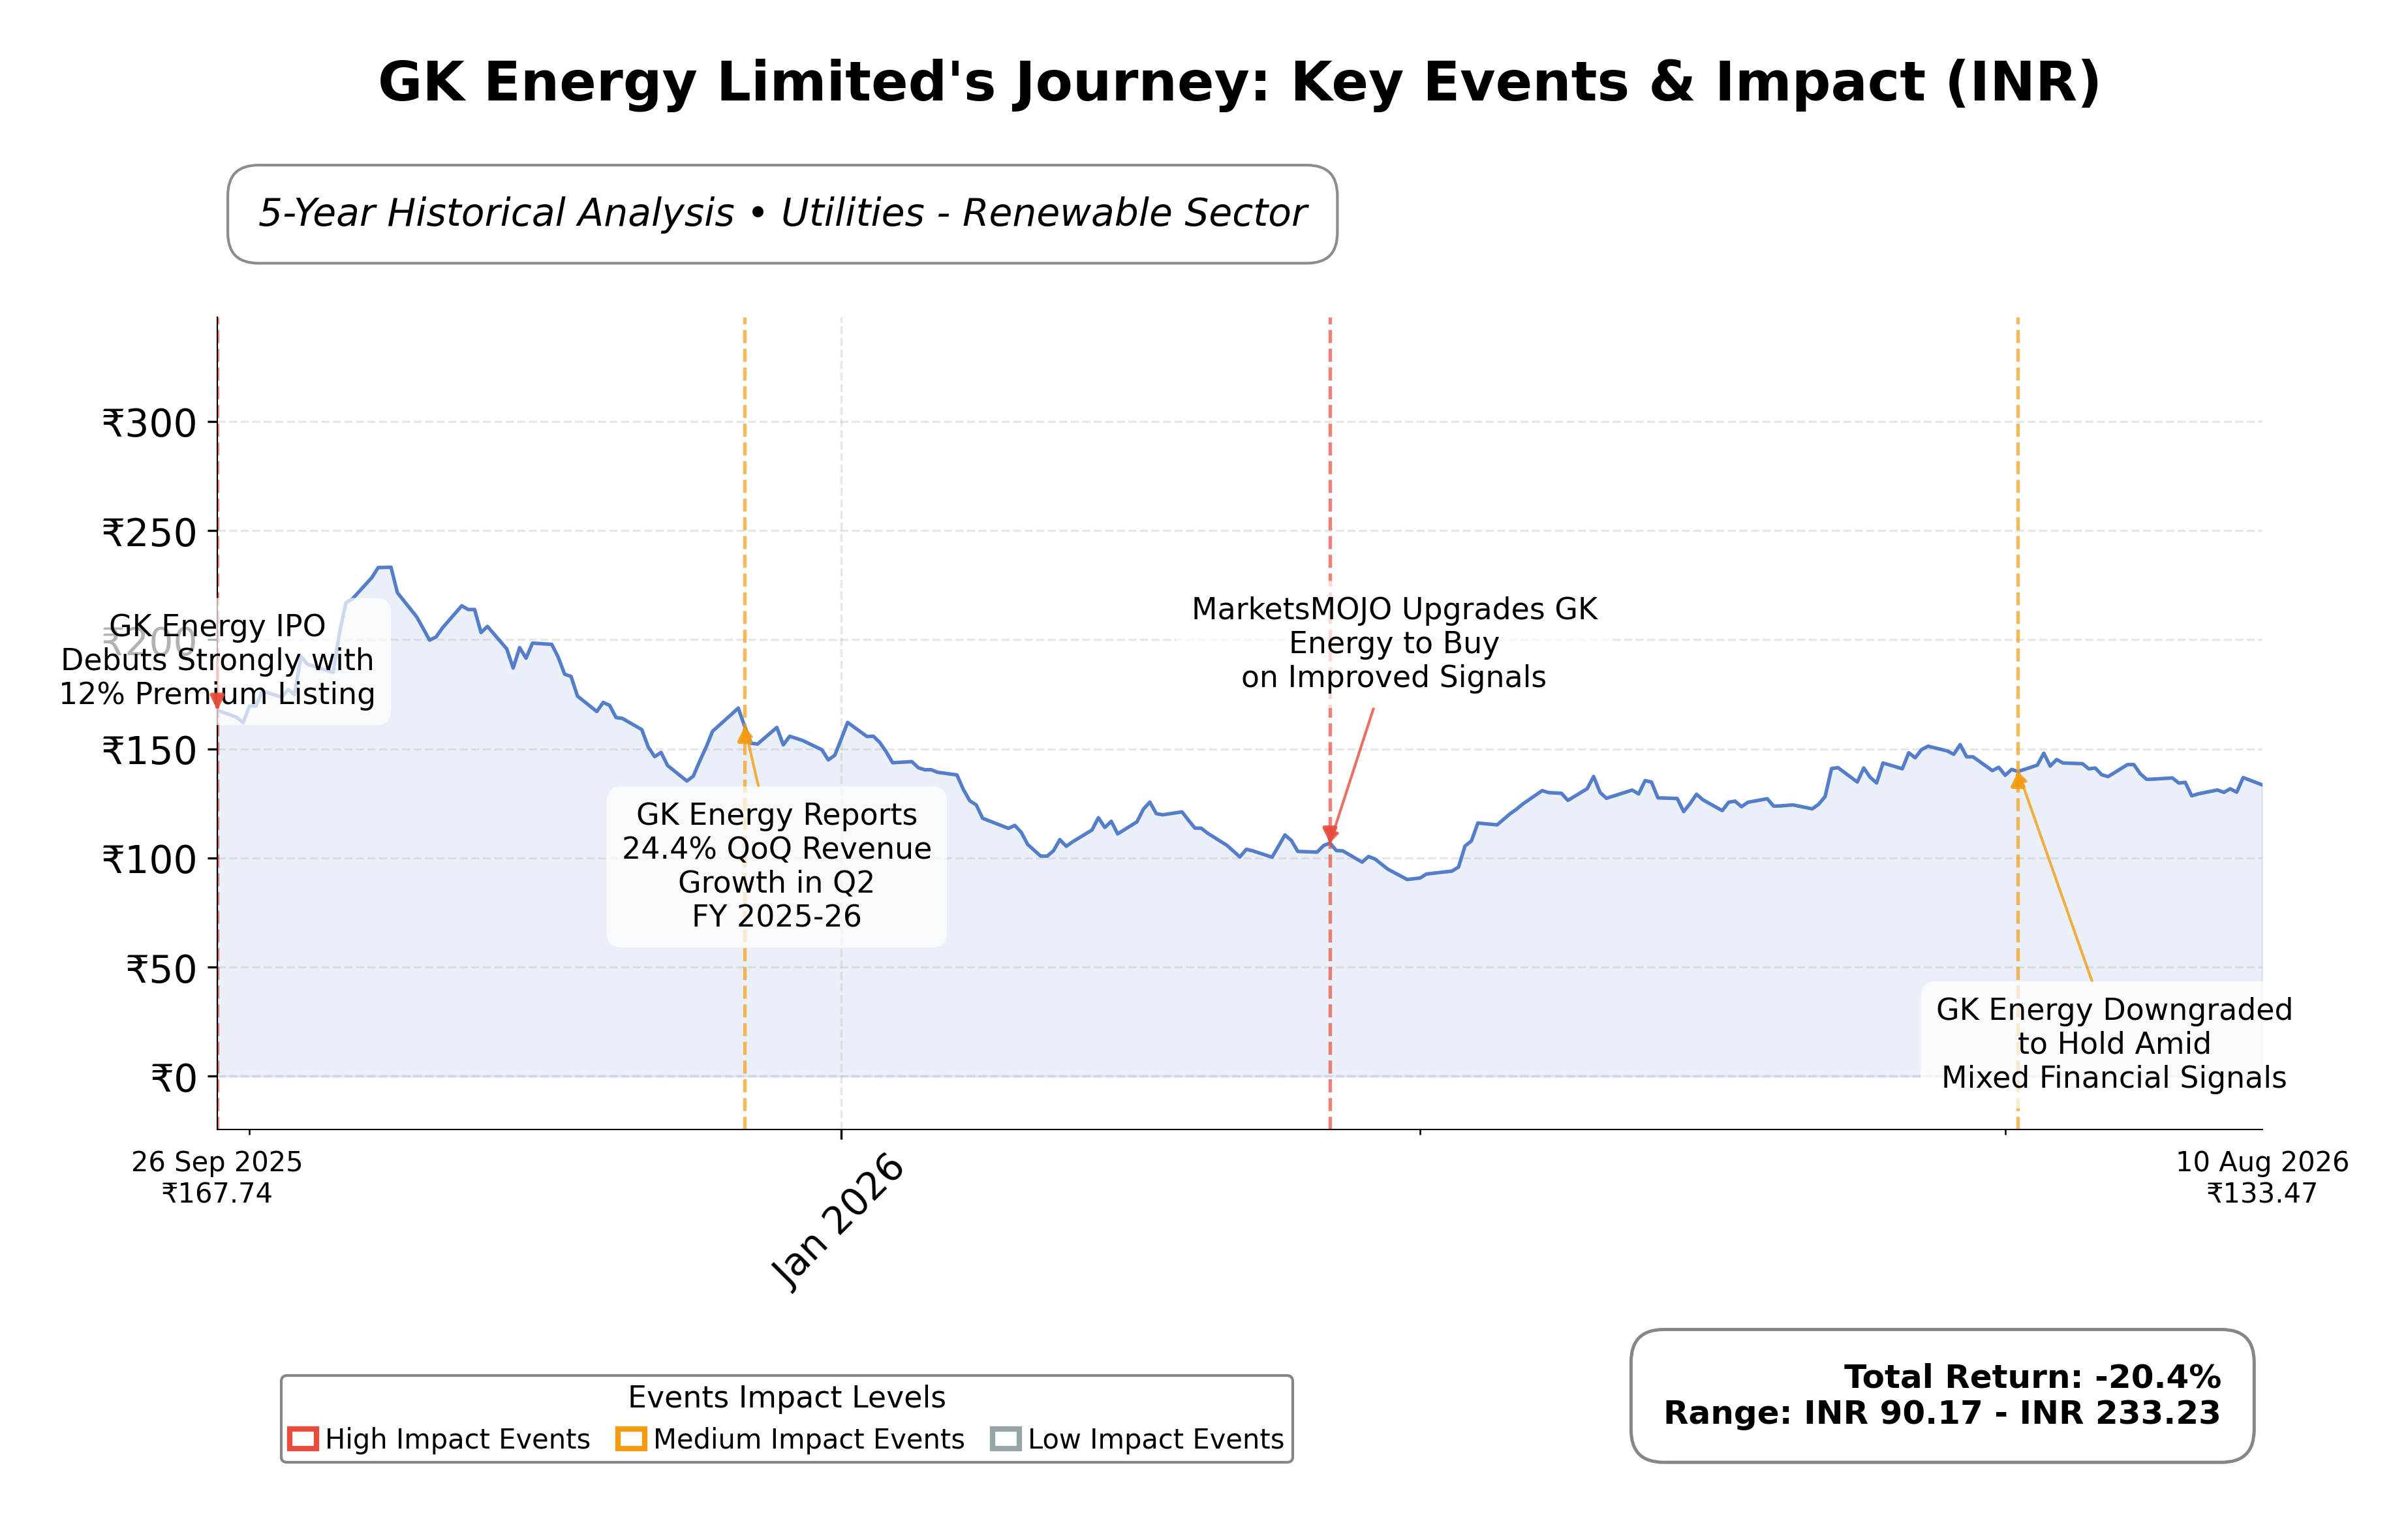
Valuation metrics show a trailing P/E ratio of 12.56, a price-to-book ratio of 3.13, and an enterprise value to EBITDA multiple of 8.21. Market capitalization is approximately ₹26.51 billion, with the stock currently trading at ₹130.73, well below its 52-week high of ₹239.60 and above its low of ₹87.20. The PEG ratio is notably low at 0.21, suggesting growth potential relative to earnings. These valuation figures position the stock attractively compared to peers, though the price remains volatile within its 52-week range.
GK Energy’s strengths include a strong cash position of ₹4.43 billion against total debt of ₹2.05 billion, a current ratio near 2.95 indicating good short-term liquidity, and a dominant market position in a growing renewable energy segment. Key risks involve sector-specific regulatory changes, competitive pressures from larger players, and macroeconomic factors affecting infrastructure investments. Recent strategic actions include expanding operational capacity, strengthening project execution networks, and a recommended dividend payout, reflecting financial discipline and shareholder returns.
Technically, the stock shows a sideways trend with price action fluctuating around the 50-day and 200-day moving averages near ₹139 and ₹135 respectively. Momentum indicators suggest mixed signals across daily and weekly timeframes. Recent news highlights strong quarterly earnings growth and positive market reactions, balanced by some margin contraction and sector volatility. Overall, conditions suggest a cautious stance with attention to execution and market developments.
Company and Industry Overview
Company Basics
Price Performance
Company Size
Shareholding Pattern
Sector and Industry Analysis
The renewable energy sector in India, particularly solar energy, has witnessed robust growth driven by government initiatives and increasing demand for sustainable power solutions. The market size is expanding rapidly, supported by large-scale deployment of solar infrastructure and decentralized systems, with key players including Waaree Energies, Suzlon, and GK Energy Limited. The sector’s growth trajectory is bolstered by ambitious national targets for renewable capacity addition and rising investments in clean energy technologies.
Within the solar EPC (Engineering, Procurement, and Construction) segment, companies face intense competition and operational challenges such as supply chain disruptions and weather-related delays. Barriers to entry include capital intensity, technology expertise, and strong OEM/ODM partnerships, which established firms leverage to scale efficiently. Firms like GK Energy are focusing on asset-light models and strategic rooftop deployments to deepen rural penetration while managing margin pressures and execution risks.
The regulatory environment is shaped by government schemes such as PM-KUSUM, which incentivize solar pump installations and decentralized energy solutions, though rollout delays create revenue timing uncertainties. Policy support through subsidies and favorable tariffs underpins sector growth, but companies must navigate fluctuating order inflows tied to scheme execution. Overall, regulatory frameworks aim to accelerate solar adoption but also impose execution discipline and funding requirements on industry participants.
Note: Analysis synthesized from industry research, market reports, and regulatory filings. Information is subject to change based on market conditions.
Financial Ratios Dashboard
Illustrative Scenario Analysis
DCF Assumptions:
Method: Two-Stage EPS-Priority Model
Financials
Peer Analysis
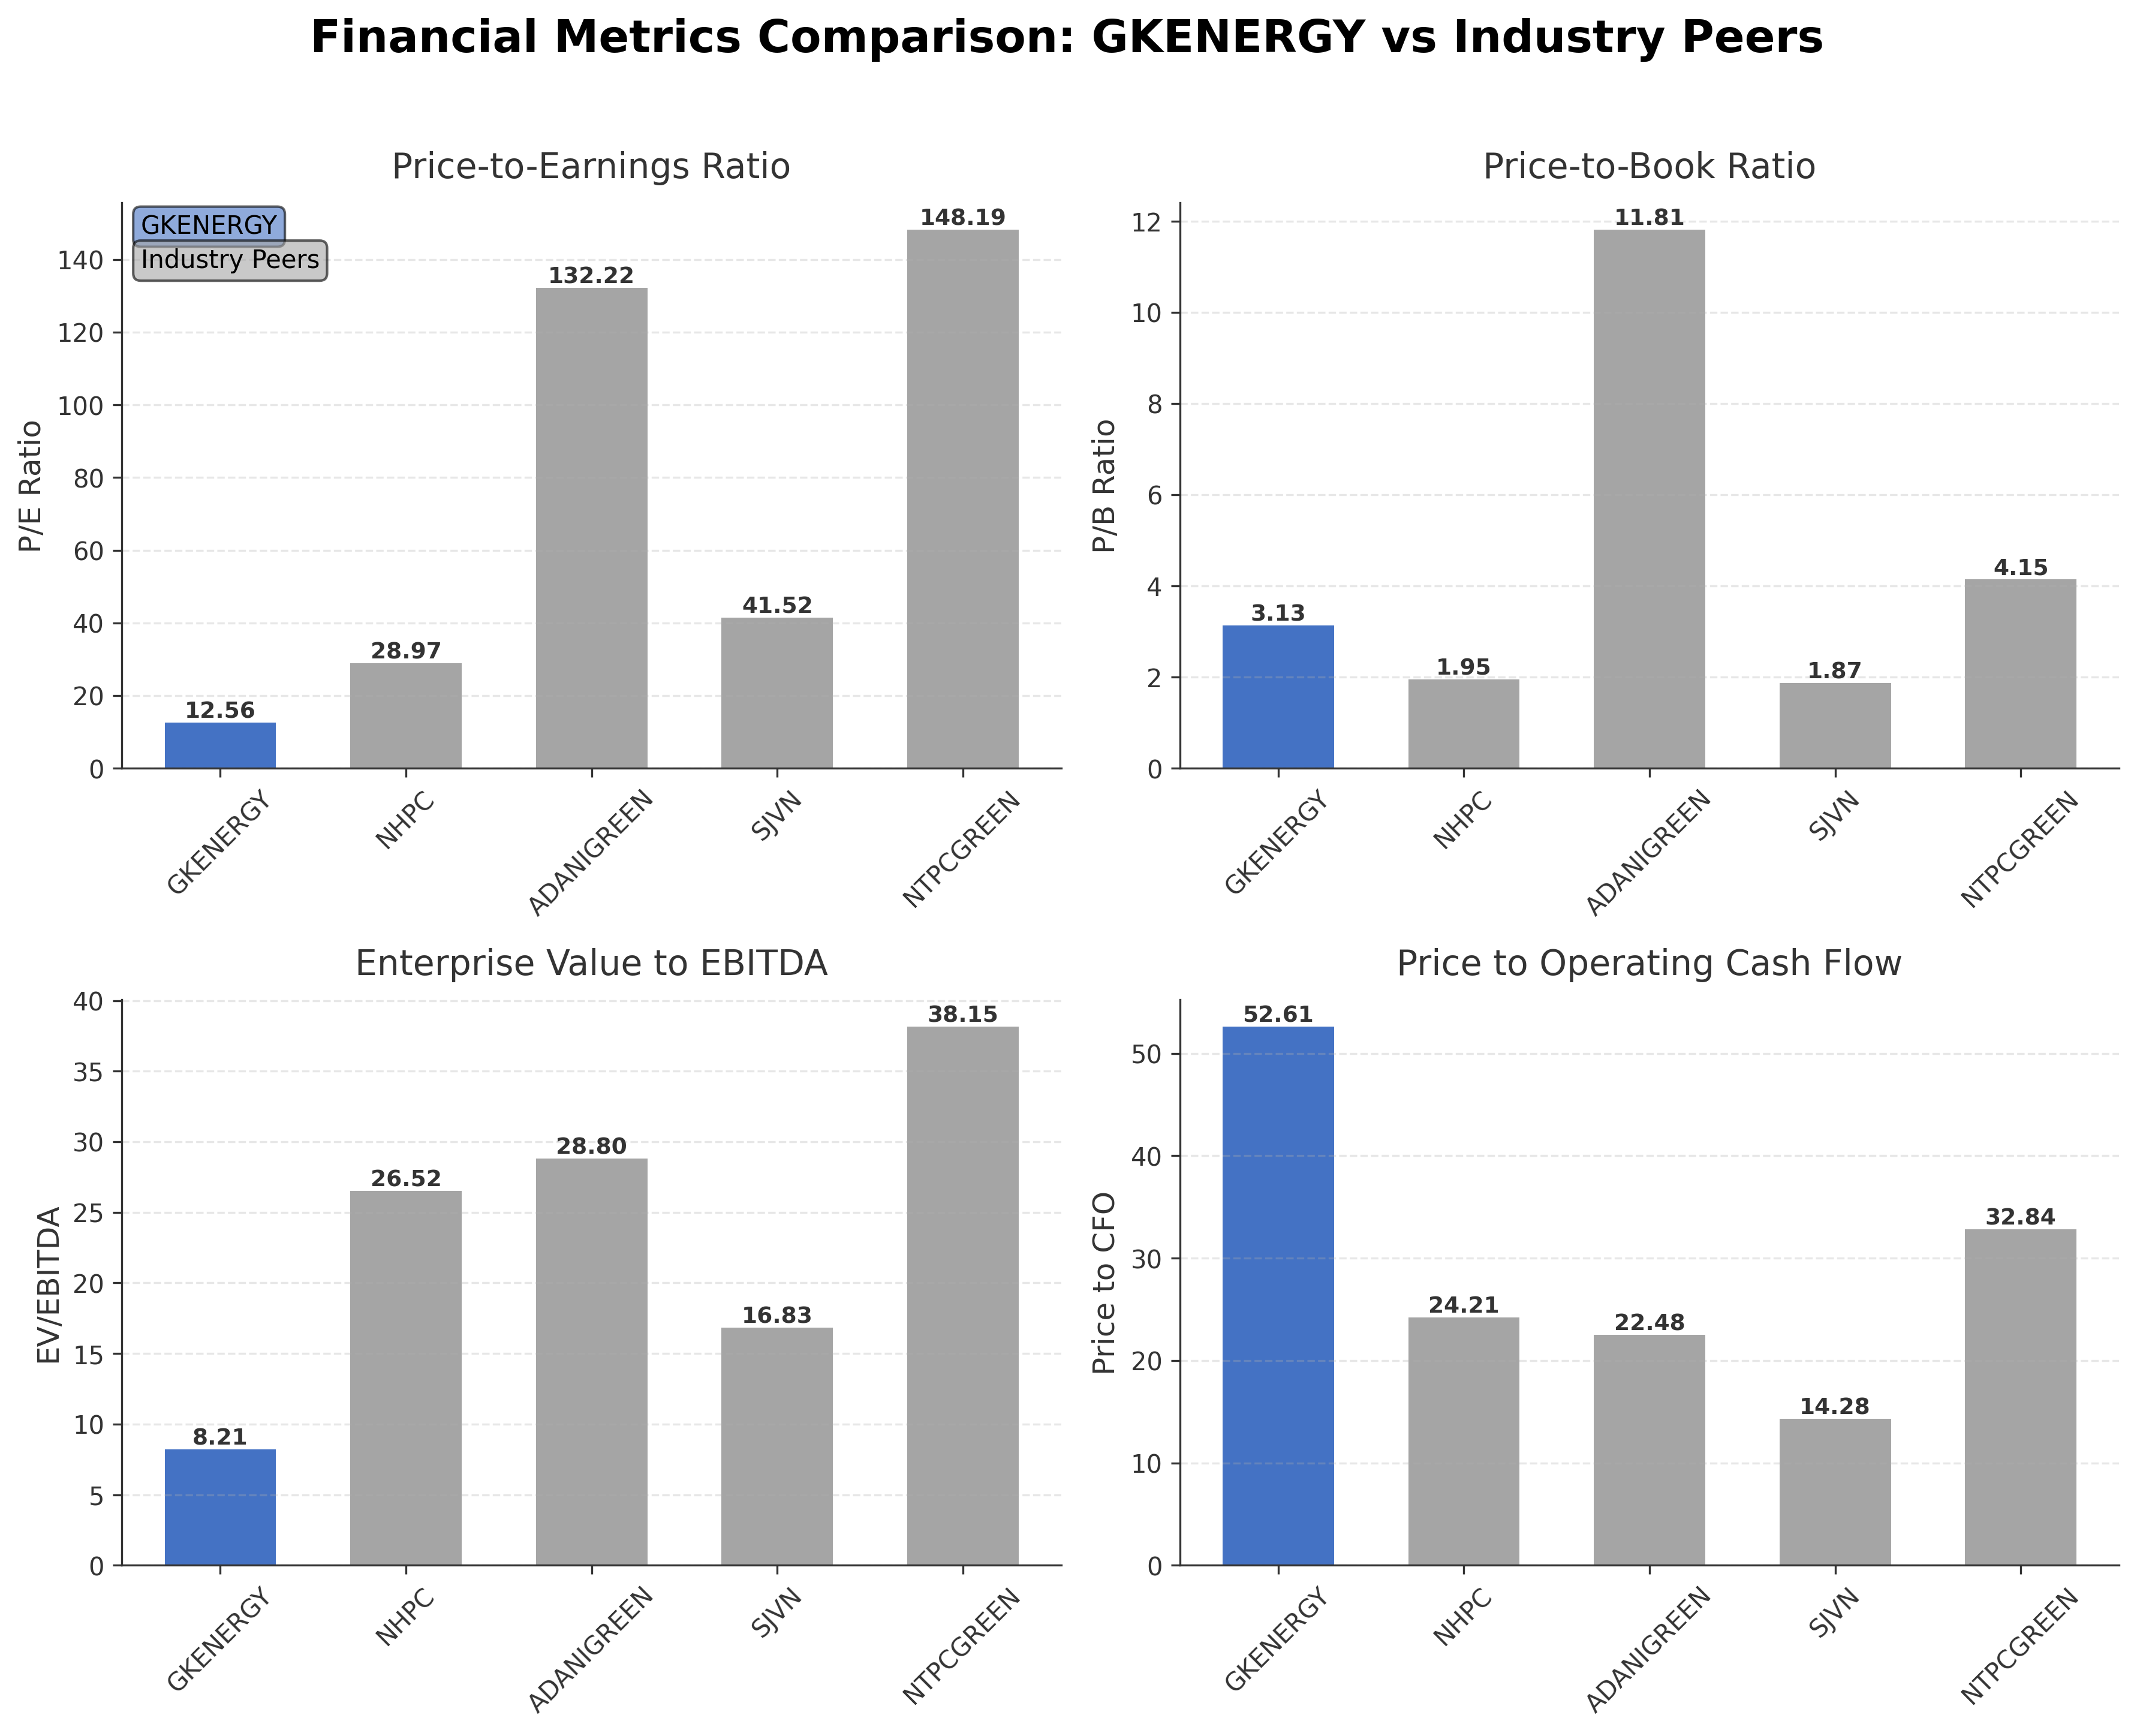
| Company Name | Market Cap | P/E Ratio | P/B Ratio | EV/EBITDA | Price to CFO |
|---|---|---|---|---|---|
| GK Energy Limited | ₹26.51B | 12.56 | 3.13 | 8.21 | 52.61 |
| NHPC Ltd. | ₹797.48B | 28.97 | 1.95 | 26.52 | 24.21 |
| Adani Green Energy Limited | ₹2.28T | 132.22 | 11.81 | 28.80 | 22.48 |
| SJVN Ltd. | ₹265.58B | 41.52 | 1.87 | 16.83 | 14.28 |
| NTPC Green Energy Ltd. | ₹783.73B | 148.19 | 4.15 | 38.15 | 32.84 |
Comparison Analysis: GK Energy Limited exhibits a significantly lower P/E ratio of 12.56 compared to its larger regional peers, which range from 28.97 to 148.19, indicating more attractive valuation relative to earnings. Its price-to-book ratio at 3.13 is higher than most peers except Adani Green, reflecting a premium on book value possibly due to growth expectations. The EV/EBITDA multiple of 8.21 is substantially below peer averages, suggesting operational efficiency or undervaluation. GK Energy’s return on equity of 37.26% notably outperforms peers, highlighting superior profitability and capital utilization. However, its price to cash flow ratio is elevated at 52.61, which may indicate less cash flow relative to price compared to peers. Overall, GK Energy stands out for its strong profitability and relatively conservative valuation within the Indian renewable utilities sector.
Financial Metrics Comparison with Peers
Financial Statements
Comprehensive financial data including income, balance sheet, and cash flow metrics
Income Statement
| fiscal_date | 2026-03-31 | 2025-03-31 | 2024-03-31 | 2023-03-31 |
|---|---|---|---|---|
| Sales | 17.15B | 10.95B | 4.11B | 2.85B |
| Cost Of Goods | 11.80B | 7.03B | 3.36B | 2.63B |
| Gross Profit | 5.35B | 3.91B | 754.03M | 215.43M |
| Operating Expense Other Operating Expenses | 1.97B | 1.74B | 1.02M | -30.00K |
| Operating Income | 3.05B | 1.98B | 537.33M | 169.79M |
| Non Operating Interest Expense | 405.48M | 223.45M | 52.24M | 32.14M |
| Pretax Income | 2.74B | 1.80B | 482.77M | 134.72M |
| Income Tax | 698.60M | 470.61M | 121.87M | 33.92M |
| Net Income | 2.04B | 1.33B | 360.90M | 100.80M |
| Ebit | 3.15B | 2.03B | 535.01M | 166.86M |
| Ebitda | 3.18B | 2.04B | 546.73M | 171.69M |
| Net Income Continuous Operations | 2.74B | 1.80B | 482.77M | 134.72M |
| Preferred Stock Dividends | 0.00 | 0.00 | 0.00 | 0.00 |
| Operating Expense Selling General And Administrative | N/A | 198.04M | 128.37M | 32.52M |
| Non Operating Interest Income | N/A | 43.07M | 12.05M | 4.08M |
| Eps Basic | N/A | 6.57 | 1.78 | 0.50 |
| Eps Diluted | N/A | 6.57 | 1.78 | 0.50 |
| Basic Shares Outstanding | N/A | 202.82M | 202.82M | 202.82M |
| Diluted Shares Outstanding | N/A | 202.82M | 202.82M | 202.82M |
Data provided by Twelve Data
Balance Sheet
| fiscal_date | 2026-03-31 | 2025-03-31 | 2024-03-31 | 2023-03-31 |
|---|---|---|---|---|
| Cash And Cash Equivalents | 3.35B | 11.16M | 6.84M | 6.71M |
| Accounts Receivable | 5.89B | 3.61B | 1.52B | 1.13B |
| Total Assets | 13.05B | 5.84B | 2.14B | 1.43B |
| Total Liabilities | 4.18B | 3.75B | 1.58B | 1.23B |
| Long Term Debt | 152.88M | 124.84M | 163.86M | 61.12M |
| Shareholders Equity | 8.88B | 2.09B | 559.58M | 198.68M |
Data provided by Twelve Data
Cash Flow Statement
| fiscal_date | 2026-03-31 | 2025-03-31 | 2024-03-31 | 2023-03-31 |
|---|---|---|---|---|
| Operating Activities Net Income | 2.74B | 1.80B | 482.77M | 134.72M |
| Operating Activities Other Non Cash Items | 312.06M | 180.26M | 48.96M | 32.62M |
| Operating Activities Accounts Receivable | -2.32B | -2.10B | -392.73M | -694.14M |
| Operating Activities Other Assets Liabilities | 159.62M | -900.48M | -33.71M | -76.19M |
| Operating Activities Operating Cash Flow | 503.94M | -986.02M | 105.29M | -602.99M |
| Investing Activities Purchase Of Investments | -461.53M | -526.74M | -55.23M | -5.59M |
| Investing Activities Sale Of Investments | 0.00 | 0.00 | 0.00 | 0.00 |
| Investing Activities Other Investing Activity | 10.00K | N/A | N/A | N/A |
| Investing Activities Investing Cash Flow | -461.52M | -526.74M | -109.49M | -7.23M |
| Financing Activities Long Term Debt Issuance | 1.50B | 28.47M | 268.73M | 152.83M |
| Financing Activities Long Term Debt Payments | -3.85B | -734.74M | -238.36M | -303.56M |
| Financing Activities Short Term Debt Issuance | -152.16M | 1.59B | 95.44M | 181.04M |
| Financing Activities Common Stock Issuance | 4.74B | 199.30M | 0.00 | 6.70M |
| Financing Activities Financing Cash Flow | 2.24B | 1.09B | 125.81M | 37.01M |
| End Cash Position | 3.35B | 11.16M | 6.84M | 6.71M |
| Free Cash Flow | -490.37M | -1.03B | -102.89M | -151.05M |
| Investing Activities Capital Expenditures | N/A | N/A | -54.26M | -1.64M |
Data provided by Twelve Data
Technical Analysis
Key Insights
- The current trend direction for GK Energy is sideways with price consolidating near the ₹130-₹140 range after recent volatility.
- Key support levels are identified near ₹120 and ₹110, while resistance is observed around ₹140 and the 52-week high near ₹240.
- The stock price is trading just below the 50-day moving average of ₹139.36 and slightly above the 200-day moving average of ₹135.57, indicating mixed momentum.
- Momentum indicators show RSI in a neutral zone around 50, MACD signals a recent weakening of bullish momentum, and stochastic oscillators suggest potential short-term consolidation.
- Across daily, weekly, and monthly timeframes, the stock exhibits a transition from mild bearishness to a sideways pattern, reflecting uncertainty in trend direction.
- Potential market scenarios include a continuation of consolidation with possible breakout if volume increases, or a retracement to support levels if selling pressure intensifies.
Trending News
1. Headline: KPI Green Energy shares fall 6% after Q1 results. What's worrying investors? - The Economic Times
Summary: KPI Green Energy shares fell sharply on Tuesday after the company reported a 14% year-on-year decline in Q1 net profit to Rs 94.63 crore. Rising finance costs and depreciation expenses weighed on profitability despite 16% revenue growth. Investors are also watching the companys debt levels ...
Sentiment: negative
2. Headline: Solar Pump Stock Jumps 10% After Unveiling BESS Plans; Targets 1 Million Systems by 2030
Summary: Solar pumps and rooftop systems have quietly become one of India's fastest growing energy stories, especially in villages where power cuts are common.
Sentiment: positive
3. Headline: Green Stocks August 7- Contrasting Fortunes for Vikram Solar, GK Energy On Q1 Results
Summary: On a weak day overall for the markets, Vikram Solar faced the brunt of investor dissappointment as the module maker slumped a further 6% to go with its drop yesterday.
Sentiment: negative
4. Headline: GK Energy Reports INR 505.19 Crore Q1 FY2026–27 Revenue, PAT Surges 61.55% to INR 59.67 Crore - SolarQuarter
Summary: GK Energy reported ₹505.19 crore Q1 FY2026–27 revenue, up 71.1% YoY, while PAT rose 61.55% to ₹59.67 crore, driven by strong renewable energy project execution across India.
Sentiment: positive
5. Headline: GK Energy releases monitoring agency report for Q2 2026 · Business Upturn
Summary: The regular monitoring and meticulous ... GK Energy Limited’s commitment to best corporate governance standards, as it continues to make strides in the industrial construction sector. Disclaimer: This article is based on a regulatory filing submitted to the National Stock Exchange of ...
Sentiment: positive
Powered by Brave
Recent Updates
News Summary
As of August 7, 2026. GK Energy Limited reported strong financial results for Q1 FY2026–27, with revenue increasing 71.1% year-on-year to ₹505.19 crore and profit after tax surging 61.55% to ₹59.67 crore. EBITDA rose 47.72% to ₹86.11 crore, driven by robust execution of renewable energy projects across India. The company’s low-capex operating model and decentralized project execution contributed to operational efficiency and growth. GK Energy expanded its operational footprint, having installed over 164,500 renewable energy systems and commissioned more than 726 MW of capacity. The board recommended a dividend of ₹0.50 per equity share for FY26, subject to shareholder approval, reflecting financial discipline and shareholder value focus.
News Sentiment
The overall sentiment from recent updates is positive, driven by strong quarterly earnings growth, expanding project execution, and strategic operational expansion. The significant increase in revenue and profit margins underscores effective management and market demand for decentralized renewable energy solutions. Positive investor response is reflected in share price rallies following earnings announcements. However, margin contraction noted in some reports suggests ongoing cost pressures. The dividend recommendation further supports confidence in financial health. Overall, the news indicates a favorable operational and financial environment for GK Energy with cautious attention to margin dynamics.
Source List
Analytical Overview
Analysis Summary
GK Energy’s valuation metrics, including a trailing P/E of 12.56, are favorable relative to the industry average P/E of 12.56, indicating reasonable pricing aligned with earnings. The company’s PEG ratio of 0.21 suggests undervaluation relative to its growth prospects. Revenue growth of 35.2% quarterly and positive cash flow from operations demonstrate a strong growth trajectory, although free cash flow remains negative. Financial health is supported by a low debt-to-equity ratio of 0.23 and a current ratio near 2.95, indicating liquidity strength. Sector-specific opportunities include government-backed renewable energy initiatives and expanding rural electrification, while challenges may arise from regulatory shifts and competitive pressures. India’s regulatory environment and increasing focus on clean energy adoption provide a supportive backdrop for GK Energy’s business model.
Overall Business and Market Assessment
Supporting Factors: robust revenue and profit growth, efficient capital structure, and strong market positioning in India’s renewable EPC sector
Risk Factors: margin pressures and negative free cash flow, which could impact liquidity and operational flexibility
SWOT Analysis
Strengths
- Leading pure-play EPC provider in India’s solar agricultural pump sector.
- Strong financial performance with high return on equity of 37.26%.
- Robust liquidity position with a current ratio of 2.95 and cash reserves of ₹4.43 billion.
- Extensive operational footprint across 7,500+ villages supporting renewable infrastructure.
Weaknesses
- Negative free cash flow of ₹-612.64 million indicating cash generation challenges.
- Relatively high price to cash flow ratio of 52.61 compared to peers.
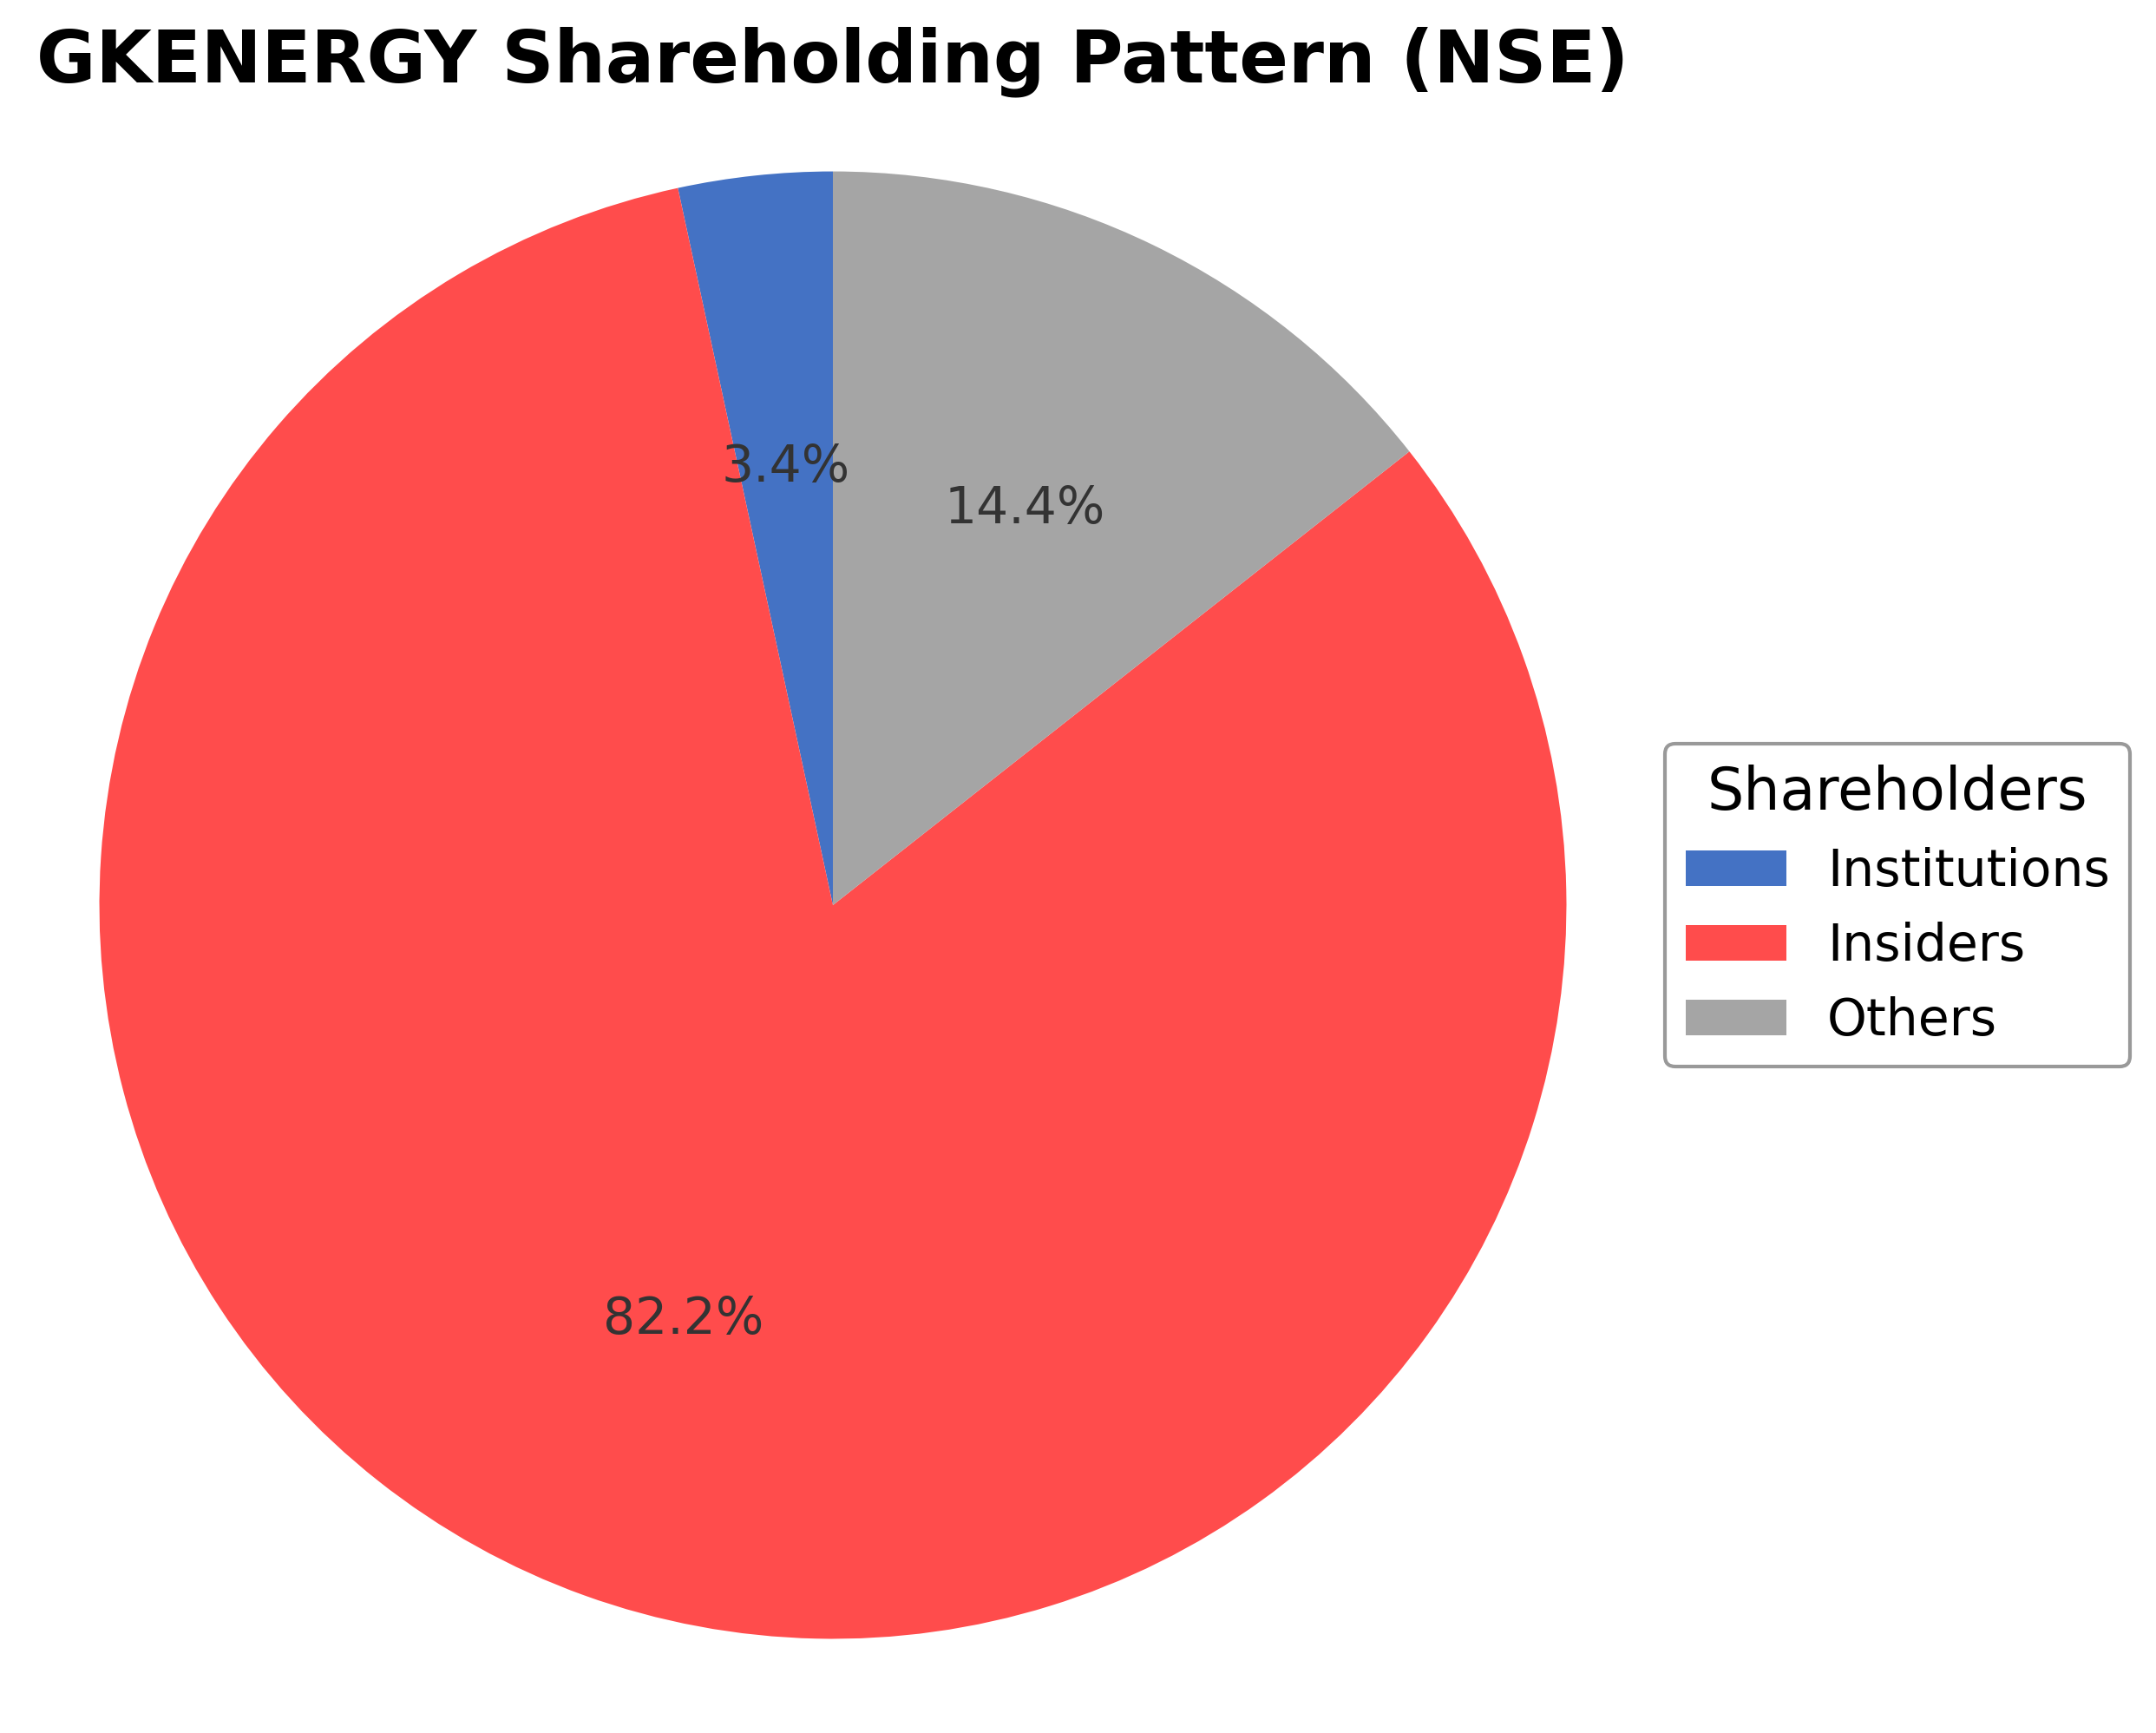
- Concentrated insider ownership limits institutional investor influence.
- Operating margin contraction noted despite revenue growth.
Opportunities
- Growing demand for decentralized solar infrastructure under government schemes.
- Expansion potential through integration of battery energy storage systems (BESS).
- Increasing investments in rural electrification and renewable energy adoption in India.
- Potential to scale operations leveraging OEM and ODM partnerships.
Threats
- Regulatory changes impacting renewable energy incentives or subsidies.
- Intensifying competition from larger renewable energy firms.
- Macroeconomic factors affecting infrastructure spending and project execution.
- Volatility in raw material costs impacting project margins.
Company Description
GK Energy Limited is a public company specializing in engineering, procurement, and commissioning (EPC) services for solar-powered agricultural water pump systems. As India's largest pure-play EPC provider in this niche, the company plays a pivotal role in promoting renewable energy adoption within the agrarian sector, especially under the government-backed Pradhan Mantri Kisan Urja Suraksha evam Utthan Mahabhiyan (PM KUSUM) scheme. GK Energy Limited designs and implements solar-powered solutions that help farmers reduce dependence on traditional energy sources, thereby supporting sustainable agricultural practices and rural electrification. In addition to serving individual farmers, the company collaborates with local government bodies to deploy dual water pump systems, facilitating broader community access to clean energy technology. Its extensive operations span key agricultural states, and its business model involves both project execution and after-sales service. Recent financial reports show significant growth, and its recent public offering underscores its market presence and ambitions for further expansion within India’s renewable infrastructure sector. GK Energy Limited’s activities have a significant impact on the renewable energy, engineering, and rural infrastructure markets.