
Genesys International Corporation Ltd (GENESYS)
Stock Analysis Report
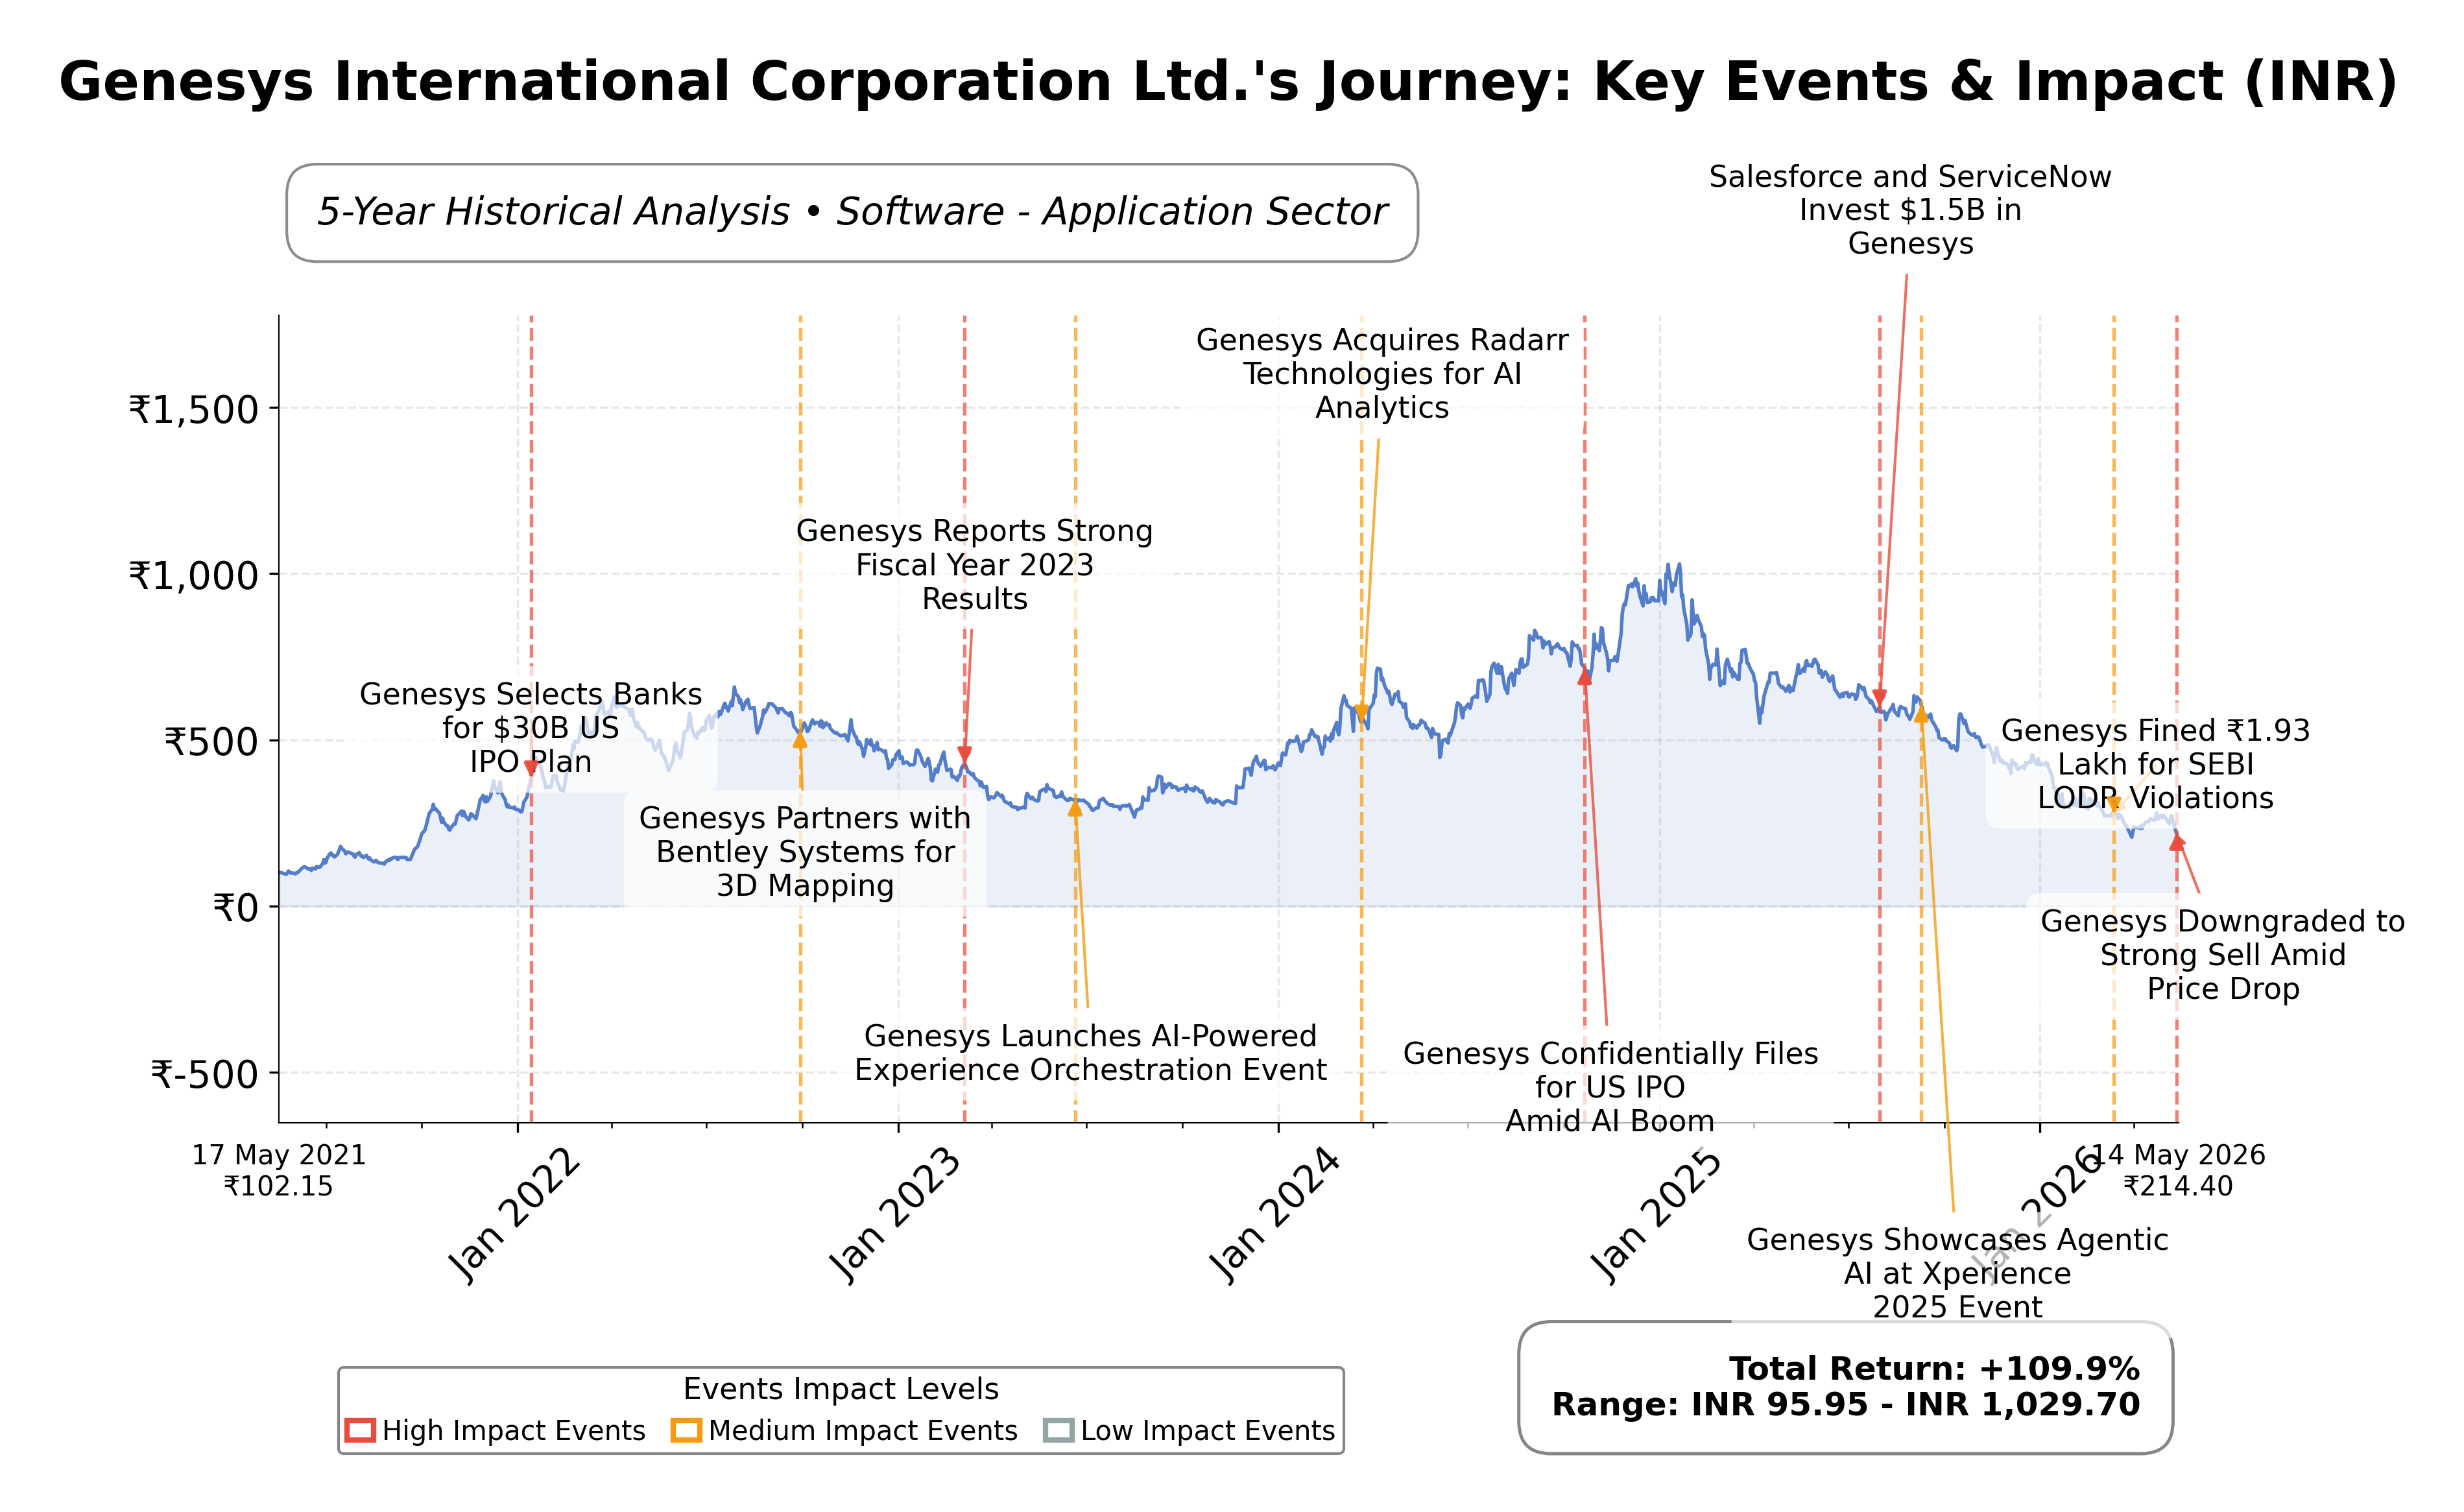
Stock Journey
Key Positives and Key Risks
Pros
- Market capitalization of ₹8.73 billion reflects a stable mid-cap presence in the Indian technology sector.
- Forward P/E ratio of 15.9 indicates market expectations of improved earnings relative to current valuation.
Cons
- Negative operating cash flow of approximately INR -1.07 billion over the trailing twelve months highlights operational cash challenges.
- Recent quarterly revenue decline of 14.9% suggests near-term sales pressure.
- Operating margin is negative at -1.4%, indicating inefficiencies in core operations.
Disclosure: This information is for general awareness and does not constitute investment advice
Report Summary
Genesys International Corporation Ltd. operates primarily in the geospatial services sector, specializing in advanced mapping solutions and location-based data services. Listed on the NSE in India under the technology sector, the company leverages technologies such as LiDAR scanning and remote sensing to provide high-accuracy geospatial data. Its clientele spans government bodies, infrastructure developers, utilities, and urban planners, positioning Genesys as a key player in digital transformation initiatives across multiple industries. The company’s offerings support critical applications in urban development, infrastructure management, and smart city projects.
Financially, Genesys reported trailing twelve months (TTM) revenue of approximately INR 3.18 billion with a gross margin of 35.6%, indicating moderate efficiency in cost management. The net profit margin stands at 12.3%, reflecting reasonable profitability, although the operating margin is slightly negative at -1.4%, suggesting some operational challenges. Return on equity (ROE) and return on assets (ROA) are 10.1% and 7.2%, respectively, demonstrating moderate returns on shareholder investment and asset utilization. The company’s return on invested capital (ROIC) is reported at 15.0%, highlighting effective capital deployment.
Valuation metrics show a trailing price-to-earnings (P/E) ratio of 22.4 and a forward P/E of 15.9, indicating the market anticipates improved earnings performance. The price-to-book (P/B) ratio is 1.31, and the enterprise value to EBITDA (EV/EBITDA) ratio is 9.0, suggesting the stock is fairly valued relative to its fundamentals. The market capitalization is approximately INR 8.73 billion, with the current share price at INR 208.80, near its 52-week low of INR 205.15 and significantly below the 52-week high of INR 757.50, reflecting recent price depreciation.
Key strengths include a strong current ratio of 2.86, indicating solid short-term liquidity, and a reasonable debt-to-equity ratio of 21.4%, implying manageable leverage. The company’s strategic positioning in a niche geospatial market and its use of advanced technologies underpin its competitive advantage. Risks include recent quarterly revenue decline of 14.9% and a negative operating margin, alongside volatile stock price movements and mixed technical signals. Recent news highlights a mix of positive earnings surprises and technical downgrades, reflecting investor uncertainty.
Technically, the stock exhibits a complex interplay of bullish and bearish indicators, with price trading below the 200-day moving average and momentum indicators showing weakness. The overall trajectory suggests cautious market sentiment with potential for volatility. The data implies a scenario where stakeholders may consider monitoring developments closely, balancing the company’s fundamental strengths against recent operational and market challenges.
Company and Industry Overview
Company Basics
Price Performance
Company Size
Shareholding Pattern
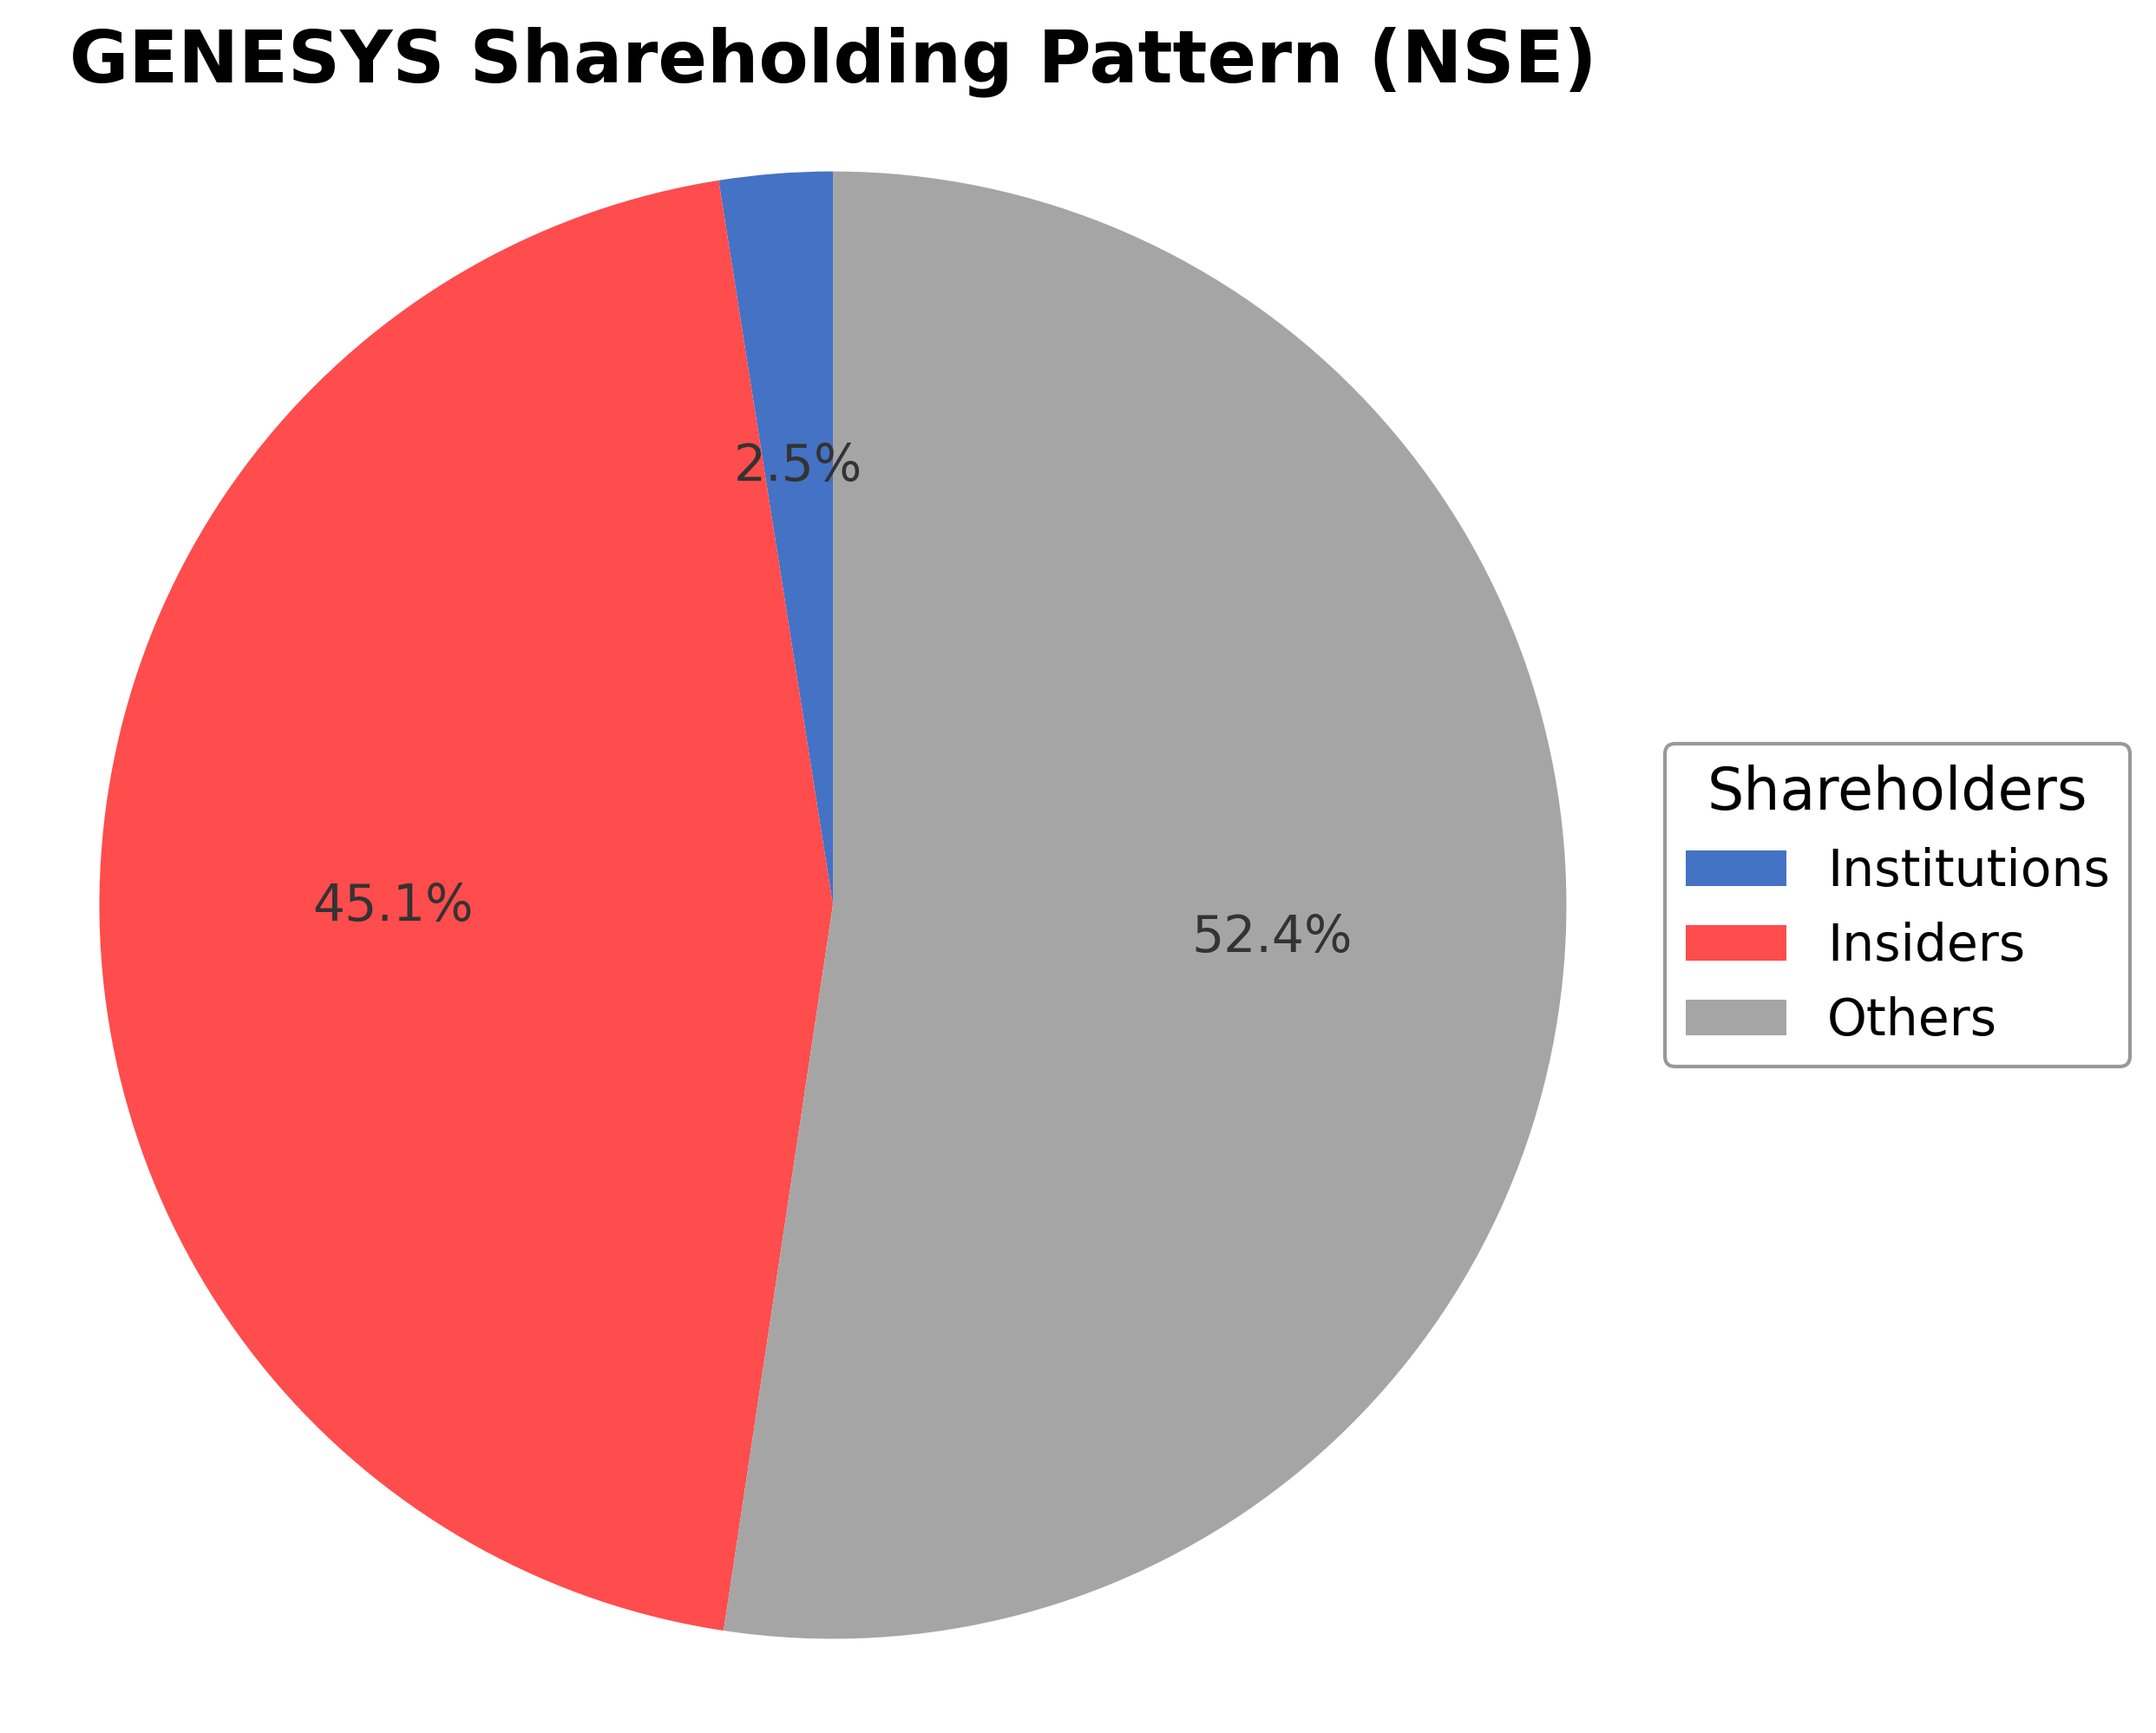
Genesys International Corporation Ltd.'s ownership structure comprises approximately 45.13% held by insiders including executives and board members, 2.49% by institutional investors such as mutual funds and asset managers, and the remaining 52.38% by public shareholders including retail investors and employee stock plans. Over the past 12 to 24 months, promoter holding has remained relatively stable, while institutional ownership has seen minor fluctuations without significant accumulation or distribution trends. Major institutional investors have maintained modest positions, reflecting a neutral stance on the company. This shareholding pattern suggests a balanced governance framework with substantial insider involvement and a broad public float, which may influence strategic decisions and market perception. The current ownership distribution indicates moderate market confidence and a governance structure supportive of steady corporate actions.
Sector and Industry Analysis
The geospatial sector is experiencing robust growth driven by increasing demand for location-based data across industries such as urban planning, agriculture, defense, and transportation. The global geospatial market is expanding rapidly, supported by advancements in GIS, satellite imaging, LiDAR, and GPS technologies. Key players include specialized firms like Genesys International Corporation Ltd., which leverage advanced mapping and remote sensing capabilities to serve diverse clients, including Fortune 500 companies.
Industry trends highlight a shift toward integration of digital twin technologies and 3D mapping platforms, enhancing spatial data accuracy and application scope. Competitive dynamics favor companies with strong technological expertise, extensive data processing capabilities, and strategic global partnerships. Barriers to entry are significant due to the need for advanced infrastructure, skilled professionals, and long-term client relationships, positioning established firms like Genesys advantageously in the market.
The regulatory landscape in India is increasingly supportive, with government initiatives recognizing the strategic importance of geospatial technologies for national development. Policies promoting the adoption of GIS and related technologies across sectors have facilitated industry growth and innovation. Continued government backing, including relaxed data-sharing norms and investment in digital infrastructure, is expected to sustain positive momentum for companies operating in this space.
Note: Analysis synthesized from industry research, market reports, and regulatory filings. Information is subject to change based on market conditions.
Financial Ratios Dashboard
Illustrative Scenario Analysis
DCF Assumptions:
Method: Two-Stage EPS-Priority Model
Financials
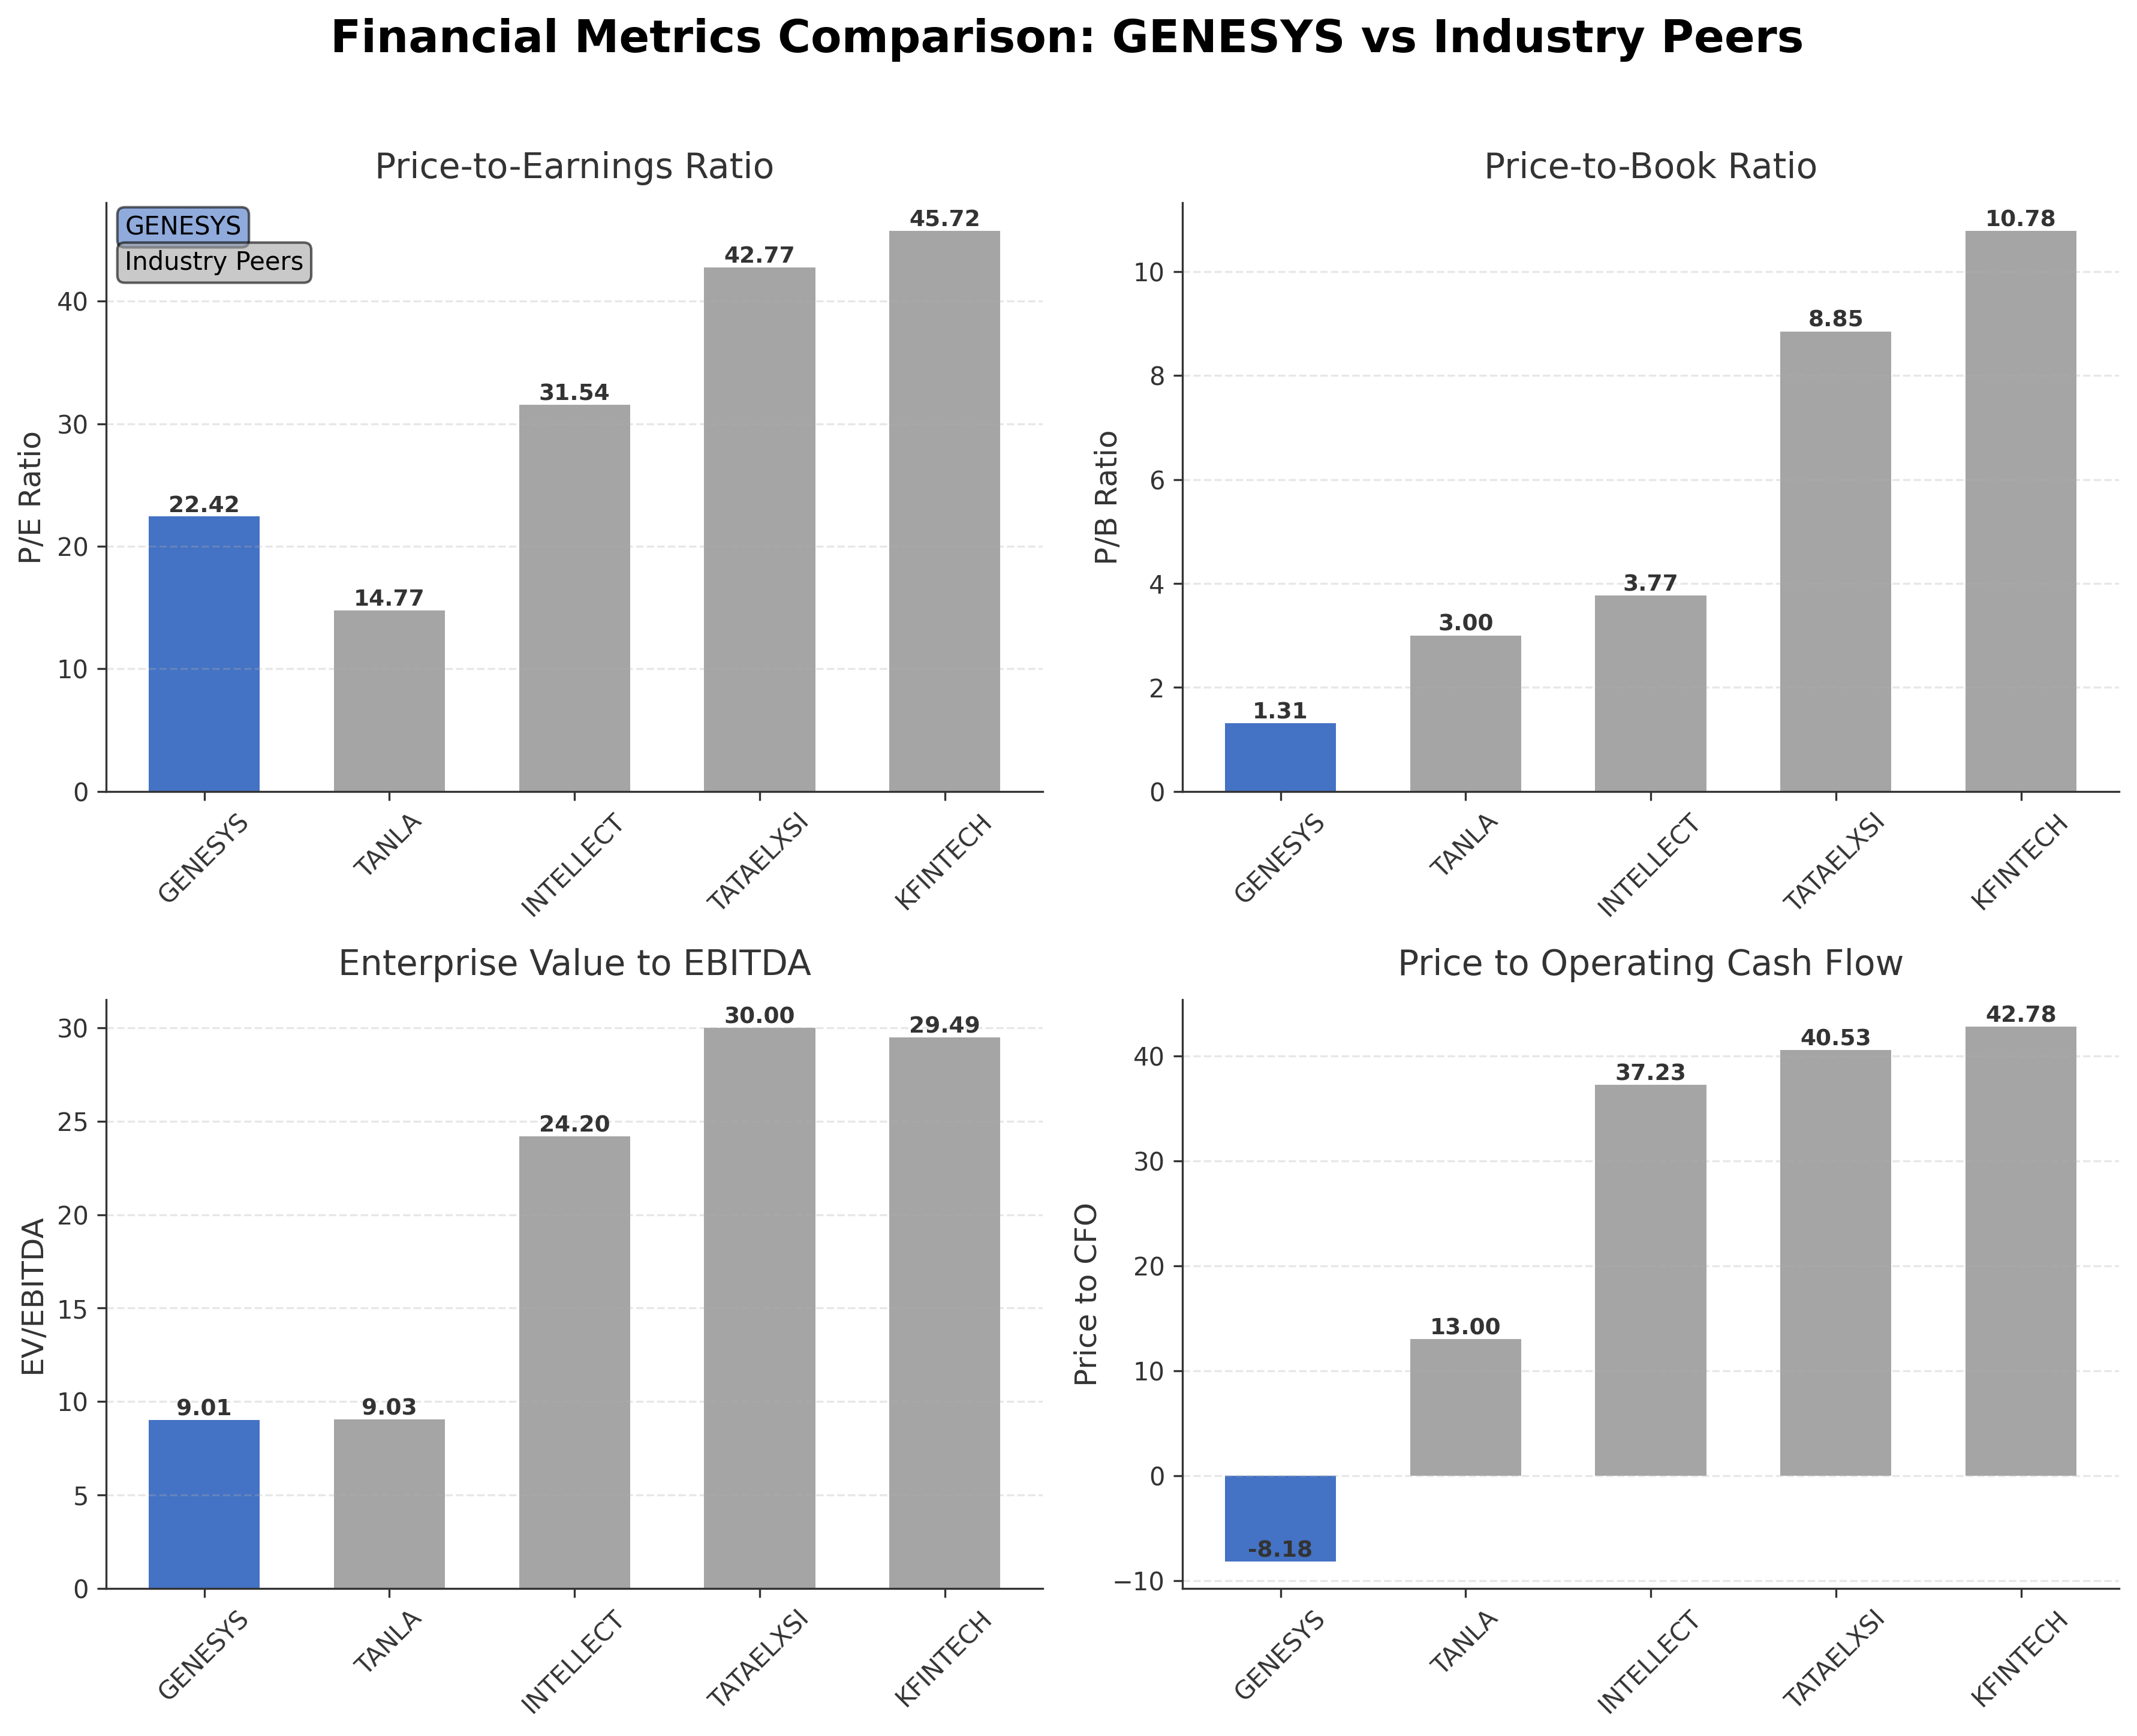
Peer Analysis
| Company Name | Market Cap | P/E Ratio | P/B Ratio | EV/EBITDA | Price to CFO |
|---|---|---|---|---|---|
| Genesys International Corporation Ltd. | ₹8.73B | 22.42 | 1.31 | 9.01 | -8.18 |
| Tanla Platforms Ltd. | ₹74.65B | 14.77 | 3.00 | 9.03 | 13.00 |
| Intellect Design Arena Ltd. | ₹112.11B | 31.54 | 3.77 | 24.20 | 37.23 |
| Tata Elxsi Ltd. | ₹269.10B | 42.77 | 8.85 | 30.00 | 40.53 |
| KFin Technologies Ltd. | ₹158.10B | 45.72 | 10.78 | 29.49 | 42.78 |
Comparison Analysis: Genesys International Corporation Ltd. trades at a lower market capitalization compared to its larger Indian software application peers such as Tanla Platforms and Tata Elxsi. Its trailing P/E ratio of 22.42 is below several peers like Intellect Design Arena and Tata Elxsi, indicating relatively moderate valuation. The company’s P/B ratio of 1.31 is significantly lower than the peer group, suggesting a more conservative book value pricing. Its EV/EBITDA ratio of 9.01 is also lower than most peers, reflecting a potentially more attractive enterprise valuation. However, Genesys reports a negative price to cash flow ratio, contrasting with positive values for peers, which may indicate operational cash flow challenges. Return on equity at approximately 10.1% is modest relative to peer returns exceeding 20%, highlighting room for improvement in profitability metrics.
Financial Metrics Comparison with Peers
Financial Statements
Comprehensive financial data including income, balance sheet, and cash flow metrics
Income Statement
| fiscal_date | 2025-03-31 | 2024-03-31 | 2023-03-31 | 2022-03-31 | 2021-03-31 |
|---|---|---|---|---|---|
| Sales | 3.11B | 1.98B | 1.81B | 1.17B | 795.59M |
| Cost Of Goods | 1.34B | 916.22M | 960.54M | 806.68M | 640.72M |
| Gross Profit | 1.77B | 1.07B | 850.74M | 358.42M | 154.87M |
| Operating Expense Selling General And Administrative | 91.73M | 72.48M | 81.61M | 36.96M | 29.99M |
| Operating Expense Other Operating Expenses | 129.66M | 82.20M | 104.73M | 62.43M | 109.06M |
| Operating Income | 910.69M | 388.63M | 215.64M | 92.43M | -180.53M |
| Non Operating Interest Income | 19.22M | 8.76M | 3.84M | 3.08M | 1.62M |
| Non Operating Interest Expense | 87.80M | 39.09M | 26.66M | 24.78M | 38.87M |
| Pretax Income | 826.76M | 371.75M | 249.96M | -358.69M | -544.43M |
| Income Tax | 265.73M | 155.63M | 100.64M | 38.17M | -26.55M |
| Net Income | 561.04M | 216.12M | 149.32M | -396.85M | -517.88M |
| Eps Basic | 14.17 | 5.78 | 5.44 | 4.28 | -13.77 |
| Eps Diluted | 14.06 | 5.74 | 5.29 | 4.13 | -13.77 |
| Basic Shares Outstanding | 39.66M | 38.16M | 35.15M | 31.25M | 31.18M |
| Diluted Shares Outstanding | 39.66M | 38.16M | 35.15M | 31.25M | 31.18M |
| Ebit | 914.57M | 410.85M | 276.62M | -333.91M | -505.57M |
| Ebitda | 1.49B | 843.05M | 627.93M | 307.18M | 6.07M |
| Net Income Continuous Operations | 826.76M | 371.75M | 249.96M | -358.69M | -544.43M |
| Minority Interests | 1.20M | 4.61M | 41.46M | 530.97M | 88.56M |
| Preferred Stock Dividends | 0.00 | 0.00 | 0.00 | 0.00 | 0.00 |
Source: Financial statements and regulatory filings
Balance Sheet
| fiscal_date | 2025-03-31 | 2024-03-31 | 2023-03-31 | 2022-03-31 | 2021-03-31 |
|---|---|---|---|---|---|
| Cash And Cash Equivalents | 33.44M | 232.67M | 125.64M | 213.81M | 13.81M |
| Accounts Receivable | 2.22B | 1.43B | 832.19M | 491.46M | 322.95M |
| Total Assets | 7.78B | 6.35B | 5.06B | 3.19B | 3.04B |
| Total Liabilities | 2.21B | 1.44B | 981.34M | 831.48M | 491.62M |
| Long Term Debt | 222.61M | 271.77M | 218.14M | 41.30M | 51.28M |
| Shareholders Equity | 5.57B | 4.91B | 4.07B | 2.36B | 2.55B |
Source: Financial statements and regulatory filings
Cash Flow Statement
| fiscal_date | 2025-03-31 | 2024-03-31 | 2023-03-31 | 2022-03-31 | 2021-03-31 |
|---|---|---|---|---|---|
| Operating Activities Net Income | 826.76M | 371.75M | 249.96M | -358.69M | -544.43M |
| Operating Activities Stock Based Compensation | 29.68M | 31.58M | 26.86M | 14.17M | N/A |
| Operating Activities Other Non Cash Items | 74.03M | 20.94M | -58.55M | -51.80M | -73.30M |
| Operating Activities Accounts Receivable | -815.33M | -607.32M | -346.71M | -170.28M | 77.79M |
| Operating Activities Other Assets Liabilities | -1.18B | -144.09M | -567.94M | 75.33M | 95.97M |
| Operating Activities Operating Cash Flow | -1.07B | -327.14M | -696.38M | -491.27M | -443.97M |
| Investing Activities Capital Expenditures | -433.70M | -732.92M | -851.89M | -83.55M | -77.76M |
| Investing Activities Net Intangibles | -107.80M | -102.03M | -127.73M | -141.69M | -14.54M |
| Investing Activities Purchase Of Investments | 0.00 | -1.30B | -1.81B | -386.06M | -512.28M |
| Investing Activities Sale Of Investments | 351.81M | 1.33B | 1.43B | 413.30M | 483.08M |
| Investing Activities Investing Cash Flow | -81.89M | -702.64M | -1.76B | -49.96M | -106.96M |
| Financing Activities Long Term Debt Issuance | 28.16M | 161.18M | 235.95M | N/A | N/A |
| Financing Activities Long Term Debt Payments | -97.00M | -72.31M | -25.95M | N/A | N/A |
| Financing Activities Short Term Debt Issuance | 648.82M | 105.98M | -69.98M | 130.76M | -15.76M |
| Financing Activities Common Stock Issuance | 51.18M | 585.18M | 2.09B | 33.83M | 2.13M |
| Financing Activities Financing Cash Flow | 631.16M | 780.02M | 2.23B | 164.59M | -41.03M |
| End Cash Position | 33.44M | 232.67M | 125.64M | 213.81M | 13.81M |
| Free Cash Flow | -1.07B | -645.82M | -1.33B | -50.22M | 95.00M |
| Investing Activities Net Acquisitions | N/A | 0.00 | -532.58M | 0.00 | N/A |
| Investing Activities Other Investing Activity | N/A | N/A | N/A | 6.36M | 1.00K |
| Financing Activities Other Financing Charges | N/A | N/A | N/A | N/A | -27.40M |
| Financing Activities Common Dividends | N/A | N/A | N/A | N/A | N/A |
Source: Financial statements and regulatory filings
Technical Analysis
Key Insights
- The current trend shows a downward price movement with the stock trading near its 52-week low, indicating bearish momentum.
- Key support levels are observed around ₹205, with resistance near the 50-day moving average at ₹255 and the 200-day moving average at ₹408.
- The price is below the 10-day, 50-day, and 200-day moving averages, suggesting weakness across short, medium, and long-term trends.
- Momentum indicators such as RSI are in the lower range, MACD shows bearish crossover, and Stochastic oscillators indicate oversold conditions.
- Daily and weekly timeframes confirm a bearish trend, while monthly charts show longer-term consolidation with potential volatility.
- Current technical setup suggests possible continuation of downward pressure with intermittent rebounds near support zones.
Trending News
1. Headline: Genasys GNSS Q2 2026 Earnings Call Transcript | The Motley Fool
Summary: Image source: The Motley Fool · Thursday, May 14, 2026 at 4:30 p.m. ET
Sentiment: neutral
2. Headline: Genasys (GNSS) Q2 Earnings and Revenues Top Estimates
Summary: Genasys (GNSS) delivered earnings and revenue surprises of +166.67% and +1.01%, respectively, for the quarter ended March 2026. Do the numbers hold clues to what lies ahead for the stock?
Sentiment: positive
3. Headline: Genasys (NASDAQ:GNSS) Announces Earnings Results - Ticker Report
Summary: Genasys (NASDAQ:GNSS – Get Free Report) released its quarterly earnings results on Thursday. The company reported $0.02 EPS for the quarter, beating analysts’ consensus estimates of ($0.03) by $0.05, FiscalAI reports. The business had revenue of $15.51 million during the quarter, compared ...
Sentiment: positive
4. Headline: Genesys International Corporation Ltd Upgraded to 'Sell' on Technical and Valuation Improvements
Summary: The stock’s recent price action reflects significant volatility and investor uncertainty. Considering Genesys International Corporation Ltd? Wait! SwitchER has found potentially better options in Computers - Software & Consulting and beyond.
Sentiment: positive
5. Headline: Genesys International Corporation Ltd Sees Mixed Technical Signals Amid Price Momentum Shift
Summary: Genesys International Corporation Ltd, a small-cap player in the Computers - Software & Consulting sector, has experienced a notable shift in its technical parameters, reflecting a complex interplay of bullish and bearish signals. Despite a recent downgrade in its Mojo Grade to 'Sell' from 'Strong Sell', the stock...
Sentiment: positive
Recent Updates
News Summary
As of May 30, 2025. Genesys International Corporation Ltd. continues to focus on its core geospatial data services, providing mapping and location-based information critical for infrastructure and urban planning. Recent financial disclosures indicate a 160% increase in profit and a 55.16% rise in revenue for fiscal year 2025, underscoring strong operational momentum. The company also announced progress in its second quarter of fiscal year 2026, highlighting advancements in agentic AI technologies aimed at enhancing customer experience solutions. Investor relations materials emphasize the company’s role as a specialist upstream supplier of geospatial data, with a business model centered on technical data collection and customized mapping projects. No significant leadership changes or regulatory developments were reported in the recent period.
News Sentiment
The overall sentiment from recent updates is cautiously positive, driven by strong revenue and profit growth in fiscal 2025 and technological advancements in AI applications. Neutral tones arise from the absence of major strategic shifts or leadership changes, while the focus remains on operational execution and market positioning. The positive financial performance is tempered by ongoing market volatility and mixed technical signals noted in external analyses. Collectively, the news suggests steady progress with measured optimism about future growth prospects.
Source List
- https://www.genesys.com/company/newsroom/announcements
- https://www.alphaspread.com/security/nse/genesys/investor-relations
- https://www.genesys.com/en-sg/company/newsroom/announcements
- https://www.stockinsights.ai/in/GENESYS/announcement/earnings-reports-20250530-2d1
- https://www.genesys.com/company/newsroom/announcements/genesys-announces-strong-second-quarter-fiscal-year-2026-momentum-and-advances-agentic-ai-for-the-experience-economy-at-xperience-2025
Analytical Overview
Analysis Summary
Genesys International Corporation Ltd.'s valuation metrics show a trailing P/E of 22.4 and a forward P/E of 15.9, which are below some industry peers, suggesting a relatively attractive valuation compared to the broader software application sector. Revenue growth has been negative recently at -14.9% quarterly, but the company demonstrated a 55.16% rise in revenue for fiscal 2025, indicating mixed growth signals. Cash flow trends reveal negative operating cash flow of approximately INR -1.07 billion TTM but positive levered free cash flow of INR 562 million, reflecting some cash generation despite operational challenges. The company faces sector-specific challenges including competitive pressures in geospatial data services and the need for ongoing technological innovation, while opportunities exist in expanding AI applications and smart city projects. Considering the Indian market environment, regulatory stability and increasing demand for digital infrastructure data provide a supportive backdrop for Genesys's business model.
Overall Business and Market Assessment
Supporting Factors: No data
Risk Factors: competitive dynamics and the need to improve operating margins
SWOT Analysis
Strengths
- Strong expertise in geospatial data and advanced mapping technologies.
- Solid current ratio of 2.86 indicating good short-term liquidity.
- Reasonable return on equity of approximately 10% demonstrating moderate profitability.
- Niche market positioning supporting digital transformation across multiple sectors.
Weaknesses
- Negative operating margin indicating operational inefficiencies.
- Recent quarterly revenue decline of 14.9% signaling potential sales challenges.
- Negative operating cash flow despite positive free cash flow.
- Low institutional investor holding at 2.49% limiting large-scale investment support.
Opportunities
- Growing demand for smart city and infrastructure planning data.
- Advancements in AI and agentic technologies to enhance service offerings.
- Expansion potential in government and utility sectors requiring geospatial data.
- Increasing digitization trends in India supporting long-term growth.
Threats
- Competitive pressures from larger technology and mapping firms.
- Volatility in stock price and mixed technical signals affecting investor sentiment.
- Potential regulatory changes impacting data collection and privacy.
- Economic slowdowns affecting infrastructure and urban development spending.
Company Description
Genesys International Corporation Ltd. is a geospatial services company specializing in providing a variety of advanced mapping solutions and location-based services. Its primary function is to offer highly precise, digital geospatial data for a range of industries, including urban development, infrastructure management, transportation, and telecommunications. The company employs cutting-edge technologies such as LiDAR scanning, remote sensing, and digital image processing to produce high-accuracy data that supports intelligent decision-making and strategic planning. By supplying comprehensive geospatial frameworks, Genesys International aids governments, enterprises, and utility services in optimizing operations and enhancing service delivery. Regarded as a pioneer in the geospatial domain, the company's market significance lies in its ability to drive digital transformation across multiple sectors by providing data that is critical for spatial analysis, infrastructure planning, and smart city development.