
Firstsource Solutions Ltd (FSL)
Stock Analysis Report
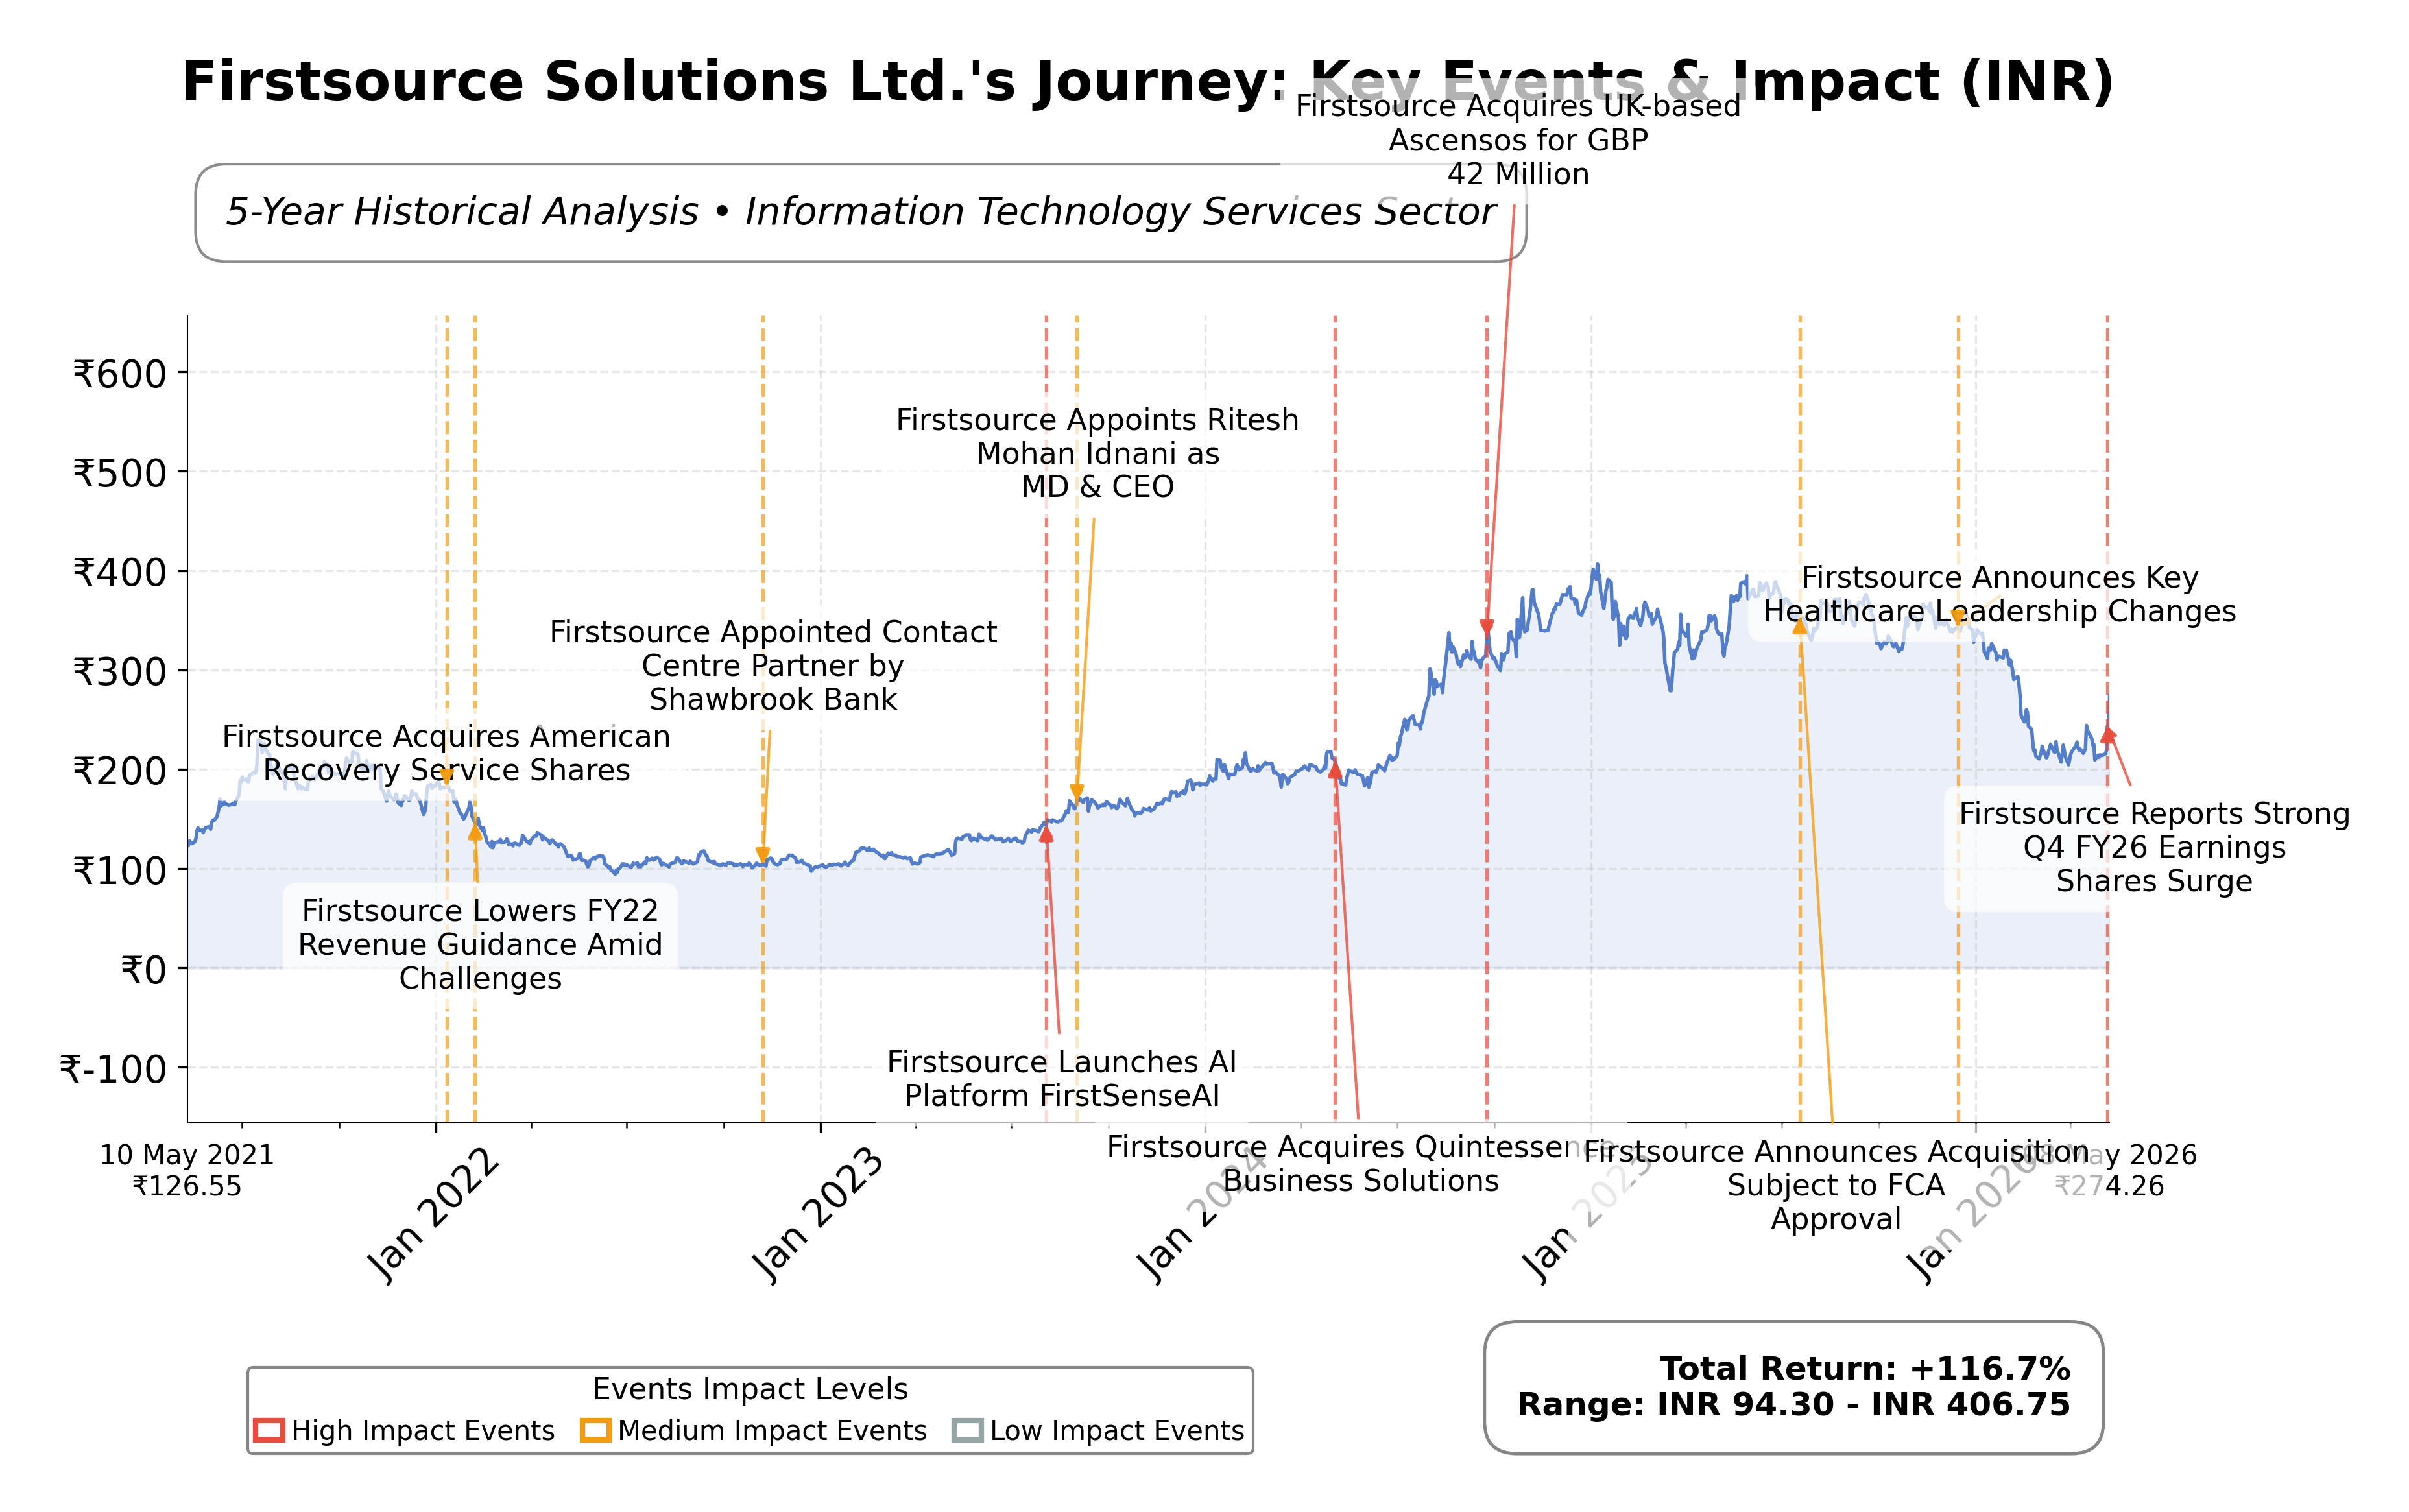
Stock Journey
Key Positives and Key Risks
Pros
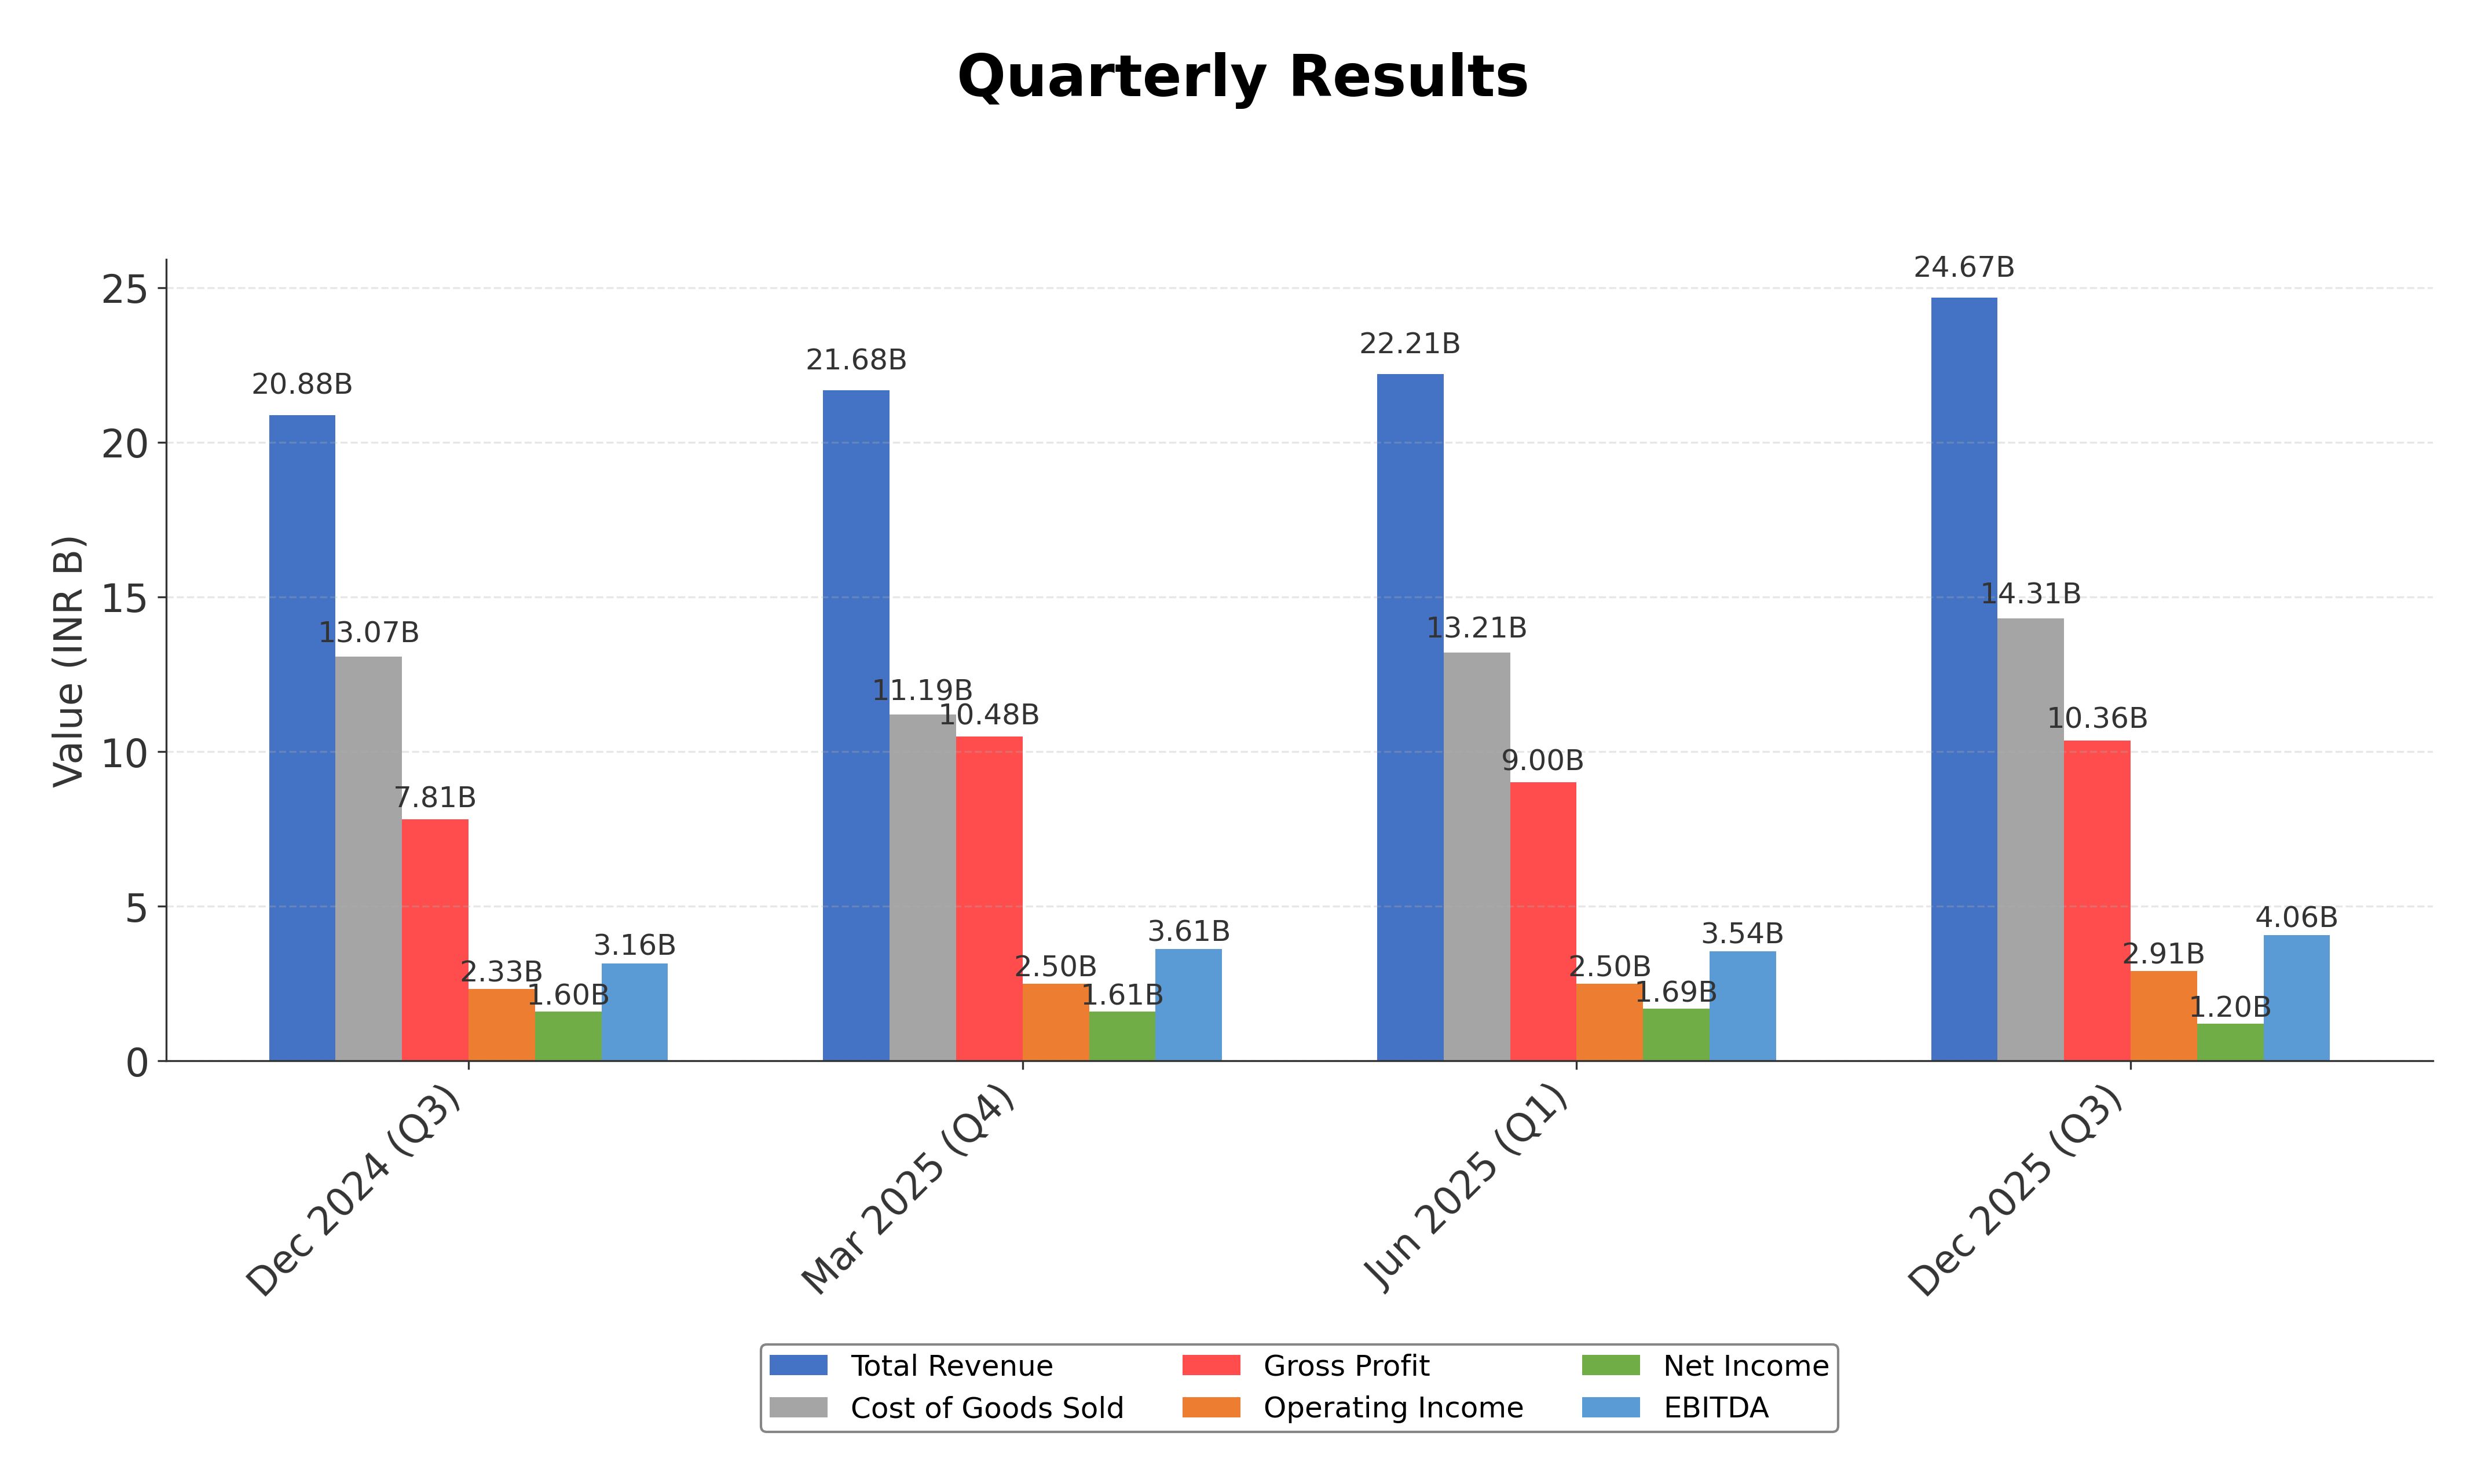
- Strong revenue growth of 19.5% quarterly and 27.7% earnings growth year-over-year indicating robust business momentum.
- Healthy operating cash flow of INR 12.14 billion and free cash flow of INR 9.44 billion supporting financial flexibility.
- Moderate valuation with forward P/E of 17.39 suggesting market expectations for earnings growth.
Cons
- Debt-to-equity ratio of 66.6% reflects moderate leverage and increased debt levels requiring monitoring.
- Current ratio of 0.794 indicates potential short-term liquidity constraints.
- Regulatory delays impacted key contract implementations, introducing operational risks.
Disclosure: This information is for general awareness and does not constitute investment advice
Report Summary
Firstsource Solutions Ltd. operates as a global business process outsourcing (BPO) provider, delivering technology-driven solutions across sectors such as banking, financial services, insurance, telecommunications, healthcare, and media. Listed on the National Stock Exchange of India (NSE) under the symbol FSL, the company is positioned within the Technology sector, specifically the Information Technology Services industry. Firstsource leverages analytics, digital solutions, and best practices to enhance operational efficiency and customer experience for its clients, maintaining a significant presence both domestically and internationally.
Financially, Firstsource reported trailing twelve months (TTM) revenue of approximately INR 95.56 billion with a gross margin of 41.99%, operating margin of 12.17%, and a net profit margin of 7.06%. The company’s return on equity (ROE) stands at 15.9%, return on assets (ROA) at 8.14%, and return on invested capital (ROIC) is consistent with these efficiency metrics. These figures indicate solid profitability and effective asset utilization, supported by a quarterly revenue growth rate of 19.5% and a year-over-year earnings growth of 27.7%.
Valuation metrics show a trailing price-to-earnings (P/E) ratio of 28.8 and a forward P/E of 17.39, suggesting the market anticipates earnings growth. The price-to-book (P/B) ratio is 4.35, and the enterprise value to EBITDA (EV/EBITDA) multiple is 12.12. The market capitalization is approximately INR 189.34 billion. The stock’s 52-week price range spans from INR 202 to INR 403.8, with the current price near INR 272, reflecting a downside risk of about 25.6% from the high.
Strengths include strong cash flow generation with operating cash flow of INR 12.14 billion and free cash flow of INR 9.44 billion, moderate debt levels with a debt-to-equity ratio of 66.6%, and leadership in the BPO sector with a robust deal pipeline. Risks involve regulatory delays impacting key contracts, sector-specific challenges such as slower growth in consumer technology verticals, and macroeconomic factors affecting client industries. Recent strategic developments include securing 17 large deals in FY26 and positive market response to Q4FY26 earnings and FY27 growth guidance.
Technically, the stock shows mixed signals with price below the 200-day moving average but above the 50-day average, accompanied by momentum indicators suggesting cautious optimism. Recent news highlights strong volume surges and positive brokerages’ outlooks. Overall, the data suggests a nuanced market stance where accumulation and monitoring of developments may be prudent given the company’s growth prospects and valuation dynamics.
Company and Industry Overview
Company Basics
Price Performance
Company Size
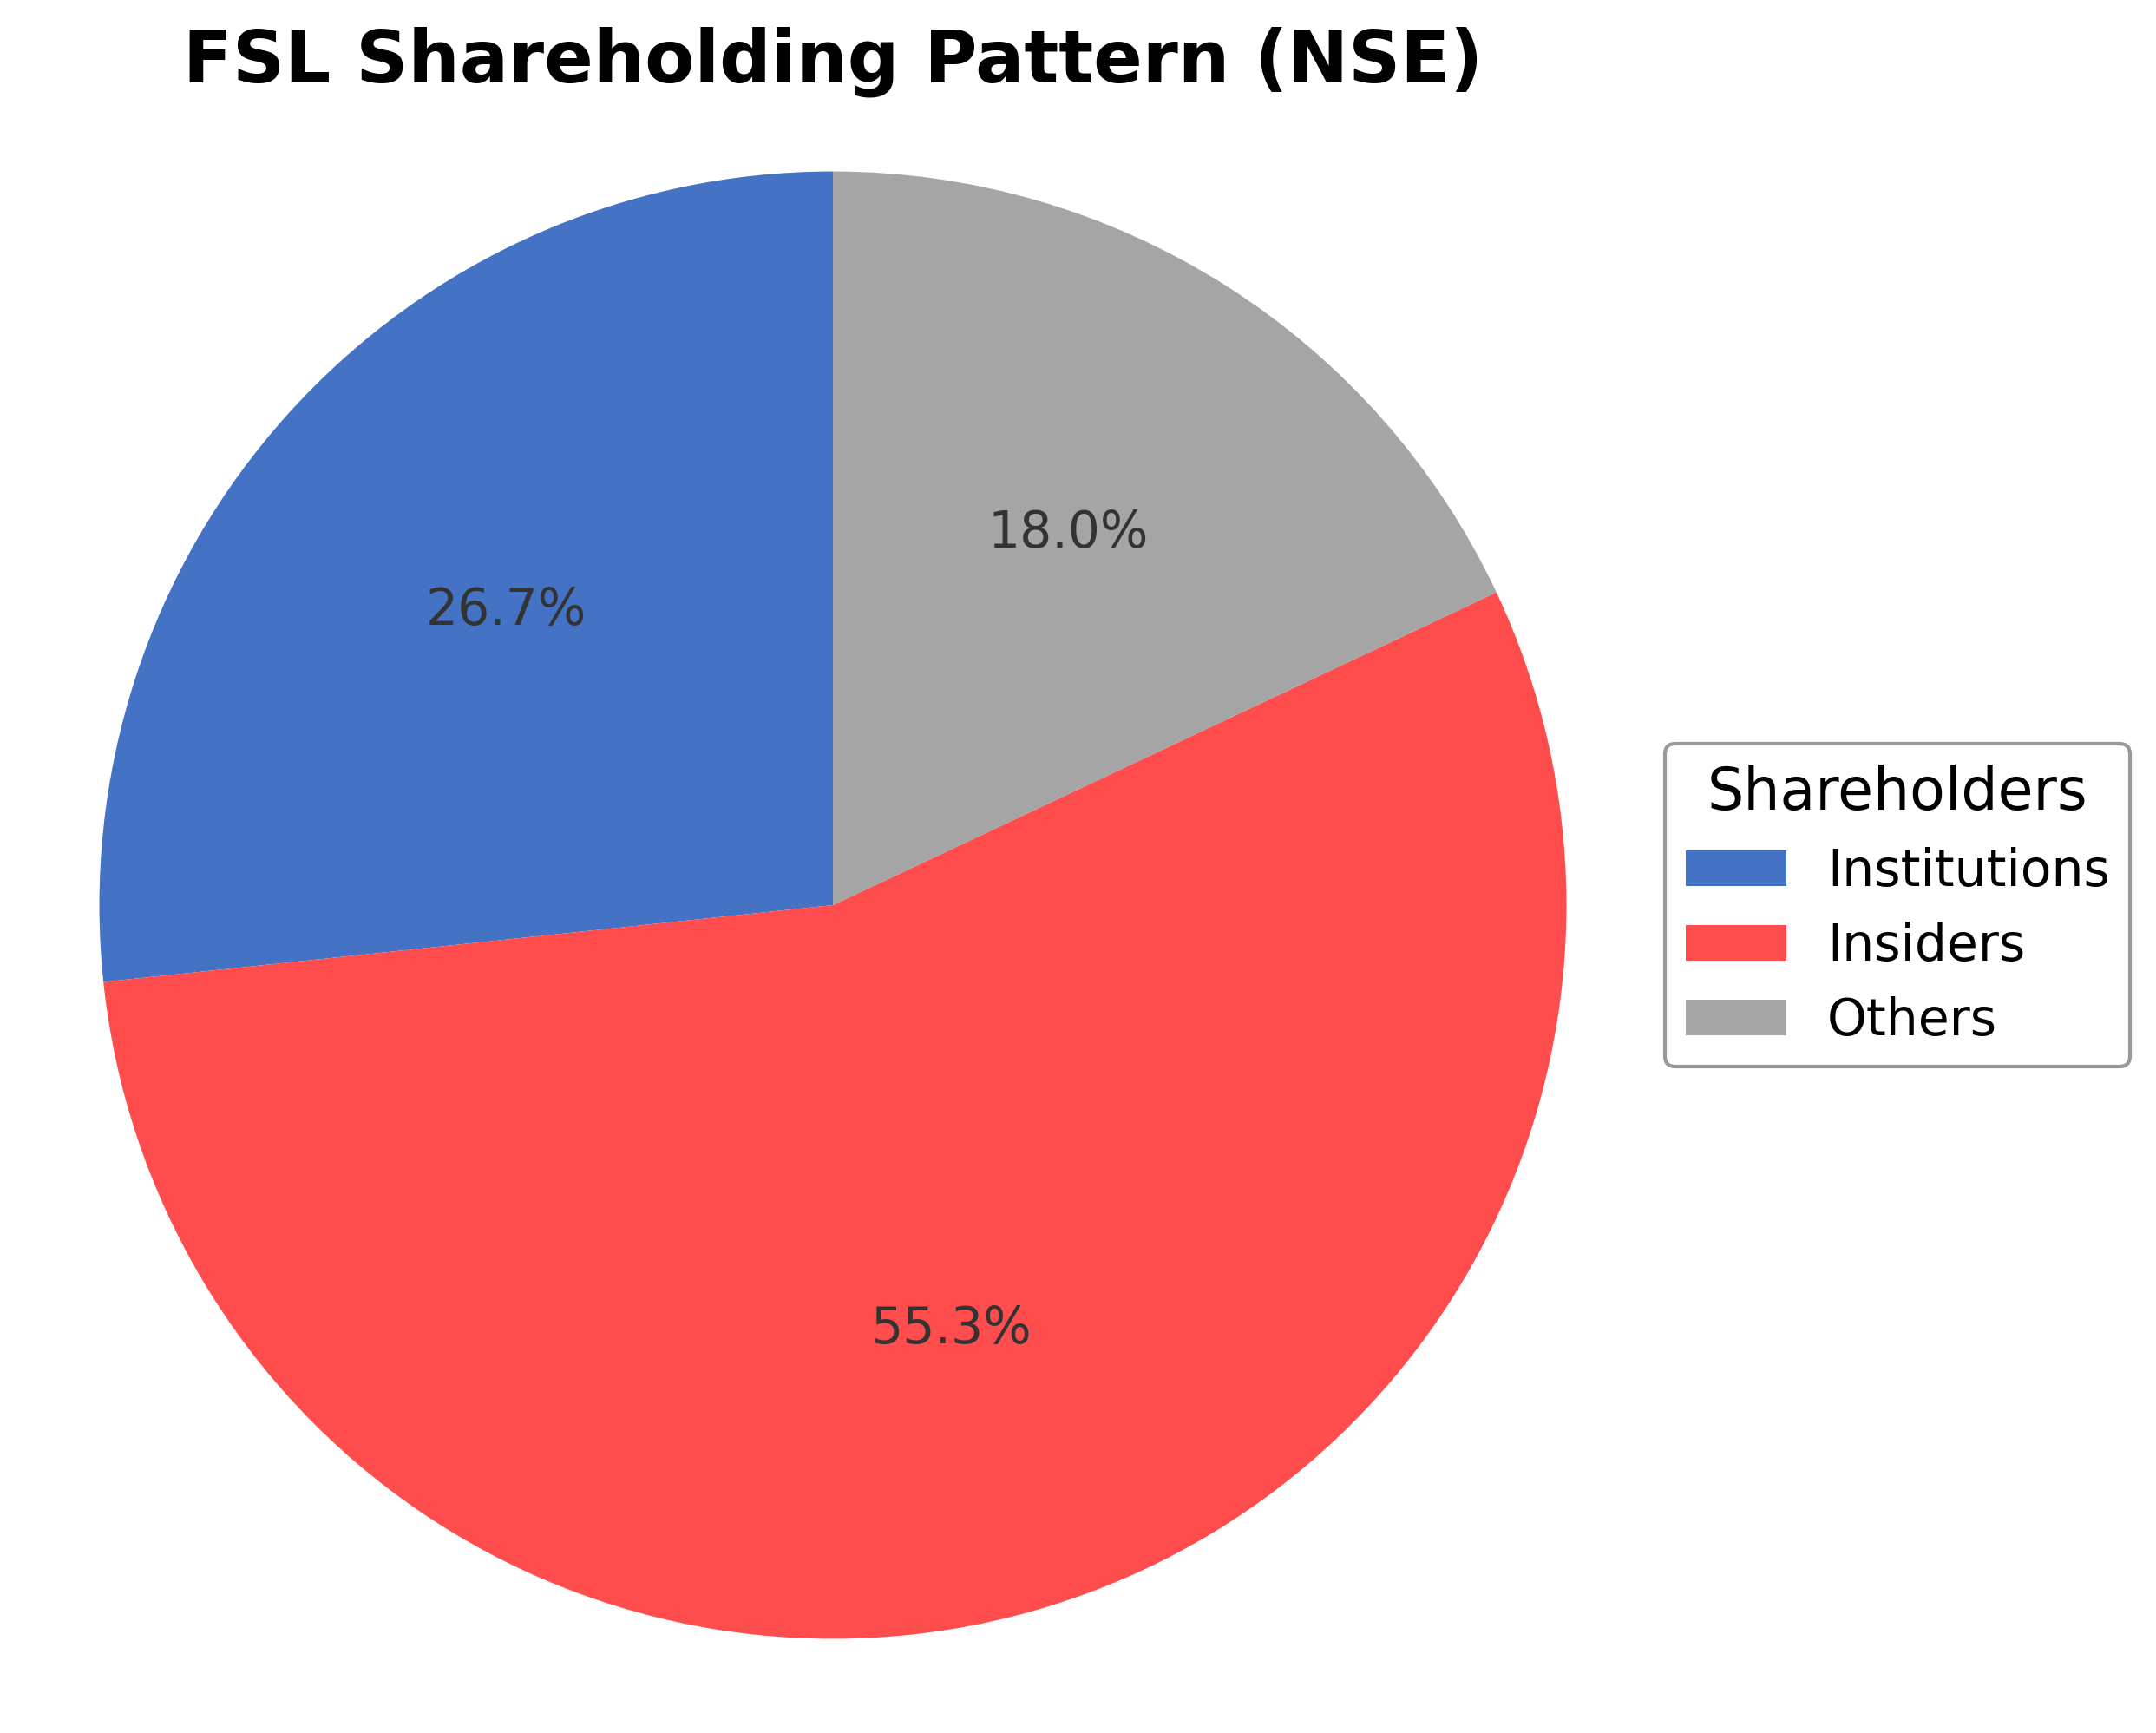
Shareholding Pattern
Sector and Industry Analysis
The business process management (BPM) sector, particularly digital BPM, has seen robust growth driven by increasing adoption of automation, AI, and analytics across industries such as healthcare, BFSI, and telecom. The global BPM market is expanding rapidly, fueled by demand for cost efficiencies and enhanced customer experience. Key players include Firstsource Solutions, Infosys BPM, and WNS Global Services, with a strong focus on platformization and outcome-based service models.
Industry trends highlight a shift from traditional contact center services to digital-first BPM solutions emphasizing healthcare revenue cycle management (RCM), compliance-ready collections, and omnichannel customer experience. Competitive dynamics are shaped by the need for specialized domain expertise, technology integration, and geographic delivery optimization, including onshore and nearshore hubs. Barriers to entry remain high due to regulatory complexity, technology investment, and established client relationships.
Regulatory frameworks, especially in the U.S. healthcare sector, significantly influence BPM operations, with compliance requirements around patient data security and billing accuracy. The industry is adapting to evolving regulations such as HIPAA and healthcare reimbursement policies, which drive demand for automated denial management and pre-authorization services. Ongoing regulatory scrutiny encourages BPM providers to innovate in outcome-based contracting and platform integration to maintain competitive advantage.
Note: Analysis synthesized from industry research, market reports, and regulatory filings. Information is subject to change based on market conditions.
Financial Ratios Dashboard
Illustrative Scenario Analysis
DCF Assumptions:
Method: Two-Stage EPS-Priority Model
Financials
Peer Analysis
| Company Name | Market Cap | P/E Ratio | P/B Ratio | EV/EBITDA | Price to CFO |
|---|---|---|---|---|---|
| Firstsource Solutions Ltd. | ₹189.34B | 28.80 | 4.35 | 12.12 | 15.60 |
| Sonata Software Ltd. | ₹70.59B | 16.05 | 3.99 | 10.80 | 12.47 |
| Eclerx Services Ltd. | ₹155.51B | 22.88 | 5.97 | 16.52 | 24.49 |
| Tata Technologies Ltd. | ₹236.06B | 44.42 | 6.61 | 30.83 | 34.62 |
| L&T Technology Services Ltd. | ₹403.08B | 32.89 | 6.51 | 19.52 | 27.70 |
| Tech Mahindra Ltd. | ₹1.31T | 27.18 | 4.75 | 13.82 | 21.15 |
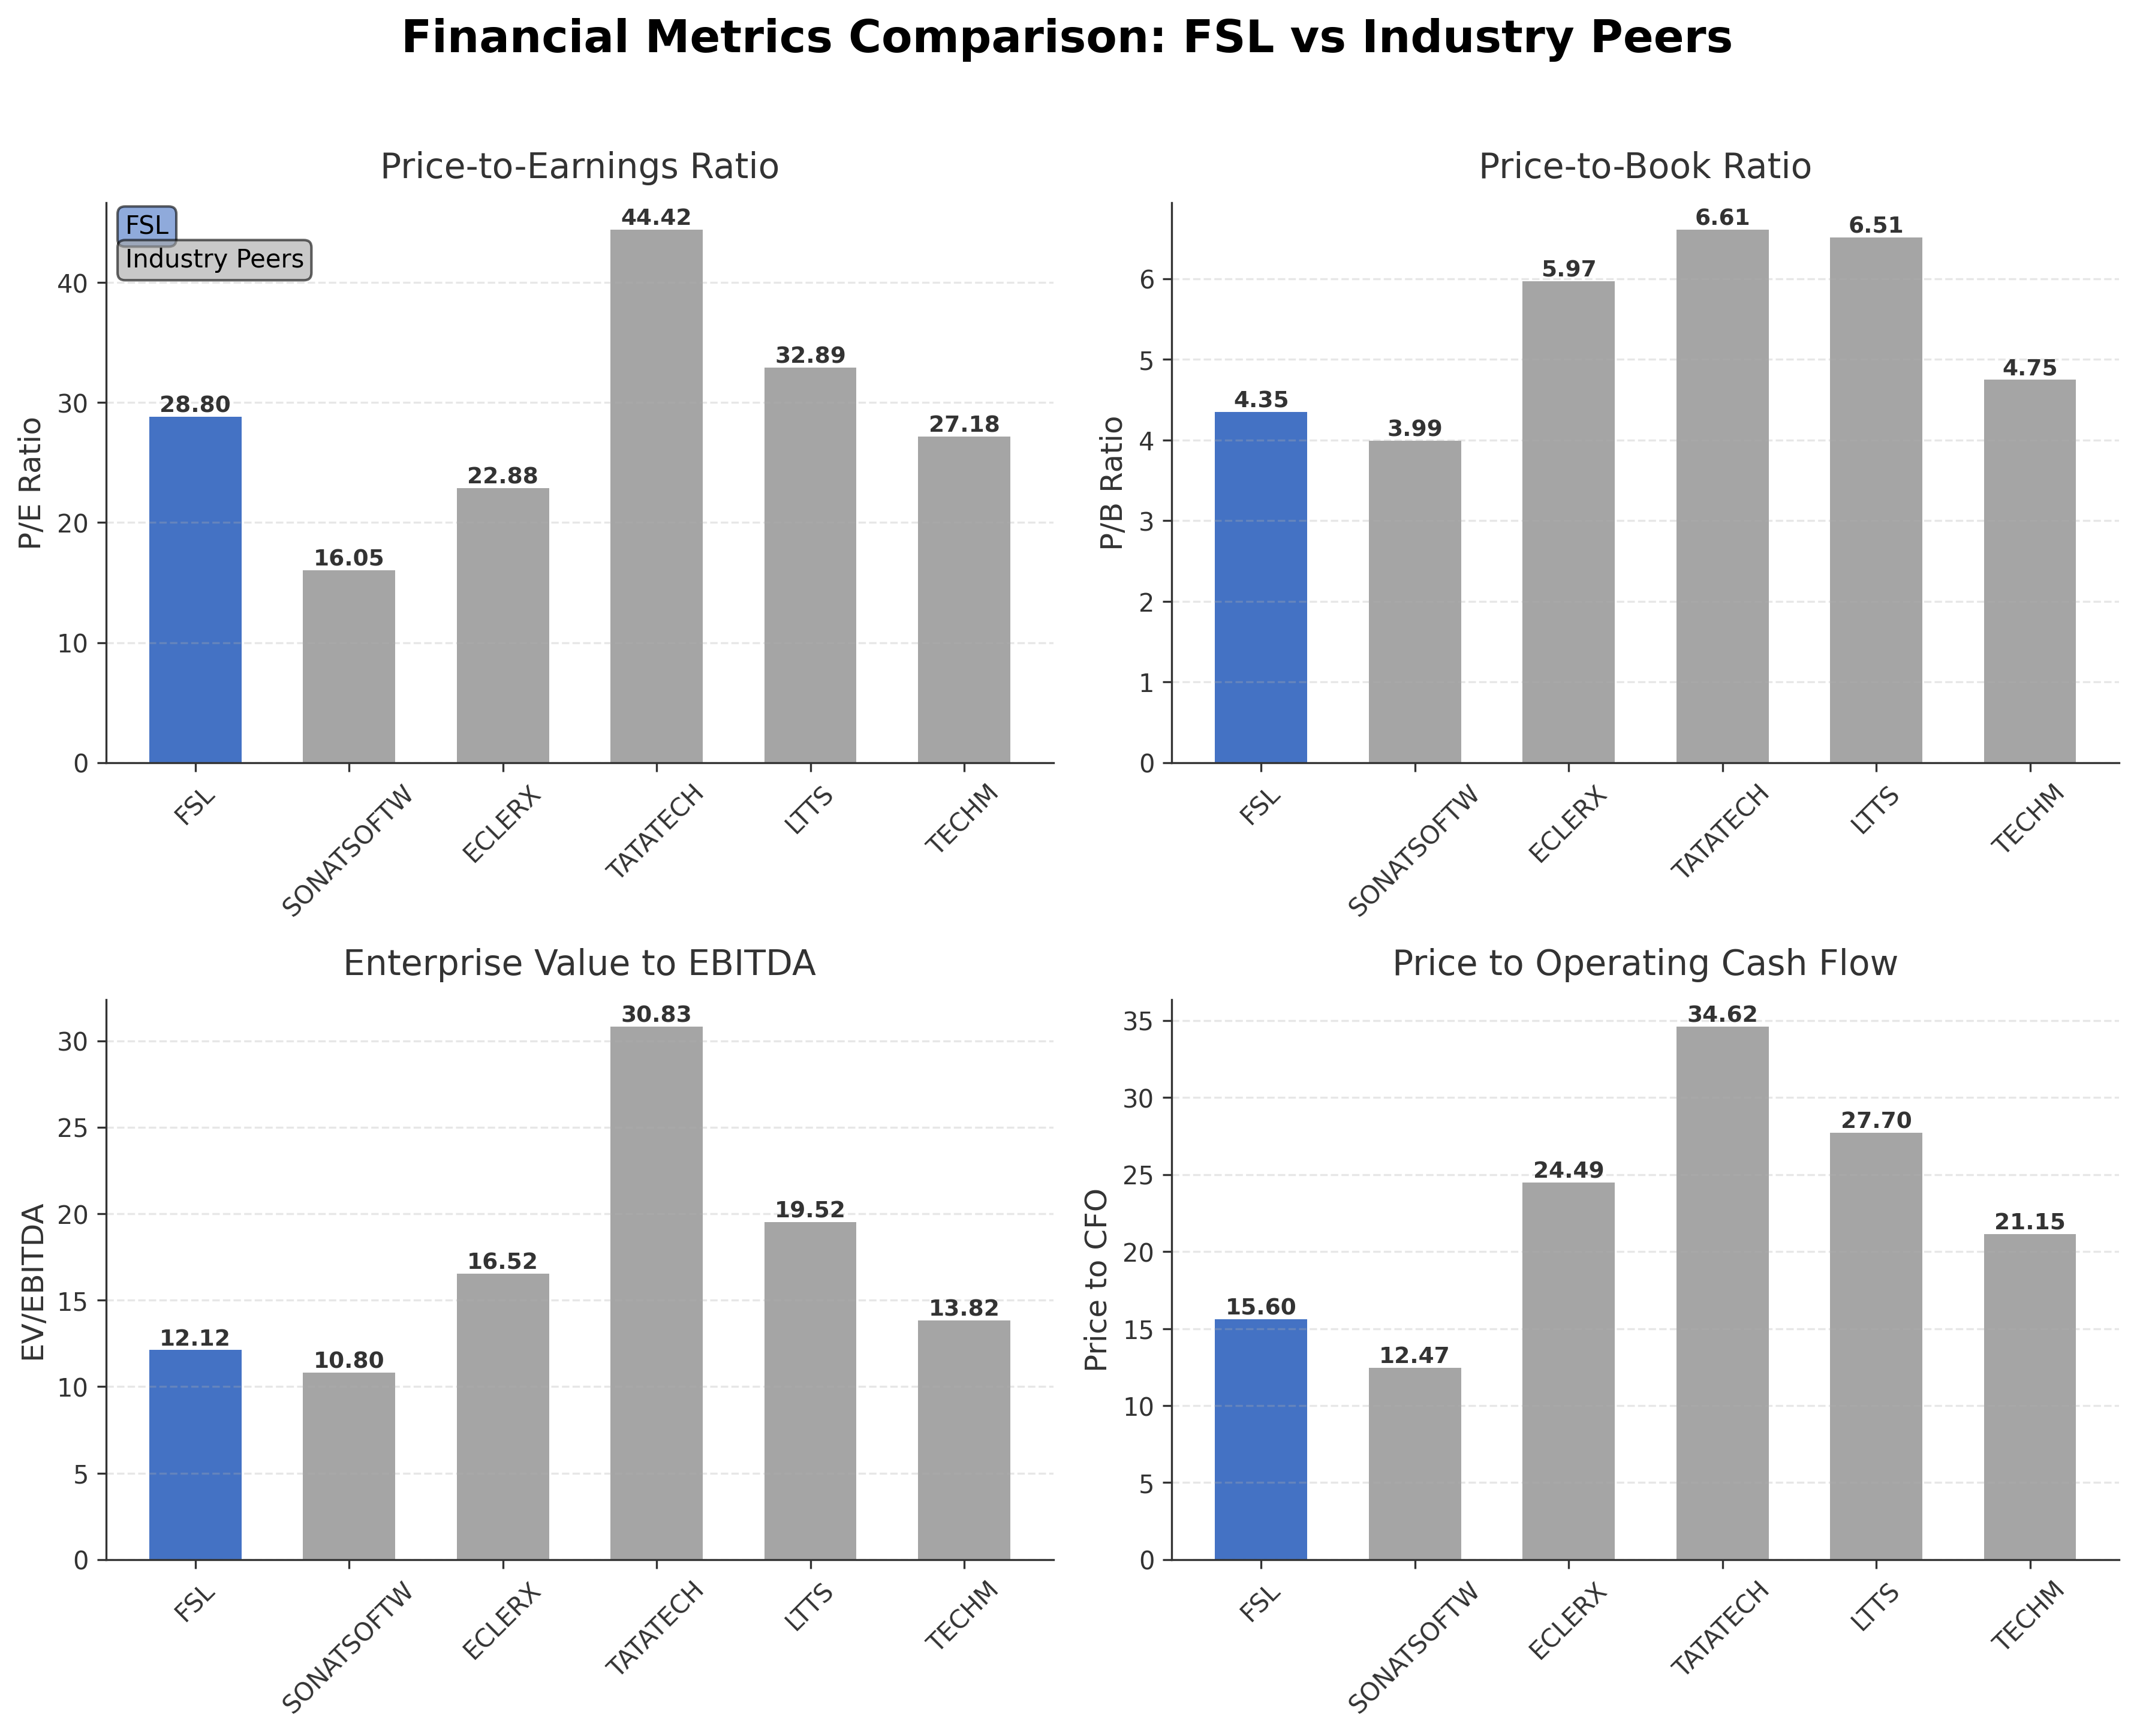
Comparison Analysis: Firstsource Solutions Ltd. exhibits a moderate valuation with a trailing P/E of 28.8, higher than peers like Sonata Software (16.05) and Eclerx Services (22.88), but lower than Tata Technologies (44.42) and L&T Technology Services (32.89). Its P/B ratio of 4.35 is competitive, below several peers such as Tata Technologies and LTTS, indicating relatively reasonable book value pricing. The EV/EBITDA multiple at 12.12 is lower than the industry leaders Tata Technologies and LTTS, suggesting better operational valuation. Return on equity at 15.9% is solid but trails behind Sonata Software and Eclerx, reflecting room for efficiency improvements. Overall, Firstsource balances moderate valuation with stable profitability compared to regional industry peers.
Financial Metrics Comparison with Peers
Financial Statements
Comprehensive financial data including income, balance sheet, and cash flow metrics
Income Statement
| fiscal_date | 2025-03-31 | 2024-03-31 | 2023-03-31 | 2022-03-31 | 2021-03-31 |
|---|---|---|---|---|---|
| Sales | 79.72B | 63.33B | 59.86B | 58.66B | 50.33B |
| Cost Of Goods | 47.64B | 37.89B | 37.41B | 38.15B | 33.90B |
| Gross Profit | 32.08B | 25.43B | 22.44B | 20.50B | 16.42B |
| Operating Expense Selling General And Administrative | 5.06B | 3.93B | 3.31B | 2.00B | 1.72B |
| Operating Expense Other Operating Expenses | 10.82B | 8.66B | 8.09B | 6.65B | 4.83B |
| Operating Income | 8.88B | 7.34B | 5.95B | 7.33B | 6.33B |
| Non Operating Interest Income | 26.84M | 9.88M | 10.34M | 4.74M | 6.98M |
| Non Operating Interest Expense | 1.48B | 1.03B | 789.70M | 639.39M | 522.30M |
| Pretax Income | 7.41B | 6.30B | 6.15B | 6.47B | 4.32B |
| Income Tax | 1.46B | 1.15B | 1.02B | 1.11B | 701.57M |
| Net Income | 5.94B | 5.15B | 5.14B | 5.37B | 3.62B |
| Eps Basic | 8.63 | 7.52 | 7.55 | 7.90 | 5.31 |
| Eps Diluted | 8.42 | 7.34 | 7.32 | 7.62 | 5.13 |
| Basic Shares Outstanding | 688.85M | 684.30M | 680.59M | 680.12M | 681.75M |
| Diluted Shares Outstanding | 688.85M | 684.30M | 680.59M | 680.12M | 681.75M |
| Ebit | 8.89B | 7.33B | 6.94B | 7.11B | 4.84B |
| Ebitda | 12.33B | 9.93B | 9.53B | 9.58B | 8.04B |
| Net Income Continuous Operations | 7.41B | 6.30B | 6.15B | 6.47B | 4.32B |
| Minority Interests | 40.00K | 40.00K | 80.00K | 8.44M | 90.00K |
| Preferred Stock Dividends | 0.00 | 0.00 | 0.00 | 0.00 | 0.00 |
Source: Financial statements and regulatory filings
Balance Sheet
| fiscal_date | 2025-03-31 | 2024-03-31 | 2023-03-31 | 2022-03-31 | 2021-03-31 |
|---|---|---|---|---|---|
| Cash And Cash Equivalents | 126.99M | 689.41M | 1.38B | 956.04M | 1.22B |
| Accounts Receivable | 11.68B | 8.61B | 6.80B | 6.45B | 5.77B |
| Total Assets | 79.22B | 60.83B | 56.64B | 57.09B | 48.30B |
| Total Liabilities | 38.24B | 23.82B | 22.97B | 26.75B | 20.30B |
| Long Term Debt | 11.49B | 5.76B | 5.86B | 8.99B | 5.71B |
| Shareholders Equity | 40.98B | 37.01B | 33.67B | 30.33B | 28.00B |
Source: Financial statements and regulatory filings
Cash Flow Statement
| fiscal_date | 2025-03-31 | 2024-03-31 | 2023-03-31 | 2022-03-31 | 2021-03-31 |
|---|---|---|---|---|---|
| Operating Activities Net Income | 7.41B | 6.30B | 6.15B | 6.47B | 4.32B |
| Operating Activities Stock Based Compensation | 715.88M | 31.34M | 227.92M | 320.00M | 208.88M |
| Operating Activities Other Non Cash Items | 1.36B | 354.24M | -1.26B | 634.65M | 515.32M |
| Operating Activities Accounts Receivable | -5.44B | -2.81B | -256.85M | -479.67M | -770.41M |
| Operating Activities Other Assets Liabilities | 498.06M | 408.68M | 1.02B | -1.40B | 3.67B |
| Operating Activities Operating Cash Flow | 4.54B | 4.28B | 5.88B | 5.54B | 7.94B |
| Investing Activities Capital Expenditures | -2.24B | -850.43M | -514.23M | -543.11M | -1.70B |
| Investing Activities Net Acquisitions | -5.10B | N/A | 0.00 | -5.07B | -950.00M |
| Investing Activities Purchase Of Investments | -26.46B | -16.91B | -14.56B | -16.02B | -12.62B |
| Investing Activities Sale Of Investments | 26.30B | 17.23B | 15.19B | 15.69B | 11.81B |
| Investing Activities Other Investing Activity | 8.55M | -63.72M | 30.00M | -12.96M | -41.92M |
| Investing Activities Investing Cash Flow | -7.49B | -589.81M | 153.19M | -5.95B | -3.49B |
| Financing Activities Long Term Debt Issuance | 3.38B | 41.16M | 50.49M | 3.01B | 1.62B |
| Financing Activities Long Term Debt Payments | -1.79B | -1.61B | -424.96M | -1.55B | -94.28M |
| Financing Activities Short Term Debt Issuance | 5.20B | 1.28B | -1.98B | 2.44B | -4.20B |
| Financing Activities Common Stock Repurchase | -362.00M | N/A | -139.58M | -462.66M | -652.81M |
| Financing Activities Common Dividends | -2.76B | -2.41B | -2.38B | -2.38B | -2.04B |
| Financing Activities Other Financing Charges | -224.82M | -583.32M | -276.40M | -887.28M | N/A |
| Financing Activities Financing Cash Flow | 3.44B | -3.22B | -5.15B | 208.05M | -5.28B |
| End Cash Position | 1.54B | 1.75B | 1.52B | 828.20M | 1.32B |
| Free Cash Flow | 4.60B | 5.60B | 7.41B | 6.19B | 8.02B |
| Financing Activities Common Stock Issuance | N/A | 58.85M | N/A | 37.32M | 82.15M |
Source: Financial statements and regulatory filings
Technical Analysis
Key Insights
- Current trend shows a mixed price action with the stock trading below its 200-day moving average (₹305.93) but above the 50-day moving average (₹219.60), indicating intermediate support.
- Key support is observed near ₹202 (52-week low) and ₹220 levels, while resistance is noted around ₹275 and the 200-day moving average at ₹306.
- The stock is positioned above the 10-day and 50-day moving averages but remains below the 200-day moving average, suggesting short-term strength amid longer-term caution.
- Momentum indicators show RSI near neutral levels around 50-55, MACD indicating a potential bullish crossover, and stochastic oscillators reflecting moderate upward momentum.
- Multi-timeframe analysis reveals daily charts with consolidation, weekly charts showing a recent upward move, and monthly charts indicating a longer-term downtrend from the 52-week high.
- Potential scenarios include a rebound towards the 200-day moving average if momentum sustains or a retest of support levels near ₹220 if selling pressure increases.
Trending News
1. Headline: Firstsource Solutions Limited Announces Schedule for Analyst and Institutional Investor Meetings
Summary: The company emphasized that the discussions will focus on developments already available to the public. The schedule provided is subject to changes due to exigencies. The disclosure was officially signed by Pooja Suresh Nambiar, Company Secretary of Firstsource Solutions Ltd. Historical Stock ...
Sentiment: neutral
2. Headline: Firstsource Solutions Ltd Sees Exceptional Volume Surge Amidst Market Outperformance
Summary: Firstsource Solutions Ltd (FSL) emerged as one of the most actively traded stocks on 8 May 2026, registering a remarkable volume surge that propelled its share price to outperform its sector and broader market indices. The stock’s robust trading activity, coupled with significant price ...
Sentiment: positive
3. Headline: Firstsource Solutions Ltd Surges 8.74% to Day's High of Rs 253.8 — Outperforms Sector by 3.81 Percentage Points
Summary: The Sensex declined 0.51% on 8 May 2026, while Firstsource Solutions Ltd surged 8.74%, reaching an intraday high of Rs 253.8. This 3.81 percentage-point outperformance over the BPO/ITeS sector's 3.98% gain highlights a distinctly stock-specific rally within a broadly weak market environment.
Sentiment: positive
4. Headline: Firstsource Solutions Share Price Jumps 17% on Friday; Here’s Why
Summary: Despite weakness in frontline indices, strong stock-specific buying momentum remained visible in select IT and BPM counters after quarterly earnings announcements. In this segment, Firstsource Solutions emerged among the Top Gainers of the day after the company reported its Q4FY26 and FY26 financial results along with FY27 growth guidance. Firstsource Solutions share price surged 17.04 per cent to Rs 275.25 on Friday. Every portfolio needs a growth engine. DSIJ’s Flash News ...
Sentiment: positive
5. Headline: Firstsource Solutions shares zoom 18% on heavy volumes; brokerages upbeat | Markets News - Business Standard
Summary: Firstsource Solutions shares price: Given the strong pipeline and healthy guidance, analysts at ICICI Securities upgraded Firstsource Solutions (FSL) to 'Buy', with a revised target price of ₹290.
Sentiment: positive
Recent Updates
News Summary
As of May 8, 2026. Firstsource Solutions Ltd reported strong Q4FY26 and FY26 financial results with a 19.5% year-on-year revenue growth and an improved EBIT margin of 12.2%, marking the sixth consecutive quarter of margin expansion. The company secured 17 large deals in FY26, demonstrating robust deal momentum and client confidence. Despite regulatory delays affecting a key U.K. collections contract and timing shifts in Medicare Advantage plans, the company maintained positive growth guidance for FY27. Debt increased to Rs.16.3 billion as of March 31, 2026, up from Rs.13.2 billion the previous year, reflecting ongoing investments and operational scaling. The consumer technology vertical showed slower growth at 3% year-on-year, indicating some segment-specific challenges.
News Sentiment
The overall sentiment from recent updates is predominantly positive, driven by strong revenue growth, margin improvements, and a robust deal pipeline. Positive investor response is reflected in significant share price appreciation and upgraded brokerage ratings. However, cautious tones arise from regulatory delays impacting contract execution and increased debt levels, which temper the outlook slightly. The balanced sentiment reflects confidence in operational execution alongside awareness of sector-specific and regulatory challenges. The company’s outlook remains constructive with monitored risks.
Source List
Analytical Overview
Analysis Summary
Firstsource Solutions Ltd.'s valuation metrics, including a trailing P/E of 28.8 and forward P/E of 17.4, are moderately above the industry average of 28.8, indicating market expectations for growth. The PEG ratio is negative at -2.14, reflecting recent earnings growth dynamics. Revenue growth is strong at 19.5% quarterly, supported by consistent cash flow generation with operating cash flow of INR 12.14 billion and free cash flow of INR 9.44 billion, underscoring solid financial health. The company’s debt-to-equity ratio of 66.6% is moderate but warrants monitoring given recent increases. Sector-specific challenges include regulatory delays and slower growth in certain verticals, while opportunities arise from a robust deal pipeline and digital transformation trends. In the Indian market context, regulatory environments and evolving consumer trends influence operational execution and growth prospects.
Overall Business and Market Assessment
Supporting Factors: strong revenue and earnings growth, margin expansion, and a healthy deal pipeline indicating sustained business momentum
Risk Factors: regulatory delays affecting contract implementations, increased debt levels, and segment-specific growth variability
SWOT Analysis
Strengths
- Strong revenue growth with 19.5% quarterly increase and consistent margin expansion.
- Robust cash flow generation supporting operational and strategic initiatives.
- Established market position in global business process outsourcing with diversified client base.
- Healthy deal pipeline with 17 large deals secured in FY26.
Weaknesses
- Moderate debt levels with a debt-to-equity ratio of 66.6% requiring careful management.
- Current ratio below 1 at 0.794 indicating potential short-term liquidity constraints.
- Slower growth in consumer technology vertical at 3% year-on-year.
- Negative PEG ratio reflecting recent earnings growth volatility.
Opportunities
- Expanding digital transformation demand across client industries.
- Potential to capitalize on large deal pipeline for sustained revenue growth.
- Improving operational efficiencies through technology and analytics.
- Favorable Indian regulatory environment supporting IT services sector.
Threats
- Regulatory delays impacting key contract implementations, especially in the U.K.
- Macroeconomic uncertainties affecting client spending in banking and healthcare sectors.
- Increased competition in the global BPO and IT services market.
- Potential volatility in sector-specific verticals such as consumer technology.
Company Description
Firstsource Solutions Ltd. is a prominent global provider of business process outsourcing services. Its primary function is to deliver technology-driven solutions across various sectors to enhance efficiency and customer experience for its clients. The company serves industries such as banking, financial services, insurance, telecommunications, healthcare, and media, offering services ranging from customer management and collections to data processing and digital solutions. As a significant player in the outsourcing market, Firstsource leverages its expertise and innovation to support business transformation for its clients, harnessing technology, analytics, and best practices. Originating from India and having expanded its operations internationally, Firstsource Solutions Ltd. has established itself as a reliable partner for businesses looking to optimize their operational processes and gain a competitive edge in their respective sectors.