

Exide Industries Ltd (EXIDEIND)
Stock Analysis Report
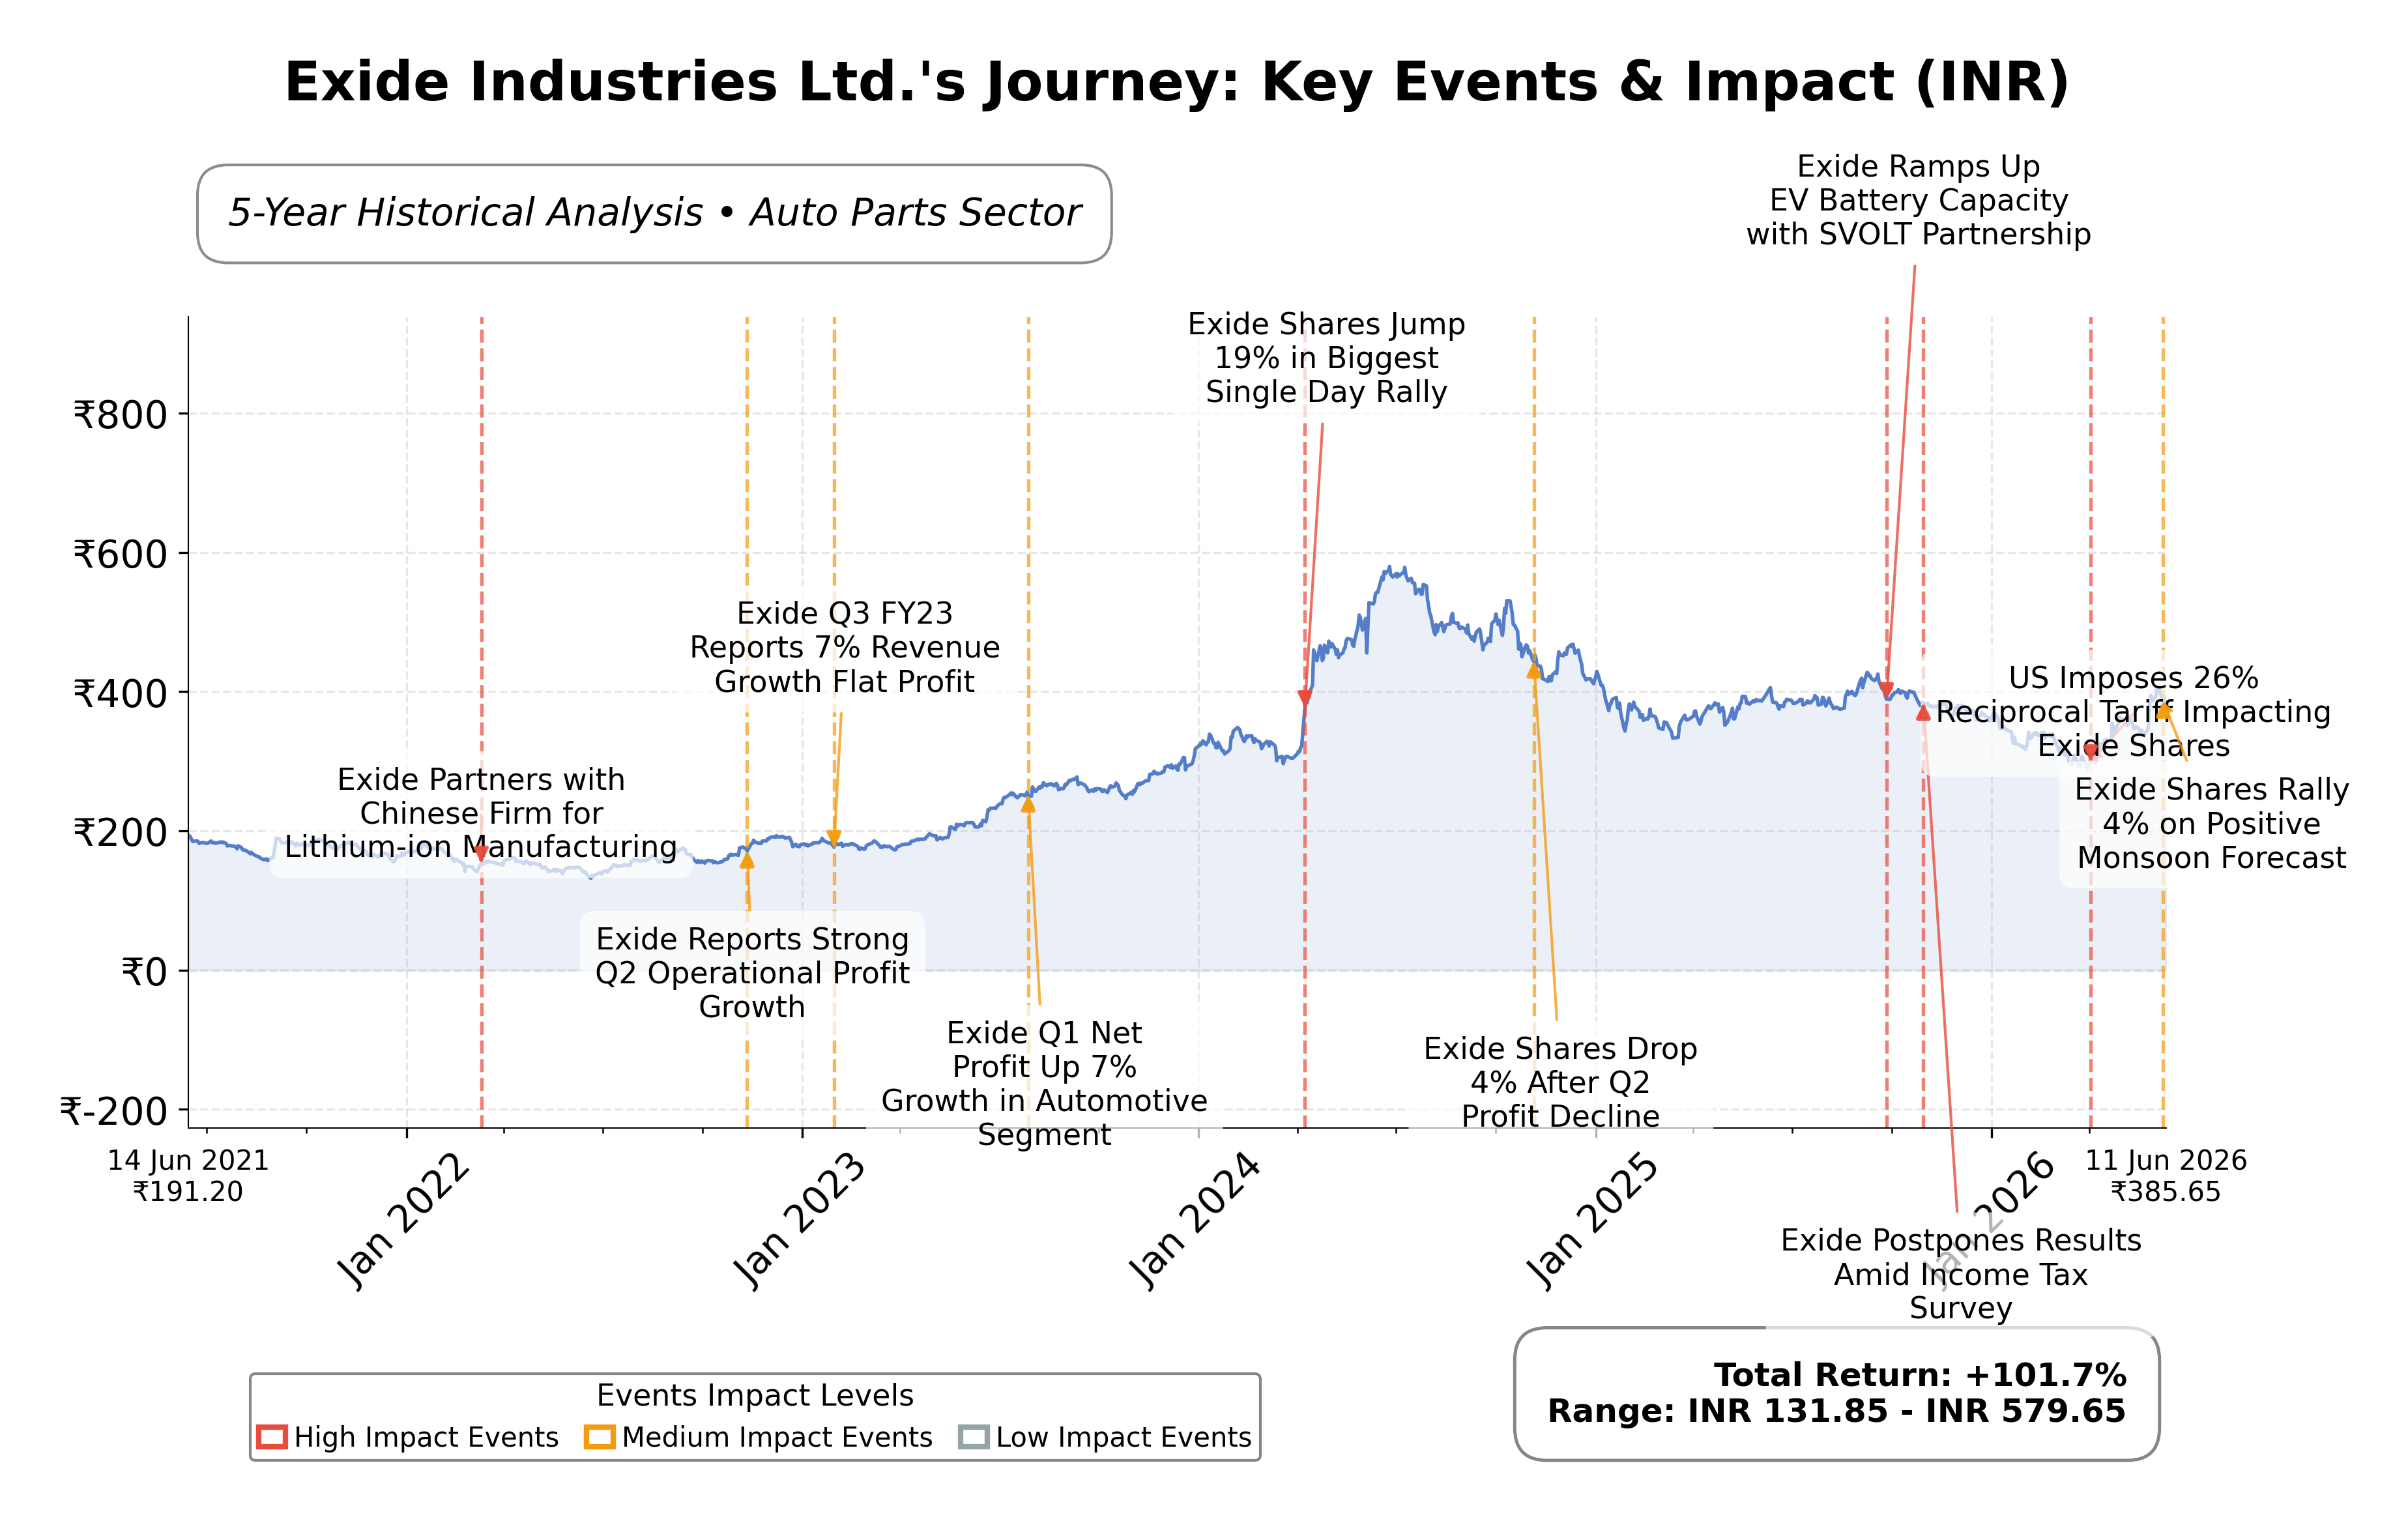
Stock Journey
Key Positives and Key Risks
Pros
- Strong operating cash flow of ₹24.13 billion and free cash flow of ₹12.04 billion support financial stability and growth.
- Low debt-to-equity ratio of 0.11 indicates conservative leverage and manageable financial risk.
- Revenue growth of 9.2% quarterly and net profit margin of 4.75% demonstrate steady operational performance.
Cons
- Trailing P/E ratio of 39.68 is relatively high, suggesting premium valuation compared to profitability.
- Return on equity at 6.17% is lower than most industry peers, indicating less efficient capital utilization.
- Regulatory risk due to NSE’s removal of Exide from the Futures and Options segment may affect market liquidity.
Disclosure: This information is for general awareness and does not constitute investment advice
Report Summary
Exide Industries Ltd. is a prominent Indian manufacturer specializing in lead-acid batteries, catering to automotive and industrial sectors. Listed on the NSE under the Consumer Cyclical sector, the company offers a broad product range including batteries for two-wheelers, four-wheelers, commercial vehicles, as well as industrial applications such as renewable energy storage and backup power systems. With a legacy since 1947, Exide holds a significant market position supported by an extensive distribution network and service centers, addressing diverse energy storage needs across transportation, telecommunications, power utilities, and solar energy sectors.
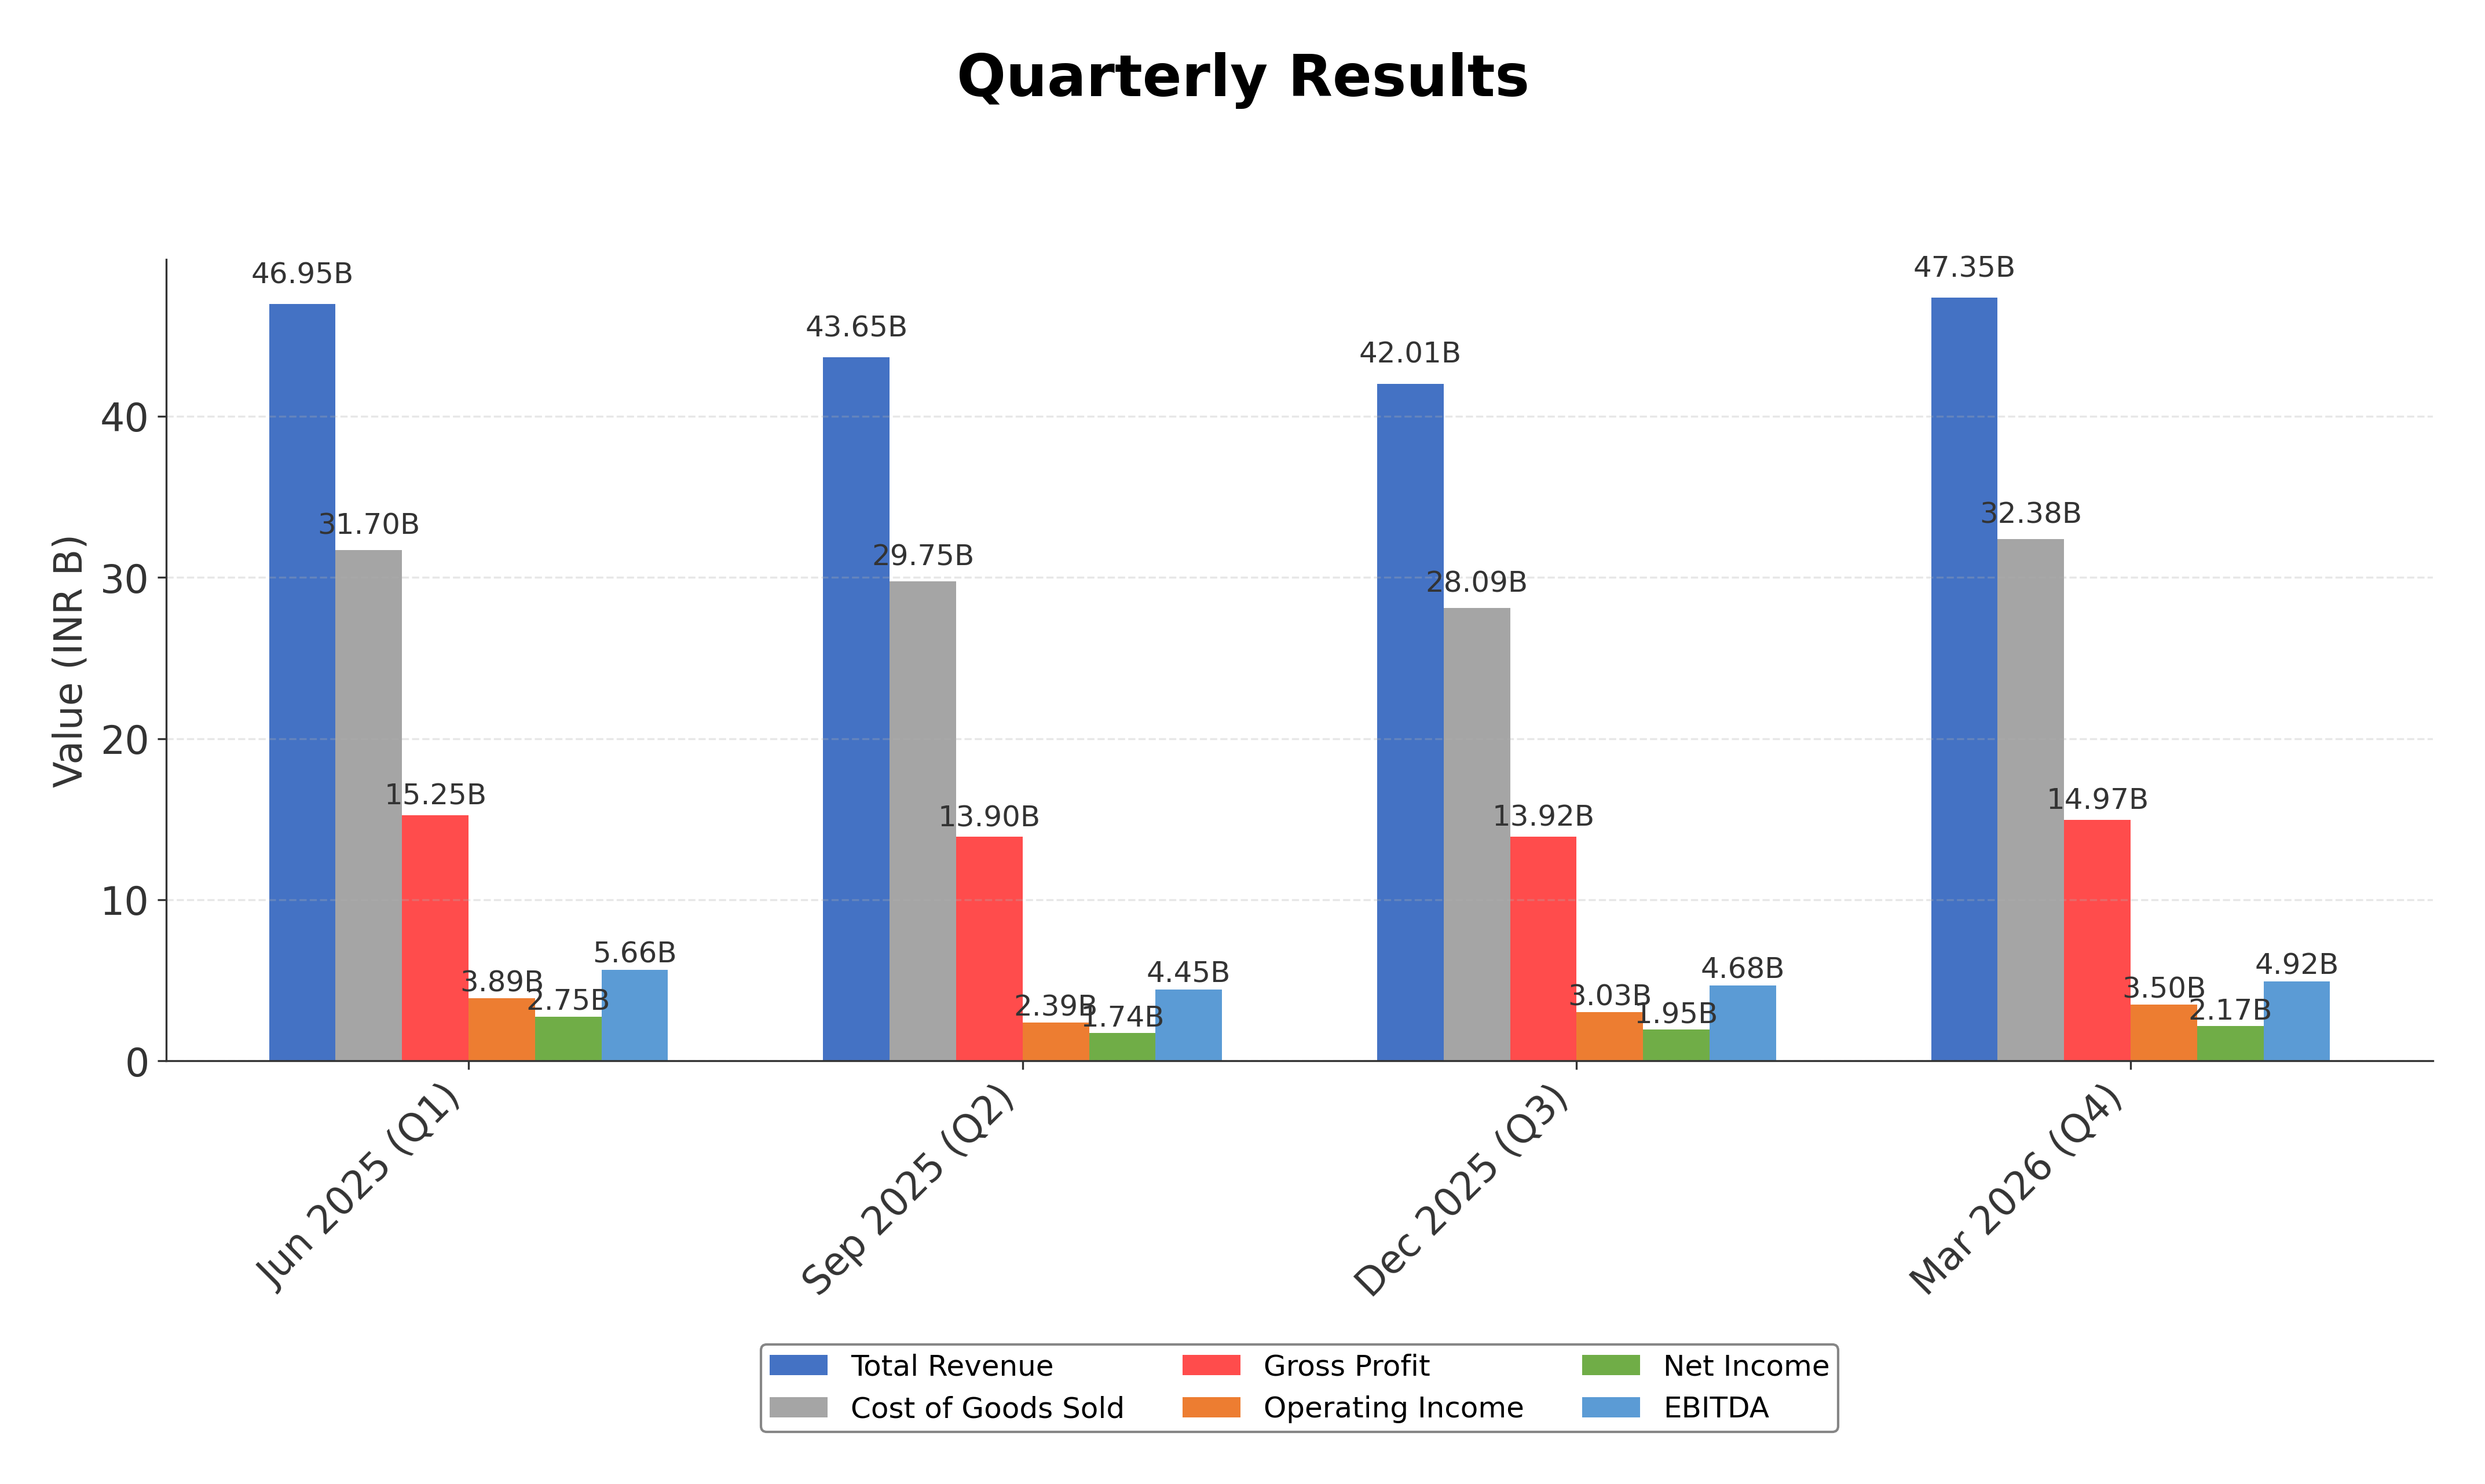
Financially, Exide reported a trailing twelve months (TTM) revenue of approximately ₹179.95 billion with a gross margin of 31.6%, operating margin of 7.39%, and a net profit margin of 4.75%. The company’s return on equity (ROE) stands at 6.17%, return on assets (ROA) at 3.76%, and return on invested capital (ROIC) is consistent with these efficiency metrics. These figures indicate moderate profitability and operational efficiency within its industry context, reflecting steady growth with a quarterly revenue increase of 9.2% and quarterly earnings growth year-over-year of 15.2%.
Valuation metrics reveal a trailing price-to-earnings (P/E) ratio of 39.68, forward P/E of 23.72, and a price-to-book (P/B) ratio of 2.44, with an enterprise value to EBITDA (EV/EBITDA) multiple of 18.45. The market capitalization is approximately ₹339.62 billion. The stock trades at ₹391.20, within a 52-week range of ₹431 (high) to ₹287 (low), indicating the current price is closer to the upper end of its annual trading band. These valuation ratios suggest the stock is priced at a premium relative to some peers, reflecting market expectations of growth and profitability.
Key strengths include strong operating cash flow of ₹24.13 billion and a healthy free cash flow of ₹12.04 billion, coupled with low debt-to-equity ratio of 0.11, indicating prudent financial management. The company benefits from market leadership in the battery segment and a diversified product portfolio aligned with sustainable energy trends. Risks include regulatory changes impacting the derivatives trading segment, as NSE plans to remove Exide from its Futures and Options segment, and competitive pressures from emerging battery technologies. Recent strategic updates highlight continued focus on cost optimization and stable operating margins, with leadership emphasizing efficient procurement.
Technically, the stock shows mixed signals with price action near key moving averages and momentum indicators reflecting moderate strength. Recent news and analyst commentary suggest a cautious but watchful stance, as market participants weigh the company’s fundamentals against sectoral dynamics and regulatory developments. Overall, the data portrays a company with solid operational footing and growth potential, warranting close monitoring of evolving market conditions.
Company and Industry Overview
Company Basics
Price Performance
Company Size
Shareholding Pattern
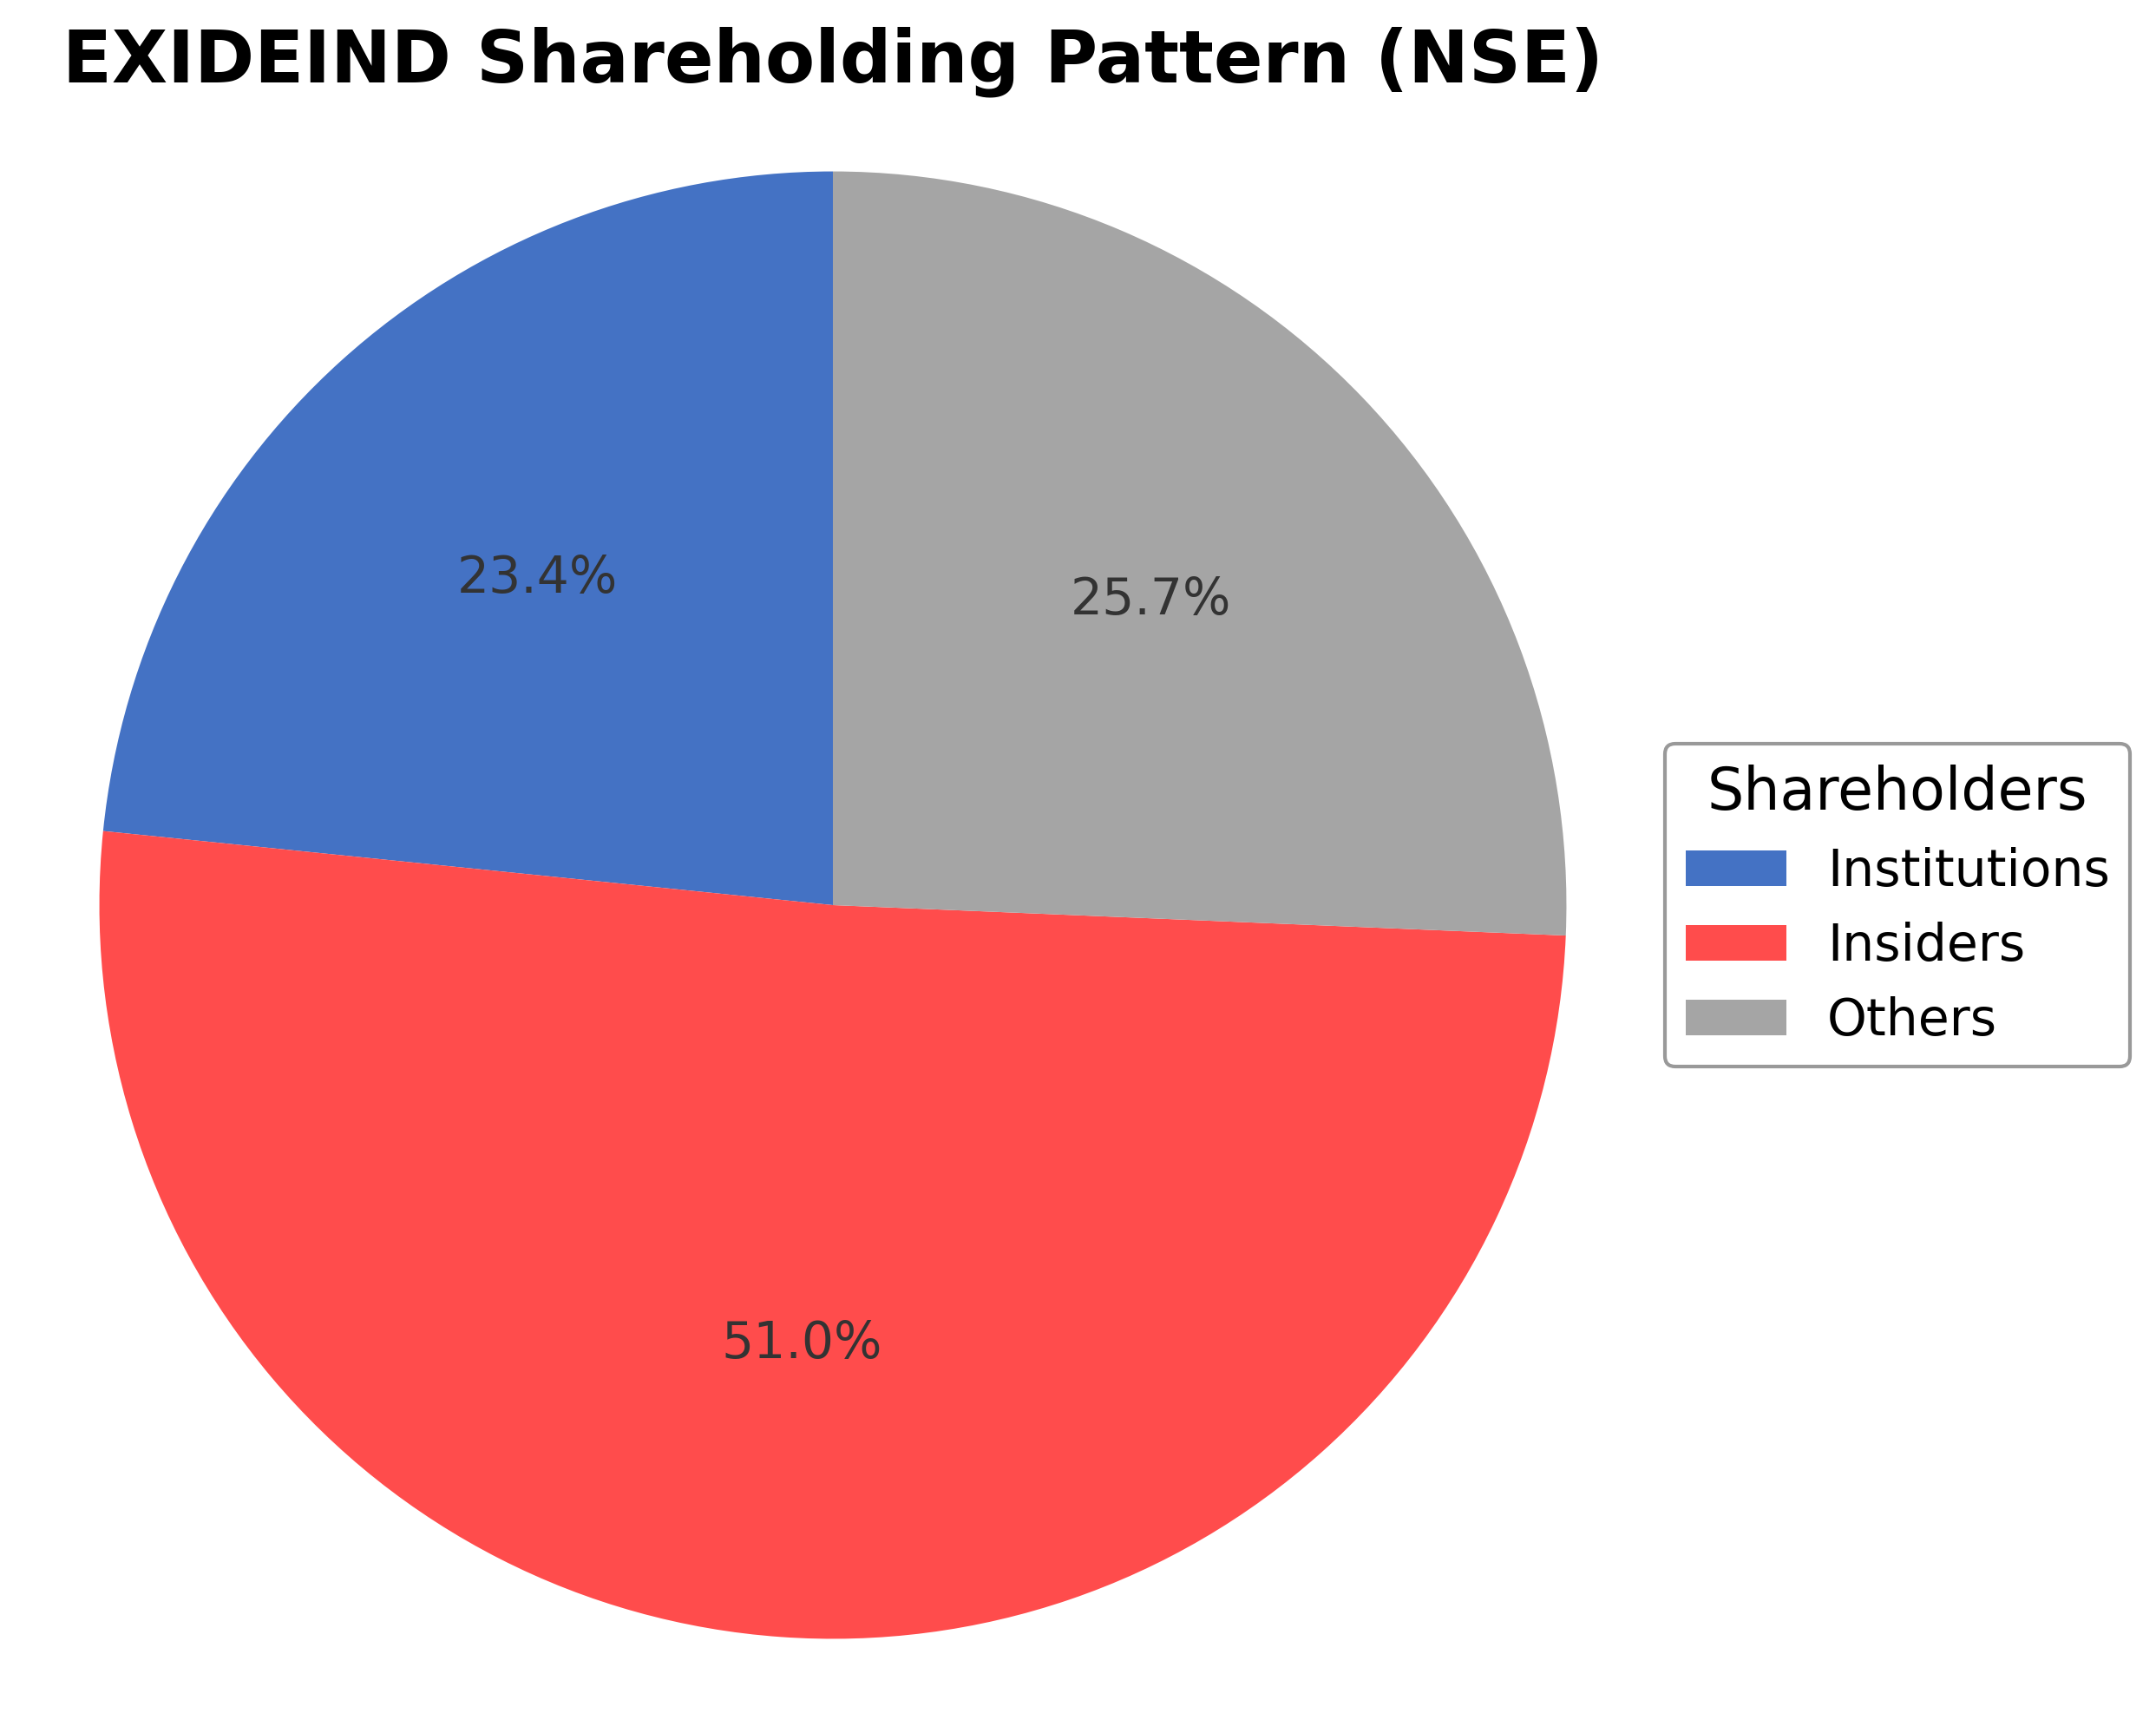
Exide Industries Ltd.'s shareholding structure comprises approximately 50.95% held by insiders including executives and board members, 23.39% by institutional investors such as mutual funds and pension funds, and 25.66% by public shareholders including retail investors and employee stock plans. Over the past 12-24 months, institutional ownership has shown moderate stability with no significant accumulation or distribution trends reported. Major institutional stakeholders maintain steady positions, reflecting a balanced market sentiment. This ownership distribution supports stable governance and strategic continuity, with insider holdings providing alignment with long-term corporate objectives. The current structure suggests a well-established shareholder base that may influence future corporate actions and strategic decisions in line with industry developments.
Sector and Industry Analysis
The battery manufacturing and energy storage sector in India is witnessing robust growth driven by rising demand in automotive, industrial, and renewable energy applications. The market encompasses lead-acid and lithium-ion batteries, with increasing adoption in electric vehicles (EVs) and grid storage solutions. Major players include Exide Industries, Amara Raja Batteries, and newer entrants focusing on lithium-ion technology, collectively serving domestic and export markets.
Industry trends highlight a transition from traditional lead-acid batteries to lithium-ion technology, propelled by EV proliferation and renewable energy integration. Competitive dynamics are shaped by technological innovation, strategic partnerships (such as Exide’s collaboration with Hyundai-Kia), and supply chain management amid raw material price volatility. High capital expenditure and execution risks in scaling lithium-ion capacity present significant barriers to entry, favoring established firms with strong distribution networks and financial stability.
The regulatory environment supports sector growth through policies promoting EV adoption, renewable energy targets, and local manufacturing incentives under initiatives like Make in India. Environmental regulations on battery recycling and hazardous material handling impose compliance requirements, influencing operational costs. Ongoing government support for battery technology localization and export expansion is expected to enhance industry competitiveness and sustainability over the medium to long term.
Note: Analysis synthesized from industry research, market reports, and regulatory filings. Information is subject to change based on market conditions.
Financial Ratios Dashboard
Illustrative Scenario Analysis
DCF Assumptions:
Method: Two-Stage EPS-Priority Model
Financials
Peer Analysis
| Company Name | Market Cap | P/E Ratio | P/B Ratio | EV/EBITDA | Price to CFO |
|---|---|---|---|---|---|
| Exide Industries Ltd. | ₹339.62B | 39.68 | 2.44 | 18.45 | 14.07 |
| Sona BLW Precision Forgings Ltd. | ₹374.65B | 58.59 | 6.55 | 34.36 | 56.85 |
| Varroc Engineering Ltd. | ₹89.59B | 40.07 | 5.07 | 11.84 | 16.69 |
| Endurance Technologies Ltd. | ₹359.44B | 37.71 | 5.25 | 18.12 | 19.42 |
| Sundram Fasteners Ltd. | ₹176.54B | 29.89 | 4.36 | 18.14 | 21.09 |
| JBM Auto Ltd. | ₹160.75B | 73.28 | 11.32 | 35.51 | -268.54 |
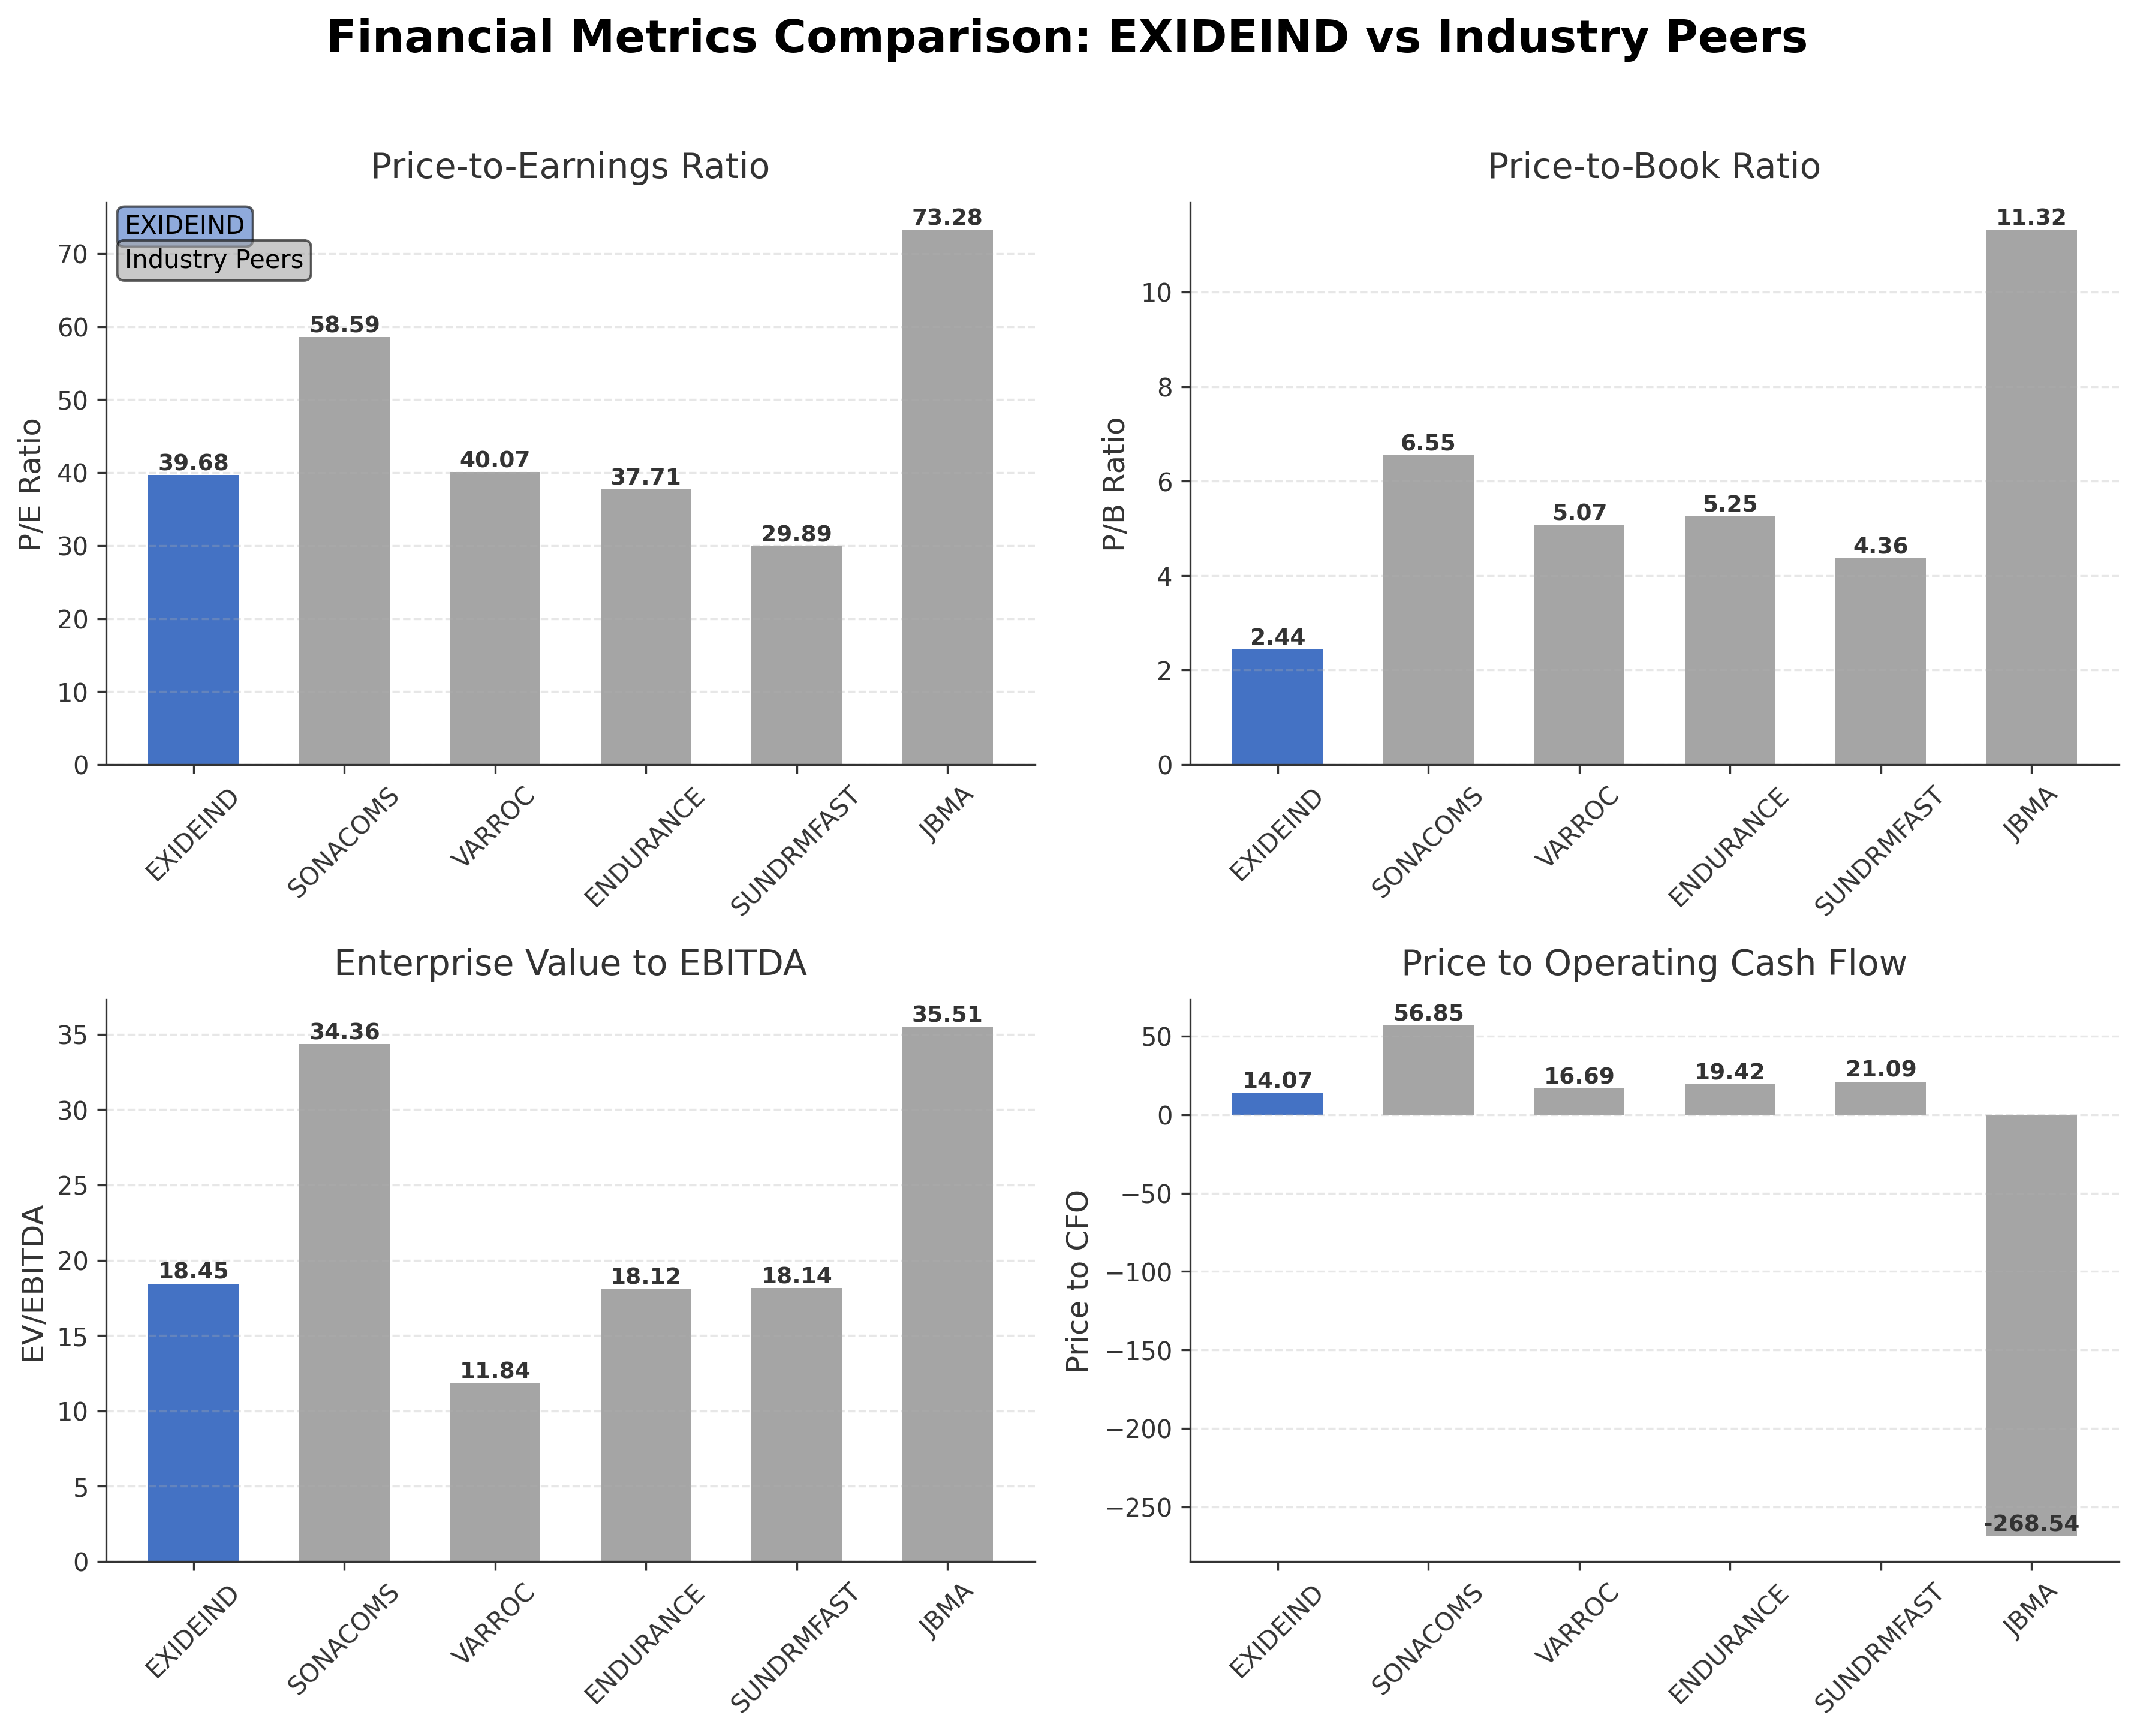
Comparison Analysis: Exide Industries Ltd. trades at a moderate market capitalization of ₹339.62 billion, with a trailing P/E ratio of 39.68 and P/B ratio of 2.44, which is lower than several peers such as Sona BLW Precision Forgings and JBM Auto Ltd. Its EV/EBITDA multiple of 18.45 is comparable to Endurance Technologies and Sundram Fasteners but higher than Varroc Engineering. Return on equity at 6.17% is notably lower than peer averages, indicating relatively lower profitability. Price to CFO at 14.07 is also below most peers, suggesting more conservative cash flow valuation. Overall, Exide presents a more value-oriented profile with lower leverage in valuation multiples but with scope for improving profitability metrics relative to its industry counterparts.
Financial Metrics Comparison with Peers
Financial Statements
Comprehensive financial data including income, balance sheet, and cash flow metrics
Income Statement
| fiscal_date | 2026-03-31 | 2025-03-31 | 2024-03-31 | 2023-03-31 | 2022-03-31 |
|---|---|---|---|---|---|
| Sales | 179.95B | 171.45B | 166.73B | 149.81B | 127.13B |
| Cost Of Goods | 121.92B | 118.06B | 115.80B | 105.24B | 88.19B |
| Gross Profit | 58.03B | 53.39B | 50.93B | 44.56B | 38.93B |
| Operating Expense Other Operating Expenses | 25.61B | 14.99B | 13.30B | 11.65B | 9.65B |
| Operating Income | 12.82B | 12.50B | 12.85B | 10.92B | 9.64B |
| Non Operating Interest Expense | 1.24B | 1.52B | 1.16B | 738.20M | 609.30M |
| Pretax Income | 12.49B | 11.76B | 12.31B | 11.38B | 9.61B |
| Income Tax | 3.89B | 3.75B | 3.48B | 3.15B | 2.66B |
| Net Income | 8.60B | 8.01B | 8.83B | 8.23B | 43.57B |
| Eps Basic | 10.05 | 9.35 | 10.31 | 9.68 | 51.38 |
| Eps Diluted | 10.05 | 9.35 | 10.31 | 9.68 | 51.38 |
| Basic Shares Outstanding | 849.94M | 850.00M | 850.00M | 850.00M | 850.00M |
| Diluted Shares Outstanding | 849.94M | 850.00M | 850.00M | 850.00M | 850.00M |
| Ebit | 13.73B | 13.28B | 13.47B | 12.11B | 10.22B |
| Ebitda | 19.72B | 18.70B | 18.80B | 16.57B | 14.30B |
| Net Income Continuous Operations | 12.49B | 11.76B | 12.31B | 11.38B | 9.61B |
| Minority Interests | -57.30M | -54.80M | -61.40M | -700.00K | 100.90M |
| Preferred Stock Dividends | 0.00 | 0.00 | 0.00 | 0.00 | 0.00 |
| Operating Expense Selling General And Administrative | N/A | 7.56B | 7.86B | 7.36B | 6.44B |
| Non Operating Interest Income | N/A | 31.80M | 59.00M | 13.10M | 80.80M |
Data provided by Twelve Data
Balance Sheet
| fiscal_date | 2026-03-31 | 2025-03-31 | 2024-03-31 | 2023-03-31 | 2022-03-31 |
|---|---|---|---|---|---|
| Cash And Cash Equivalents | 2.51B | 1.81B | 3.23B | 1.32B | 1.89B |
| Accounts Receivable | 15.75B | 16.86B | 13.82B | 12.30B | 10.98B |
| Total Assets | 212.20B | 213.96B | 181.50B | 147.65B | 139.11B |
| Total Liabilities | 72.89B | 74.62B | 52.49B | 36.24B | 32.87B |
| Long Term Debt | 13.71B | 13.84B | 6.34B | 4.40B | 3.84B |
| Shareholders Equity | 139.31B | 139.34B | 129.01B | 111.41B | 106.24B |
Data provided by Twelve Data
Cash Flow Statement
| fiscal_date | 2026-03-31 | 2025-03-31 | 2024-03-31 | 2023-03-31 | 2022-03-31 |
|---|---|---|---|---|---|
| Operating Activities Net Income | 12.49B | 11.76B | 12.31B | 11.38B | 9.61B |
| Operating Activities Other Non Cash Items | 1.24B | 1.53B | 1.16B | 738.40M | 609.30M |
| Operating Activities Accounts Receivable | 1.06B | -3.04B | -1.50B | -1.31B | -1.59B |
| Operating Activities Other Assets Liabilities | 7.60B | 1.23B | 2.38B | -4.11B | -2.40B |
| Operating Activities Operating Cash Flow | 22.39B | 11.48B | 14.35B | 6.69B | 6.23B |
| Investing Activities Capital Expenditures | -11.20B | -19.25B | -18.71B | -9.85B | -6.64B |
| Investing Activities Net Acquisitions | 0.00 | -15.00M | -2.70M | 0.00 | -21.40M |
| Investing Activities Purchase Of Investments | -29.98B | -19.68B | -23.82B | -26.01B | -20.38B |
| Investing Activities Sale Of Investments | 25.46B | 19.41B | 27.76B | 27.71B | 22.69B |
| Investing Activities Other Investing Activity | 205.00M | 200.10M | 188.50M | 163.70M | 5.02B |
| Investing Activities Investing Cash Flow | -15.51B | -19.34B | -14.58B | -7.99B | 663.30M |
| Financing Activities Long Term Debt Issuance | 7.60B | 10.14B | 5.27B | 1.76B | 1.34B |
| Financing Activities Long Term Debt Payments | -12.54B | -1.64B | -1.16B | -1.02B | -446.90M |
| Financing Activities Common Dividends | -1.70B | -1.70B | -1.70B | N/A | -1.70B |
| Financing Activities Financing Cash Flow | -6.64B | 6.80B | 2.40B | 524.20M | -1.03B |
| End Cash Position | 2.38B | 1.81B | 3.23B | 1.32B | 1.89B |
| Free Cash Flow | 12.61B | -6.76B | -3.45B | -2.25B | -6.05B |
| Financing Activities Other Financing Charges | N/A | 10.00K | N/A | -215.70M | -227.00M |
Data provided by Twelve Data
Technical Analysis
Key Insights
- The current trend shows moderate upward momentum with price trading near the 50-day moving average of ₹342.15 and below the 200-day moving average of ₹358.77, indicating a consolidation phase.
- Key support levels are identified near ₹350 and ₹320, while resistance is observed around ₹400 and the 52-week high of ₹431.
- The stock price is currently above the 10-day moving average but fluctuates around the 50-day and 200-day moving averages, reflecting mixed medium- to long-term signals.
- Momentum indicators show RSI near neutral levels around 50, MACD lines converging with slight bullish crossover potential, and stochastic oscillator indicating moderate buying interest.
- Daily and weekly timeframes suggest sideways movement with occasional bullish bursts, while monthly charts reflect a longer-term uptrend with periodic corrections.
- Potential market scenarios include continuation of consolidation with breakout attempts above resistance or retracement toward support levels depending on broader market cues and sector performance.
Trending News
1. Headline: Exide Industries Share Price Target 2026: Rs 470 Analyst Forecast
Summary: The Exide Industries share price target 2026 is Rs 470, ~20% upside from CMP Rs 391.15. Bull case Rs 565, bear case Rs 315. May 2026.
Sentiment: positive
Summary: Exide Ind Share Price: Find the latest news on Exide Ind Stock Price. Get all the information on Exide Ind with historic price charts for NSE / BSE. Experts & Broker view also get the Exide Ind Ltd. buy/sell tips detailed news, announcements, Forecasts, Analysts, Valuation, Earning forecasts, ...
Sentiment: neutral
3. Headline: Amara Raja steps up investments in new energy biz to charge slower progress | Stock Market News
Summary: Amara Raja’s core lead-acid battery business continues to drive growth, but delays and technology hurdles in its EV battery venture are emerging as investor concerns.
Sentiment: positive
4. Headline: Stocks to Buy: Buy Siemens Energy, Supriya Lifescience, Exide Industries: Analyst | Markets News - Business Standard
Summary: Topics : Stock calls technical calls Siemens India Supriya Lifescience Exide Industries Market technicals · Don't miss the most important news and views of the day.
Sentiment: neutral
Summary: Close: Rs 366.25 | Change (%): 5.78 Exide Industries
Sentiment: positive
Powered by Brave
Recent Updates
News Summary
As of 2026-05-23. The National Stock Exchange announced the removal of Exide Industries from its Futures and Options trading segment effective July 29, 2026, following SEBI's tightened eligibility criteria aimed at ensuring only high-quality stocks with sufficient market depth participate in derivatives trading. Existing contracts will continue until their expiry dates, but no new contracts will be issued. Exide Industries recently reported steady financial performance with Q4 FY2025-2026 revenue increasing 8.22% year-over-year to ₹4,739.37 crore and net profit rising 15.19% to ₹215.25 crore, reflecting operational growth. The company’s management highlighted stable EBITDA and PBT margins driven by efficient procurement and cost optimization. Investor relations materials confirm Exide’s core business focus on lead-acid batteries serving automotive and industrial sectors, with a broad distribution network supporting recurring demand.
News Sentiment
The overall sentiment from recent updates is mixed to neutral with positive undertones. Financial results demonstrate steady revenue and profit growth, supporting operational stability. However, regulatory developments such as NSE's removal of Exide from the derivatives segment introduce a degree of uncertainty regarding market liquidity and trading dynamics. Analyst commentary remains cautiously optimistic, emphasizing the company’s strong fundamentals and sectoral relevance. This blend of steady financial performance and regulatory challenges suggests a balanced outlook requiring ongoing monitoring.
Source List
- https://www.businesstoday.in/markets/stocks/story/nse-to-remove-exide-industries-nuvama-wealth-from-fo-segment-key-details-532979-2026-05-23
- https://www.indmoney.com/stocks/exide-industries-ltd-share-price/results
- https://www.alphaspread.com/security/nse/exideind/investor-relations
Analytical Overview
Analysis Summary
Exide Industries’ valuation metrics reflect a trailing P/E of 39.68 and a forward P/E of 23.72, which are broadly in line with the industry average P/E of approximately 39.68 but lower than some peers, indicating a relatively moderate valuation. The company exhibits a positive revenue growth rate of 9.2% quarterly and strong cash flow generation with operating cash flow of ₹24.13 billion and free cash flow of ₹12.04 billion, supporting a healthy growth trajectory. Financial health is robust with a low debt-to-equity ratio of 0.11 and a current ratio of 1.22, indicating manageable leverage and adequate liquidity. Sector-specific challenges include evolving battery technologies and regulatory changes impacting derivatives trading, while opportunities arise from increasing demand for energy storage and renewable energy applications. Considering India-specific factors, the company benefits from growing automotive markets and government initiatives promoting clean energy, though it faces regulatory scrutiny in capital markets.
Overall Business and Market Assessment
Supporting Factors: steady revenue and profit growth, strong cash flow generation, and a conservative capital structure with low debt
Risk Factors: No data
SWOT Analysis
Strengths
- Market leadership in lead-acid battery manufacturing with a diversified product portfolio.
- Strong operating and free cash flows supporting financial flexibility.
- Low debt-to-equity ratio indicating prudent financial management.
- Extensive distribution network ensuring broad market reach.
Weaknesses
- Relatively lower return on equity compared to industry peers.
- Moderate net profit margins limiting profitability expansion.
- Dependence on traditional lead-acid battery technology amid evolving energy storage trends.
- Limited presence in high-growth lithium-ion battery segment.
Opportunities
- Growing demand for renewable energy storage and backup power solutions.
- Expansion potential in electric vehicle battery market.
- Government initiatives promoting clean energy and infrastructure development.
- Technological advancements enabling product innovation.
Threats
- Regulatory changes impacting derivatives trading and market liquidity.
- Intensifying competition from emerging battery technologies and new entrants.
- Volatility in raw material prices affecting cost structure.
- Macroeconomic uncertainties influencing automotive and industrial demand.
Company Description
Exide Industries Ltd. is a leading manufacturer of lead-acid batteries in India, serving both automotive and industrial sectors. With a heritage dating back to 1947, the company plays a crucial role in ensuring energy solutions across diverse applications. Exide's primary function is to provide high-quality batteries for a range of vehicles, including two-wheelers, four-wheelers, and commercial vehicles, as well as industrial applications such as renewable energy storage and backup power systems. Its extensive portfolio includes products like inverter batteries, UPS systems, and solar batteries, catering to a wide spectrum of energy storage needs. Serving markets through a vast network of distributors and service centers, Exide Industries strives for innovation and reliability. It impacts sectors like transportation, telecommunications, power utilities, and solar energy, underlying its importance in the shift towards sustainable energy practices. Exide Industries’ position in the market is significant, as it not only supports conventional energy demands but also aligns with emerging technologies in battery storage, contributing to India's growing infrastructure and technological advancements.