


Eternal Limited (ETERNAL)
Stock Analysis Report
Stock Journey
Key Positives and Key Risks
Pros
- Market capitalization of ₹2.58 trillion reflects strong market presence and investor interest.
- Reported 182% year-over-year revenue growth in Q1 indicates robust top-line expansion.
- Current ratio of 2.77 demonstrates solid liquidity and ability to meet short-term obligations.
Cons
- Trailing P/E ratio of 622.22 suggests the stock is highly valued relative to earnings.
- Negative operating cash flow of ₹21.49 billion over the trailing twelve months raises concerns about cash generation.
- Net profit margin of 0.64% and return on equity of 1.18% indicate limited profitability.
Disclosure: This information is for general awareness and does not constitute investment advice
Report Summary
Eternal Limited is a prominent Indian company operating primarily in the Internet Retail industry, listed on the National Stock Exchange of India (NSE). The company specializes in e-commerce with a focus on food services, offering an integrated platform that connects restaurant partners, quick commerce merchants, delivery agents, and event organizers across India and internationally. Its diversified business segments include food ordering and delivery, hyperpure B2B supplies, quick commerce services, and complementary offerings such as payment gateways and advertising. Eternal Limited is positioned as a key player in the consumer cyclical sector, particularly within the digital food and lifestyle ecosystem.
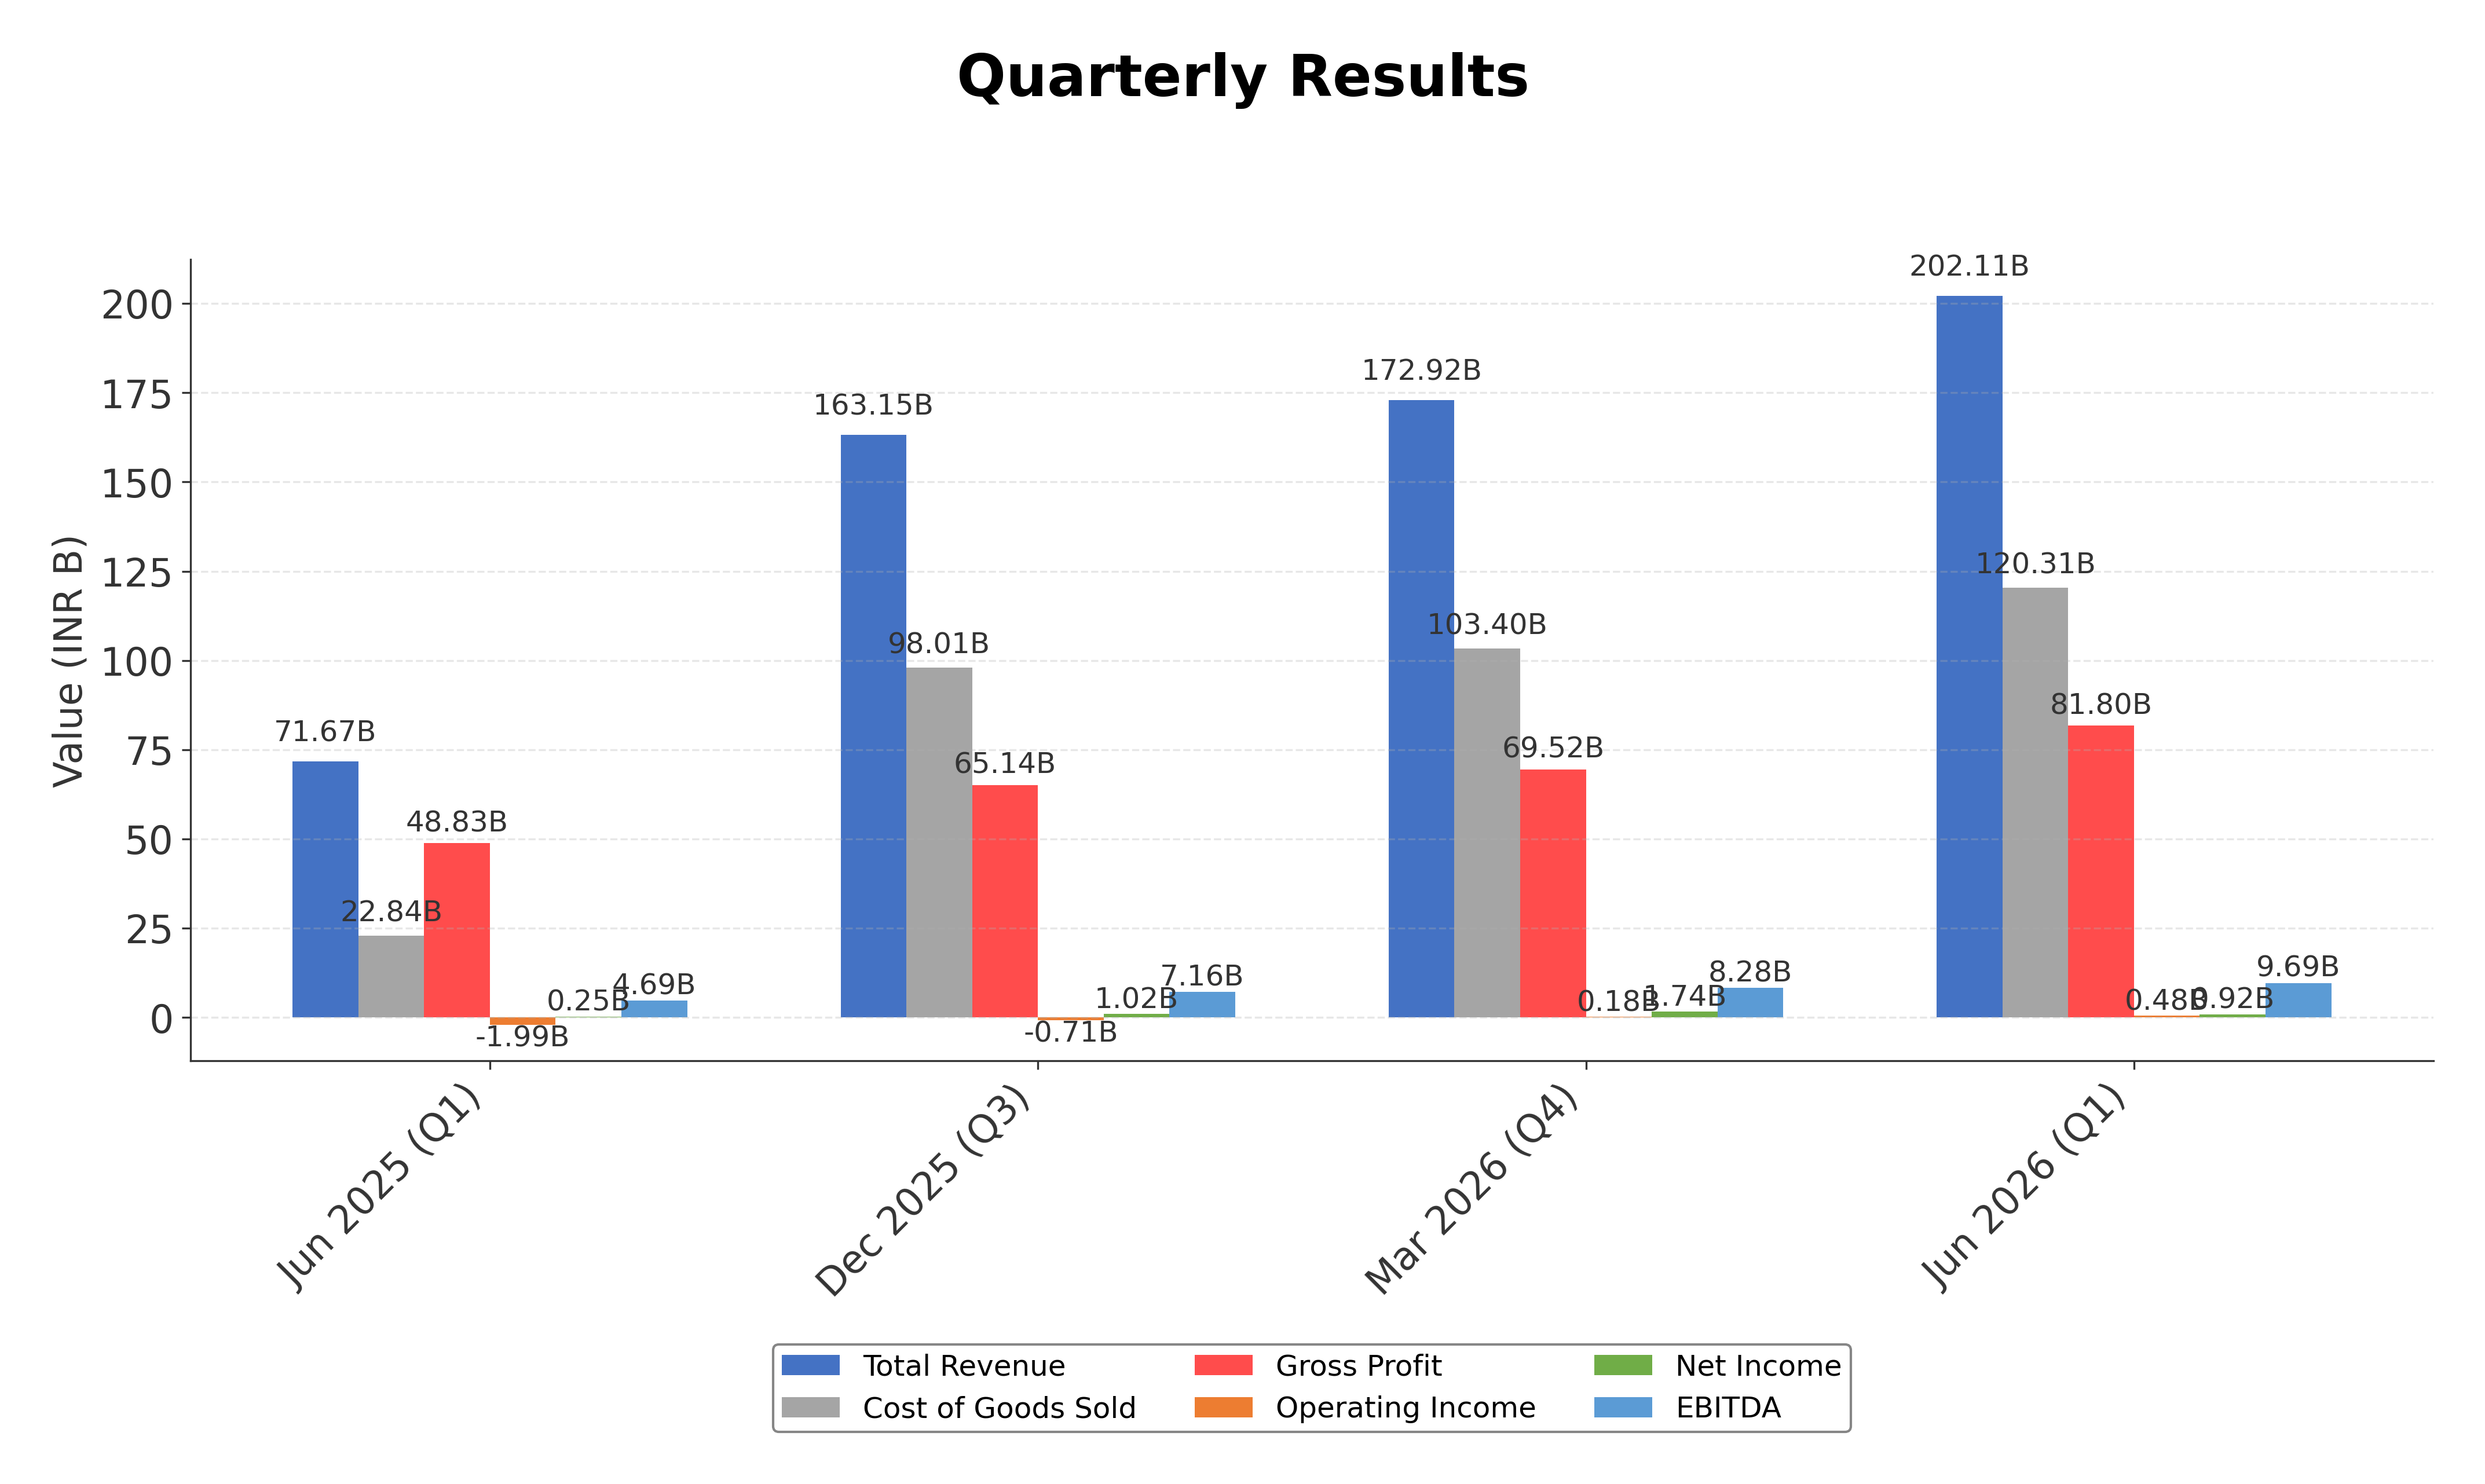
Financially, Eternal Limited reported trailing twelve months (TTM) revenue of approximately ₹674 billion with a gross margin of 40.47%, indicating a strong ability to generate profit from sales. However, operating and net profit margins are relatively thin at 0.24% and 0.64%, respectively, reflecting high operating costs or competitive pressures. The company’s return on equity (ROE) stands at 1.18%, and return on assets (ROA) at 0.90%, suggesting modest efficiency in utilizing shareholder equity and assets to generate profits. The return on invested capital (ROIC) is not explicitly provided but can be inferred as low given the margins and capital structure.
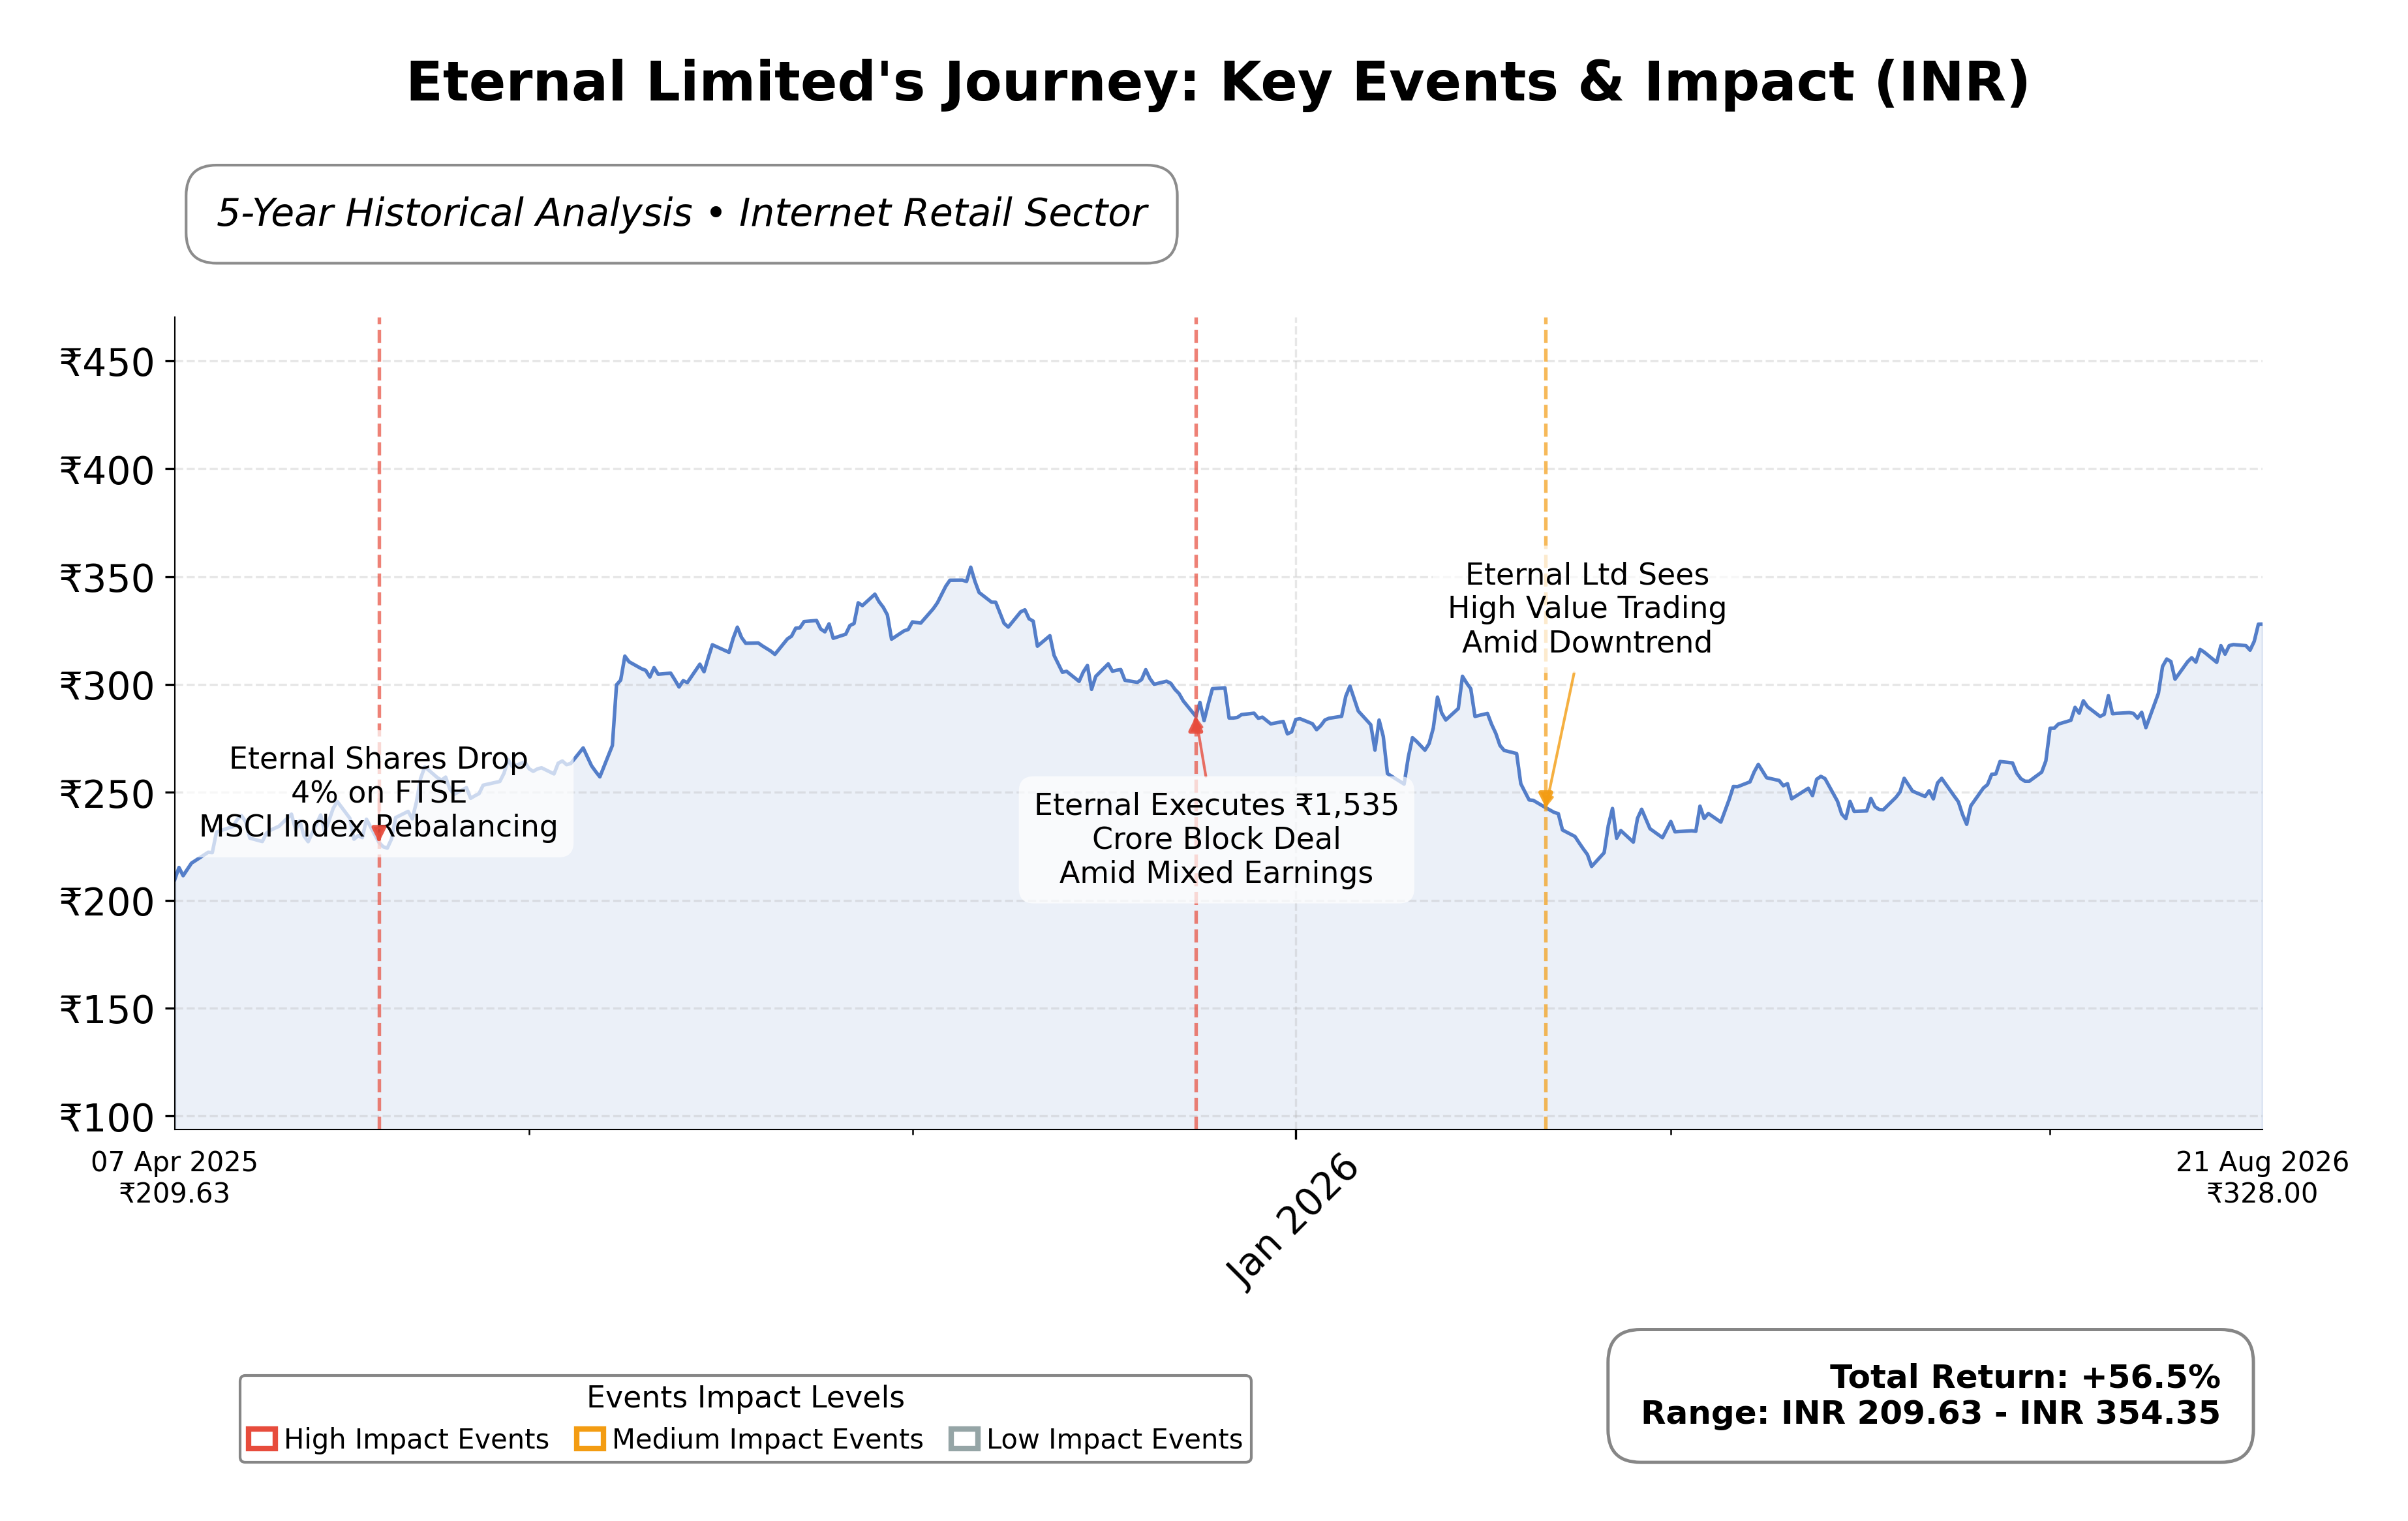
Valuation metrics show a trailing price-to-earnings (P/E) ratio of 622.22 and a forward P/E of 73.84, which are significantly elevated compared to typical industry standards, indicating high market expectations for future growth. The price-to-book (P/B) ratio is 8.28, and enterprise value to EBITDA (EV/EBITDA) is 147.16, both suggesting the stock is priced at a premium relative to its current earnings and book value. The market capitalization is approximately ₹2.58 trillion INR, with a 52-week price range between ₹212.60 and ₹368.45, and the current price of ₹328 places it near the upper end of this range.
Eternal Limited’s notable strengths include a strong cash position of over ₹66 billion, low debt-to-equity ratio of 0.15, and market leadership in the fast-growing quick commerce and food delivery segments. Key risks involve thin profitability margins, high valuation multiples, and competitive pressures from peers such as Swiggy and Nykaa. Recent strategic developments include a significant 182% year-over-year revenue increase reported in Q1 and an MSCI weight boost that may attract substantial foreign inflows. Analyst sentiment remains largely positive, supported by multiple buy ratings and price targets above current levels.
Technically, the stock shows a positive medium-term trend with price consolidating above key moving averages and momentum indicators reflecting bullish conditions. Recent news and trading activity suggest increased investor interest and call option activity, although some earnings misses have tempered enthusiasm. Overall, the data indicates a market environment where accumulation and cautious monitoring of valuation and profitability metrics are prudent, reflecting a balanced stance on the stock’s near-term prospects.
Company and Industry Overview
Company Basics
Price Performance
Company Size
Shareholding Pattern
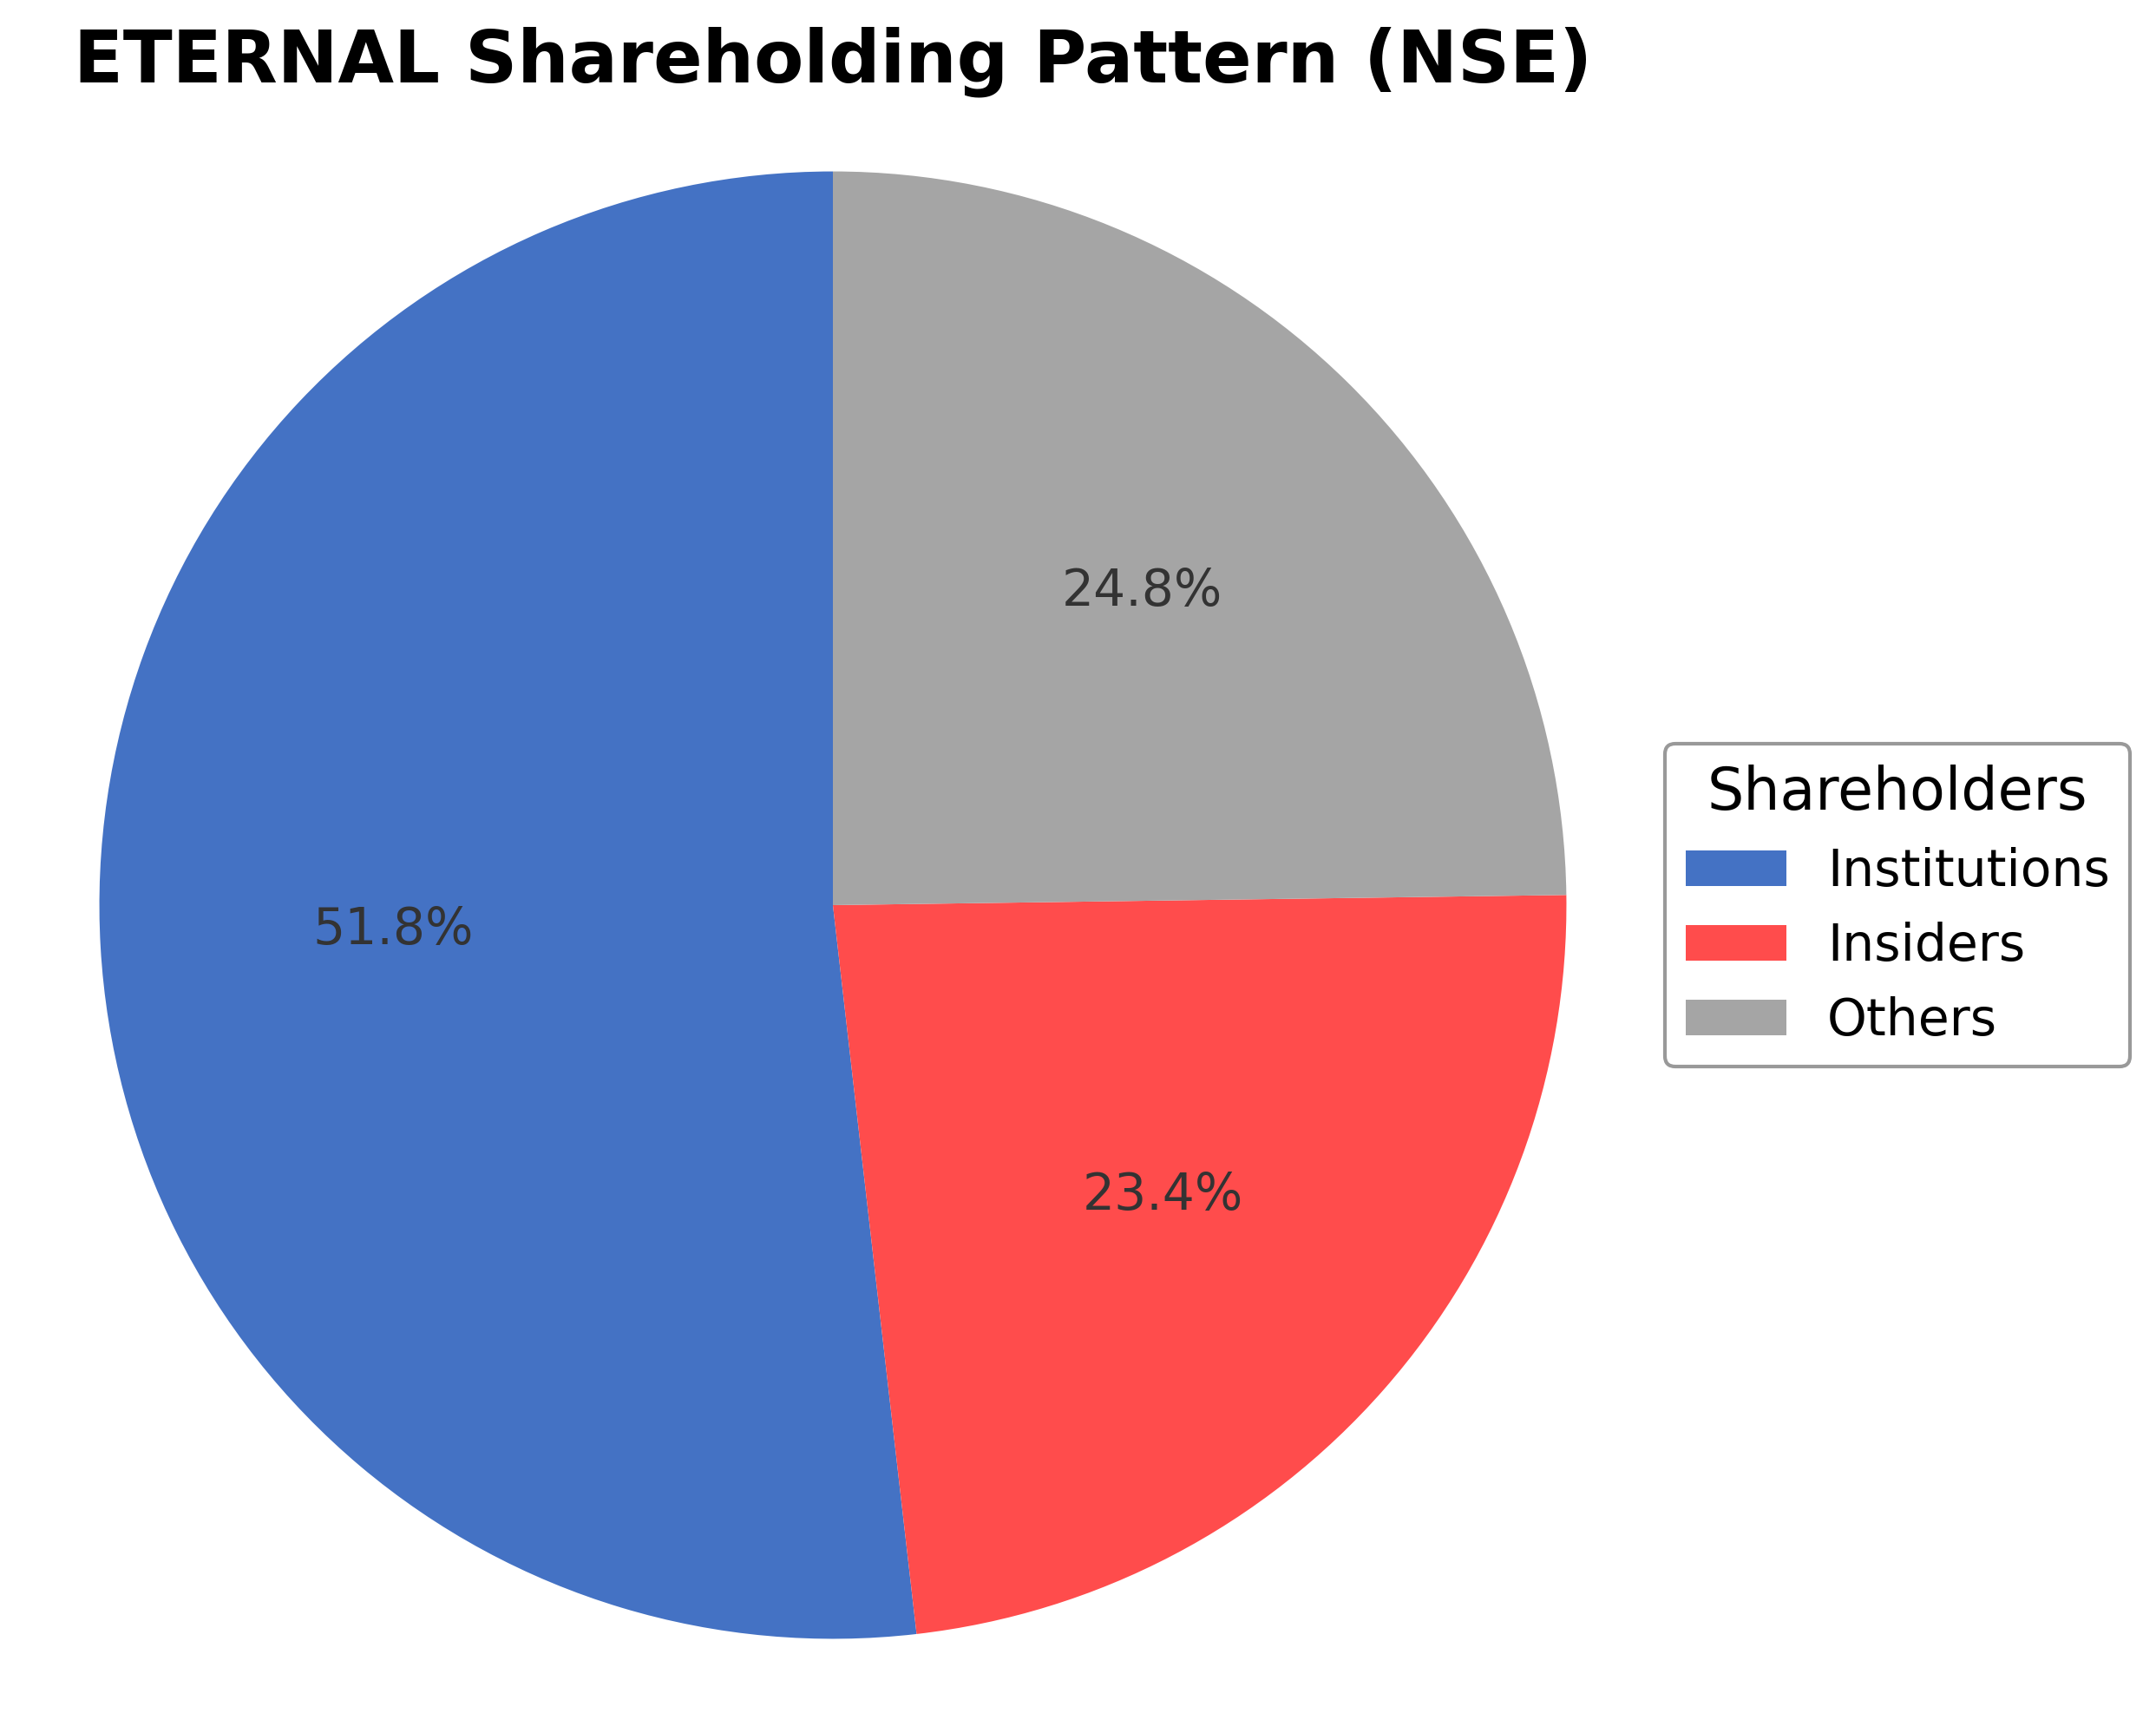
Eternal Limited's shareholding structure is characterized by insiders, including executives and board members, holding approximately 23.40% of shares, institutional investors such as mutual funds and pension funds owning 51.82%, and the remaining 24.78% held by public shareholders including retail investors and employee stock plans. Over the past 12-24 months, institutional ownership has shown a trend of accumulation, supported by inflows linked to MSCI index rebalancing and positive analyst endorsements. Major funds have increased their stakes, reflecting confidence in the company's growth trajectory despite elevated valuation multiples. This ownership distribution suggests a governance framework influenced by significant institutional oversight, which may impact strategic decisions and corporate actions. The current shareholding pattern indicates a balanced market sentiment with strong institutional backing and active public participation.
Sector and Industry Analysis
The retailing sector in India, encompassing food delivery, quick commerce, and dining services, has witnessed robust growth driven by rising consumer demand and digital adoption. The market size has expanded significantly, with companies like Eternal Limited and Zomato leading as major players. This sector benefits from increasing urbanization, internet penetration, and evolving consumer preferences for convenience and variety.
Industry trends highlight a shift towards integrated platforms combining food delivery, B2B farm-to-fork supplies, and quick commerce, enabling operational efficiencies through shared logistics and technology. Competitive dynamics are intense, with high barriers to entry due to the need for extensive infrastructure, merchant networks, and capital investment. Firms like Eternal leverage scale and data capabilities to improve unit economics and customer acquisition, differentiating themselves amid aggressive marketing and pricing competition.
The regulatory environment involves scrutiny over pricing practices, food safety standards, and advertising norms, which can affect profitability and operational flexibility. Policies targeting fair competition and consumer protection are critical, given the sector’s rapid expansion and market consolidation. Ongoing regulatory developments require companies to maintain compliance while adapting strategies to mitigate risks related to pricing and market conduct.
Note: Analysis synthesized from industry research, market reports, and regulatory filings. Information is subject to change based on market conditions.
Financial Ratios Dashboard
Illustrative Scenario Analysis
DCF Assumptions:
Method: Two-Stage EPS-Priority Model
Financials
Peer Analysis
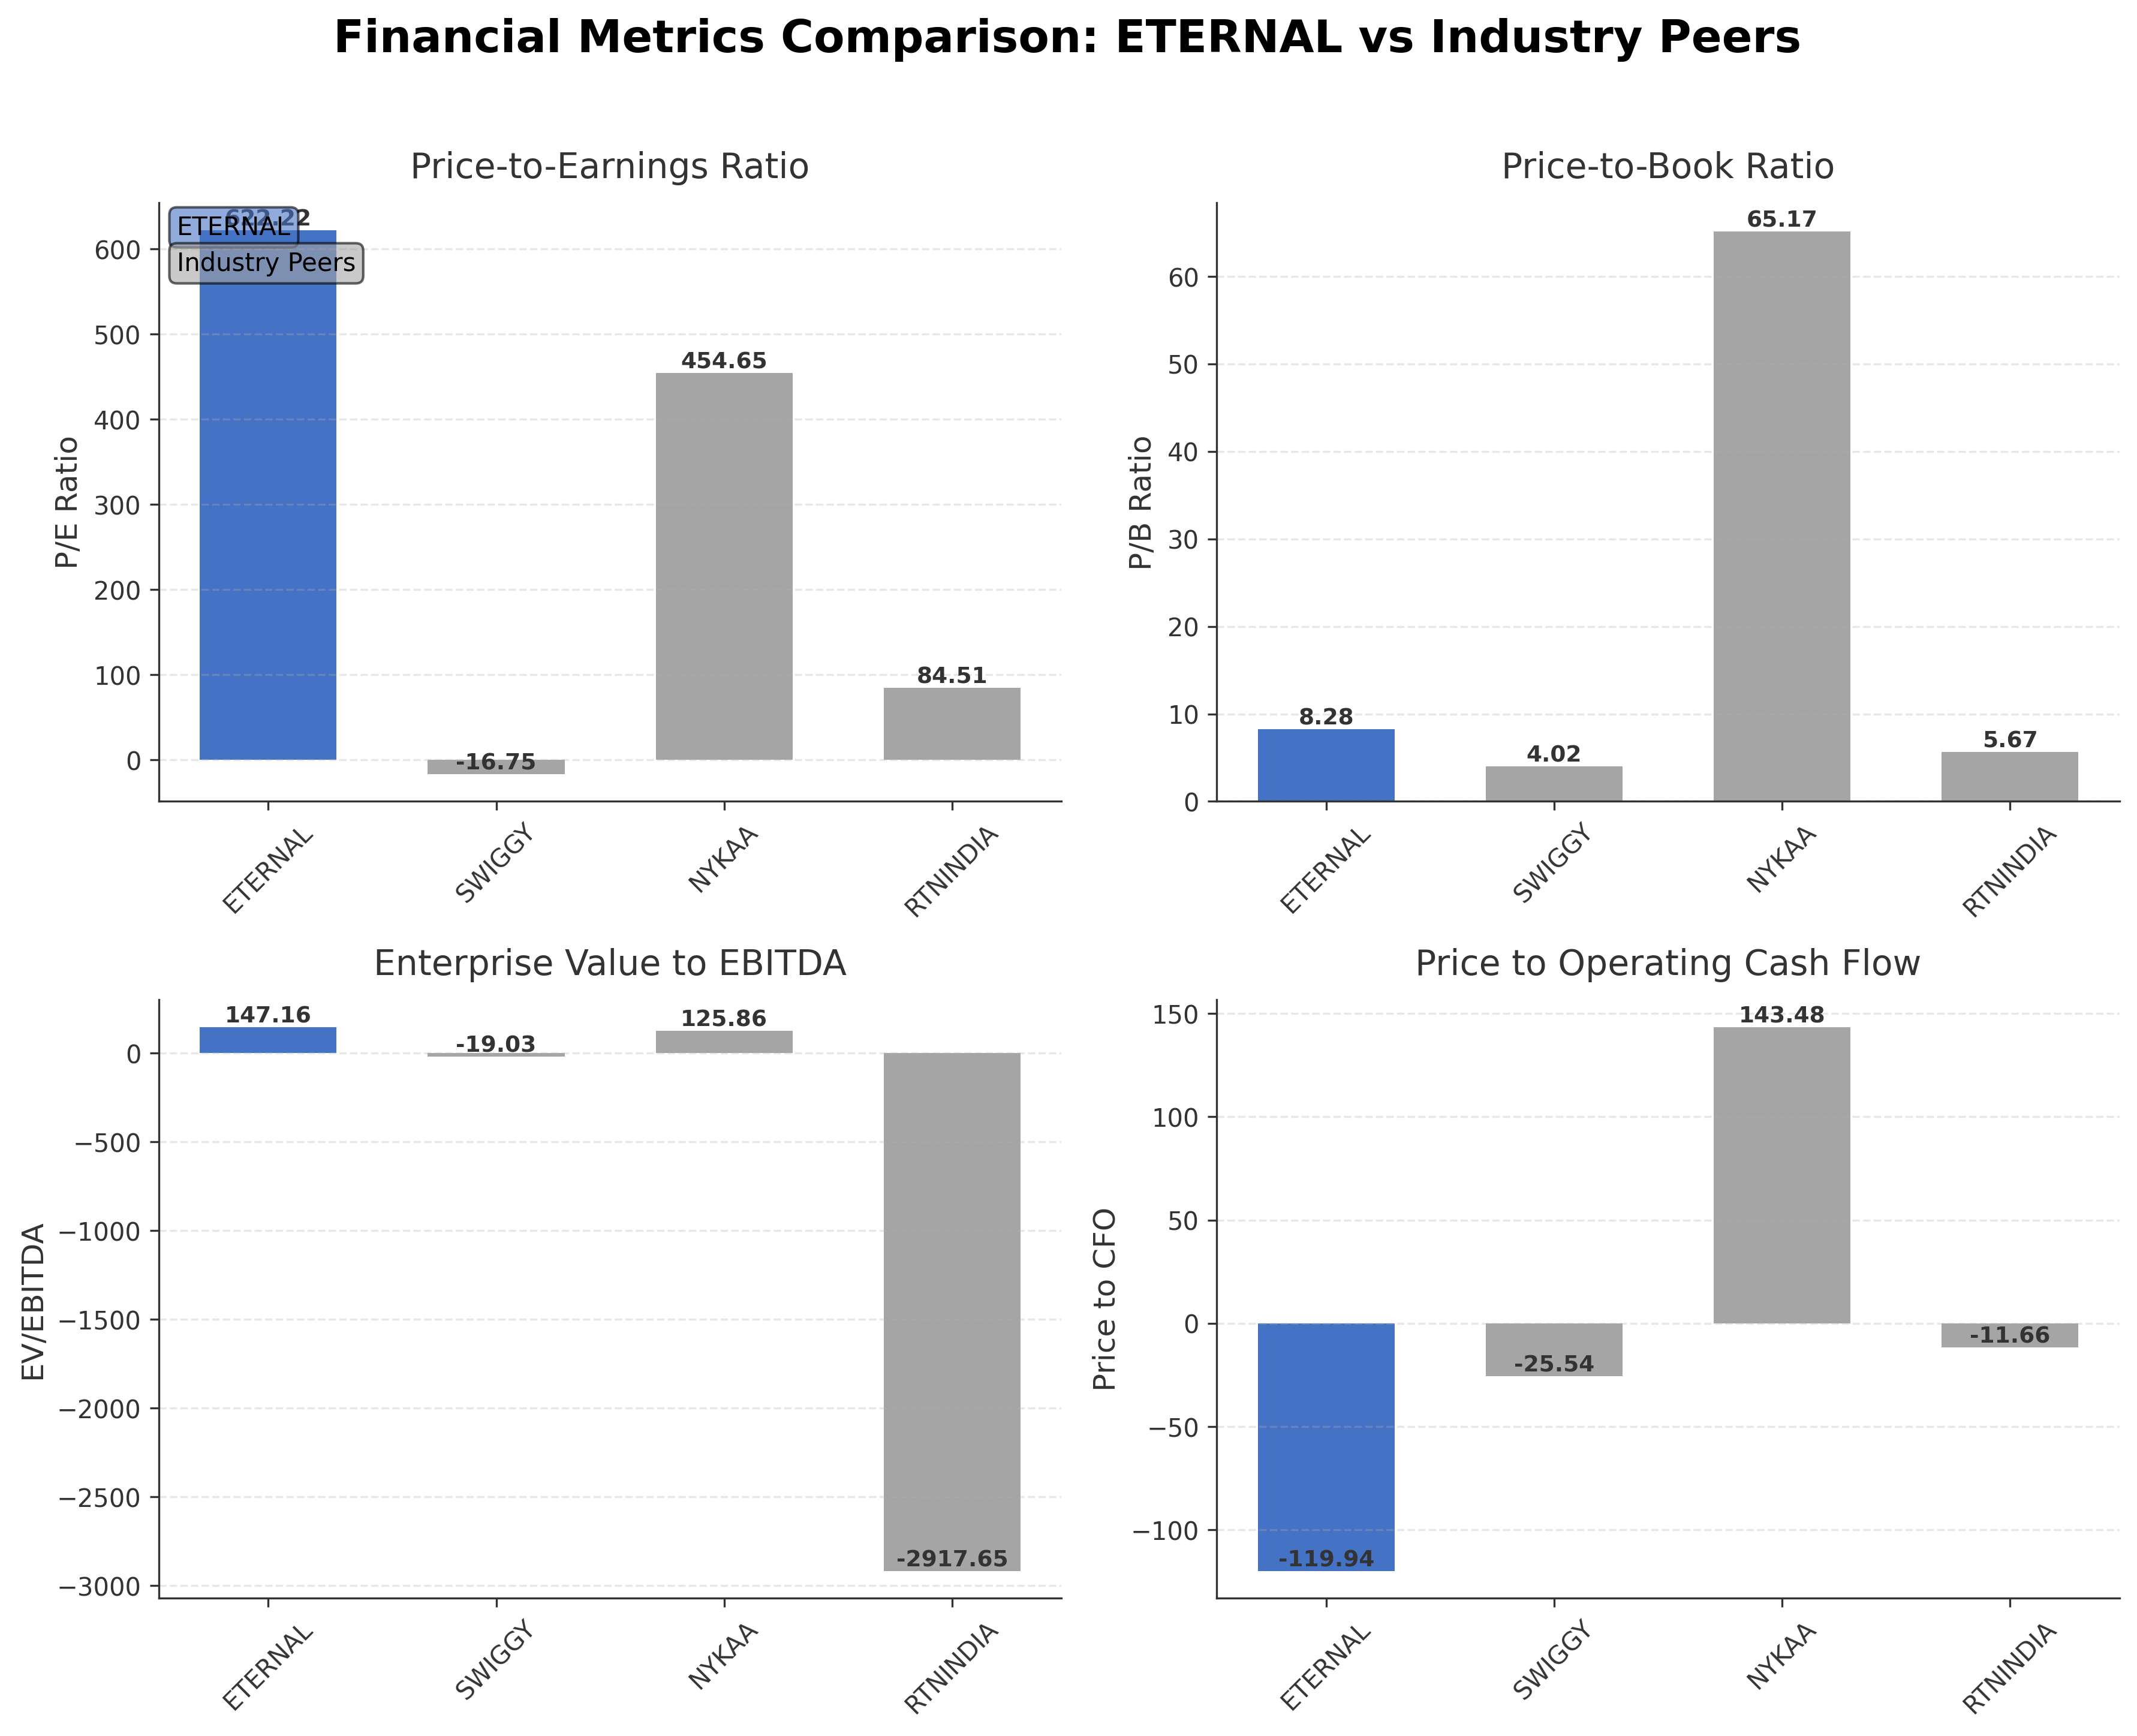
| Company Name | Market Cap | P/E Ratio | P/B Ratio | EV/EBITDA | Price to CFO |
|---|---|---|---|---|---|
| Eternal Limited | ₹2.58T | 622.22 | 8.28 | 147.16 | -119.94 |
| Swiggy Ltd. | ₹740.15B | -16.75 | 4.02 | -19.03 | -25.54 |
| Fsn E-Commerce Ventures Ltd. | ₹924.46B | 454.65 | 65.17 | 125.86 | 143.48 |
| RattanIndia Enterprises Ltd. | ₹43.64B | 84.51 | 5.67 | -2917.65 | -11.66 |
Comparison Analysis: Eternal Limited stands out among its regional peers with the largest market capitalization of ₹2.58 trillion and the highest trailing P/E ratio of 622.22, reflecting elevated growth expectations. Its price-to-book ratio of 8.28 is moderate compared to Nykaa's significantly higher 65.17, indicating a more balanced valuation relative to book value. The EV/EBITDA multiple of 147.16 is the highest in the group, suggesting a premium pricing relative to earnings before interest, taxes, depreciation, and amortization. Eternal's return on equity of 1.18% is positive but modest compared to Nykaa's 14.34%, while Swiggy and RattanIndia report negative returns. The negative price-to-cash-flow ratio highlights challenges in operating cash generation relative to valuation. Overall, Eternal's scale and market presence are strengths, but its profitability and cash flow metrics lag behind some peers.
Financial Metrics Comparison with Peers
Financial Statements
Comprehensive financial data including income, balance sheet, and cash flow metrics
Income Statement
| fiscal_date | 2026-03-31 | 2025-03-31 | 2024-03-31 |
|---|---|---|---|
| Sales | 543.64B | 202.43B | 121.14B |
| Cost Of Goods | 301.67B | 55.65B | 28.82B |
| Gross Profit | 241.97B | 146.78B | 92.32B |
| Operating Expense Selling General And Administrative | 47.50B | 19.72B | 19.24B |
| Operating Expense Other Operating Expenses | 142.33B | 95.11B | 54.62B |
| Operating Income | -630.00M | -2.26B | -3.83B |
| Non Operating Interest Income | 7.04B | 4.68B | 2.59B |
| Non Operating Interest Expense | 3.88B | 1.54B | 690.00M |
| Pretax Income | 6.15B | 6.97B | 2.91B |
| Income Tax | 2.49B | 1.70B | -600.00M |
| Net Income | 3.66B | 5.27B | 3.51B |
| Eps Basic | 0.40 | 0.60 | 0.41 |
| Eps Diluted | 0.39 | 0.58 | 0.41 |
| Basic Shares Outstanding | 9.11B | 8.78B | 8.49B |
| Diluted Shares Outstanding | 9.11B | 8.78B | 8.49B |
| Ebit | 10.03B | 8.51B | 3.60B |
| Ebitda | 19.95B | 17.14B | 3.06B |
| Net Income Continuous Operations | 6.15B | 6.97B | 2.91B |
| Minority Interests | 0.00 | 0.00 | 0.00 |
| Preferred Stock Dividends | 0.00 | 0.00 | 0.00 |
Data provided by Twelve Data
Balance Sheet
| fiscal_date | 2026-03-31 | 2025-03-31 | 2024-03-31 |
|---|---|---|---|
| Cash And Cash Equivalents | 9.93B | 6.66B | 3.09B |
| Accounts Receivable | 20.08B | 19.46B | 7.94B |
| Total Assets | 407.36B | 356.23B | 233.56B |
| Total Liabilities | 97.63B | 53.13B | 29.50B |
| Long Term Debt | 38.33B | 16.54B | 5.88B |
| Shareholders Equity | 309.73B | 303.10B | 204.06B |
Data provided by Twelve Data
Cash Flow Statement
| fiscal_date | 2026-03-31 | 2025-03-31 | 2024-03-31 |
|---|---|---|---|
| Operating Activities Net Income | 6.15B | 6.97B | 2.91B |
| Operating Activities Stock Based Compensation | 8.19B | 7.98B | 5.15B |
| Operating Activities Other Non Cash Items | -8.39B | -7.70B | -6.39B |
| Operating Activities Accounts Receivable | 1.17B | -11.17B | -3.48B |
| Operating Activities Other Assets Liabilities | -28.61B | -6.26B | 2.55B |
| Operating Activities Operating Cash Flow | 6.32B | -10.18B | 740.00M |
| Investing Activities Net Acquisitions | 0.00 | -20.05B | 0.00 |
| Investing Activities Purchase Of Investments | -502.06B | -556.71B | -371.46B |
| Investing Activities Sale Of Investments | 515.35B | 497.95B | 363.83B |
| Investing Activities Investing Cash Flow | 13.29B | -88.12B | -9.65B |
| Financing Activities Common Stock Issuance | 120.00M | 85.05B | 320.00M |
| Financing Activities Financing Cash Flow | 120.00M | 85.05B | -80.00M |
| End Cash Position | 9.96B | 6.66B | 3.09B |
| Free Cash Flow | -11.19B | -6.28B | 4.31B |
| Investing Activities Capital Expenditures | N/A | -9.31B | -2.02B |
| Financing Activities Long Term Debt Payments | N/A | 0.00 | -400.00M |
Data provided by Twelve Data
Technical Analysis
Key Insights
- The current trend direction for Eternal Limited shows a medium-term upward momentum with price consolidating near ₹328, above the 50-day moving average of ₹263.88 and the 200-day moving average of ₹270.72, indicating sustained bullish price action.
- Key support levels are identified near ₹265 and ₹270, corresponding to the 50-day and 200-day moving averages respectively, while resistance is observed near the 52-week high of ₹368.45.
- The stock price is trading above the 10-day, 50-day, and 200-day moving averages, suggesting a strong position relative to these key technical indicators.
- Momentum indicators show the Relative Strength Index (RSI) in a moderately strong range, MACD lines indicating positive crossover momentum, and Stochastic oscillators reflecting bullish conditions without being overbought.
- Multi-timeframe analysis reveals consistent bullish signals on daily, weekly, and monthly charts, with volume surges supporting upward price movements.
- Potential market scenarios include continuation of the current uptrend supported by technical strength, with caution warranted near resistance levels where profit-taking or consolidation may occur.
Trending News
Summary: Thomson Reuters proprietary rating of stock on scale of 1 to 10 · Industry ranking and detailed sector analysis of recent happening in sector · Analyst rating like Buy/Sell/Hold with Earnings estimates with 1 year price target ... *A bulk deal is a trade where total quantity of shares bought or sold is more than 0.5% of the equity shares of a company listed on the exchange. ... Eternal Limited ...
Sentiment: neutral
2. Headline: Eternal Ltd. Shares Trade Higher Following 182% Revenue Jump | Whalesbook
Summary: Eternal Ltd. shares trade higher as Q1 revenue hits Rs 20,211 crore, up 182% YoY. Learn about the company's profit trends and quick-commerce competition.
Sentiment: positive
3. Headline: Paytm, Eternal Share Price Rises Over 2 Percent In Trade Today August 19
Summary: Eternal, which owns Blinkit, was also in focus after Zepto raised its minimum order value to Rs 199 from Rs 149, bringing it in line with Blinkit and Swiggy's Instamart.
Sentiment: positive
4. Headline: 5,349 Call Contracts Traded on Eternal Ltd as Stock Climbs Above Rs 320 Strike
Summary: While the options and cash markets ... as the stock consolidates. The fresh positioning indicated by the contracts-to-open interest ratio points to new money entering the market, but whether this momentum will sustain beyond expiry remains to be seen. Buy, sell, or hold Eternal Ltd? The multi-factor analysis resolves the contradiction. Get 33% Off on our 1 Year Plan - Limited Period ...
Sentiment: positive
5. Headline: Eternal shares gain 2.01% in early trade; Moneycontrol analysis indicates 'Very Bullish' sentiment — TradingView News
Summary: As of August 14, 2026, Moneycontrol analysis indicated a 'Very Bullish' sentiment for Eternal Limited. The stock's last traded price was Rs 324.40. ... Get unlimited access to articles from Moneycontrol and every other news source on TradingView.
Sentiment: positive
Powered by Brave
Recent Updates
News Summary
As of August 19, 2026. Eternal Limited reported a significant 182% year-over-year revenue increase in Q1, reaching Rs 20,211 crore, demonstrating strong operational momentum in the quick-commerce sector. The company also benefited from an MSCI Standard Index weight increase, potentially attracting $674 million in inflows, which has positively influenced the stock price and analyst sentiment. Despite narrowly missing earnings expectations, leading to a 2.3% share price decline, analysts have updated their models without major negative revisions, reflecting continued engagement with the company's growth prospects. These developments collectively underscore Eternal's expanding market presence and investor interest amid competitive dynamics.
News Sentiment
The overall sentiment from recent updates is predominantly positive, driven by the substantial revenue growth and anticipated capital inflows from MSCI index rebalancing. Positive analyst ratings and price target revisions further support this tone. However, the earnings miss introduced a neutral element, tempering enthusiasm slightly but not diminishing confidence in the company's medium-term outlook. The balance of strong operational performance and cautious earnings results suggests a constructive but measured market view.
Source List
- https://www.whalesbook.com/news/English/other/Eternal-Ltd-Shares-Trade-Higher-Following-182percent-Revenue-Jump/6a85740b84d2dd5c12db5457
- https://newsbytesapp.com/news/business/eternal-shares-jump-on-msci-weight-boost-674mn-inflows/story
- https://simplywall.st/stocks/in/consumer-services/nse-eternal/eternal-shares/news/eternal-limited-just-missed-earnings-but-analysts-have-updat
Analytical Overview
Analysis Summary
Eternal Limited's valuation metrics, including a trailing P/E of 622.22 and forward P/E of 73.84, are significantly higher than typical industry averages, reflecting elevated market expectations for growth but also indicating potential valuation risk. The company's revenue growth of 1.82% quarterly and positive quarterly earnings growth of 2.68% demonstrate a solid growth trajectory, although operating cash flow remains negative, suggesting challenges in cash generation. Financial health appears stable with a low debt-to-equity ratio of 0.15 and a strong current ratio of 2.77, indicating liquidity strength amid manageable leverage. Sector-specific challenges include intense competition in the quick commerce and food delivery space, while opportunities arise from expanding digital adoption and increasing market penetration in India. Considering India-specific factors, the regulatory environment remains supportive of digital commerce growth, and consumer trends favor online food and lifestyle services, providing a favorable backdrop for Eternal Limited.
Overall Business and Market Assessment
Supporting Factors: No data
Risk Factors: No data
SWOT Analysis
Strengths
- Strong market position in India's quick commerce and food delivery sectors.
- Robust revenue growth with a 182% year-over-year increase reported in Q1.
- Healthy liquidity indicated by a current ratio of 2.77 and low debt-to-equity ratio of 0.15.
- Extensive platform integration connecting multiple stakeholders in the food and lifestyle ecosystem.
Weaknesses
- Very high valuation multiples, including a trailing P/E of 622.22 and EV/EBITDA of 147.16.
- Thin operating and net profit margins at 0.24% and 0.64%, respectively.
- Negative operating cash flow of ₹21.49 billion over the trailing twelve months.
- Modest return on equity of 1.18%, indicating limited profitability relative to shareholder equity.
Opportunities
- Growing digital adoption and increasing demand for online food delivery in India.
- Potential capital inflows following MSCI index weight increase.
- Expansion of complementary services such as payment gateways and advertising.
- Analyst endorsements and positive market sentiment supporting future growth.
Threats
- Intense competition from peers like Swiggy and Nykaa in the quick commerce space.
- Regulatory changes impacting digital commerce and food delivery operations.
- Market volatility affecting high-valuation stocks in the consumer cyclical sector.
- Challenges in converting revenue growth into sustainable profitability and cash flow.
Company Description
Eternal Limited is a major Indian company operating primarily as an e-commerce platform with a focus on food services. Founded in 2008 and headquartered in Gurugram, Haryana, it offers an integrated platform connecting restaurant partners, quick commerce merchants, delivery agents, and event organizers across India and internationally. Eternal Limited operates across multiple segments including food ordering and delivery, hyperpure B2B supplies, quick commerce services, and going-out experiences. It also provides complementary services such as payment gateways, financing, advertising, and subscription offerings. With a substantial market capitalization around ₹2.9 trillion INR and over 9 billion shares outstanding, Eternal Limited plays a significant role in India’s consumer services sector, particularly within the restaurants and online services industries. The company's extensive reach and diversified portfolio position it as a key player in the evolving digital food and lifestyle ecosystem.