
Engineers India Ltd (ENGINERSIN)
Stock Analysis Report
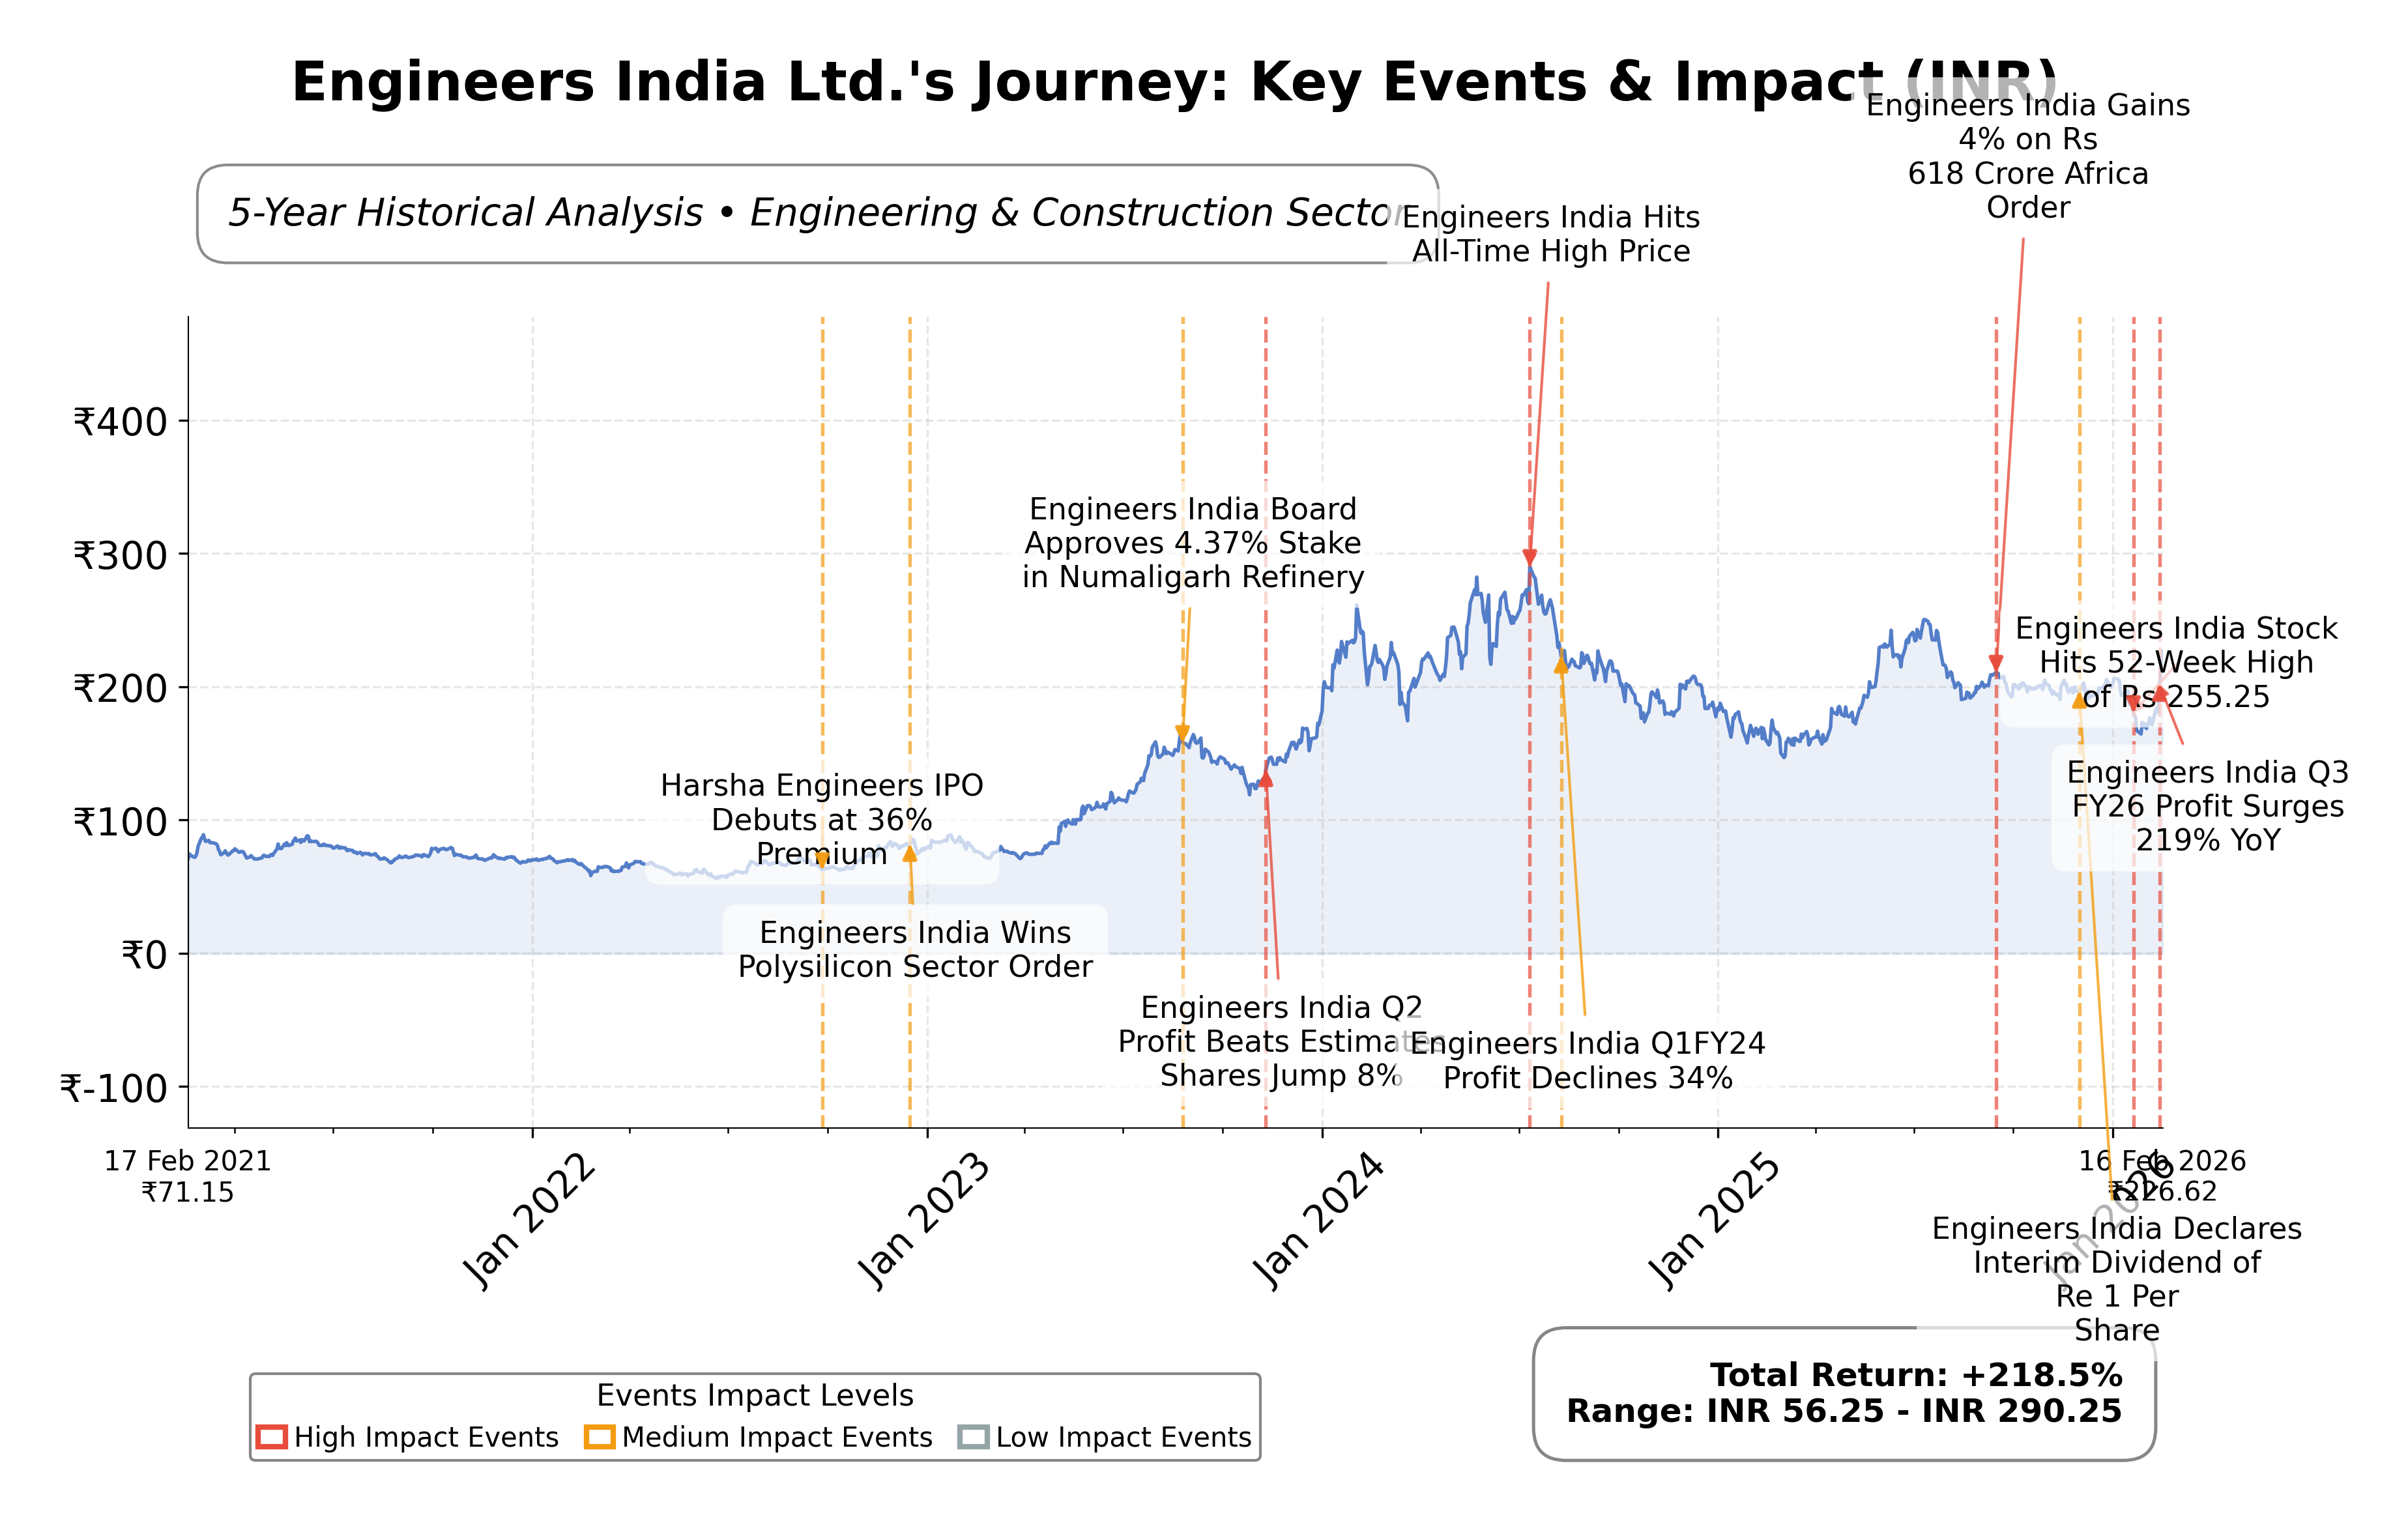
Stock Journey
Key Positives and Key Risks
Pros
- Revenue growth of 33.7% year-over-year demonstrates strong top-line expansion supporting growth potential.
- Low total debt of ₹197.74 million against cash reserves of ₹13.66 billion indicates robust financial strength and liquidity.
- Trailing P/E ratio of 18.92 aligns with industry average, reflecting balanced valuation relative to peers.
Cons
- Quarterly earnings growth declined by 16.2% year-over-year, suggesting potential short-term performance volatility.
- Price-to-CFO ratio of 47.56 is significantly higher than most peers, indicating relatively stretched cash flow valuation.
- Sector-specific risks including regulatory challenges and cyclicality in hydrocarbons may impact future profitability.
Disclosure: This information is for general awareness and does not constitute investment advice
Report Summary
Engineers India Ltd. is a prominent engineering consultancy and EPC company operating primarily in the hydrocarbons sector, including oil and gas processing, petrochemicals, and pipelines. Established in 1965, the company offers comprehensive project management consultancy, engineering, procurement, and construction management services. It holds a significant position in the Indian engineering and construction industry, with a growing international presence and diversification into power and water sectors.
Financially, Engineers India Ltd. reported a market capitalization of approximately â¹113.44 billion and an enterprise value of â¹87.90 billion. The companyâs trailing P/E ratio stands at 18.92, with a forward P/E of 16.01, closely aligned with the industry average. It has a price-to-book ratio of 3.75 and an EV/EBITDA of 14.78. The firm demonstrated robust revenue growth of 33.7% year-over-year, with a net income of â¹5.37 billion and a profit margin of 15.07%. Cash reserves are strong at â¹13.66 billion, while debt remains low at â¹197.74 million, reflecting a conservative capital structure.
Technical indicators reveal a recent price surge with the stock trading above its 50-day moving average but slightly below the 200-day average, indicating mixed momentum. The company has experienced significant volume spikes and positive price momentum shifts recently. Strategic initiatives include expanding into new energy sectors and maintaining strong project execution capabilities. Key strengths include solid financial health, government collaborations, and technological expertise, while risks involve valuation scrutiny and sector cyclicality.
In comparison to regional peers such as Praj Industries, Rail Vikas Nigam, NCC Ltd., KNR Constructions, and Kalpataru Projects, Engineers India Ltd. maintains a moderate valuation profile with a P/E ratio lower than some peers but higher than others. Its market capitalization is mid-range among these companies. The EV/EBITDA and price-to-CFO ratios suggest a balanced operational efficiency relative to peers, with some competitors exhibiting higher valuation multiples and others showing negative cash flow metrics.
Engineers India Ltd. stands as a key player navigating the evolving engineering and construction landscape in India, marked by recent earnings strength and market enthusiasm. The company faces pivotal moments related to sustaining growth momentum, managing valuation expectations, and leveraging diversification opportunities. The stakes involve capitalizing on infrastructure demand while mitigating sector-specific risks. Given the current financial and technical profile, a neutral to cautiously optimistic stance may align with the prevailing market conditions and company fundamentals.
Company and Industry Overview
Company Basics
Price Performance
Company Size
Shareholding Pattern
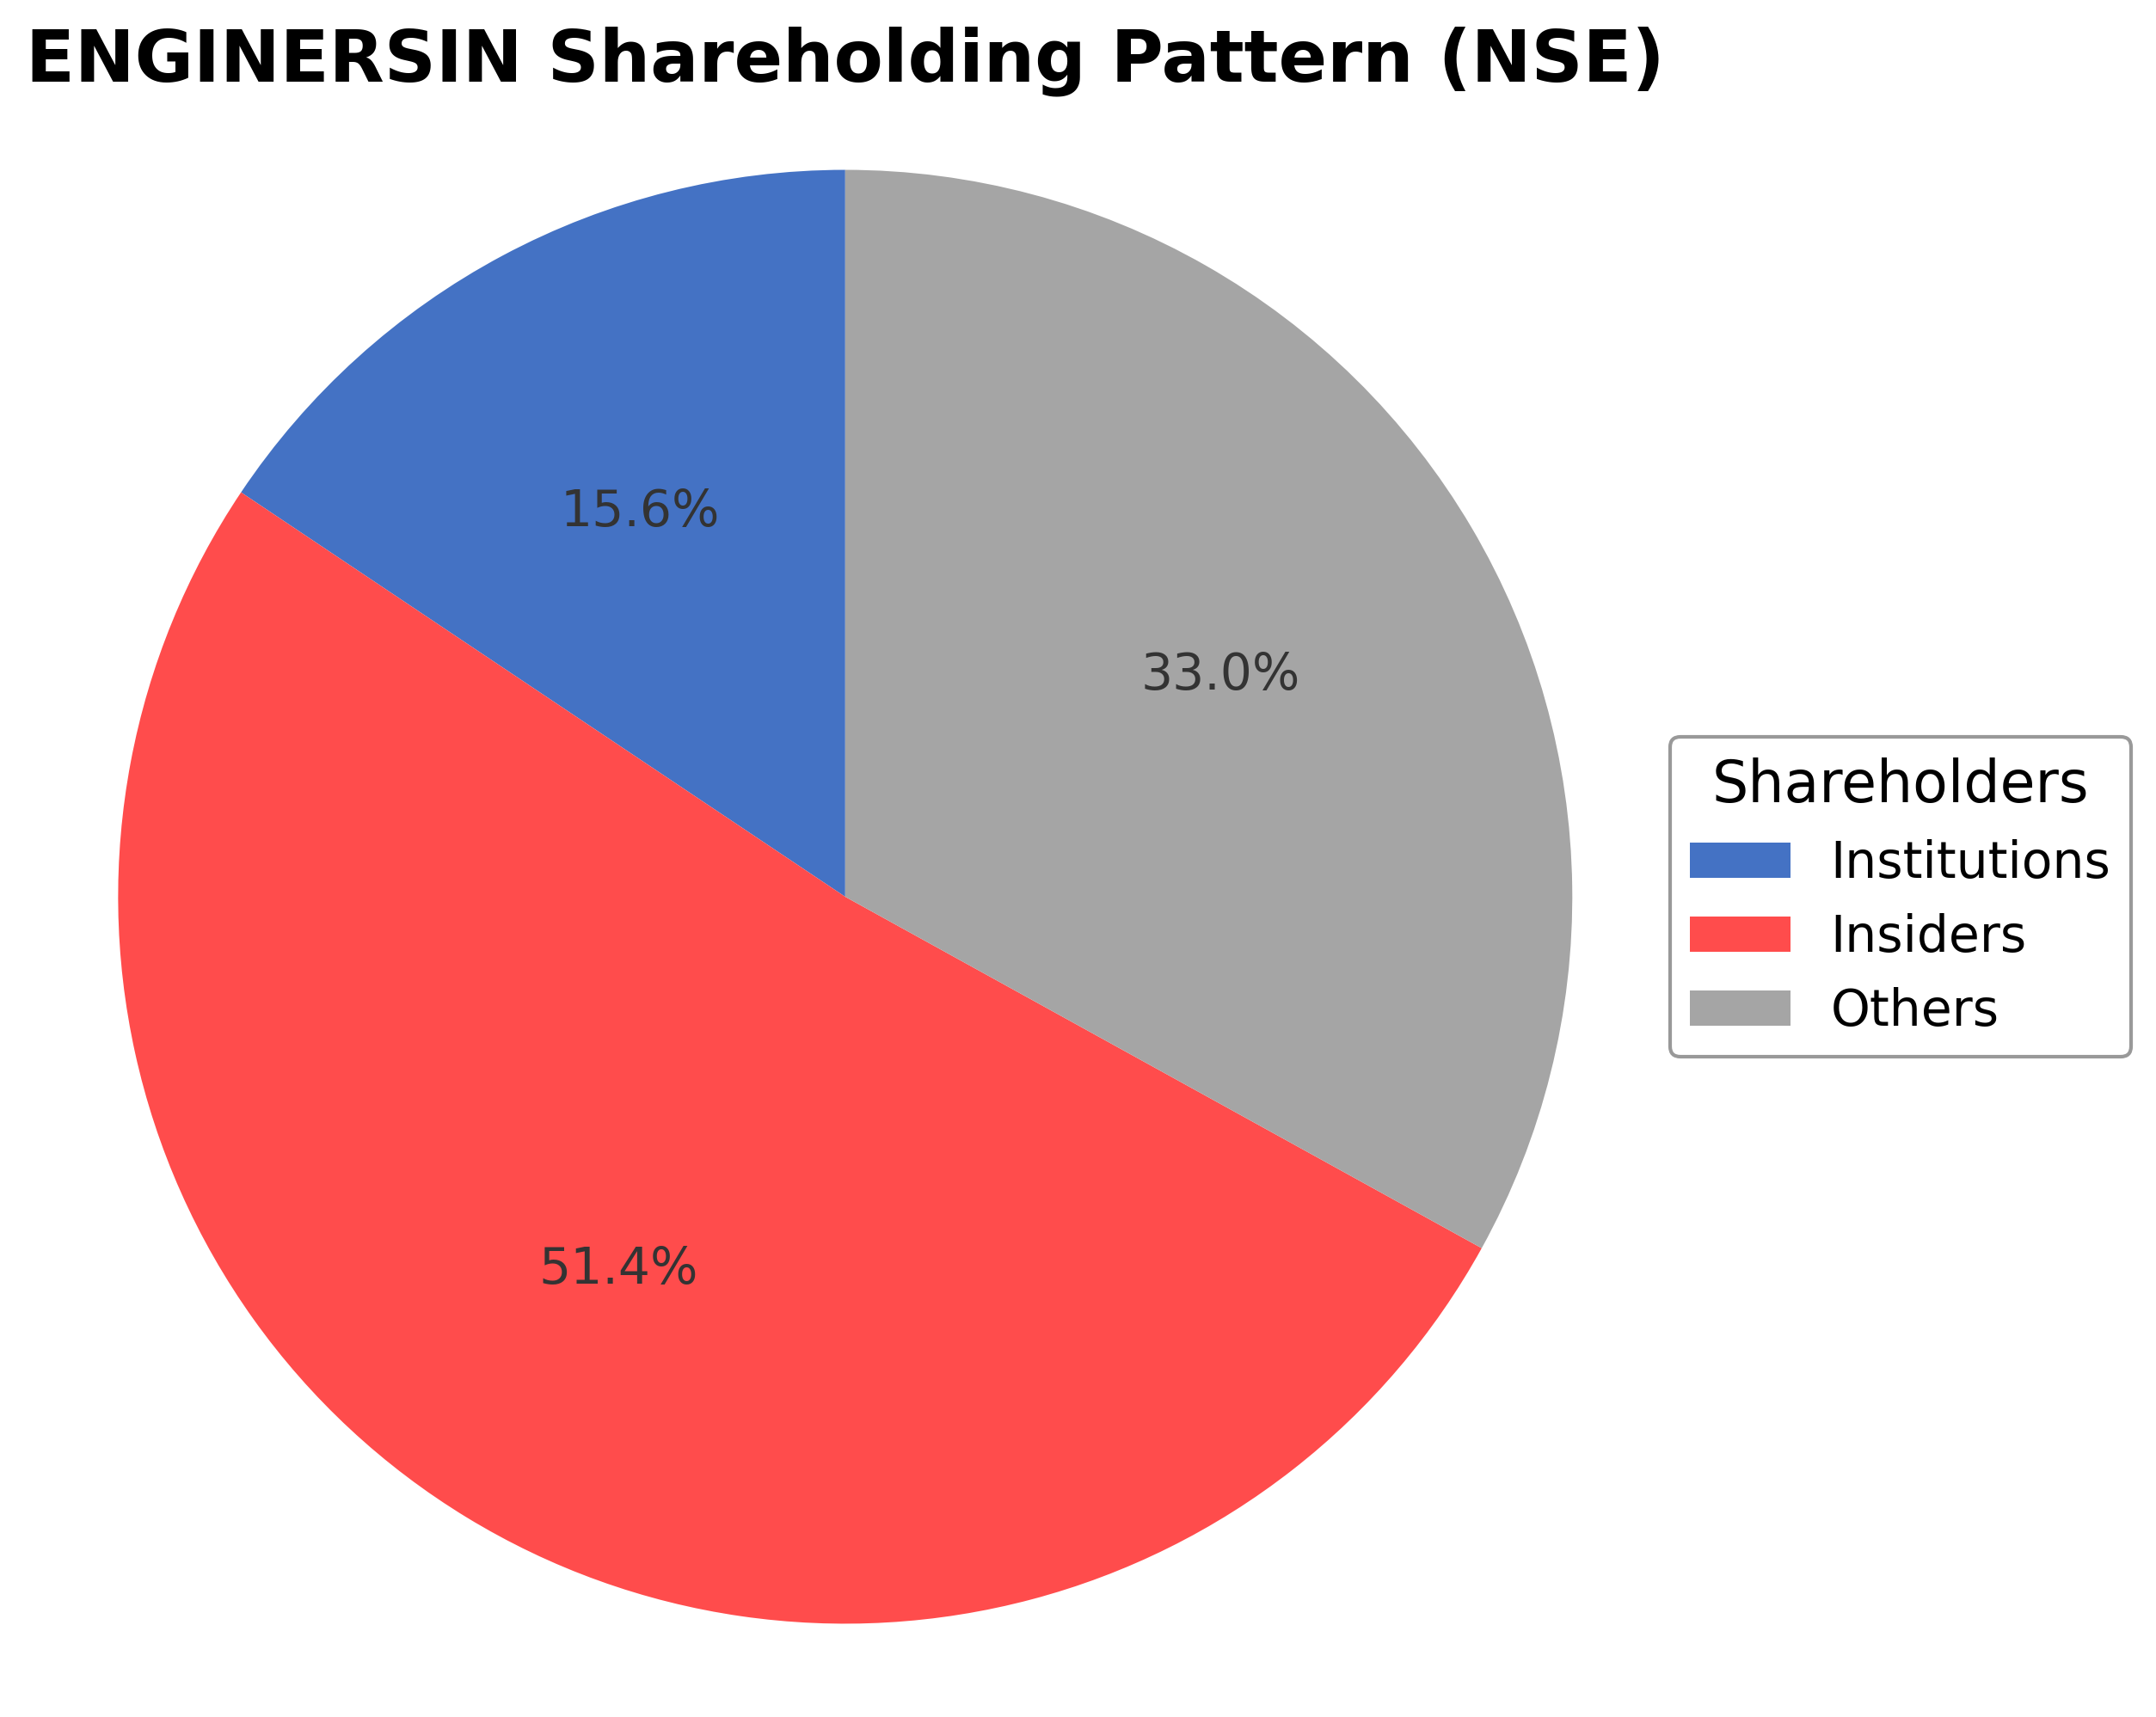
Engineers India Ltd.'s ownership structure comprises approximately 51.36% held by insiders including executives and board members, 15.61% by institutional investors such as mutual funds and asset managers, and 33.03% by public shareholders including retail investors and employee stock plans. Over the past 12-24 months, there have been no significant shifts in promoter holdings, while institutional investors have shown moderate accumulation, reflecting steady confidence in the company. Major funds have maintained or slightly increased their positions, indicating a stable market sentiment. This ownership distribution supports governance continuity and strategic direction, with a balanced influence from institutional and public shareholders, potentially facilitating measured corporate actions aligned with long-term objectives.
Sector and Industry Analysis
Engineers India Ltd. (ENGINERSIN) operates within the Engineering & Construction sector, specifically focusing on engineering consultancy and project management services primarily for the oil & gas, petrochemicals, refinery, and infrastructure industries. The sector is characterized by large-scale capital-intensive projects with long gestation periods, driven by global energy demand, infrastructure development, and industrial modernization. Market size is substantial and growing, particularly in emerging economies like India, where government initiatives to expand energy capacity and infrastructure underpin steady sector growth. Key players include large engineering consultancies and EPC (Engineering, Procurement, and Construction) firms such as Larsen & Toubro, TechnipFMC, and Fluor Corporation, which compete on technical expertise, project execution capabilities, and client relationships.
Industry trends reflect a shift towards digitalization and sustainability. The adoption of advanced technologies such as Building Information Modeling (BIM), digital twins, and AI-driven project management tools is enhancing efficiency and reducing costs. Additionally, there is increasing demand for green engineering solutions aligned with global decarbonization goals, including renewable energy projects and carbon capture technologies. Consumer behavior in this B2B space is evolving with clients seeking integrated solutions that combine engineering design, procurement, and operational support, emphasizing lifecycle value and risk mitigation. Emerging opportunities lie in renewable energy infrastructure, smart city projects, and modernization of aging oil & gas assets, driven by both public and private sector investments.
The regulatory environment is complex and heavily influenced by national and international standards related to safety, environmental protection, and quality assurance. Compliance with regulations such as India’s Environment Protection Act, petroleum and natural gas safety standards, and international certifications (ISO, API) is mandatory. Policy initiatives like India’s National Infrastructure Pipeline and energy transition policies create both opportunities and compliance challenges. Regulatory scrutiny on environmental impact assessments and labor laws also shapes project timelines and cost structures. Firms must navigate these frameworks while maintaining alignment with evolving government priorities on sustainability and indigenous manufacturing.
Competitive dynamics in the engineering consultancy and project management industry are defined by high entry barriers including capital intensity, technical expertise, and established client networks. Market structure is moderately concentrated with a few large incumbents dominating major projects, while smaller specialized firms compete in niche segments. Competitive positioning hinges on proven track records, technological capabilities, and the ability to deliver complex projects on time and budget. Strategic partnerships and alliances with technology providers and equipment manufacturers are increasingly important. Additionally, government ownership or backing, as in the case of Engineers India Ltd., can provide competitive advantages in securing public sector contracts but also entails adherence to stricter governance and transparency standards. Overall, the sector demands continuous innovation and operational excellence to maintain market share amid evolving client expectations and regulatory demands.
Note: Analysis synthesized from industry research, market reports, and regulatory filings. Information is subject to change based on market conditions.
Illustrative Scenario Analysis
DCF Assumptions:
Method: Two-Stage EPS-Priority Model
Financials
Peer Analysis
| Company Name | Market Cap | P/E Ratio | P/B Ratio | EV/EBITDA | Price to CFO |
|---|---|---|---|---|---|
| Engineers India Ltd. | ₹113.44B | 18.92 | 3.75 | 14.78 | 47.56 |
| Praj Industries Ltd. | ₹56.70B | 108.61 | 4.35 | 39.63 | 38.06 |
| Rail Vikas Nigam Ltd. | ₹644.35B | 56.17 | 6.77 | 72.10 | 28.94 |
| Ncc Ltd. | ₹95.39B | 13.19 | 1.27 | 6.49 | -9.83 |
| KNR Constructions Ltd. | ₹39.77B | 8.49 | 0.84 | 5.13 | -10.06 |
| Kalpataru Projects International Limited | ₹187.32B | 22.42 | 2.69 | 11.13 | -13.87 |
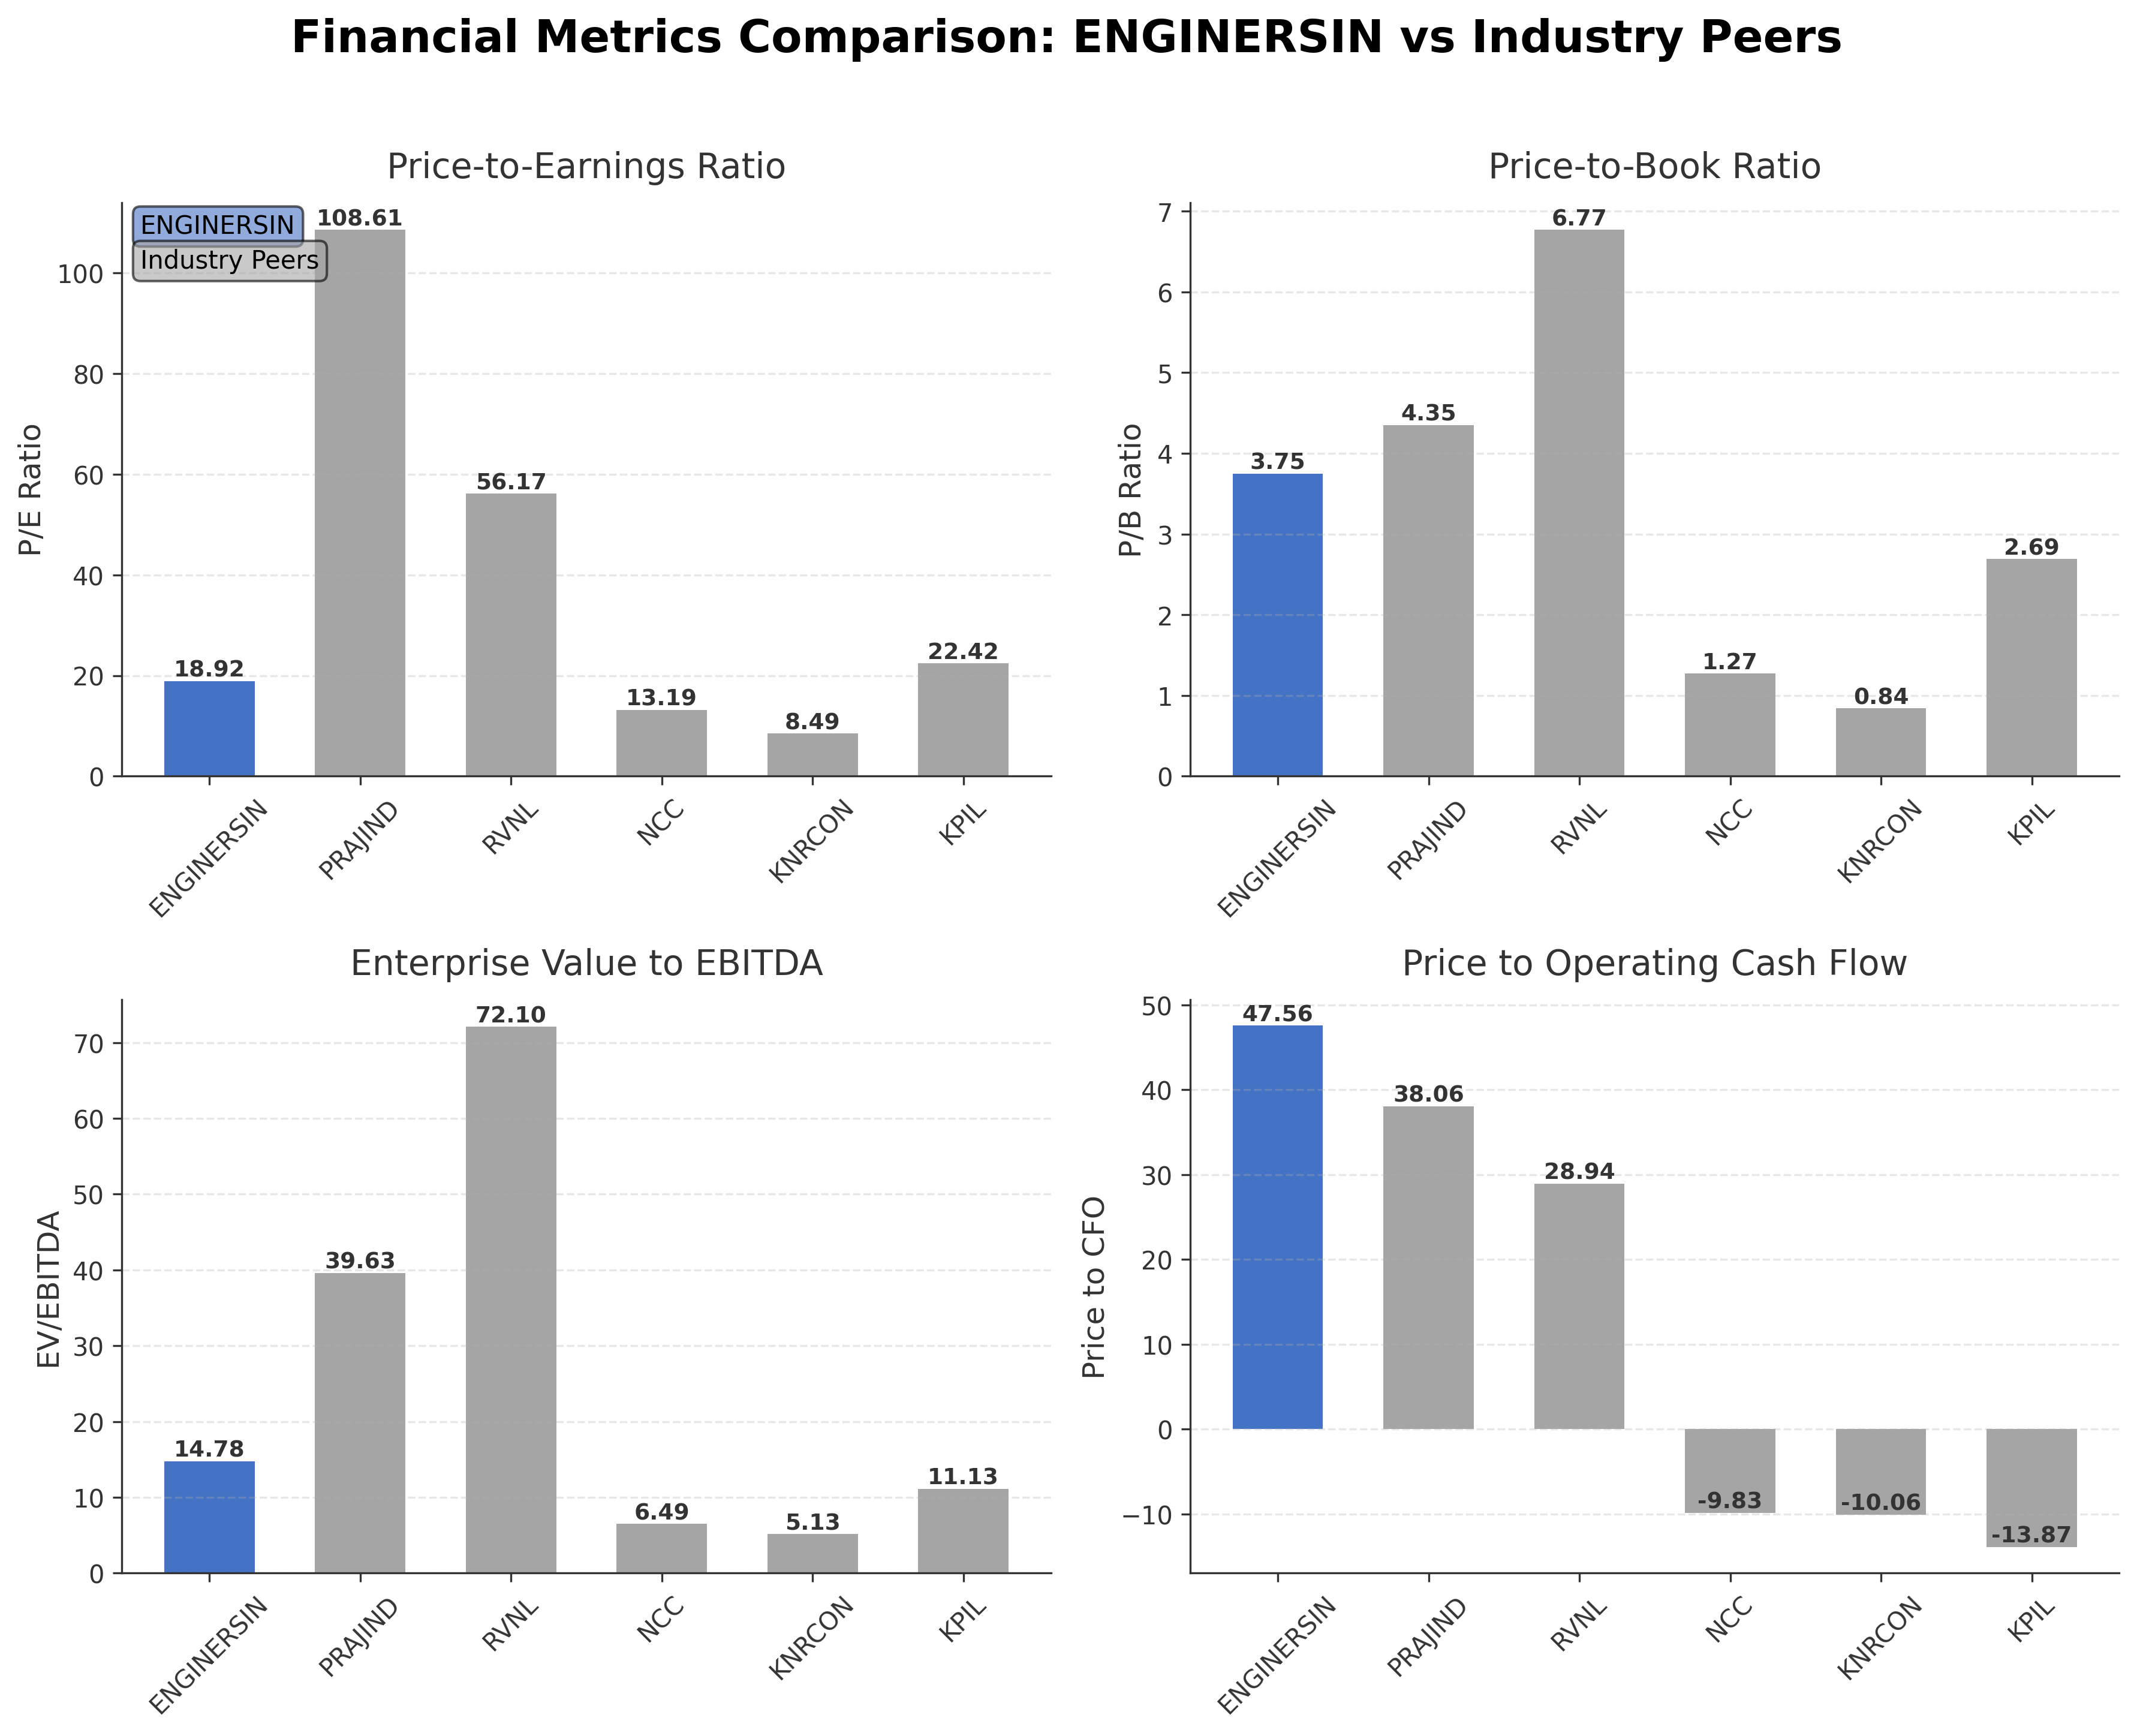
Comparison Analysis: Engineers India Ltd. exhibits a moderate valuation profile relative to its Indian engineering and construction peers. Its P/E ratio of 18.92 is lower than high-valued peers like Praj Industries and Rail Vikas Nigam but higher than more value-oriented companies such as NCC and KNR Constructions. The price-to-book ratio of 3.75 is above some peers, indicating a premium valuation on net assets. EV/EBITDA at 14.78 suggests operational efficiency that is competitive but not the lowest in the group. The price-to-CFO ratio is notably higher than most peers, reflecting relatively strong cash flow valuation. Overall, Engineers India Ltd. balances growth and valuation metrics within its peer set, with some peers showing more aggressive or conservative profiles.
Financial Metrics Comparison with Peers
Financial Statements
Comprehensive financial data including income, balance sheet, and cash flow metrics
Income Statement
| fiscal_date | 2025-03-31 | 2024-03-31 | 2023-03-31 | 2022-03-31 | 2021-03-31 |
|---|---|---|---|---|---|
| Sales | 30.88B | 32.81B | 33.30B | 29.22B | 31.44B |
| Cost Of Goods | 13.16B | 16.96B | 18.36B | 13.75B | 16.61B |
| Gross Profit | 17.72B | 15.85B | 14.94B | 15.47B | 14.83B |
| Operating Expense Research And Development | 1.34M | N/A | 1.98M | 1.16M | 10.50M |
| Operating Expense Selling General And Administrative | 412.89M | N/A | 256.21M | 189.28M | 135.72M |
| Operating Expense Other Operating Expenses | 1.70B | 3.02B | 2.32B | 2.37B | 2.20B |
| Operating Income | 4.81B | 2.62B | 2.83B | 3.25B | 3.34B |
| Non Operating Interest Income | 969.88M | N/A | 716.06M | 655.23M | 1.58B |
| Non Operating Interest Expense | 26.59M | 30.46M | 15.04M | 9.55M | 36.90M |
| Pretax Income | 6.30B | 4.78B | 4.46B | 4.49B | 3.56B |
| Income Tax | 1.58B | 1.18B | 1.01B | 1.07B | 948.66M |
| Net Income | 5.80B | 4.45B | 3.46B | 1.40B | 2.49B |
| Eps Basic | 10.32 | 7.92 | 6.16 | 2.48 | 3.99 |
| Eps Diluted | 10.32 | 7.92 | 6.16 | 2.48 | 3.99 |
| Basic Shares Outstanding | 562.04M | 562.19M | 562.12M | 562.04M | 624.06M |
| Diluted Shares Outstanding | 562.04M | 562.19M | 562.12M | 562.04M | 624.06M |
| Ebit | 6.33B | 4.81B | 4.47B | 4.50B | 3.60B |
| Ebitda | 6.65B | 5.16B | 4.73B | 4.72B | 5.38B |
| Net Income Continuous Operations | 6.30B | 4.78B | 4.46B | 4.48B | 3.56B |
| Minority Interests | 0.00 | 0.00 | 0.00 | 0.00 | 0.00 |
| Preferred Stock Dividends | 0.00 | 0.00 | 0.00 | 0.00 | 0.00 |
Data provided by Twelve Data
Balance Sheet
| fiscal_date | 2025-09-30 | 2025-03-31 | 2024-09-30 | 2024-03-31 | 2023-09-30 |
|---|---|---|---|---|---|
| Cash And Cash Equivalents | 742.32M | 1.39B | 648.64M | 2.51B | 868.36M |
| Accounts Receivable | 5.00B | 4.45B | 4.32B | 3.36B | 3.80B |
| Total Assets | 54.57B | 52.65B | 49.05B | 47.42B | 45.18B |
| Total Liabilities | 27.51B | 25.96B | 25.23B | 24.87B | 23.56B |
| Long Term Debt | 87.86M | 96.16M | 148.70M | 193.95M | 144.05M |
| Shareholders Equity | 27.05B | 26.69B | 23.82B | 22.55B | 21.62B |
Data provided by Twelve Data
Cash Flow Statement
| fiscal_date | 2025-03-31 | 2024-03-31 | 2023-03-31 | 2022-03-31 | 2021-03-31 |
|---|---|---|---|---|---|
| Operating Activities Net Income | 6.30B | 4.78B | 4.46B | 4.48B | 3.56B |
| Operating Activities Other Non Cash Items | -947.05M | -1.42B | -704.54M | -617.04M | -1.56B |
| Operating Activities Accounts Receivable | -4.00B | -608.51M | -3.28B | 1.14B | 1.17B |
| Operating Activities Other Assets Liabilities | -787.00K | 5.33M | 11.73M | -4.05M | 47.83M |
| Operating Activities Operating Cash Flow | 1.35B | 2.75B | 480.04M | 4.99B | 3.22B |
| Investing Activities Capital Expenditures | -409.67M | -339.01M | -344.73M | -254.03M | -114.45M |
| Investing Activities Purchase Of Investments | -12.54B | -10.05B | -17.15B | -12.67B | -22.46B |
| Investing Activities Sale Of Investments | 11.65B | 10.85B | 19.53B | 12.92B | 28.73B |
| Investing Activities Investing Cash Flow | -1.30B | -221.96M | 2.03B | -450.01M | 5.95B |
| Financing Activities Common Dividends | -1.69B | -1.69B | -1.69B | -1.46B | -1.74B |
| Financing Activities Financing Cash Flow | -1.69B | -1.69B | -1.69B | -1.46B | -9.01B |
| End Cash Position | 1.39B | 2.51B | 634.80M | 266.52M | 690.38M |
| Free Cash Flow | 673.13M | 1.88B | -1.47B | 168.80M | 1.60B |
| Investing Activities Other Investing Activity | N/A | -691.55M | 872.00K | N/A | 2.59M |
| Investing Activities Net Acquisitions | N/A | N/A | 0.00 | -445.94M | -210.16M |
| Financing Activities Common Stock Repurchase | N/A | N/A | N/A | 0.00 | -7.26B |
Data provided by Twelve Data
Technical Analysis
Key Insights
- The current trend shows a recent upward price momentum with the stock trading above its 50-day moving average (₹189.14) but slightly below the 200-day moving average (₹204.44), indicating mixed medium-term momentum.
- Key support levels are identified near ₹180 and ₹190, while resistance is observed around the 52-week high of ₹255.45.
- The stock price is positioned above the 10-day moving average but fluctuates near the 50-day and 200-day averages, suggesting consolidation phases.
- Momentum indicators show RSI trending upwards, crossing above 50, signaling strengthening momentum; MACD indicates a bullish crossover, while stochastic oscillators reflect overbought conditions.
- Multi-timeframe analysis reveals bullish signals on daily and weekly charts, with monthly charts showing a longer-term sideways trend.
- Potential market scenarios include continuation of the recent rally if support holds, or a pullback towards key moving averages if resistance near 200-day MA proves strong.
Trending News
1. Headline: Engineers India Ltd. Hits Intraday High with 7.75% Surge on 16 Feb 2026
Summary: Engineers India Ltd. demonstrated robust intraday strength on 16 Feb 2026, surging to an intraday high of Rs 214.85, marking a 7.75% increase on the day driven by strong market interest and positive sentiment following recent earnings.
Sentiment: Positive
2. Headline: Engineers India Share Price Rise 14.30%; Extends Rally Post Q3 FY26 Earnings
Summary: Following the release of Q3 FY26 earnings, Engineers India Ltd shares rose by 14.30%, reflecting investor confidence in the company’s performance in the oil & gas and petrochemical sectors and its strong order book.
Sentiment: Positive
3. Headline: Engineers India share price zooms 22% in 2 day; stock hits 7-month high on huge volumes
Summary: Engineers India’s share price surged 22% over two days, reaching a 7-month high on significant volume increases, supported by strong Q3 results and positive outlook from analysts highlighting order book growth and project execution.
Sentiment: Positive
4. Headline: Engineers India Ltd. Shows Mixed Technical Signals Amid Price Momentum Shift
Summary: Engineers India Ltd. experienced a notable shift in price momentum with an 11.64% gain on 16 Feb 2026, indicating a transition from bearish to mildly bullish technical trends, reflecting changing market dynamics and investor sentiment.
Sentiment: Positive
5. Headline: Engineers India's Q3 Surge: Growth Hopes Clash with Valuation Realities
Summary: Engineers India reported strong Q3 results driven by turnkey projects, while its diversification into new energy sectors faces scrutiny due to valuation concerns and historical performance, highlighting a balance between growth prospects and market expectations.
Sentiment: Positive
Powered by Brave
Recent Updates
News Summary
Recent news highlights a strong performance by Engineers India Ltd., with the company considering a second interim dividend following robust Q3 results. The stock has experienced exceptional volume surges and price momentum, reflecting positive market sentiment. Board meetings are scheduled to deliberate on dividend payouts, underscoring confidence in financial health. The share price has reached multi-month highs amid increased trading activity, signaling sustained investor interest. These developments collectively emphasize the company’s solid earnings trajectory and proactive shareholder engagement.
News Sentiment
Overall sentiment across recent updates is positive, with multiple sources indicating strong earnings performance, dividend considerations, and heightened market activity. The tone suggests growing confidence in the company’s operational execution and financial stability, although some neutral commentary on dividend decisions reflects prudent corporate governance.
Analytical Overview
Analysis Summary
Valuation Metrics: Engineers India Ltd.'s trailing P/E of 18.92 and forward P/E of 16.01 align closely with the industry average of 18.92, indicating a valuation in line with sector norms. The price-to-book ratio of 3.75 is moderately elevated, reflecting market confidence in asset quality and growth prospects.
Growth Trajectory: The company exhibits a strong revenue growth rate of 33.7% year-over-year, supported by a 15.07% profit margin and positive operating cash flow trends. However, quarterly earnings growth shows a slight year-over-year decline, suggesting some variability in short-term performance.
Financial Health: With a low total debt of ₹197.74 million against cash reserves of ₹13.66 billion, Engineers India Ltd. maintains a conservative debt-to-equity ratio of 0.0073, indicating robust financial stability. Operating and free cash flows are positive, supporting ongoing operations and potential investments.
Sector Specific Factors: The engineering and construction sector in India faces challenges including project execution risks and regulatory complexities, but also benefits from government infrastructure initiatives and increasing demand in hydrocarbons and energy sectors. The company’s diversification into power and water sectors presents additional growth avenues.
Market Factors: Considering the Indian regulatory environment, evolving consumer and industrial demand, and economic outlook, Engineers India Ltd. is positioned to leverage infrastructure development trends while navigating sector cyclicality and valuation scrutiny.
Investment Conclusion
Supporting Factors: Strong revenue growth of 33.7% and solid profit margins support operational strength.
Risk Factors: Quarterly earnings growth shows some year-over-year decline, indicating potential short-term volatility.
SWOT Analysis
Strengths
- The company has a strong market position in the hydrocarbons engineering sector.
- Robust financial health with low debt and significant cash reserves.
- Experienced management and longstanding government collaborations.
- Diversified service offerings including EPCM and PMC enhance competitive advantage.
Weaknesses
- Relatively high price-to-book ratio may indicate premium valuation.
- Quarterly earnings growth shows some negative year-over-year trends.
- Dependence on cyclical hydrocarbons sector exposes revenue to market fluctuations.
- Limited presence outside core sectors may constrain diversification benefits.
Opportunities
- Expansion into power and water sectors offers new revenue streams.
- Growing infrastructure development in India supports long-term demand.
- Technological advancements can improve project efficiency and margins.
- Potential for increased institutional investment could enhance liquidity.
Threats
- Regulatory and environmental compliance challenges may increase costs.
- Competitive pressures from domestic and international firms.
- Volatility in oil and gas markets could impact project pipelines.
- Global economic uncertainties may affect capital expenditure in key sectors.
Company Description
Engineers India Ltd. is a leading engineering consultancy company, offering a diverse array of services primarily in the hydrocarbons sector, which includes oil and gas processing, petrochemicals, and pipelines. Established in 1965, the company provides end-to-end solutions encompassing project management consultancy (PMC), engineering, procurement, and construction management (EPCM). With a significant footprint across the oil, gas, and petrochemical industries, Engineers India Ltd. plays a pivotal role in developing complex infrastructure projects both in India and internationally. In addition to hydrocarbons, the company extends its expertise to sectors such as power and water, aiming to enhance sustainability and efficiency. As a prominent player in its field, Engineers India Ltd. collaborates closely with government organizations and private enterprises, ensuring compliance with stringent safety and environmental standards. The company's comprehensive approach to project execution and its emphasis on innovation and technological advancement underscore its importance in the infrastructure development domain, both domestically and abroad.