
Eli Lilly and Company (LLY)
Stock Analysis Report
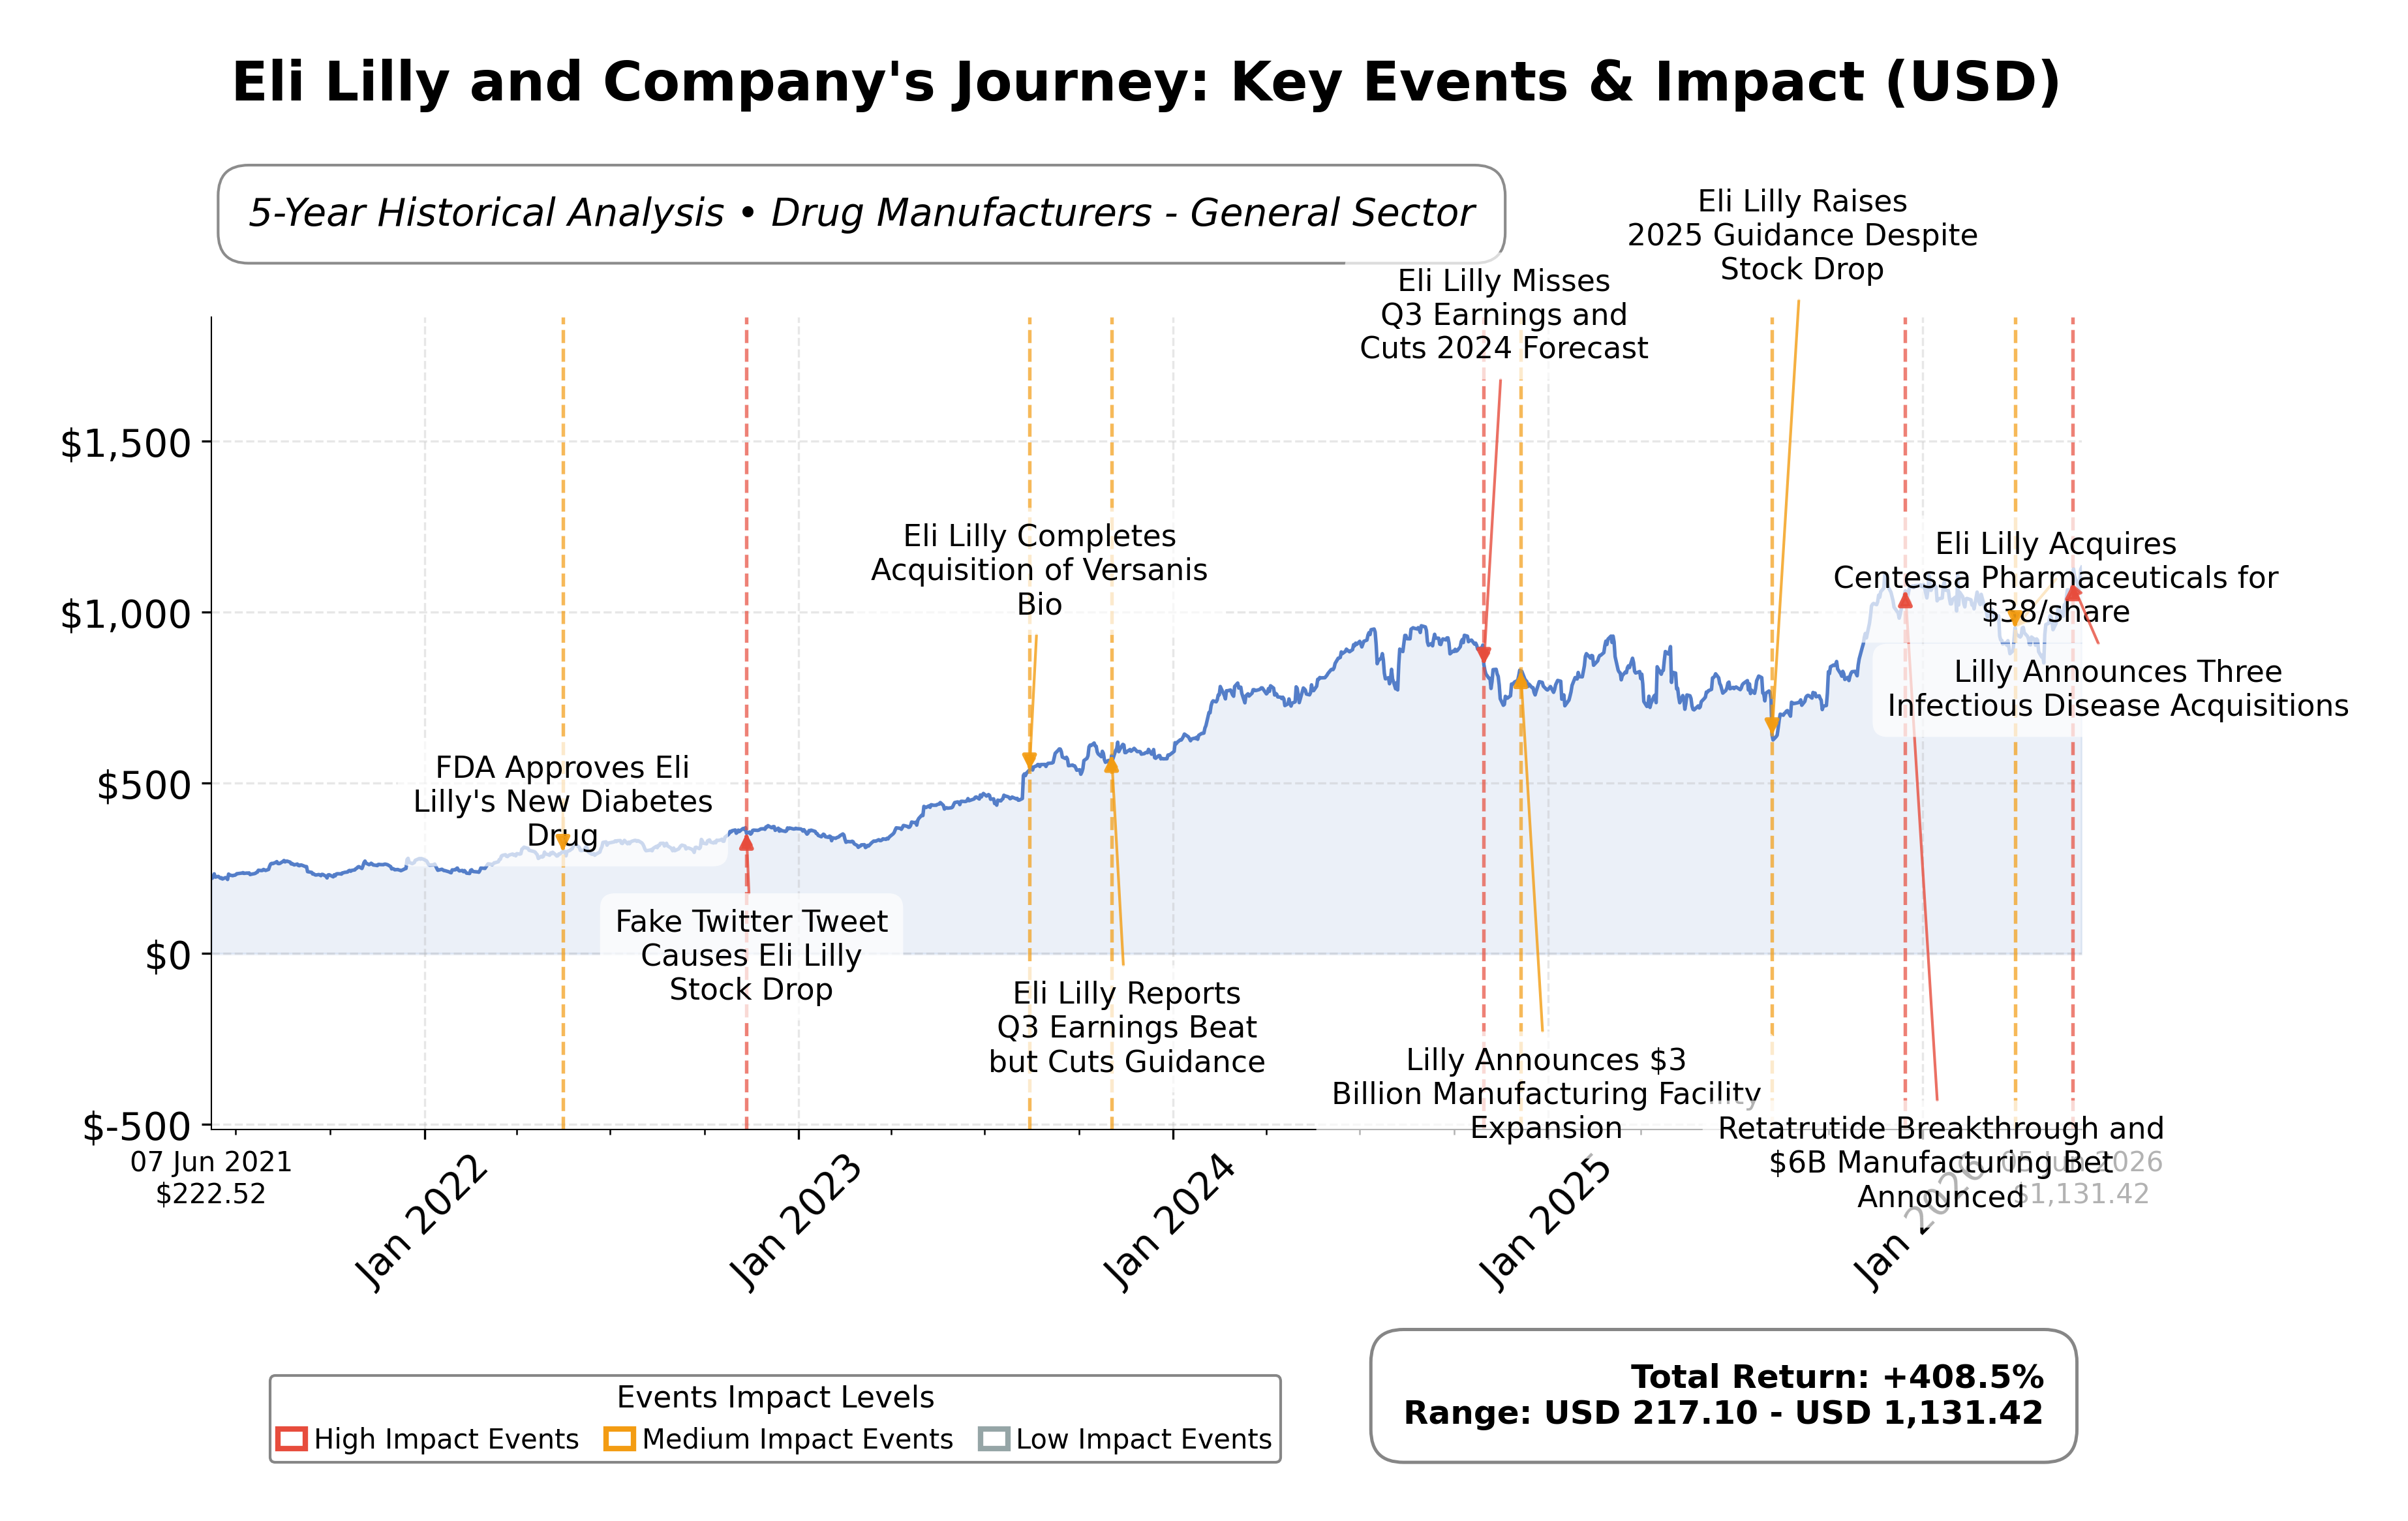
Stock Journey
Key Positives and Key Risks
Pros
- Revenue growth of 55.5% demonstrates strong top-line expansion and market demand.
- Return on equity of 107.46% indicates highly efficient use of shareholder capital.
- Free cash flow of approximately $9.16 billion supports financial flexibility and investment capacity.
Cons
- High debt-to-equity ratio of 139% reflects significant leverage that may increase financial risk.
- Price-to-book ratio of 31.65 suggests the stock is trading at a substantial premium to book value.
- Enterprise value to EBITDA multiple of 28.80 is elevated relative to peers, indicating stretched valuation.
Disclosure: This information is for general awareness and does not constitute investment advice
Report Summary
Eli Lilly and Company is a prominent pharmaceutical firm listed on the NYSE under the healthcare sector, specializing in the discovery, development, manufacture, and sale of human pharmaceutical products. The company operates globally with a diverse portfolio addressing critical health needs such as diabetes, oncology, immunology, neuroscience, and obesity. It maintains a strong market position with innovative therapies including insulins and GLP-1 treatments, supported by a robust research pipeline and strategic partnerships to enhance access in emerging markets.
Financially, Eli Lilly reported trailing twelve months (TTM) revenue of approximately $72.25 billion with a gross margin of 81.93%, operating margin of 49.39%, and net profit margin of 34.99%, reflecting high profitability and operational efficiency. The company’s return on equity (ROE) stands at 107.46%, and return on assets (ROA) at 20.74%, indicating effective use of shareholder capital and asset base. Operating cash flow totaled $20.48 billion with free cash flow near $9.16 billion, underscoring strong cash generation capabilities.
Valuation metrics show a trailing P/E ratio of 39.23 and a forward P/E of 24.85, with a price-to-book ratio of 31.65 and an enterprise value to EBITDA multiple of 28.80. The market capitalization is approximately $985.37 billion. The stock price currently trades near $1,132.53, close to its 52-week high of $1,149.10 and well above the 52-week low of $623.78, indicating a strong price appreciation over the past year.
Key strengths include market leadership in multiple therapeutic areas, strong cash flow generation, and a diversified product pipeline with recent strategic vaccine acquisitions valued at $3.8 billion. Risks involve regulatory challenges, competitive pressures in the pharmaceutical industry, and the recent decision to halve planned investment in Germany. The company’s high debt-to-equity ratio of 139% warrants monitoring, although liquidity remains adequate with a current ratio of 1.50.
Technically, Eli Lilly’s stock is trading above its 50-day and 200-day moving averages, supported by positive momentum indicators across multiple timeframes. Recent news highlights continued investor interest driven by pipeline milestones and commercial expansion. The overall data suggest a market environment conducive to maintaining a watchful stance, balancing growth prospects against valuation and risk factors.
Company and Industry Overview
Company Basics
Price Performance
Company Size
Shareholding Pattern
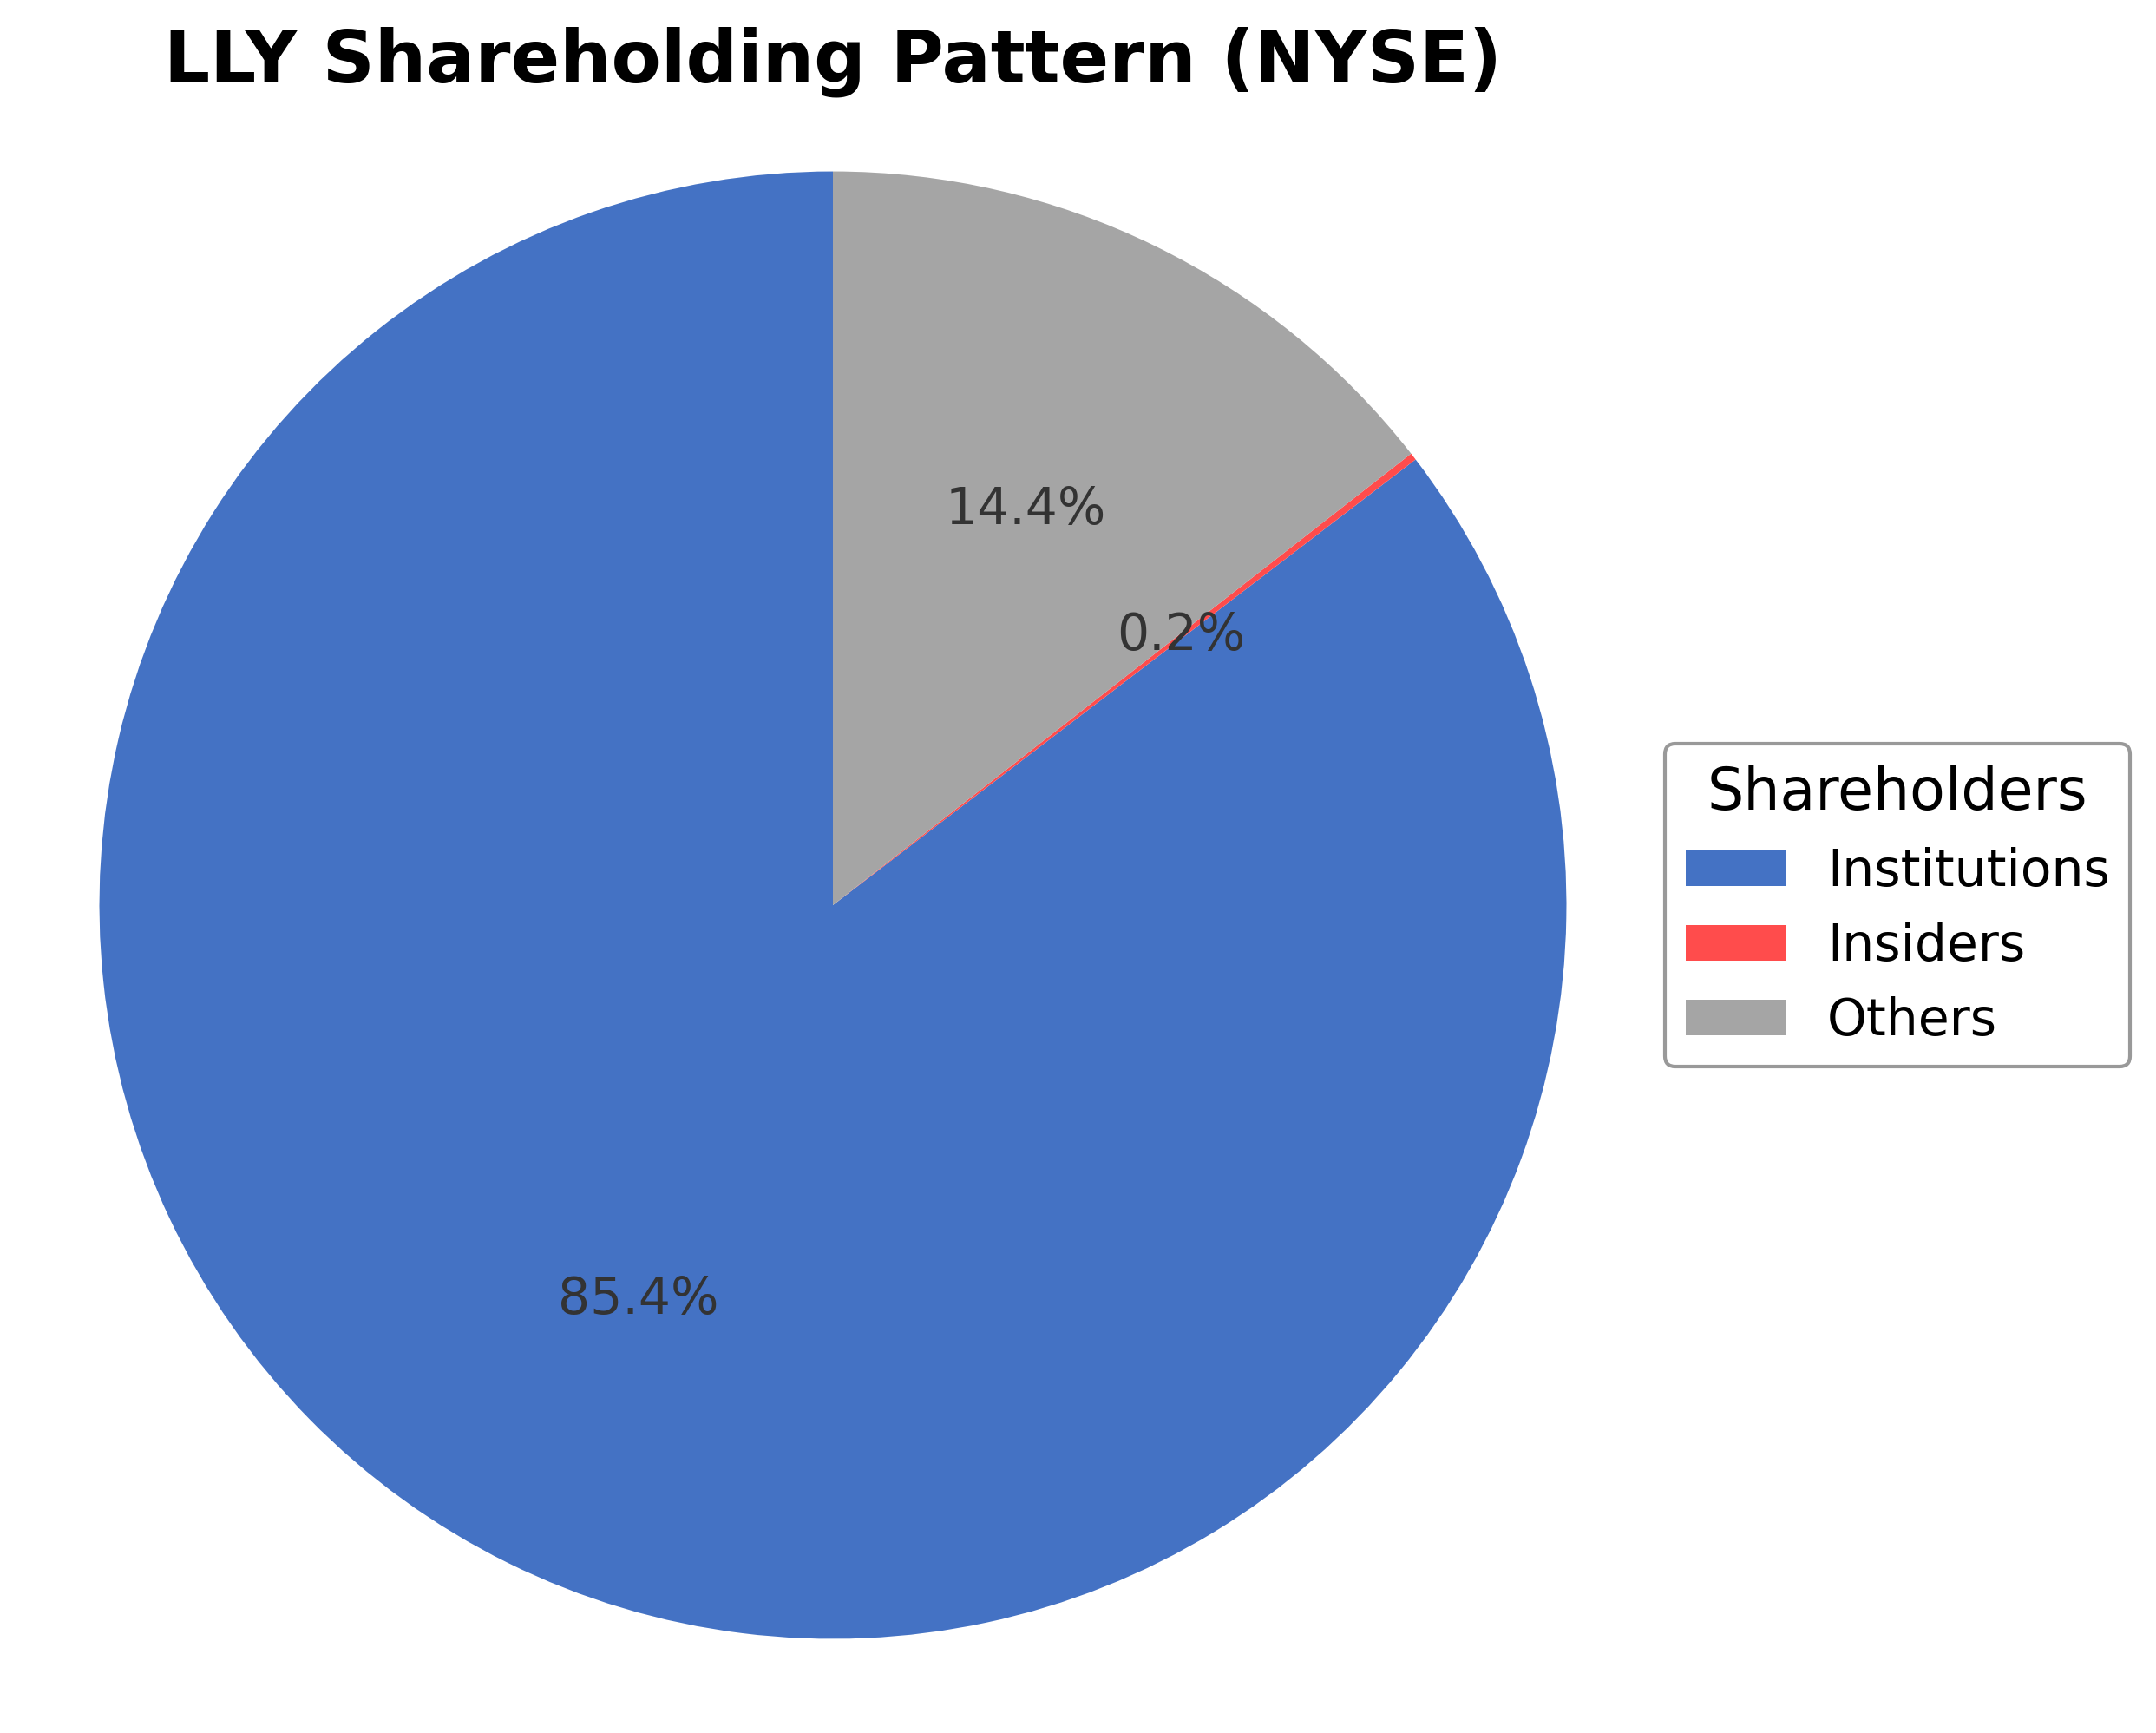
Eli Lilly and Company’s ownership structure is dominated by institutional investors holding approximately 85.39% of shares, reflecting strong confidence from mutual funds, pension funds, and asset managers. Insider ownership is minimal at around 0.16%, indicating limited direct executive or board member holdings. The remaining shares are held by public investors and other entities, comprising about 14.45%. Over the past 12-24 months, institutional accumulation has been steady, with no significant shifts reported among major funds. This ownership pattern suggests robust institutional support, which may influence governance and strategic decisions, while maintaining broad market participation. The company operates within the highly regulated pharmaceutical industry, where innovation and pipeline development are critical for sustained growth.
Sector and Industry Analysis
The global pharmaceutical sector remains a multi-trillion-dollar industry characterized by steady growth driven by aging populations, rising chronic disease prevalence, and innovation in biologics and precision medicine. Leading players include Eli Lilly, Pfizer, Roche, and Johnson & Johnson, each with extensive R&D pipelines and diversified therapeutic portfolios. Growth is particularly strong in specialty areas such as metabolic diseases, oncology, and neuroscience, with expanding markets in obesity, diabetes, and Alzheimer’s disease treatments.
Industry dynamics are shaped by rapid innovation cycles, with companies investing heavily in novel modalities like bispecific antibodies, small molecule receptor agonists, and multi-target therapies. Barriers to entry remain high due to significant R&D costs, complex clinical trial requirements, and intellectual property protections. Competitive positioning increasingly hinges on pipeline productivity, strategic approvals, and the ability to address unmet medical needs, as exemplified by Eli Lilly’s leadership in incretin therapies and Alzheimer’s disease assets.
The regulatory environment continues to evolve with agencies like the FDA emphasizing expedited review pathways, such as the National Priority Review pilot that facilitated approval of novel oral GLP-1 receptor agonists. Safety monitoring and label updates, particularly for drugs targeting complex diseases like Alzheimer’s, are critical to maintaining market access. Ongoing regulatory support for innovation, balanced with rigorous safety standards, shapes the sector’s outlook by enabling faster patient access to breakthrough therapies while ensuring efficacy and risk management.
Note: Analysis synthesized from industry research, market reports, and regulatory filings. Information is subject to change based on market conditions.
Financial Ratios Dashboard
Illustrative Scenario Analysis
DCF Assumptions:
Method: Two-Stage EPS-Priority Model
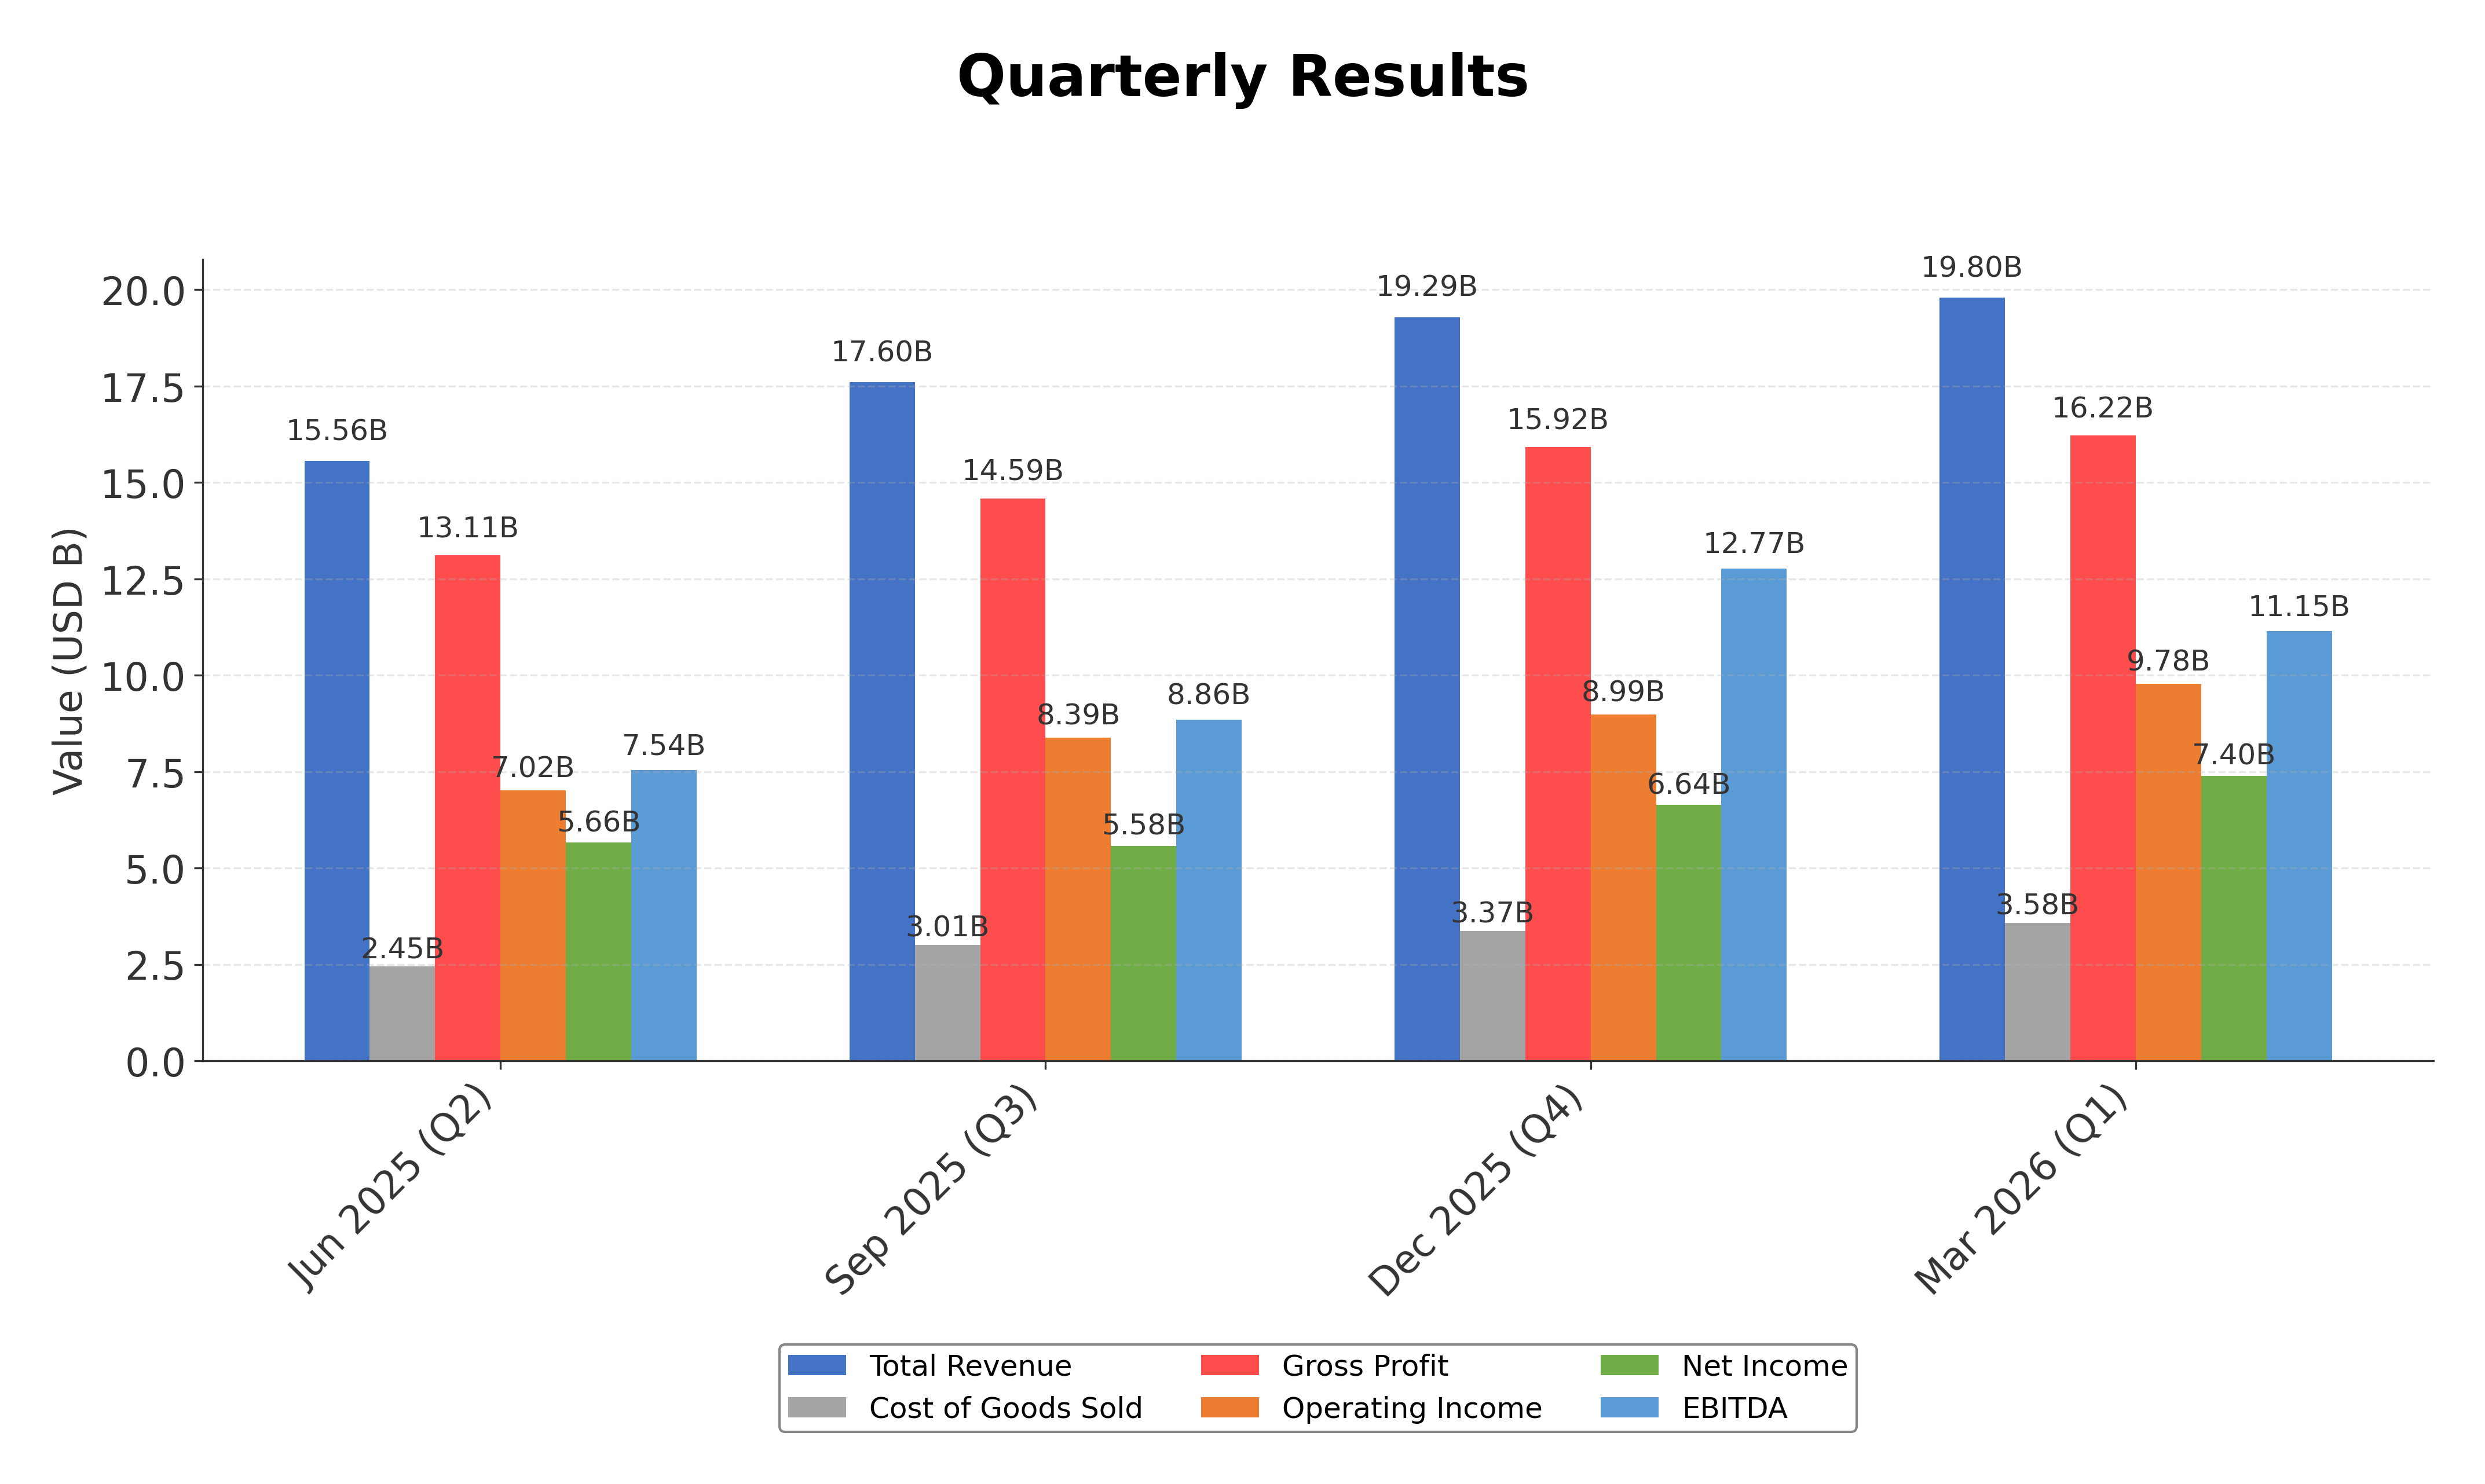
Financials
Peer Analysis
| Company Name | Market Cap | P/E Ratio | P/B Ratio | EV/EBITDA | Price to CFO |
|---|---|---|---|---|---|
| Eli Lilly and Company | $985.37B | 39.23 | 31.65 | 28.80 | 48.11 |
| Novo Nordisk A/S Sponsored ADR | $201.95B | 10.70 | 6.42 | 1.88 | 10.95 |
| Gilead Sciences Inc. | $166.90B | 18.30 | 7.11 | 12.31 | 15.45 |
| Novartis AG Sponsored ADR | $286.54B | 21.51 | 6.21 | 14.37 | 14.94 |
| Pfizer Inc. | $149.21B | 19.90 | 1.65 | 7.89 | 12.45 |
| Bristol-Myers Squibb Company | $116.77B | 15.87 | 5.76 | 8.02 | 8.78 |
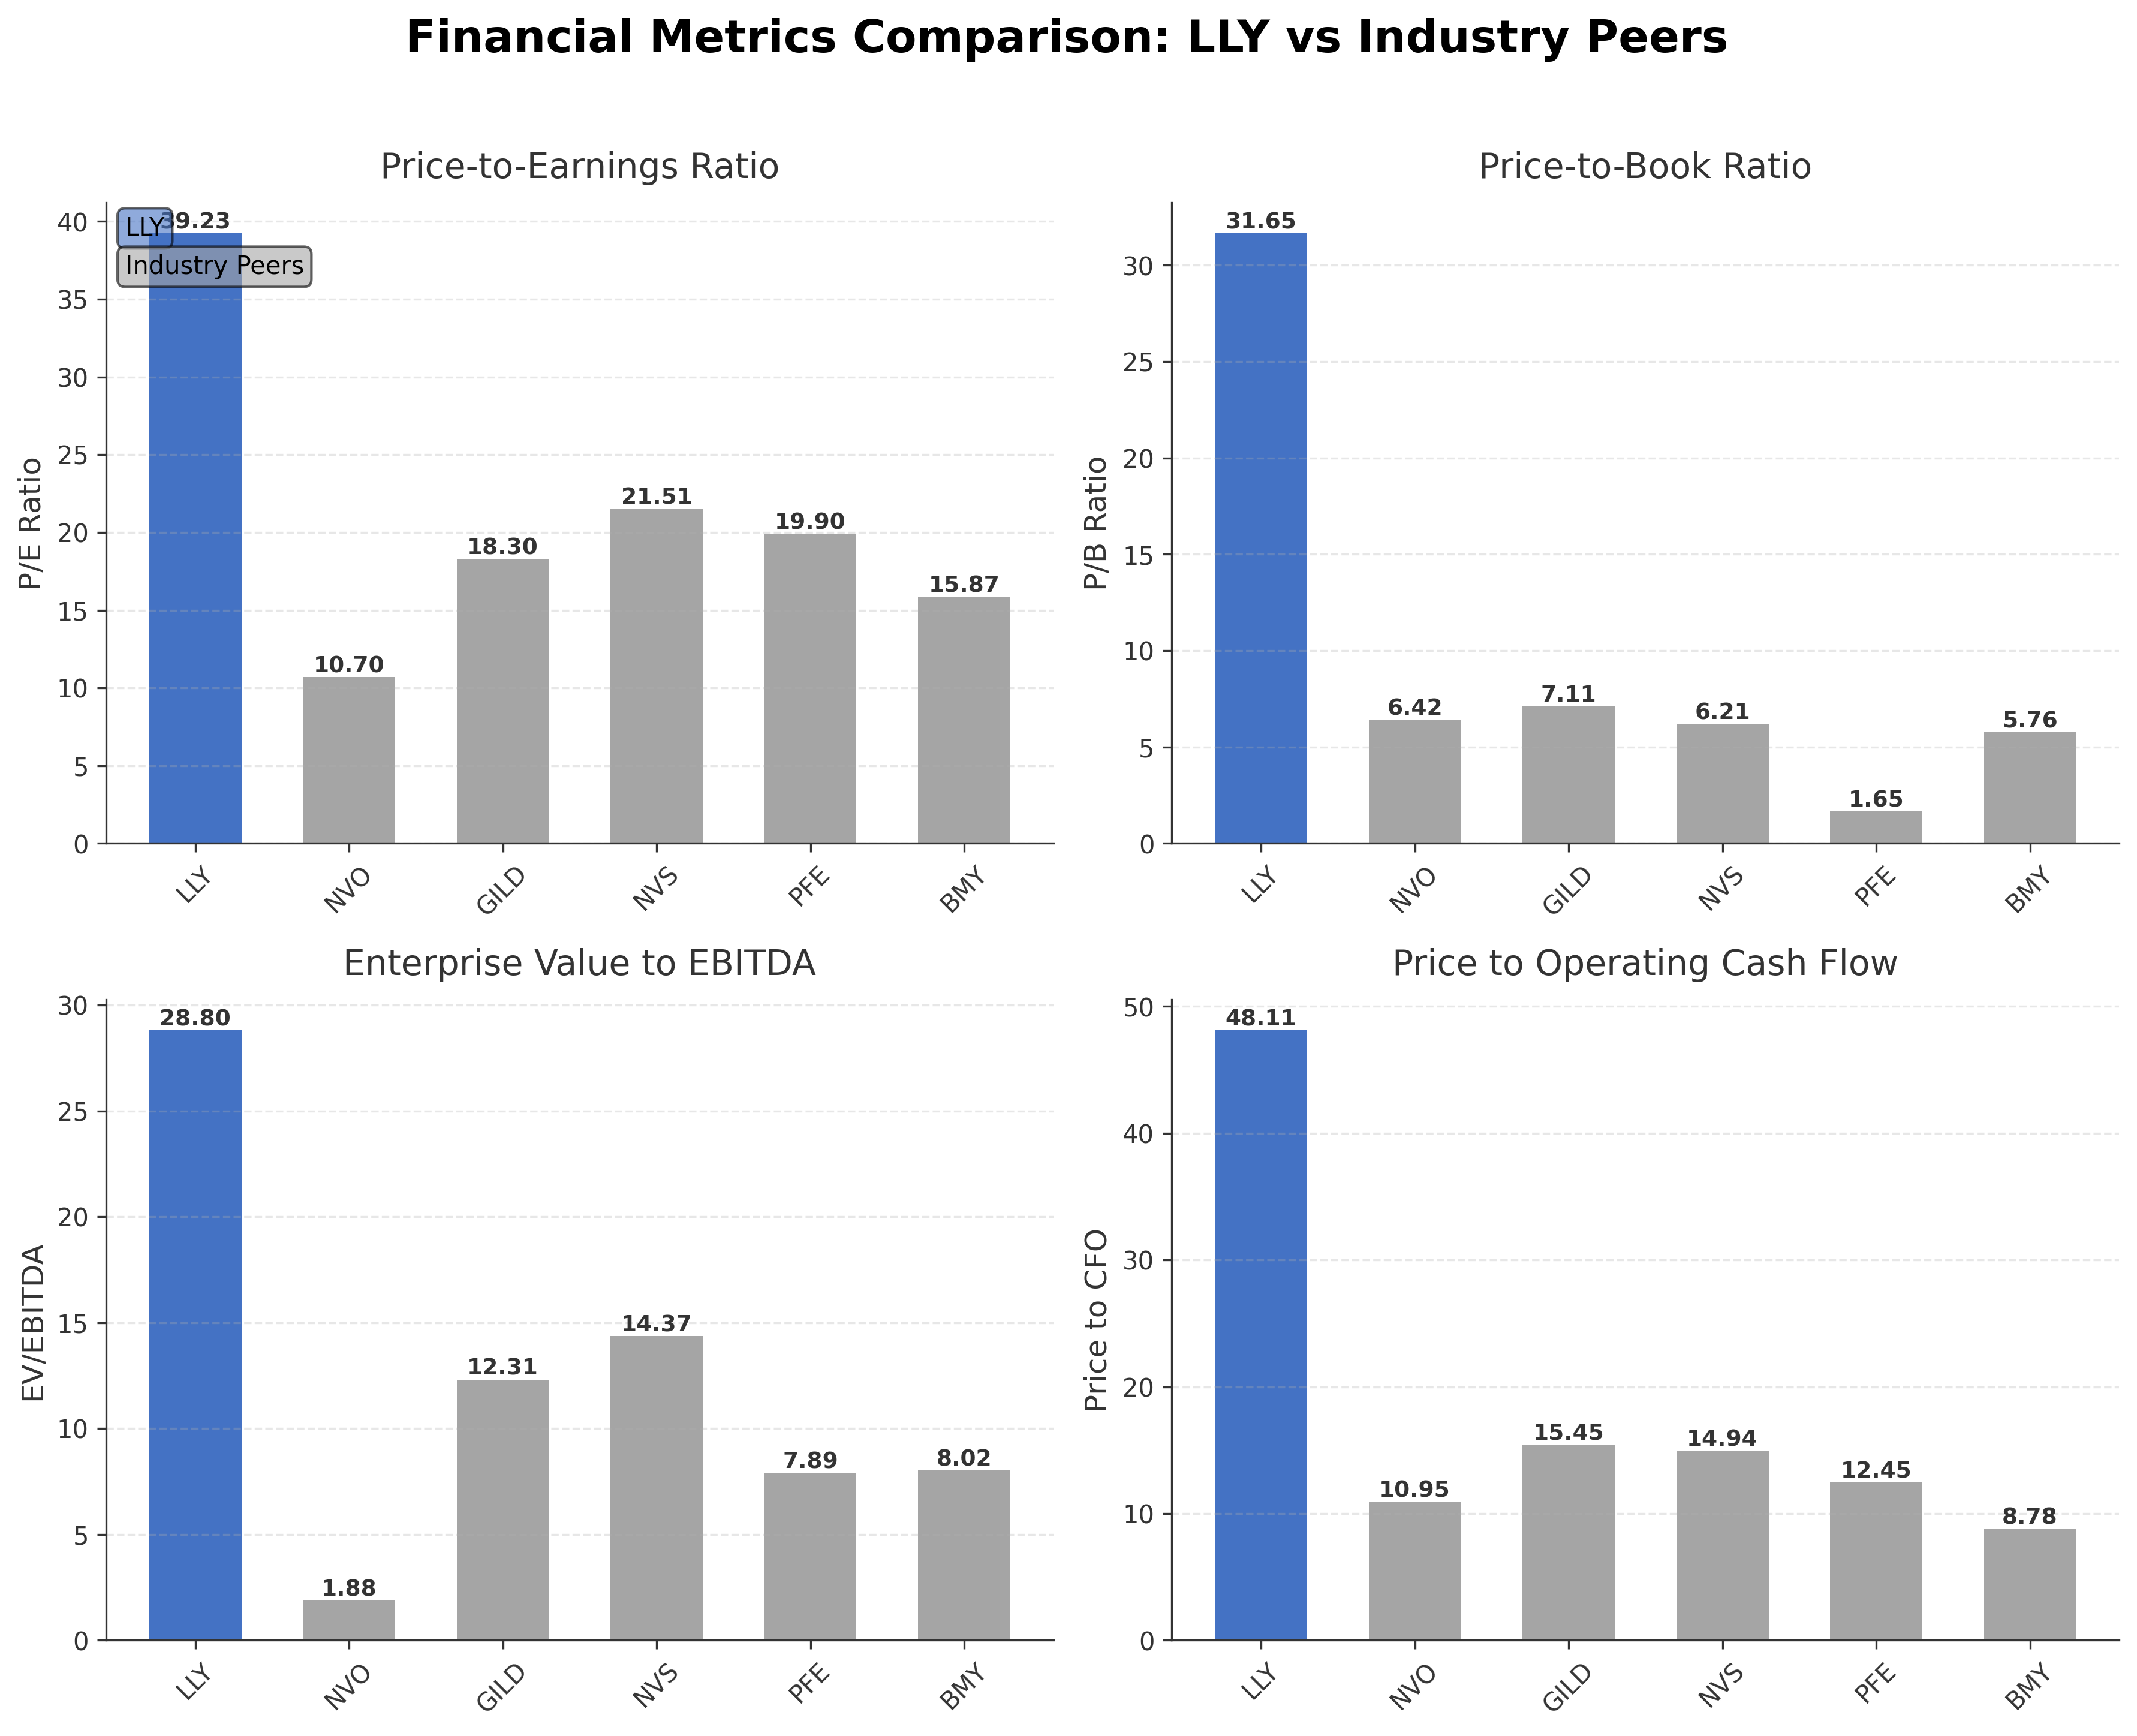
Comparison Analysis: Eli Lilly and Company exhibits significantly higher valuation multiples compared to its industry peers, with a trailing P/E of 39.23 versus peer averages ranging from approximately 10.70 to 21.51. Its price-to-book ratio of 31.65 is markedly above the peer group, reflecting premium market pricing relative to book value. The enterprise value to EBITDA multiple of 28.80 also exceeds peer averages, indicating expectations of strong earnings growth. Return on equity at 1.07% is higher than most peers, suggesting efficient capital utilization. However, the price to cash flow ratio of 48.11 is substantially elevated compared to peers, which may imply stretched valuation relative to operating cash generation.
Financial Metrics Comparison with Peers
Financial Statements
Comprehensive financial data including income, balance sheet, and cash flow metrics
Income Statement
| fiscal_date | 2025-12-31 | 2024-12-31 | 2023-12-31 | 2022-12-31 | 2021-12-31 |
|---|---|---|---|---|---|
| Sales | 65.18B | 45.04B | 34.12B | 28.54B | 28.32B |
| Cost Of Goods | 11.05B | 8.42B | 7.08B | 6.63B | 7.31B |
| Gross Profit | 54.13B | 36.62B | 27.04B | 21.91B | 21.01B |
| Operating Expense Research And Development | 13.34B | 10.99B | 9.31B | 7.19B | 6.93B |
| Operating Expense Selling General And Administrative | 11.09B | 8.59B | 6.94B | 6.07B | 6.14B |
| Operating Income | 29.70B | 17.04B | 10.79B | 8.65B | 7.93B |
| Other Income Expense | -3.96B | -3.75B | -3.92B | -1.58B | -1.46B |
| Pretax Income | 25.73B | 12.68B | 6.55B | 6.81B | 6.16B |
| Income Tax | 5.09B | 2.09B | 1.31B | 561.60M | 573.80M |
| Net Income | 20.64B | 10.59B | 5.24B | 6.24B | 5.58B |
| Eps Basic | 23.07 | 11.80 | 5.83 | 6.57 | 5.85 |
| Eps Diluted | 22.95 | 11.71 | 5.80 | 6.57 | 5.85 |
| Basic Shares Outstanding | 894.80M | 897.54M | 899.38M | 950.18M | 953.65M |
| Diluted Shares Outstanding | 894.80M | 897.54M | 899.38M | 950.18M | 953.65M |
| Ebit | 29.70B | 13.46B | 7.04B | 7.14B | 6.50B |
| Ebitda | 35.09B | 19.42B | 12.46B | 10.22B | 9.56B |
| Net Income Continuous Operations | 20.64B | 10.59B | 5.24B | 6.24B | 5.58B |
| Non Operating Interest Income | N/A | 175.20M | 173.60M | 62.80M | 25.40M |
| Non Operating Interest Expense | N/A | 780.60M | 485.90M | 331.60M | 339.80M |
Data provided by Twelve Data
Balance Sheet
| fiscal_date | 2025-12-31 | 2024-12-31 | 2023-12-31 | 2022-12-31 | 2021-12-31 |
|---|---|---|---|---|---|
| Cash And Cash Equivalents | 7.27B | 3.27B | 2.82B | 2.07B | 3.82B |
| Accounts Receivable | 17.76B | 11.01B | 9.09B | 6.90B | 6.67B |
| Total Assets | 112.48B | 78.71B | 64.01B | 49.49B | 48.81B |
| Total Liabilities | 85.94B | 64.44B | 53.14B | 38.71B | 39.65B |
| Long Term Debt | 40.87B | 28.53B | 18.32B | 14.74B | 15.35B |
| Shareholders Equity | 26.54B | 14.27B | 10.86B | 10.78B | 9.15B |
Data provided by Twelve Data
Cash Flow Statement
| fiscal_date | 2025-12-31 | 2024-12-31 | 2023-12-31 | 2022-12-31 | 2021-12-31 |
|---|---|---|---|---|---|
| Operating Activities Net Income | 20.64B | 10.59B | 5.24B | 6.24B | 5.58B |
| Operating Activities Depreciation | 2.00B | 1.77B | 1.53B | 1.52B | 1.55B |
| Operating Activities Deferred Taxes | -1.71B | -2.68B | -2.34B | -2.19B | -802.30M |
| Operating Activities Stock Based Compensation | 626.00M | 645.60M | 628.50M | 371.10M | 342.80M |
| Operating Activities Other Non Cash Items | 3.53B | 4.06B | 4.10B | 1.37B | 1.70B |
| Operating Activities Accounts Receivable | -7.00B | -2.16B | -2.45B | -299.60M | -1.28B |
| Operating Activities Accounts Payable | 10.19B | 2.61B | 4.27B | 1.69B | -1.01B |
| Operating Activities Other Assets Liabilities | -4.67B | -2.51B | -4.88B | -1.39B | 1.28B |
| Operating Activities Operating Cash Flow | 23.60B | 12.32B | 6.10B | 7.32B | 7.35B |
| Investing Activities Capital Expenditures | -7.84B | -5.06B | -3.45B | -1.85B | -1.31B |
| Investing Activities Net Intangibles | -2.79B | -2.74B | -2.34B | -1.04B | -452.60M |
| Investing Activities Net Acquisitions | -661.00M | -947.70M | -1.04B | -327.20M | -747.40M |
| Investing Activities Purchase Of Investments | -645.00M | -775.80M | -829.00M | -707.60M | -1.01B |
| Investing Activities Sale Of Investments | 964.00M | 522.50M | 700.30M | 463.60M | 847.40M |
| Investing Activities Other Investing Activity | 1.00M | -298.20M | -191.90M | -302.20M | -191.70M |
| Investing Activities Investing Cash Flow | -8.18B | -6.56B | -4.81B | -2.73B | -2.41B |
| Financing Activities Long Term Debt Issuance | 13.17B | 11.42B | 3.96B | 0.00 | 2.41B |
| Financing Activities Long Term Debt Payments | -778.00M | -664.20M | 0.00 | -1.56B | -1.91B |
| Financing Activities Short Term Debt Issuance | -4.34B | -1.85B | 4.69B | 1.50B | -4.00M |
| Financing Activities Common Stock Repurchase | -4.11B | -2.50B | -750.00M | -1.50B | -1.25B |
| Financing Activities Common Dividends | -5.38B | -4.68B | -4.07B | -3.54B | -3.09B |
| Financing Activities Other Financing Charges | -772.00M | -490.60M | -335.00M | -308.90M | -295.90M |
| Financing Activities Financing Cash Flow | -2.21B | 1.23B | 3.50B | -5.41B | -4.13B |
| End Cash Position | 7.27B | 3.27B | 2.82B | 2.07B | 3.82B |
| Free Cash Flow | 5.96B | 414.30M | -3.15B | 4.60B | 5.39B |
Data provided by Twelve Data
Technical Analysis
Key Insights
- The current trend shows a strong upward price movement with the stock trading near its 52-week high, indicating bullish momentum.
- Key support levels are identified near $950 and $935, corresponding to the 50-day and 200-day moving averages respectively, while resistance is near the recent high of $1,149.
- The stock price is above the 10-day, 50-day, and 200-day moving averages, suggesting sustained positive momentum across short, medium, and long-term timeframes.
- Momentum indicators such as RSI are elevated but not yet in overbought territory; MACD shows a positive crossover, and stochastic oscillators confirm ongoing strength.
- Analysis across daily, weekly, and monthly charts consistently indicates an upward trend with no significant reversal signals currently evident.
- Potential market scenarios include continuation of the upward trend supported by strong fundamentals, with possible consolidation near resistance levels before further advances.
Trending News
1. Headline: What's Keeping Eli Lilly and Company in the Healthcare Spotlight?
Summary: Eli Lilly and Company remains shaped by GLP-1 demand, drug-development progress, manufacturing expansion, healthcare innovation, and operational execution.
Sentiment: neutral
2. Headline: Here’s Why Eli Lilly (LLY) is Among the 10 Best American Stocks to Buy and Hold for the Next Decade - Insider Monkey
Summary: Eli Lilly and Company (NYSE:LLY) discovers, develops, manufactures, and markets human pharmaceutical products internationally. While we acknowledge the risk and potential of LLY as an investment, our conviction lies in the belief that some AI stocks hold greater promise for delivering higher ...
Sentiment: positive
3. Headline: CVS Health Just Announced Fantastic News to Eli Lilly Stock Investors
Summary: The Motley Fool has positions in and recommends Eli Lilly. The Motley Fool recommends CVS Health and Novo Nordisk. The Motley Fool has a disclosure policy. CVS Health Just Announced Fantastic News to Eli Lilly Stock Investors was originally published by The Motley Fool ... COO The Cooper Companies, ...
Sentiment: neutral
Summary: The company also recently completed its acquisition of Eucalyptus, expanding its international footprint. However, competitors are also aggressively building their own healthcare ecosystems. On Thursday, WeightWatchers said its Med+ program is now available through Eli Lilly's LillyDirect platform, giving patients another route to obtain GLP-1 medications alongside behavioral, nutritional, and clinical support. On Stocktwits...
Sentiment: positive
5. Headline: 75% Upside For LLY Stock? | Trefis
Summary: Even without its metabolic business, management argues Eli Lilly (LLY) would be one of the fastest-growing pharmaceutical companies in the industry. This is not a single-product story. The company's immunology, oncology, and neuroscience medicines collectively grew by 160%, showing the depth ...
Sentiment: positive
Powered by Brave
Recent Updates
News Summary
As of 2026-06-03. Eli Lilly has strategically diversified its portfolio through acquisitions of three vaccine companies for up to $3.8 billion, targeting vaccines for shingles, bacterial infections, and viruses including Epstein-Barr. This move aims to mitigate future competition in the weight-loss drug market and broaden therapeutic reach. Additionally, the company reported one of the most impressive quarterly earnings in big pharma history, driven by robust growth across immunology, oncology, and neuroscience segments. The diversified portfolio contributed to a significant revenue increase, reinforcing Lilly's evolution beyond a single-product focus and highlighting its strong growth trajectory.
News Sentiment
The overall sentiment from recent updates is positive, driven by strategic acquisitions expanding the vaccine portfolio and strong quarterly earnings performance. The diversification beyond weight-loss drugs and robust growth in multiple therapeutic areas underpin confidence in the company’s long-term prospects. There are no significant negative developments reported in the recent updates, reflecting a constructive business outlook.
Source List
- https://www.indexbox.io/blog/eli-lilly-expands-beyond-weight-loss-with-vaccine-acquisitions/
- https://247wallst.com/investing/2026/06/03/where-will-eli-lilly-stock-be-in-2028/
Analytical Overview
Analysis Summary
Eli Lilly’s valuation metrics, including a trailing P/E of 39.23 and forward P/E of 24.85, are elevated relative to the industry average P/E of 39.23, reflecting market expectations of sustained growth. The company’s revenue growth rate of 55.5% and strong operating cash flow of $20.48 billion demonstrate a robust growth trajectory supported by diversified therapeutic segments. Financial health is solid with a current ratio of 1.50 and free cash flow of approximately $9.16 billion, although the debt-to-equity ratio of 139% indicates a relatively high leverage level that warrants attention. Sector-specific challenges include regulatory scrutiny and competitive pressures, while opportunities arise from expanding vaccine acquisitions and innovation in metabolic and oncology therapies. Market positioning and competitive advantages are underpinned by a strong institutional ownership base and a diversified product pipeline.
Overall Business and Market Assessment
Supporting Factors: Eli Lilly’s strong revenue growth, diversified portfolio expansion through vaccine acquisitions, and solid cash flow generation
Risk Factors: the company’s elevated debt levels and regulatory environment challenges
SWOT Analysis
Strengths
- Strong market leadership in multiple therapeutic areas including diabetes and oncology.
- Robust revenue growth of 55.5% and high profit margins indicating operational efficiency.
- Diversified product pipeline with recent strategic vaccine acquisitions.
- Solid cash flow generation supporting ongoing investments and shareholder returns.
Weaknesses
- High debt-to-equity ratio of 139% indicating elevated leverage.
- Price-to-book ratio of 31.65 suggests potentially stretched valuation.
- Minimal insider ownership which may limit direct executive alignment with shareholders.
- Dependence on competitive pharmaceutical markets with regulatory risks.
Opportunities
- Expansion into vaccine markets with $3.8 billion acquisitions targeting infectious diseases.
- Growing demand for GLP-1 therapies and metabolic treatments.
- Potential for pipeline advancements in immunology, oncology, and neuroscience.
- Strategic partnerships enhancing global access in emerging markets.
Threats
- Regulatory challenges and pricing pressures in global pharmaceutical markets.
- Intense competition from other large pharmaceutical companies and generics.
- Macroeconomic uncertainties affecting healthcare spending.
- Recent reduction in planned investment in Germany may impact growth plans.
Company Description
Eli Lilly and Company is a leading pharmaceutical company engaged in the discovery, development, manufacture, and sale of human pharmaceutical products. It focuses on innovative medicines addressing critical health needs in areas such as diabetes, oncology, immunology, neuroscience, obesity, cardiovascular diseases, cancer, and other therapeutic categories including bone muscle joint disorders, endocrine conditions, dermatology, autoimmune diseases, sleep apnea, migraine, and Alzheimer's disease. The company offers treatments like insulins, GLP-1 therapies for diabetes and obesity, oncology drugs, immunologic agents, and neuroscience products. Eli Lilly and Company supports access initiatives through partnerships for technology transfer and API supply to manufacturers in low- and middle-income countries, enhancing availability of insulins and other therapies in regions like Africa and Bangladesh. It maintains a robust research and development pipeline targeting non-communicable diseases, with late-stage projects in diabetes, cardiovascular, and oncology areas. Founded in 1876 and headquartered in Indianapolis, Indiana, Eli Lilly and Company plays a significant role in the global health technology sector by delivering therapies that improve patient outcomes across diverse medical fields.