
EID Parry India Ltd (EIDPARRY)
Stock Analysis Report
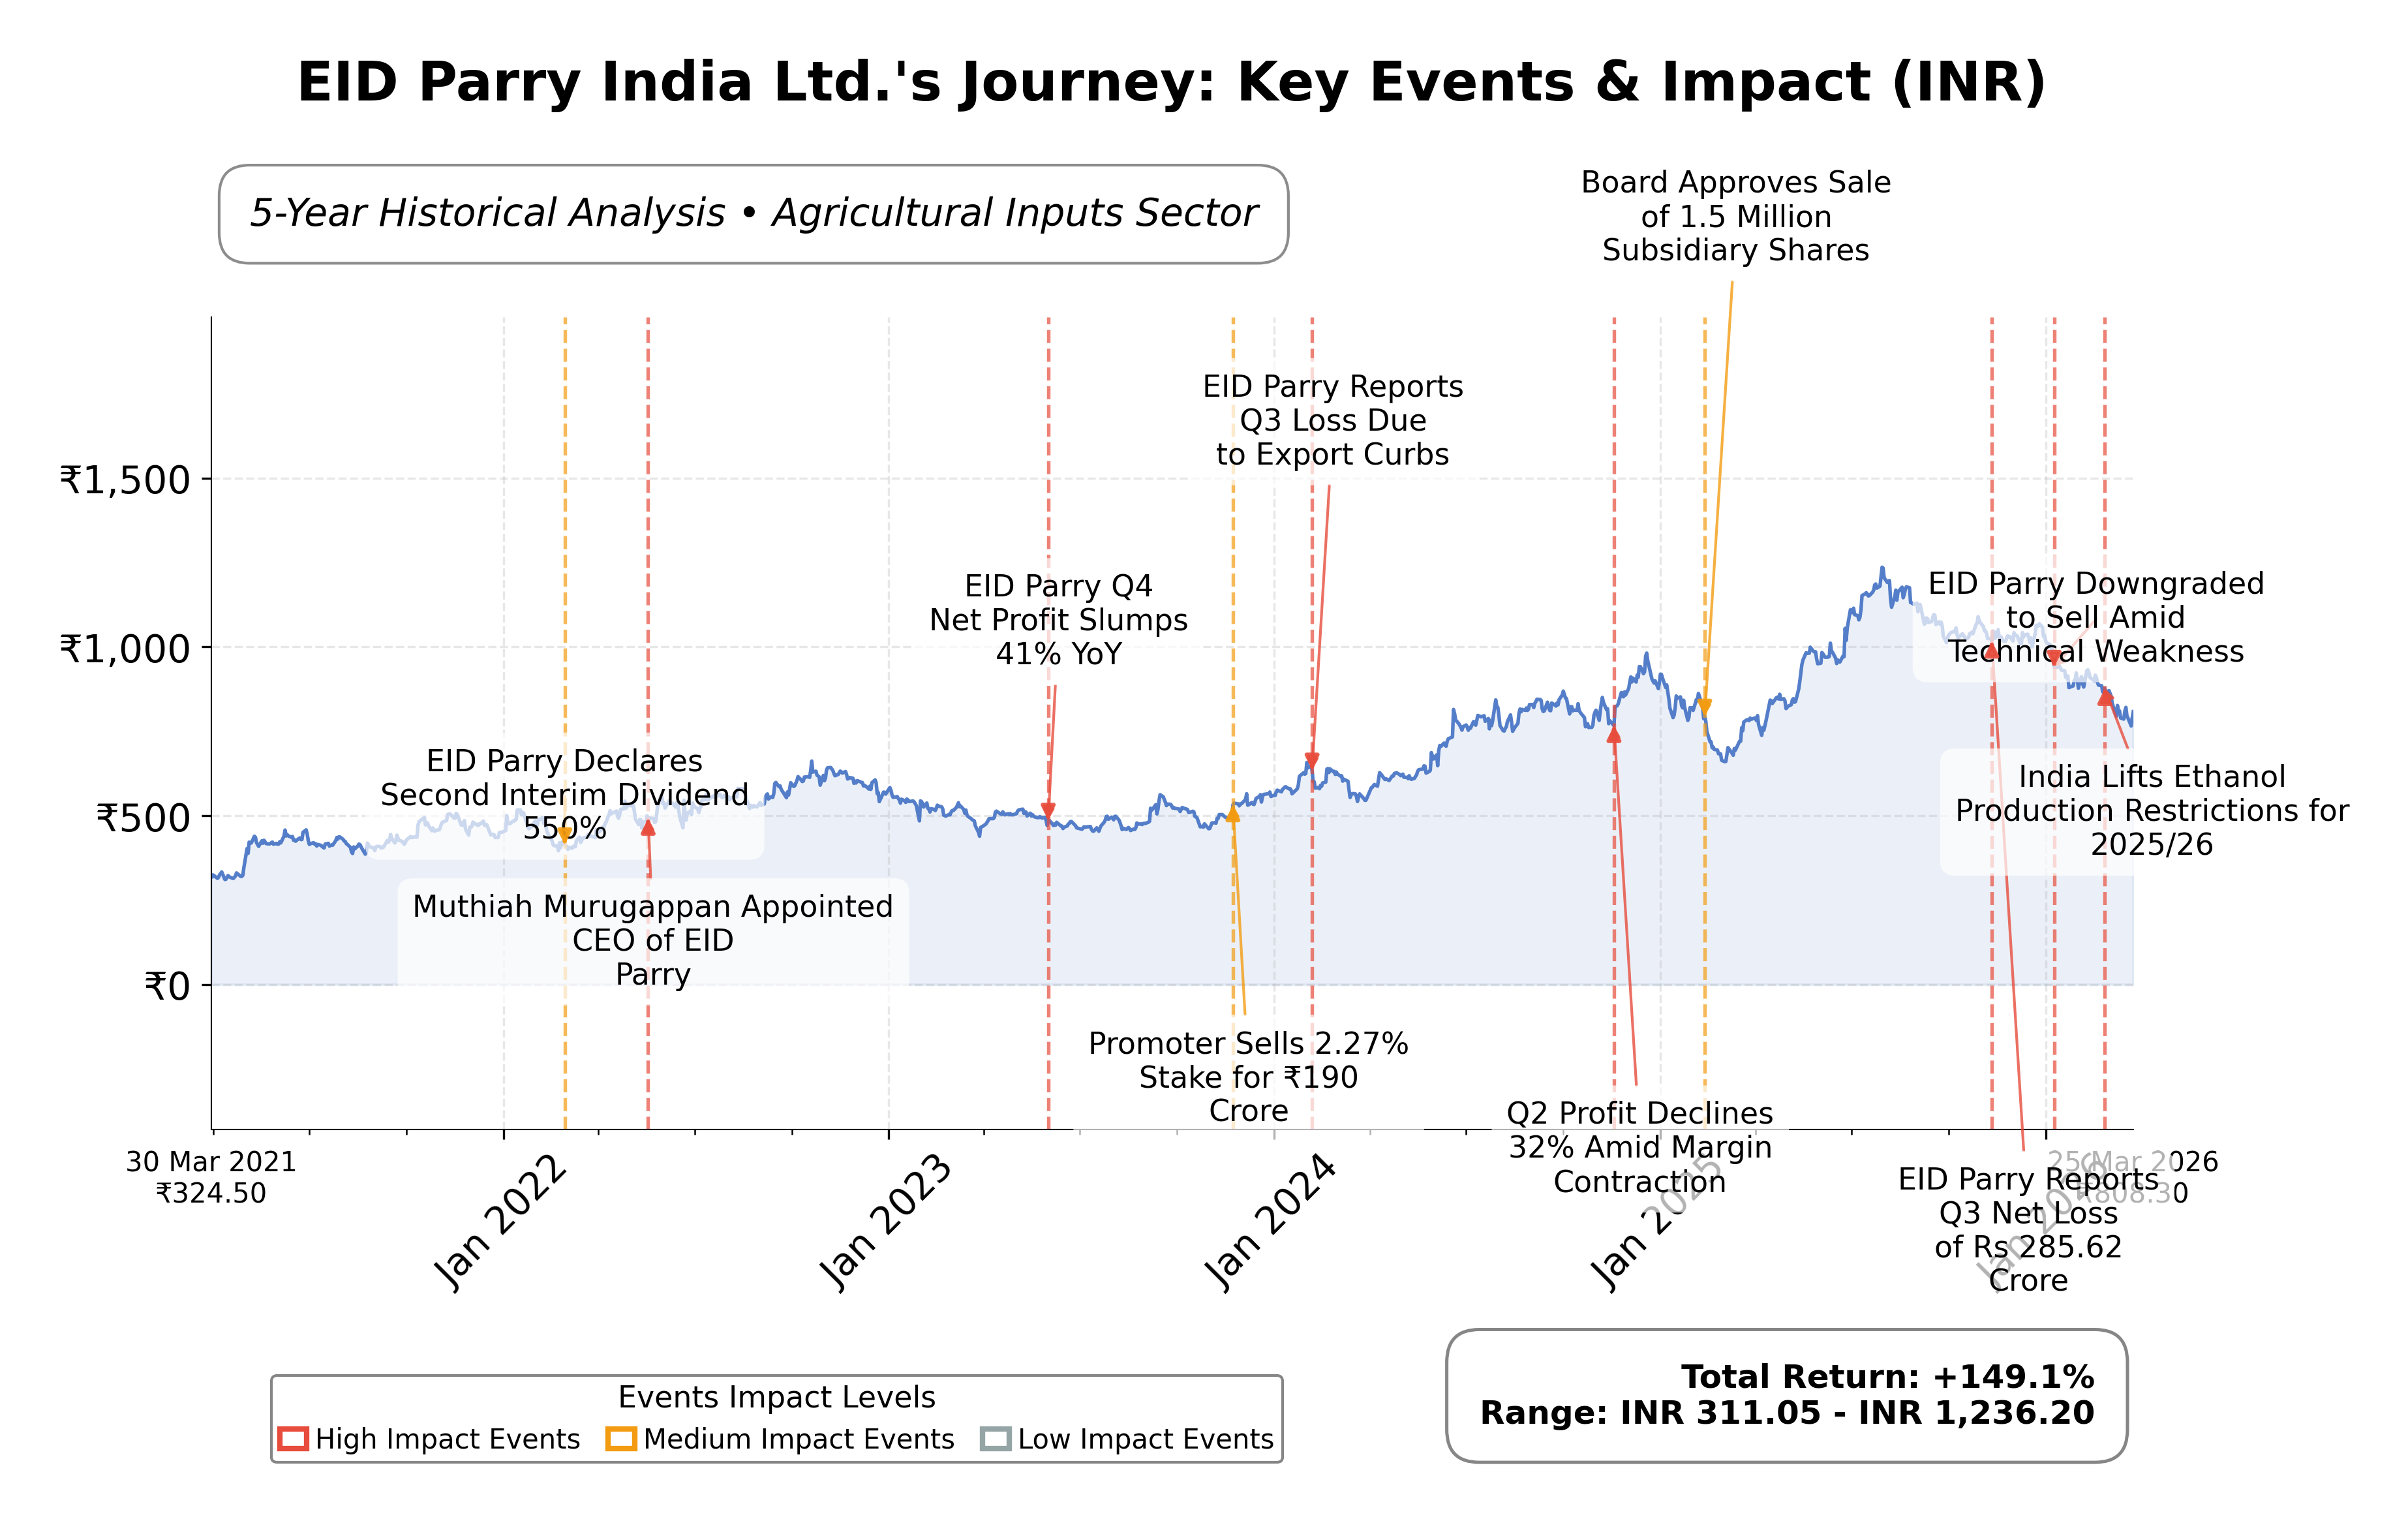
Stock Journey
Key Positives and Key Risks
Pros
- Forward P/E ratio of 9.99 indicates relatively attractive valuation compared to industry average of 12.3.
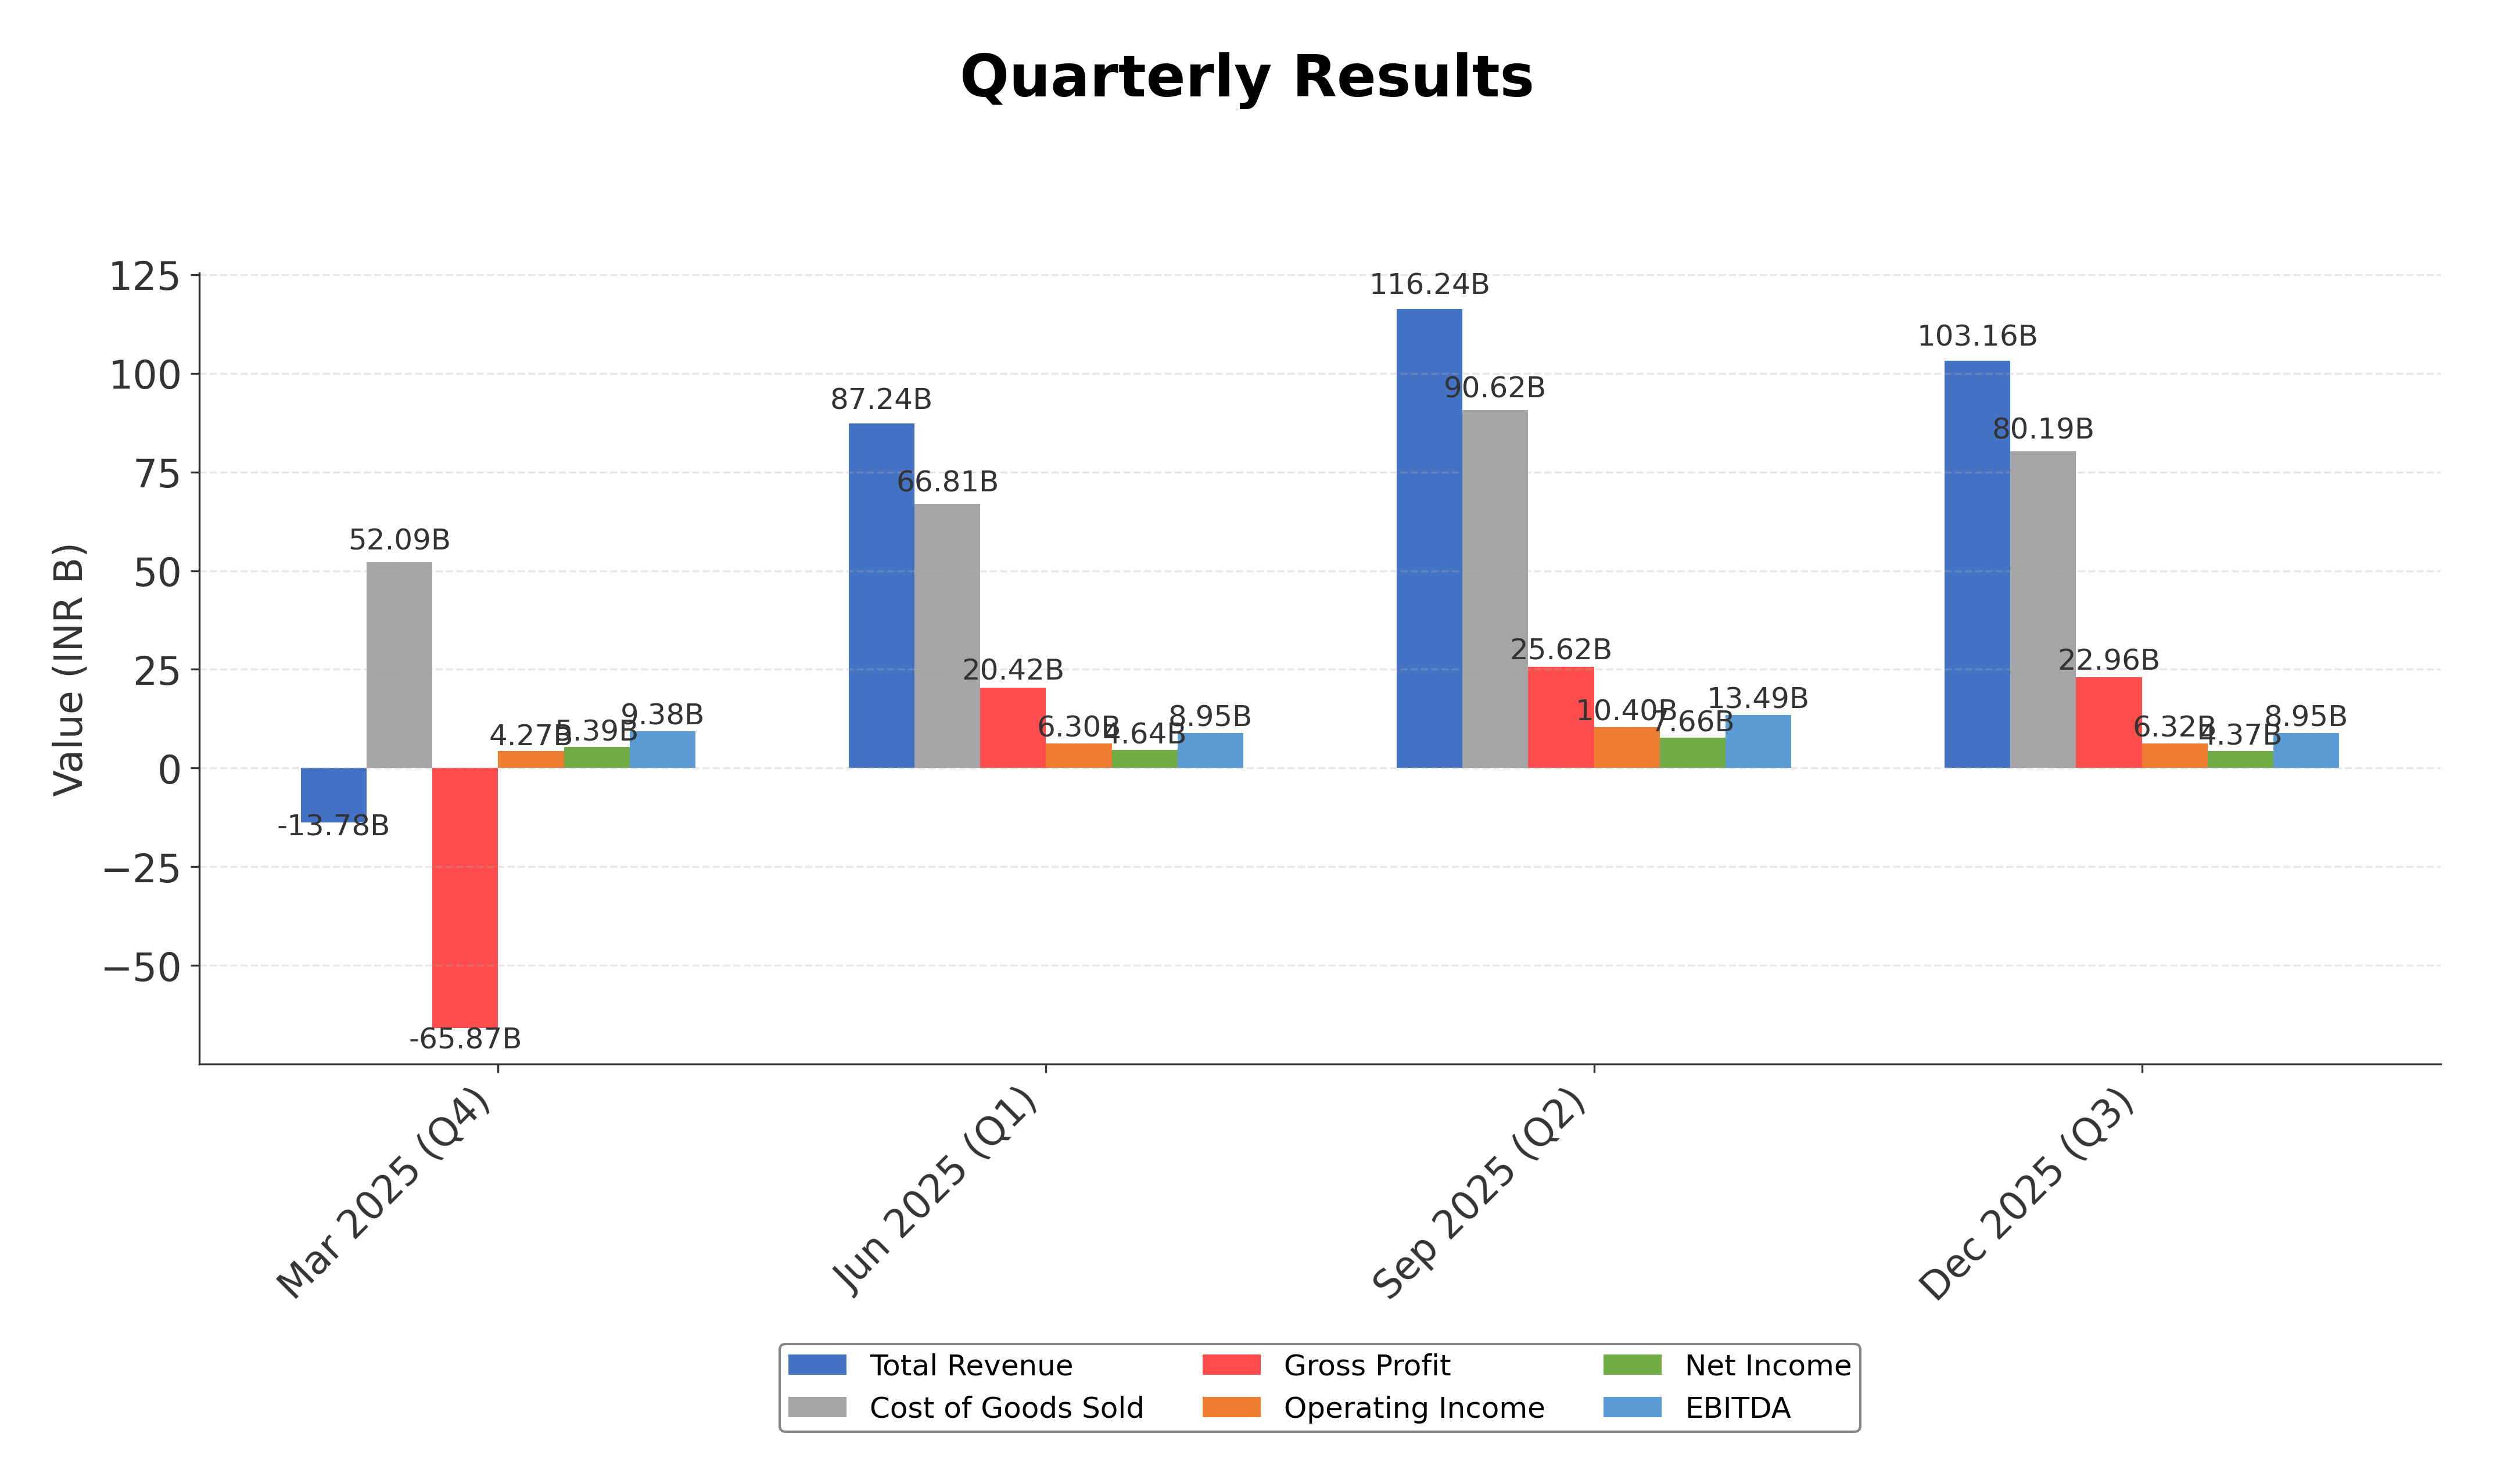
- Quarterly revenue growth of 18.3% and EBITDA growth signal operational momentum.
- Strong cash flow generation with operating cash flow of ₹21.65 billion and free cash flow of ₹8.78 billion supports financial stability.
Cons
- Profit margin of 3.17% is modest, reflecting limited earnings efficiency.
- Stock price trading significantly below 52-week high (₹1246.8 vs ₹789.8) suggests potential price volatility.
- Exposure to commodity price fluctuations and regulatory risks inherent in the agricultural inputs sector.
Disclosure: This information is for general awareness and does not constitute investment advice
Report Summary
EID Parry India Ltd., part of the Murugappa Group, is a leading agro-industrial company in India specializing primarily in sugar production. Established in 1788, the company operates integrated sugar complexes that include sugar manufacturing, distillery operations, and power co-generation from bagasse. It also diversifies into bio-products such as nutraceuticals and biopesticides, positioning itself as a key player in the agricultural inputs sector within the Indian market.
Financially, EID Parry demonstrates solid valuation metrics with a trailing P/E of 12.3 and a forward P/E of approximately 10, below the industry average P/E of 12.3, indicating relatively attractive valuation. The companyâs market capitalization stands at around â¹140.45 billion with an enterprise value of â¹177.86 billion. Revenue growth is robust at 18.3% quarterly, supported by a profit margin of 3.17% and operating margin of 6.12%. The company maintains a healthy balance sheet with a current ratio of 1.4 and a manageable debt-to-equity ratio of 18.4%. Cash flow metrics show operating cash flow of â¹21.65 billion and free cash flow of â¹8.78 billion, underscoring operational efficiency.
From a technical and strategic standpoint, the stock price currently trades near â¹790, below its 52-week high of â¹1246.8, suggesting upside potential. The company recently renewed the term of an independent director, reflecting leadership stability. Strengths include integrated operations and diversification into bio-products, while risks involve commodity price volatility and regulatory factors in the agricultural sector. Institutional ownership is moderate at 22%, with insider holdings below 1%, indicating a balanced ownership structure.
In comparison to regional peers within the Indian agricultural inputs sector, EID Parryâs valuation metrics such as P/E and EV/EBITDA ratios are more conservative than companies like Bayer CropScience Ltd. and PI Industries Ltd., which exhibit higher multiples. Its return on equity of approximately 6.8% is modest but compares favorably to some peers like Fertilisers & Chemicals Travancore Ltd. The companyâs market capitalization is mid-sized relative to larger peers such as UPL Ltd. and Bayer CropScience Ltd., positioning it as a significant but not dominant player in the sector.
EID Parry navigates a complex agro-industrial landscape marked by evolving market dynamics and regulatory environments. Recent achievements include steady revenue growth and leadership continuity, while challenges persist in managing commodity cycles and competitive pressures. The company stands at a pivotal juncture where strategic execution and market conditions will determine its trajectory. Given the current financial and operational profile, a balanced approach toward the stock may be appropriate for those monitoring its ongoing developments and sector trends.
Company and Industry Overview
Company Basics
Price Performance
Company Size
Shareholding Pattern
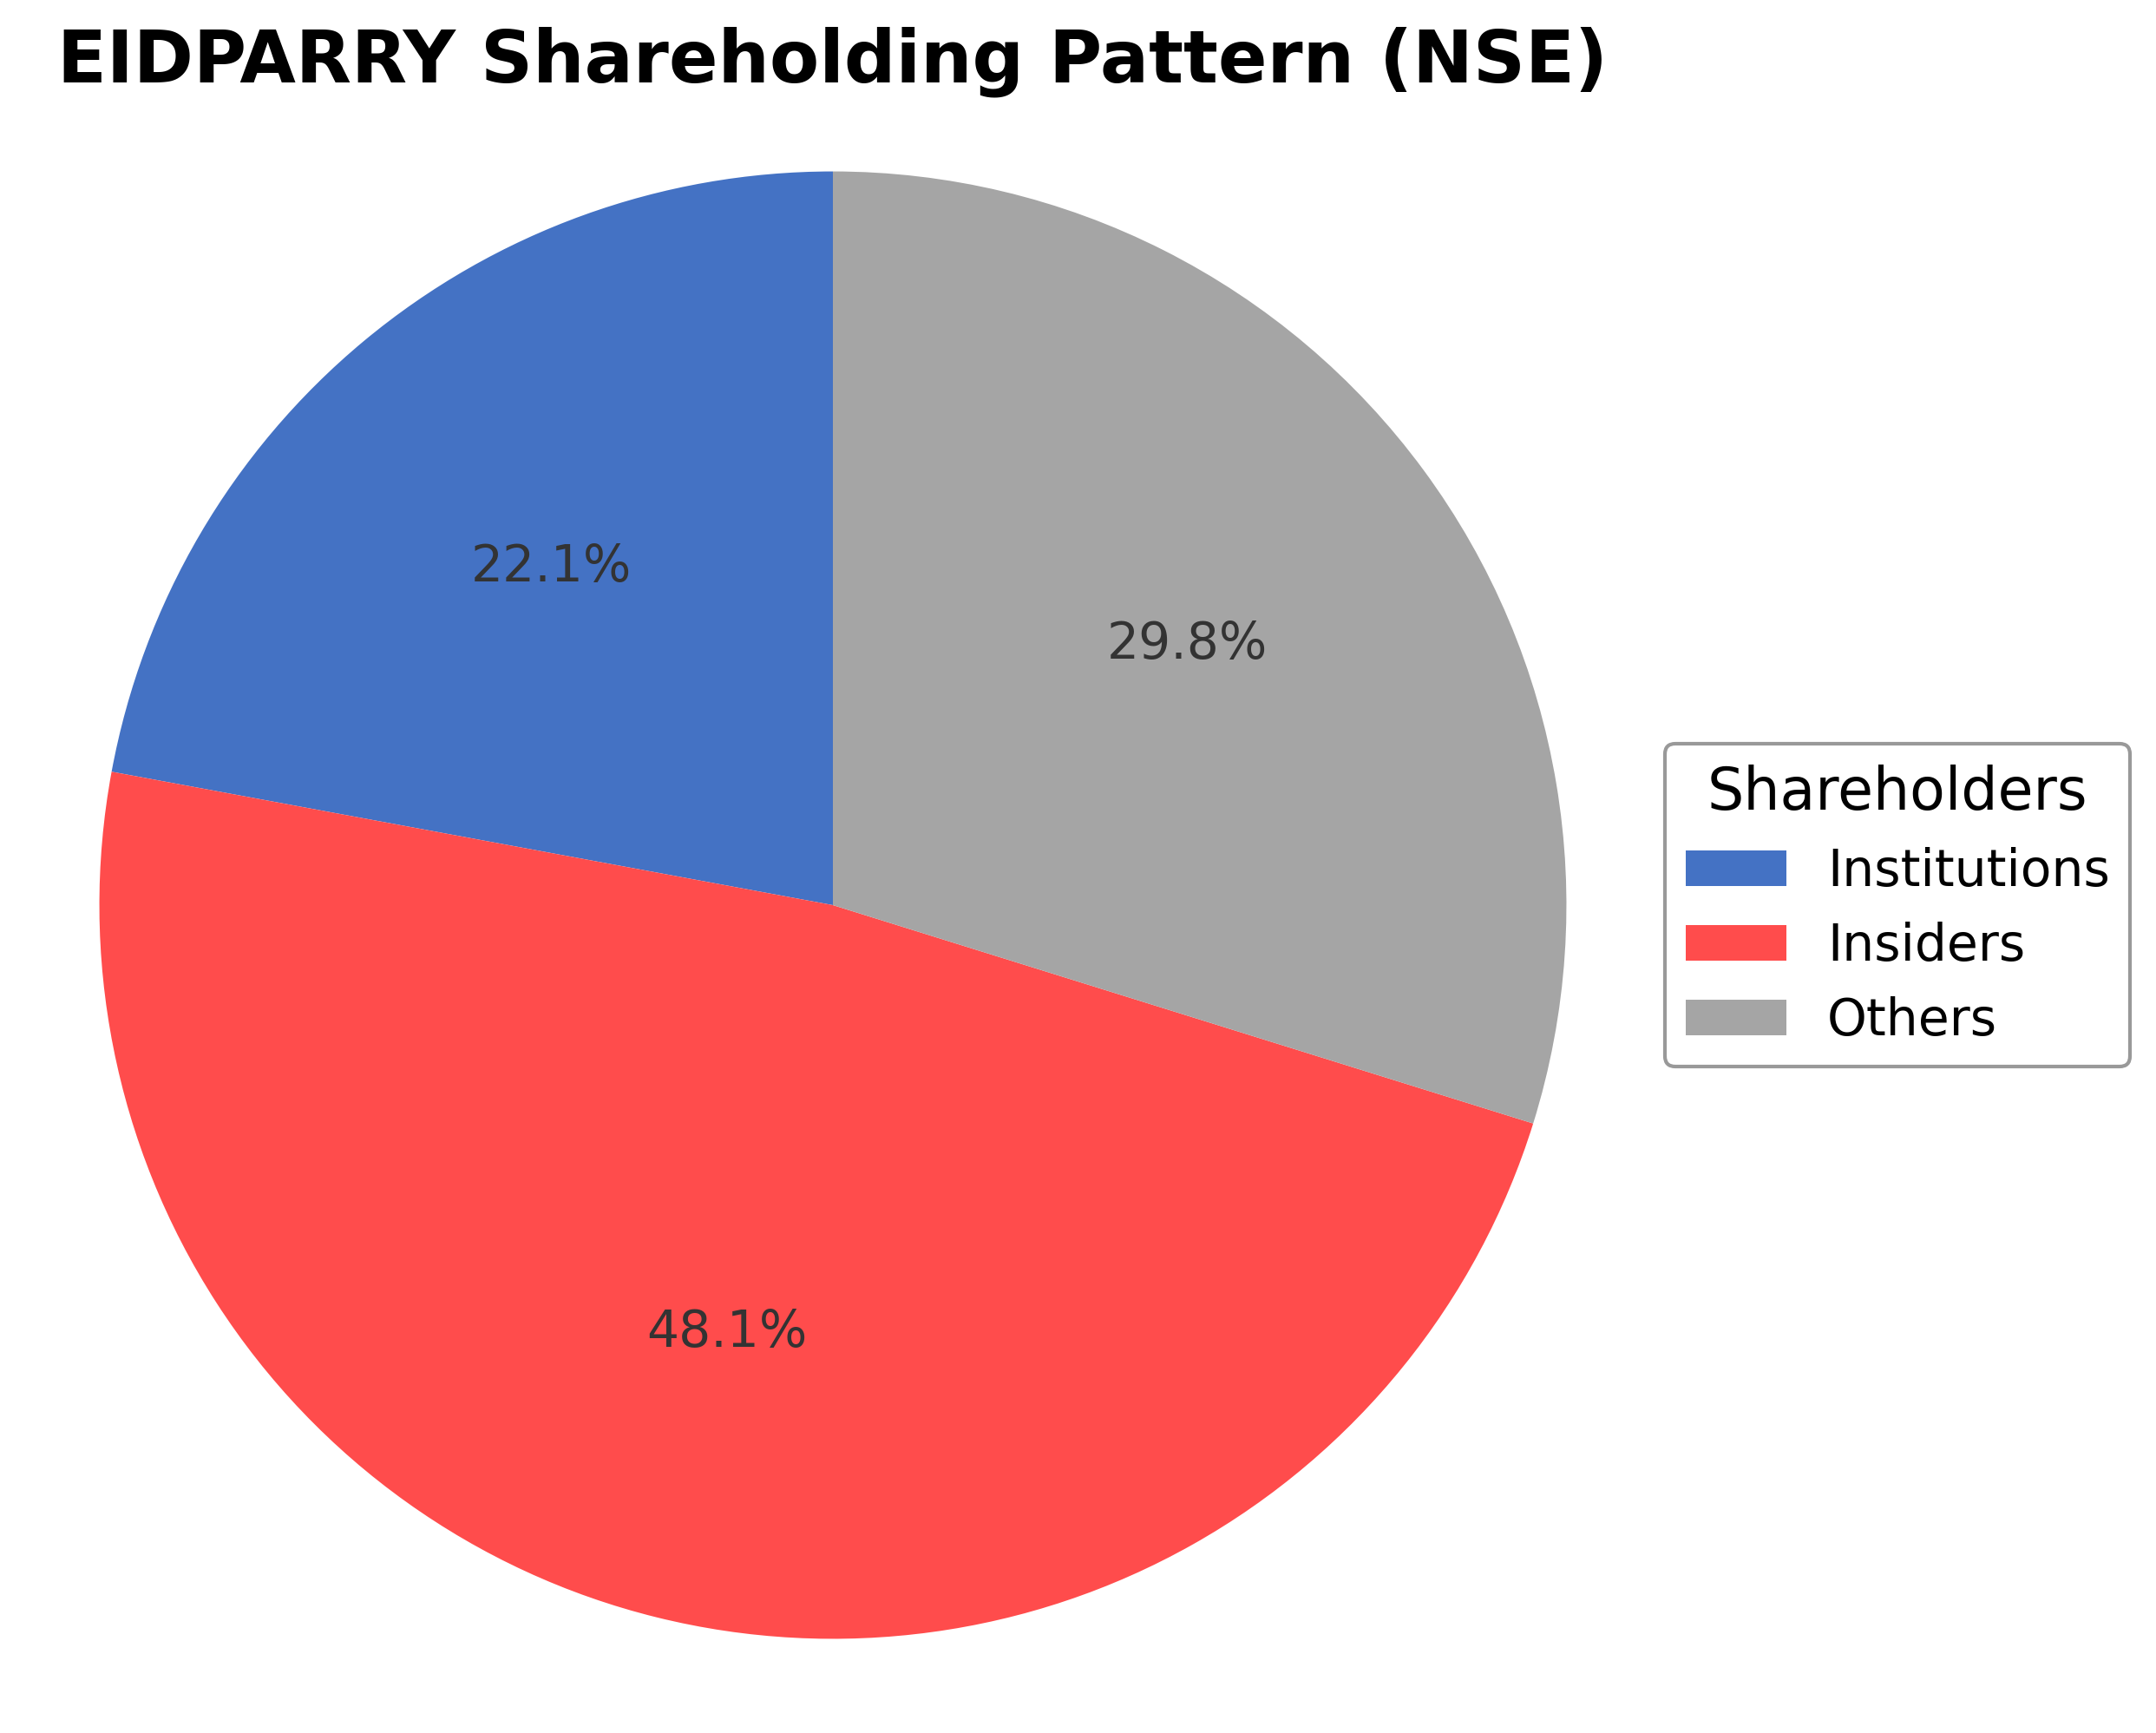
EID Parry India Ltd. exhibits a shareholding pattern with insiders, including executives and board members, holding approximately 48.10% of shares, institutional investors such as mutual funds and asset managers owning 22.09%, and the remaining 29.81% held by public shareholders including retail investors and employee stock plans. Over the past 12 to 24 months, institutional ownership has shown moderate accumulation, reflecting steady interest from major funds. Promoter holdings remain substantial, supporting governance stability. These patterns suggest a balanced market sentiment with significant insider confidence and institutional participation, which may influence the company's strategic direction and corporate actions within the agricultural inputs industry.
Sector and Industry Analysis
EID Parry India Ltd operates primarily within the Indian agrochemicals and sugar manufacturing sectors, which fall under the broader Agriculture and Agrochemical sector. The Indian agriculture sector is a critical component of the national economy, contributing approximately 17-18% to GDP and employing nearly half of the workforce. The agrochemical market in India is sizable and growing, driven by increasing demand for crop protection products, fertilizers, and bio-stimulants to enhance agricultural productivity. The sugar industry, meanwhile, is one of the largest globally, with India being the second-largest producer and consumer of sugar. Key players in these sectors include domestic giants like UPL Ltd, Coromandel International, and Balrampur Chini Mills, alongside EID Parry, which has a diversified product portfolio spanning sugar, bio-products, and nutraceuticals.
Industry trends are shaped by technological advancements and evolving consumer preferences. Precision agriculture and digital farming technologies are gaining traction, enabling optimized input usage and improved yields. There is a growing emphasis on sustainable and organic farming practices, which is increasing demand for bio-based agrochemicals and natural fertilizers. Additionally, the sugar industry is witnessing diversification into ethanol production and co-generation of power, driven by government incentives and environmental considerations. Consumer behavior is also shifting towards healthier and organic food products, which is influencing product innovation in agrochemicals and sugar derivatives. Emerging opportunities lie in the development of bio-pesticides, specialty enzymes, and value-added sugar products, supported by increasing R&D investments.
The regulatory landscape for the agriculture and agrochemical sectors in India is complex and evolving. The sector is governed by multiple regulations including the Fertilizer Control Order, Insecticides Act, and Sugar Control Order, which regulate production, pricing, and distribution. Recent government policies aim to promote sustainable agriculture through subsidies for bio-fertilizers and organic inputs, as well as mandates for ethanol blending in fuel to reduce carbon emissions. Compliance requirements are stringent, particularly concerning environmental norms, pesticide residue limits, and labor laws. Trade policies and import-export regulations also impact the sector, with periodic adjustments in tariffs and export quotas influencing market dynamics. Regulatory uncertainty and policy shifts remain key risk factors for industry participants.
Competitive dynamics in the agrochemical and sugar industries are characterized by moderate to high fragmentation, with a mix of large integrated players and numerous regional companies. Barriers to entry include high capital expenditure for manufacturing facilities, stringent regulatory approvals, and the need for strong distribution networks. EID Parry’s competitive positioning benefits from its diversified product lines, established brand equity, and backward integration in sugar production and bio-products. Innovation and cost efficiencies are critical competitive levers, as companies strive to balance input costs with pricing pressures from farmers. Strategic partnerships, mergers, and acquisitions are common to enhance product portfolios and geographic reach. Overall, the market structure encourages consolidation but also allows niche players to thrive by focusing on specialty products and sustainable solutions.
Note: Analysis synthesized from industry research, market reports, and regulatory filings. Information is subject to change based on market conditions.
Illustrative Scenario Analysis
DCF Assumptions:
Method: Two-Stage EPS-Priority Model
Financials
Peer Analysis
| Company Name | Market Cap | P/E Ratio | P/B Ratio | EV/EBITDA | Price to CFO |
|---|---|---|---|---|---|
| EID Parry India Ltd. | ₹140.45B | 12.30 | 1.64 | 5.54 | 6.49 |
| Fertilisers & Chemicals Travancore Ltd. | ₹512.13B | 1683.94 | 37.24 | 438.86 | 490.43 |
| Bayer CropScience Ltd. | ₹212.14B | 30.17 | 6.48 | 24.74 | -93.17 |
| PI Industries Ltd. | ₹441.38B | 30.49 | 4.09 | 22.72 | 27.97 |
| Gujarat State Fertilizers & Chemicals Ltd. | ₹61.35B | 8.93 | 0.50 | 6.35 | 14.74 |
| UPL Ltd. | ₹528.77B | 29.84 | 1.61 | 11.54 | 7.45 |
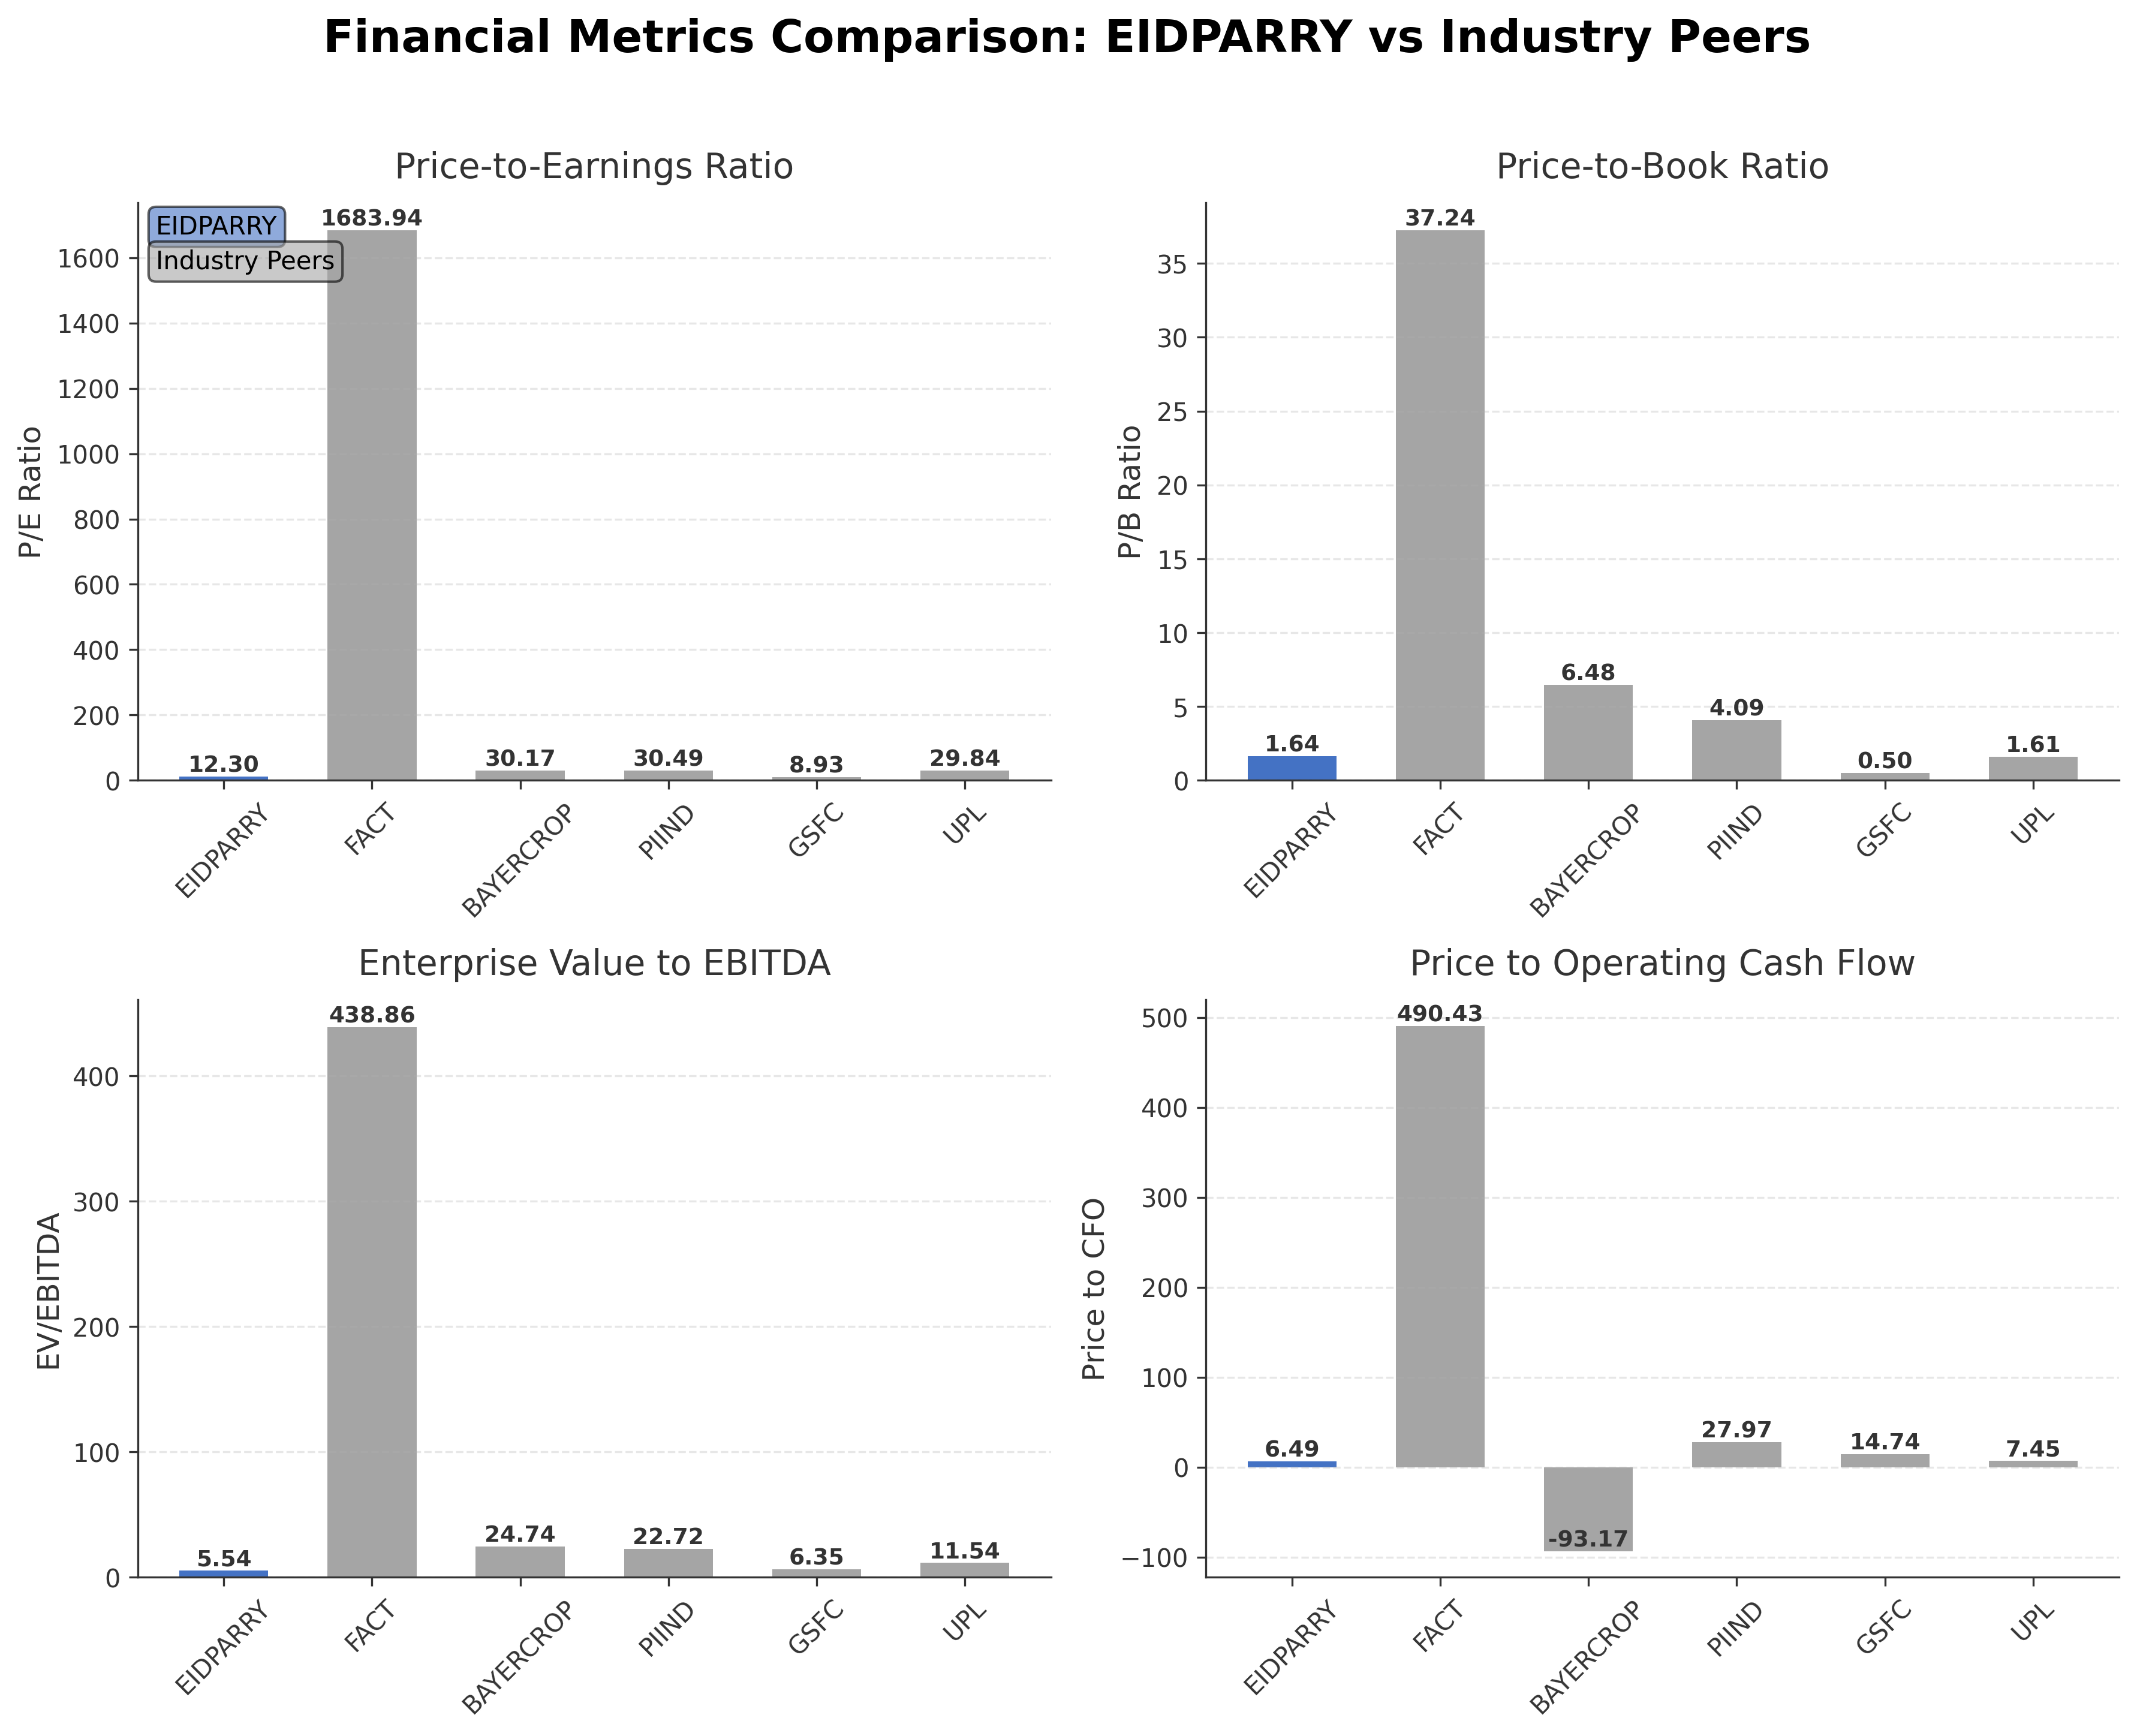
Comparison Analysis: EID Parry India Ltd. presents a more conservative valuation profile compared to its Indian agricultural inputs peers, with a P/E ratio of 12.3 and EV/EBITDA of 5.54, both lower than companies like Bayer CropScience Ltd. and PI Industries Ltd., which have P/E ratios around 30 and higher EV/EBITDA multiples. The company’s price-to-book ratio of 1.64 is moderate, reflecting a balanced market valuation. Return on equity at approximately 6.8% is higher than several peers, indicating relatively efficient capital utilization. Market capitalization places EID Parry in the mid-range among its peers, suggesting a significant but not dominant market presence.
Financial Metrics Comparison with Peers
Financial Statements
Comprehensive financial data including income, balance sheet, and cash flow metrics
Income Statement
| fiscal_date | 2025-03-31 | 2024-03-31 | 2023-03-31 | 2022-03-31 | 2021-03-31 |
|---|---|---|---|---|---|
| Sales | 234.19B | 211.95B | 206.81B | 166.53B | 151.03B |
| Cost Of Goods | 245.12B | 228.92B | 282.06B | 178.38B | 137.80B |
| Gross Profit | -10.93B | -16.98B | -75.25B | -11.85B | 13.23B |
| Operating Expense Research And Development | 33.00M | N/A | N/A | N/A | N/A |
| Operating Expense Selling General And Administrative | 17.20B | 14.74B | 15.74B | 13.53B | 16.09B |
| Operating Expense Other Operating Expenses | 15.85B | 14.35B | 13.60B | 10.84B | 2.39B |
| Operating Income | 22.13B | 22.61B | 28.21B | 21.20B | 18.82B |
| Non Operating Interest Income | 2.43B | 1.98B | 1.64B | 1.06B | 539.40M |
| Non Operating Interest Expense | 3.37B | 2.63B | 2.75B | 1.33B | 2.17B |
| Pretax Income | 24.55B | 21.75B | 25.64B | 21.29B | 15.39B |
| Income Tax | 6.82B | 5.58B | 7.37B | 5.55B | 5.39B |
| Net Income | 17.73B | 16.18B | 18.28B | 15.74B | 10.00B |
| Eps Basic | 49.47 | 50.68 | 53.39 | 51.17 | 25.27 |
| Eps Diluted | 49.33 | 50.61 | 53.25 | 51.04 | 25.15 |
| Basic Shares Outstanding | 177.58M | 177.52M | 177.47M | 177.23M | 177.02M |
| Diluted Shares Outstanding | 177.58M | 177.52M | 177.47M | 177.23M | 177.02M |
| Ebit | 27.92B | 24.39B | 28.39B | 22.62B | 17.56B |
| Ebitda | 28.32B | 28.08B | 31.57B | 25.46B | 23.04B |
| Net Income Continuous Operations | 24.55B | 21.75B | 25.64B | 21.29B | 15.39B |
| Minority Interests | -8.94B | -7.18B | -8.80B | -6.67B | -5.52B |
| Preferred Stock Dividends | 0.00 | 0.00 | 0.00 | 0.00 | 0.00 |
Data provided by Twelve Data
Balance Sheet
| fiscal_date | 2025-03-31 | 2024-03-31 | 2023-03-31 | 2022-03-31 | 2021-03-31 |
|---|---|---|---|---|---|
| Cash And Cash Equivalents | 4.04B | 11.74B | 14.40B | 7.78B | 7.31B |
| Accounts Receivable | 17.57B | 18.35B | 8.12B | 5.73B | 8.61B |
| Total Assets | 243.81B | 214.93B | 187.78B | 159.43B | 132.64B |
| Total Liabilities | 114.50B | 102.81B | 92.39B | 78.43B | 64.35B |
| Long Term Debt | 7.68B | 6.43B | 5.07B | 4.81B | 4.79B |
| Shareholders Equity | 129.32B | 112.12B | 95.39B | 81.00B | 68.29B |
Data provided by Twelve Data
Cash Flow Statement
| fiscal_date | 2025-03-31 | 2024-03-31 | 2023-03-31 | 2022-03-31 | 2021-03-31 |
|---|---|---|---|---|---|
| Operating Activities Net Income | 24.55B | 21.75B | 25.64B | 21.29B | 15.39B |
| Operating Activities Stock Based Compensation | 111.50M | 107.00M | 110.80M | N/A | N/A |
| Operating Activities Other Non Cash Items | -2.68B | 532.40M | 1.21B | -173.60M | 1.36B |
| Operating Activities Accounts Receivable | -1.97B | -162.50M | -23.27B | 7.04B | 29.69B |
| Operating Activities Other Assets Liabilities | 1.64B | -11.58B | -6.75B | -15.33B | 4.31B |
| Operating Activities Operating Cash Flow | 21.65B | 10.65B | -3.06B | 12.83B | 50.74B |
| Investing Activities Capital Expenditures | -10.46B | -9.75B | -8.39B | -4.34B | -3.16B |
| Investing Activities Purchase Of Investments | -1.83B | -65.49B | -554.10M | -10.09B | N/A |
| Investing Activities Sale Of Investments | 186.10M | 58.63B | 10.30B | 292.10M | N/A |
| Investing Activities Other Investing Activity | -14.74B | 67.30M | 65.10M | 94.20M | 120.00M |
| Investing Activities Investing Cash Flow | -26.84B | -18.74B | -143.40M | -14.24B | 5.20B |
| Financing Activities Long Term Debt Issuance | 853.30M | 1.92B | 743.30M | 224.30M | 640.30M |
| Financing Activities Long Term Debt Payments | -667.70M | -555.30M | -235.70M | -2.26B | -5.10B |
| Financing Activities Short Term Debt Issuance | 6.28B | -667.80M | 3.09B | 2.23B | -26.55B |
| Financing Activities Common Stock Issuance | 287.80M | 166.00M | 233.20M | 121.90M | 173.60M |
| Financing Activities Common Stock Repurchase | -154.80M | -249.40M | 0.00 | N/A | N/A |
| Financing Activities Common Dividends | -1.54B | -2.28B | -2.46B | -3.49B | -2.23B |
| Financing Activities Other Financing Charges | -236.50M | N/A | N/A | N/A | N/A |
| Financing Activities Financing Cash Flow | 4.82B | -1.67B | 1.36B | -3.17B | -33.07B |
| End Cash Position | 4.04B | 11.74B | 14.40B | 7.78B | 7.31B |
| Free Cash Flow | 8.90B | 9.98B | -5.01B | 18.29B | 44.37B |
| Investing Activities Net Acquisitions | N/A | -2.20B | -1.57B | -190.00M | 8.23B |
Data provided by Twelve Data
Technical Analysis
Key Insights
- The current trend shows the stock trading below its 200-day moving average (₹1024.94) but above the 50-day moving average (₹881.13), indicating mixed momentum with potential consolidation.
- Key support levels are identified near ₹700, close to the 52-week low, while resistance is observed around ₹880 and the 200-day moving average near ₹1025.
- The stock price is positioned between the 10-day and 50-day moving averages, suggesting short-term price fluctuations within a broader sideways range.
- Momentum indicators show RSI in a neutral zone, MACD near the signal line, and stochastic oscillators reflecting moderate momentum without clear overbought or oversold conditions.
- Multi-timeframe analysis indicates daily and weekly charts showing consolidation, while monthly charts suggest a longer-term uptrend remains intact.
- Potential market scenarios include a breakout above the 200-day moving average signaling renewed bullish momentum or a decline toward support levels if selling pressure intensifies.
Trending News
1. Headline: Eid in India: Why Visibility of Identity Is No Longer Neutral
Summary: Eid celebrations in India highlight how religious identity, visibility, and public space intersect, shaping belonging, scrutiny, and continuity in contemporary society.
Sentiment: neutral
2. Headline: AIMPLB member Maulana Khalid Rasheed extends Eid-al-Fitr greetings
Summary: Speaking to ANI, Maulana Rasheed Mahali said, "The festival of Eid is being celebrated, and here in our city of Lucknow, it is marked with great enthusiasm and joy. At the historic Eidgah in Lucknow, worshippers began arriving from early morning, and the weather is pleasant.
Sentiment: neutral
3. Headline: EID Parry Issues Postal Ballot Notice for Independent Director Re-appointment
Summary: Currently, he serves as a member of the Stakeholders Relationship Committee and Corporate Social Responsibility Committee of EID Parry (India) Limited. He also holds directorships in KSL Media Limited, Lotus Chocolate Company Ltd., and Reliance Consumer Products Limited (formerly known as Tira ...
Sentiment: neutral
Summary: Middle East News: Discover the best deals for Eid Al Fitr 2026 in the UAE with discounts up to 90% across major brands, free attractions, and dining offers. Don't miss out on the ultimate shopping experience this festive season!
Sentiment: neutral
Summary: Middle East News: Eid Al Fitr 2026 will begin on March 20 across the UAE, Saudi Arabia, Kuwait, Qatar, and Bahrain, marking the end of Ramadan. Official announcements confirm the completion of Ramadan on March 19, leading to festivities across the region.
Sentiment: neutral
Summary: Eid-ul-Fitr 2026 moon sighting: Muslims worldwide await the Shawwal crescent to mark Eid, with dates varying by country based on moon sightings.
Sentiment: neutral
Summary: Eid ul-Fitr 2026: As Eid al-Fitr approaches, all eyes are on the moon sighting to decide if the festival will be celebrated on March 20 or March 21.
Sentiment: neutral
8. Headline: E.I.D. Parry Renews Independent Director T Krishnakumar's 5-Year Term | Whalesbook
Summary: E.I.D. Parry (India) Limited's board has approved a second five-year term for Independent Director T Krishnakumar, ensuring leadership continuity. Shareholder approval via postal ballot is pending.
Sentiment: positive
9. Headline: EID Parry (India) Ltd is Rated Sell by MarketsMOJO
Summary: EID Parry (India) Ltd is rated 'Sell' by MarketsMOJO, with this rating last updated on 08 January 2026. However, the analysis and financial metrics discussed below reflect the stock's current position as of 06 March 2026, providing investors with an up-to-date perspective on the company's ...
Sentiment: neutral
Summary: EID Parry Share Price: Find the latest news on EID Parry Stock Price. Get all the information on EID Parry with historic price charts for NSE / BSE. Experts & Broker view also get the EID Parry Ltd. buy/sell tips detailed news, announcements, Forecasts, Analysts, Valuation, Earning forecasts, ...
Sentiment: neutral
Powered by Brave
Recent Updates
News Summary
Recent news coverage of EID Parry India Ltd. highlights a mixture of operational updates, market sentiment, and leadership continuity. The company’s Q2 2026 earnings call emphasized strong EBITDA growth, reflecting improving profitability. Leadership stability is reinforced by the renewal of an independent director’s term, supporting governance consistency. Market interest has increased as evidenced by a significant surge in trading volumes. However, some external analyses rate the stock as 'Sell,' indicating mixed market perceptions. Overall, the news cycle centers on financial performance, governance, and market activity, providing a multifaceted view of the company’s current standing.
News Sentiment
Sentiment across recent news is predominantly neutral with occasional positive tones related to earnings growth and leadership renewals. The balanced sentiment reflects cautious optimism tempered by external sell ratings and market volatility. This mixed sentiment may influence market dynamics and stakeholder perspectives in the near term.
Analytical Overview
Analysis Summary
Valuation Metrics: EID Parry’s P/E ratio of 12.3 is slightly below the industry average of 12.3, while the forward P/E of approximately 10 suggests potential valuation support relative to peers. The PEG ratio of 0.65 indicates favorable valuation when considering growth prospects.
Growth Trajectory: The company exhibits strong revenue growth of 18.3% quarterly and year-over-year earnings growth of 19.1%, supported by solid EBITDA expansion, reflecting a positive growth trajectory in core operations.
Financial Health: With a current ratio of 1.4 and a debt-to-equity ratio of 18.4%, EID Parry maintains a stable financial position. Operating cash flow and free cash flow generation are healthy, supporting operational sustainability and liquidity.
Sector Specific Factors: The agricultural inputs sector in India faces challenges such as commodity price volatility and regulatory scrutiny, but also opportunities in bio-products and sustainable agriculture, areas where EID Parry is actively expanding.
Market Positioning: EID Parry benefits from a strong market position within India’s agro-industry, leveraging integrated operations and a diversified product portfolio to maintain competitive advantages.
Investment Conclusion
Supporting Factors: Attractive valuation metrics relative to industry peers with a forward P/E near 10.
Risk Factors: Exposure to commodity price fluctuations and regulatory risks in the agricultural sector.
SWOT Analysis
Strengths
- Established leadership in the Indian sugar industry with integrated operations.
- Diversified product portfolio including bio-products and nutraceuticals.
- Strong revenue growth and operational cash flow generation.
- Stable financial position with manageable debt levels.
Weaknesses
- Modest profit margins relative to some industry peers.
- Limited insider ownership which may affect strategic control.
- Stock trading below 52-week high indicating potential price volatility.
- Dependence on commodity prices impacting earnings stability.
Opportunities
- Expansion in bio-products and sustainable agricultural inputs.
- Growing demand for nutraceuticals and environmentally friendly products.
- Potential to leverage integrated power generation from bagasse.
- Increasing institutional investor interest could enhance liquidity.
Threats
- Volatility in sugar and commodity markets affecting revenue.
- Regulatory changes in agricultural policies impacting operations.
- Competitive pressures from larger agro-industrial companies.
- Macroeconomic factors influencing rural demand and input costs.
Company Description
EID Parry India Ltd., part of the Murugappa Group, is a prominent agro-industrial company in India, with a strong focus on sugar production. Founded in 1788, EID Parry holds a significant position in the sugar industry, being one of the largest producers in the country. Beyond sugar, the company is also involved in the manufacture and sale of bio-products, including nutraceuticals and biopesticides, showcasing its commitment to expanding within the agricultural sector. The company's operations extend into integrated sugar complexes, which includes sugar manufacturing, distillery for the production of alcohol, and co-generation of power from bagasse, a by-product of sugarcane. This integrated approach not only maximizes resource utilization but also emphasizes sustainability. EID Parry's ventures into the bio-products business underline its forward-looking approach, targeting a diverse range of applications from health supplements to environmentally friendly agricultural inputs. EID Parry's significance in the market is strengthened by its deep-rooted history and innovative strategies that help it maintain leadership in the agro-industry, contributing to the socio-economic progress of rural India through extensive agricultural engagements and farmer partnerships.