


Dixon Technologies (India) Ltd (DIXON)
Stock Analysis Report
Stock Journey
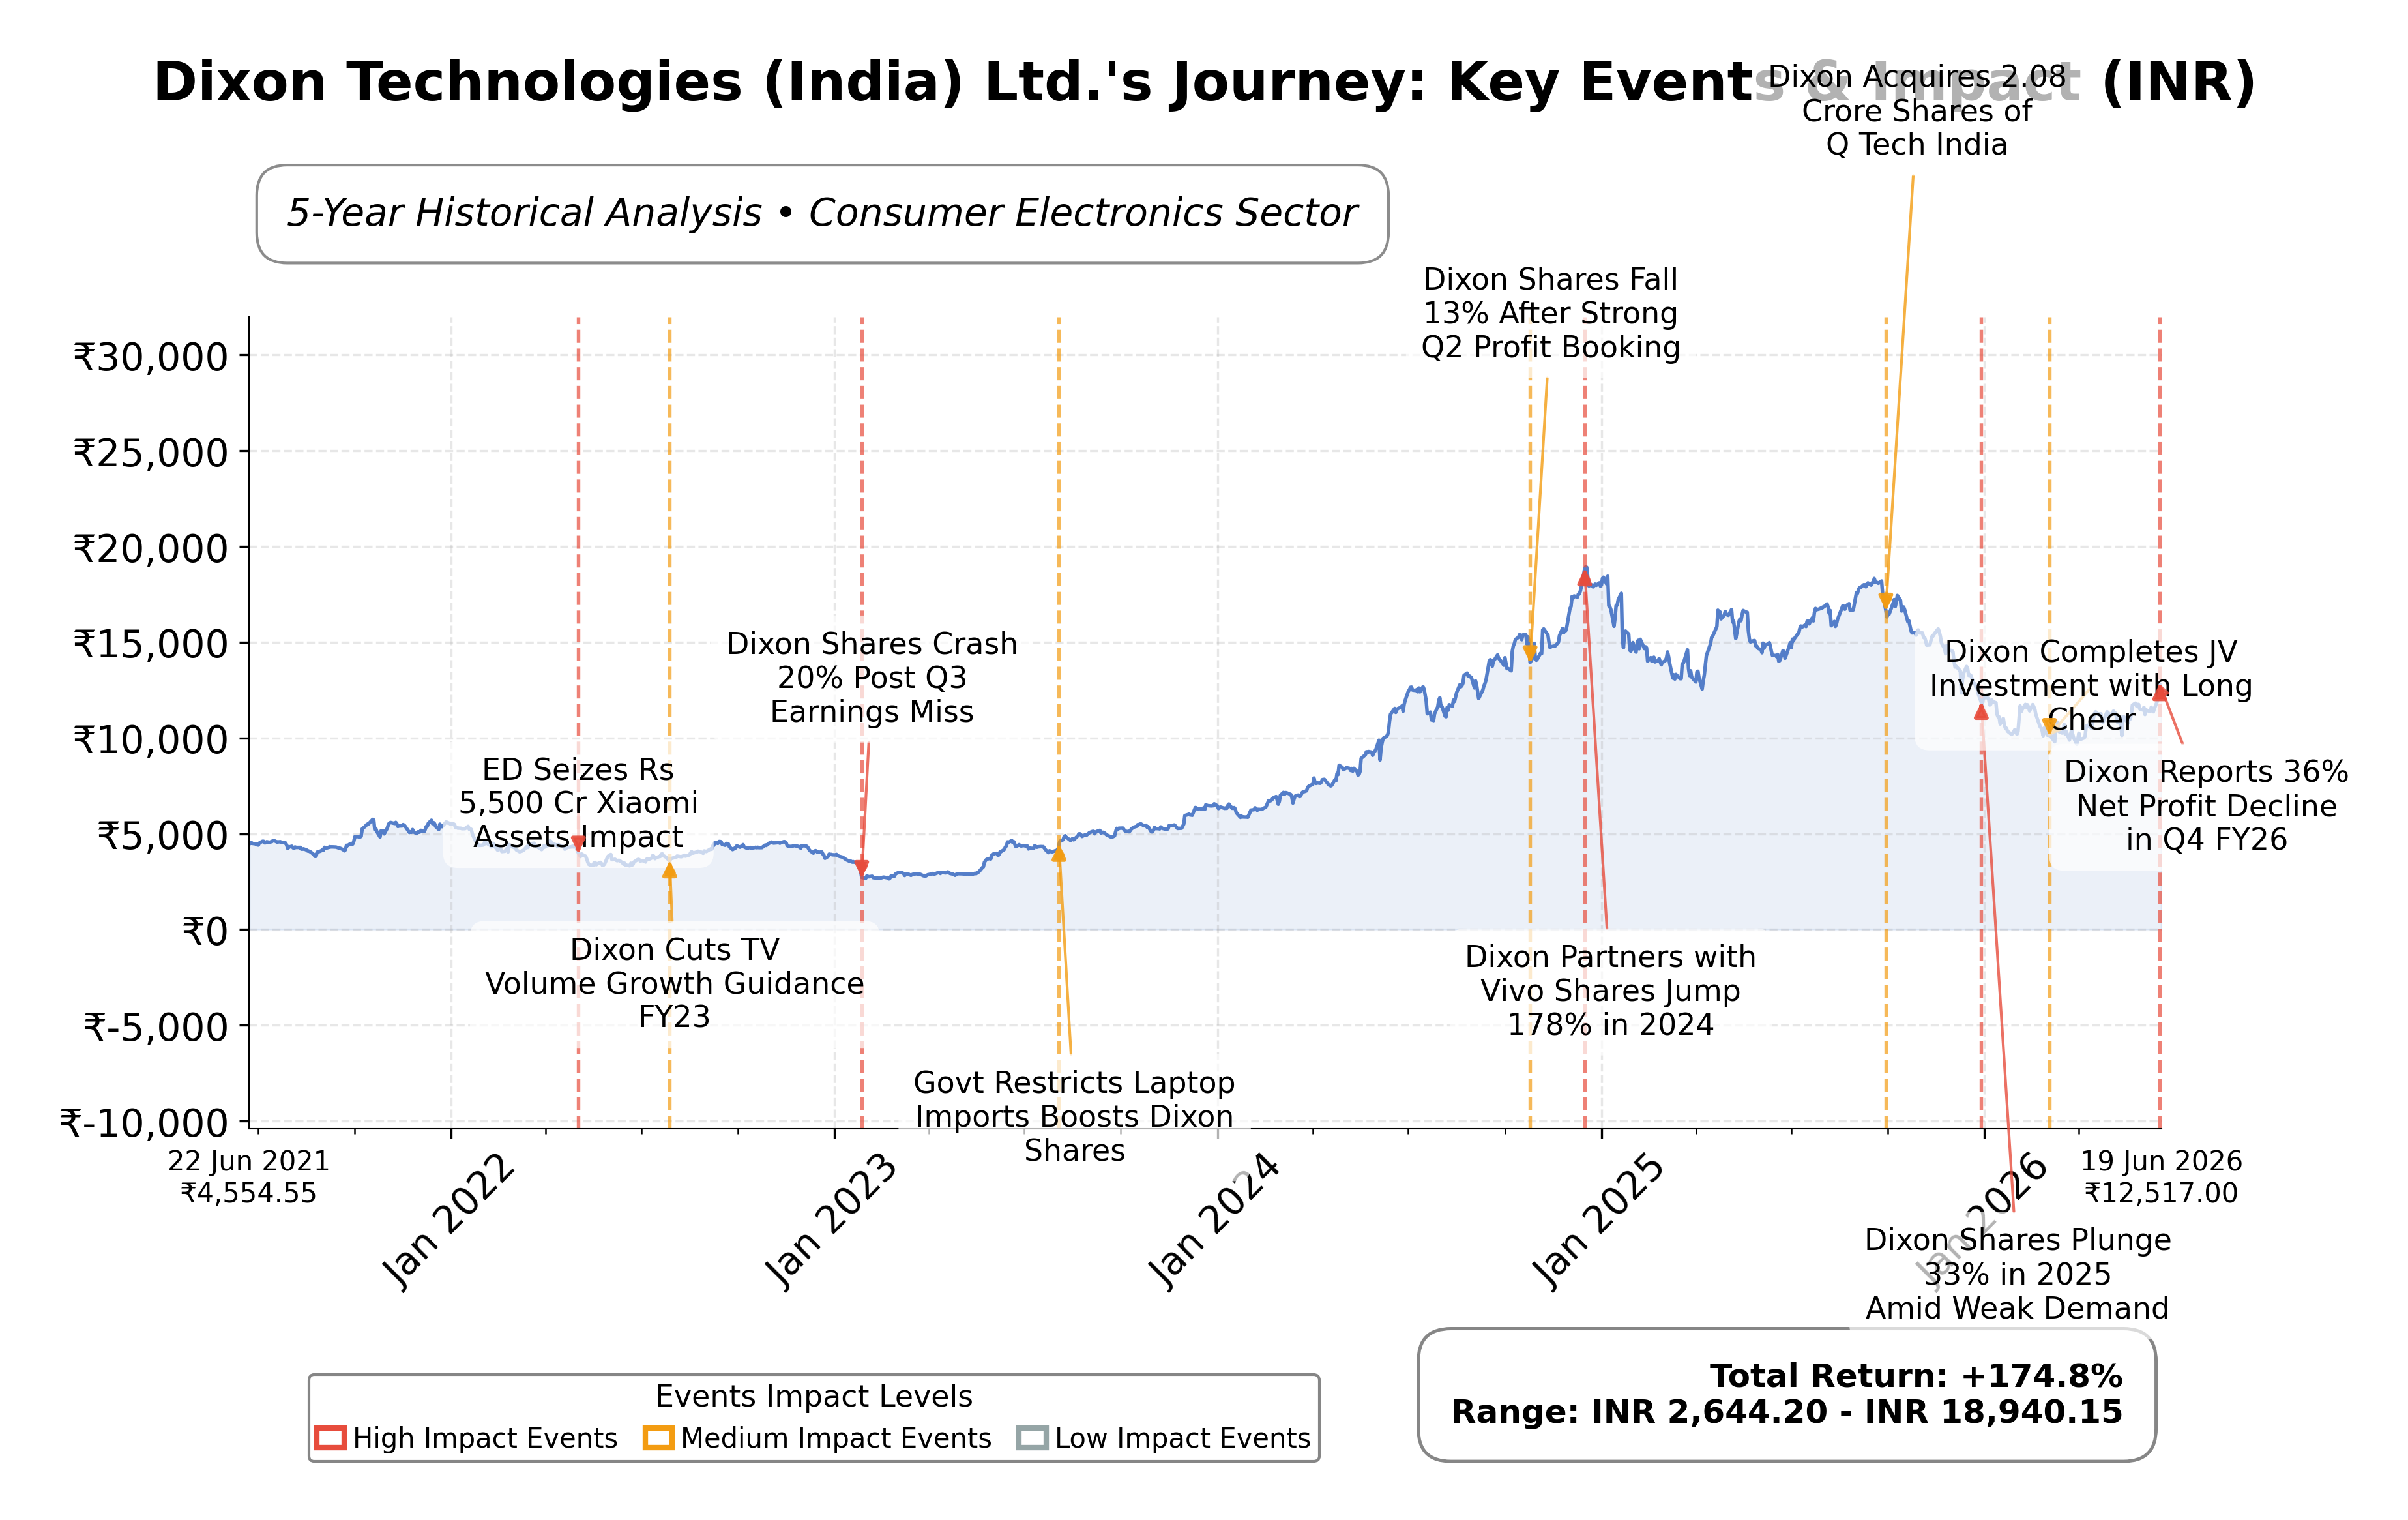
Key Positives and Key Risks
Pros
- Dixon Technologies exhibits a strong return on equity of 37.13%, reflecting efficient use of shareholder capital.
- The company generates robust operating cash flow of ₹17.8 billion and free cash flow of ₹9.1 billion, supporting financial flexibility.
- The proposed Vivo joint venture could add ₹30,000 crore in revenue, significantly enhancing growth prospects.
Cons
- The stock trades at a high price-to-book ratio of 13.94, indicating a premium valuation relative to book value.
- Quarterly earnings growth declined by 36%, suggesting near-term profitability challenges.
- The stock price is currently below the 200-day moving average, indicating recent technical weakness and potential downside risk.
Disclosure: This information is for general awareness and does not constitute investment advice
Report Summary
Dixon Technologies (India) Ltd. operates as a leading electronic manufacturing services provider in the consumer electronics industry, listed on the National Stock Exchange (NSE) of India under the technology sector. The company specializes in manufacturing a diverse range of products including LED televisions, washing machines, lighting products, mobile phones, and other home appliances. It holds a significant position in the Indian electronics manufacturing ecosystem, supporting major consumer electronics brands with end-to-end solutions from design to delivery. Dixon’s strategic role is enhanced by government initiatives such as "Make in India," which boost domestic production and technological innovation.
Financially, Dixon reported trailing twelve months (TTM) revenue of approximately ₹488.7 billion with a gross margin of 7.57%, operating margin of 2.89%, and a net profit margin of 2.94%. The company’s return on equity (ROE) stands at an impressive 37.13%, indicating strong profitability relative to shareholder equity, while return on assets (ROA) is 5.13%, reflecting efficient asset utilization. The return on invested capital (ROIC) is consistent with these figures, underscoring operational efficiency despite moderate margins. Quarterly revenue growth is modest at 2.1%, while quarterly earnings growth year-over-year declined by 36%, suggesting some pressure on short-term profitability.
Valuation metrics show a trailing price-to-earnings (P/E) ratio of 46.5 and a forward P/E of 48.9, with a price-to-book (P/B) ratio of 13.94 and an enterprise value to EBITDA (EV/EBITDA) multiple of 34.4. The market capitalization is approximately ₹761 billion. The stock price currently trades at ₹12,320, within a 52-week range of ₹9,600 to ₹18,471, representing a downside risk of about 33.7% from the 52-week high. These valuation multiples reflect a premium pricing relative to industry averages, consistent with the company’s growth prospects and market positioning.
Dixon’s strengths include robust cash flow generation with operating cash flow of ₹17.8 billion and free cash flow of ₹9.1 billion, a low debt-to-equity ratio of 0.18, and a strong market presence in India’s growing consumer electronics manufacturing sector. Key risks involve regulatory uncertainties, competitive pressures from both domestic and international players, and dependency on approvals such as the proposed joint venture with Vivo. Recent strategic developments include the anticipated government approval of the Vivo JV, which is expected to significantly enhance revenue and market share in smartphone manufacturing.
Technically, the stock is trading below its 50-day (₹11,351) and 200-day (₹12,649) moving averages, with a beta of -0.10 indicating low correlation with market volatility. Recent news and analyst commentary suggest cautious optimism around the Vivo JV and sector recovery. Overall, the data indicate a nuanced outlook where accumulation or realization of gains may be considered based on evolving fundamentals and regulatory developments, warranting a watchful stance.
Company and Industry Overview
Company Basics
Price Performance
Company Size
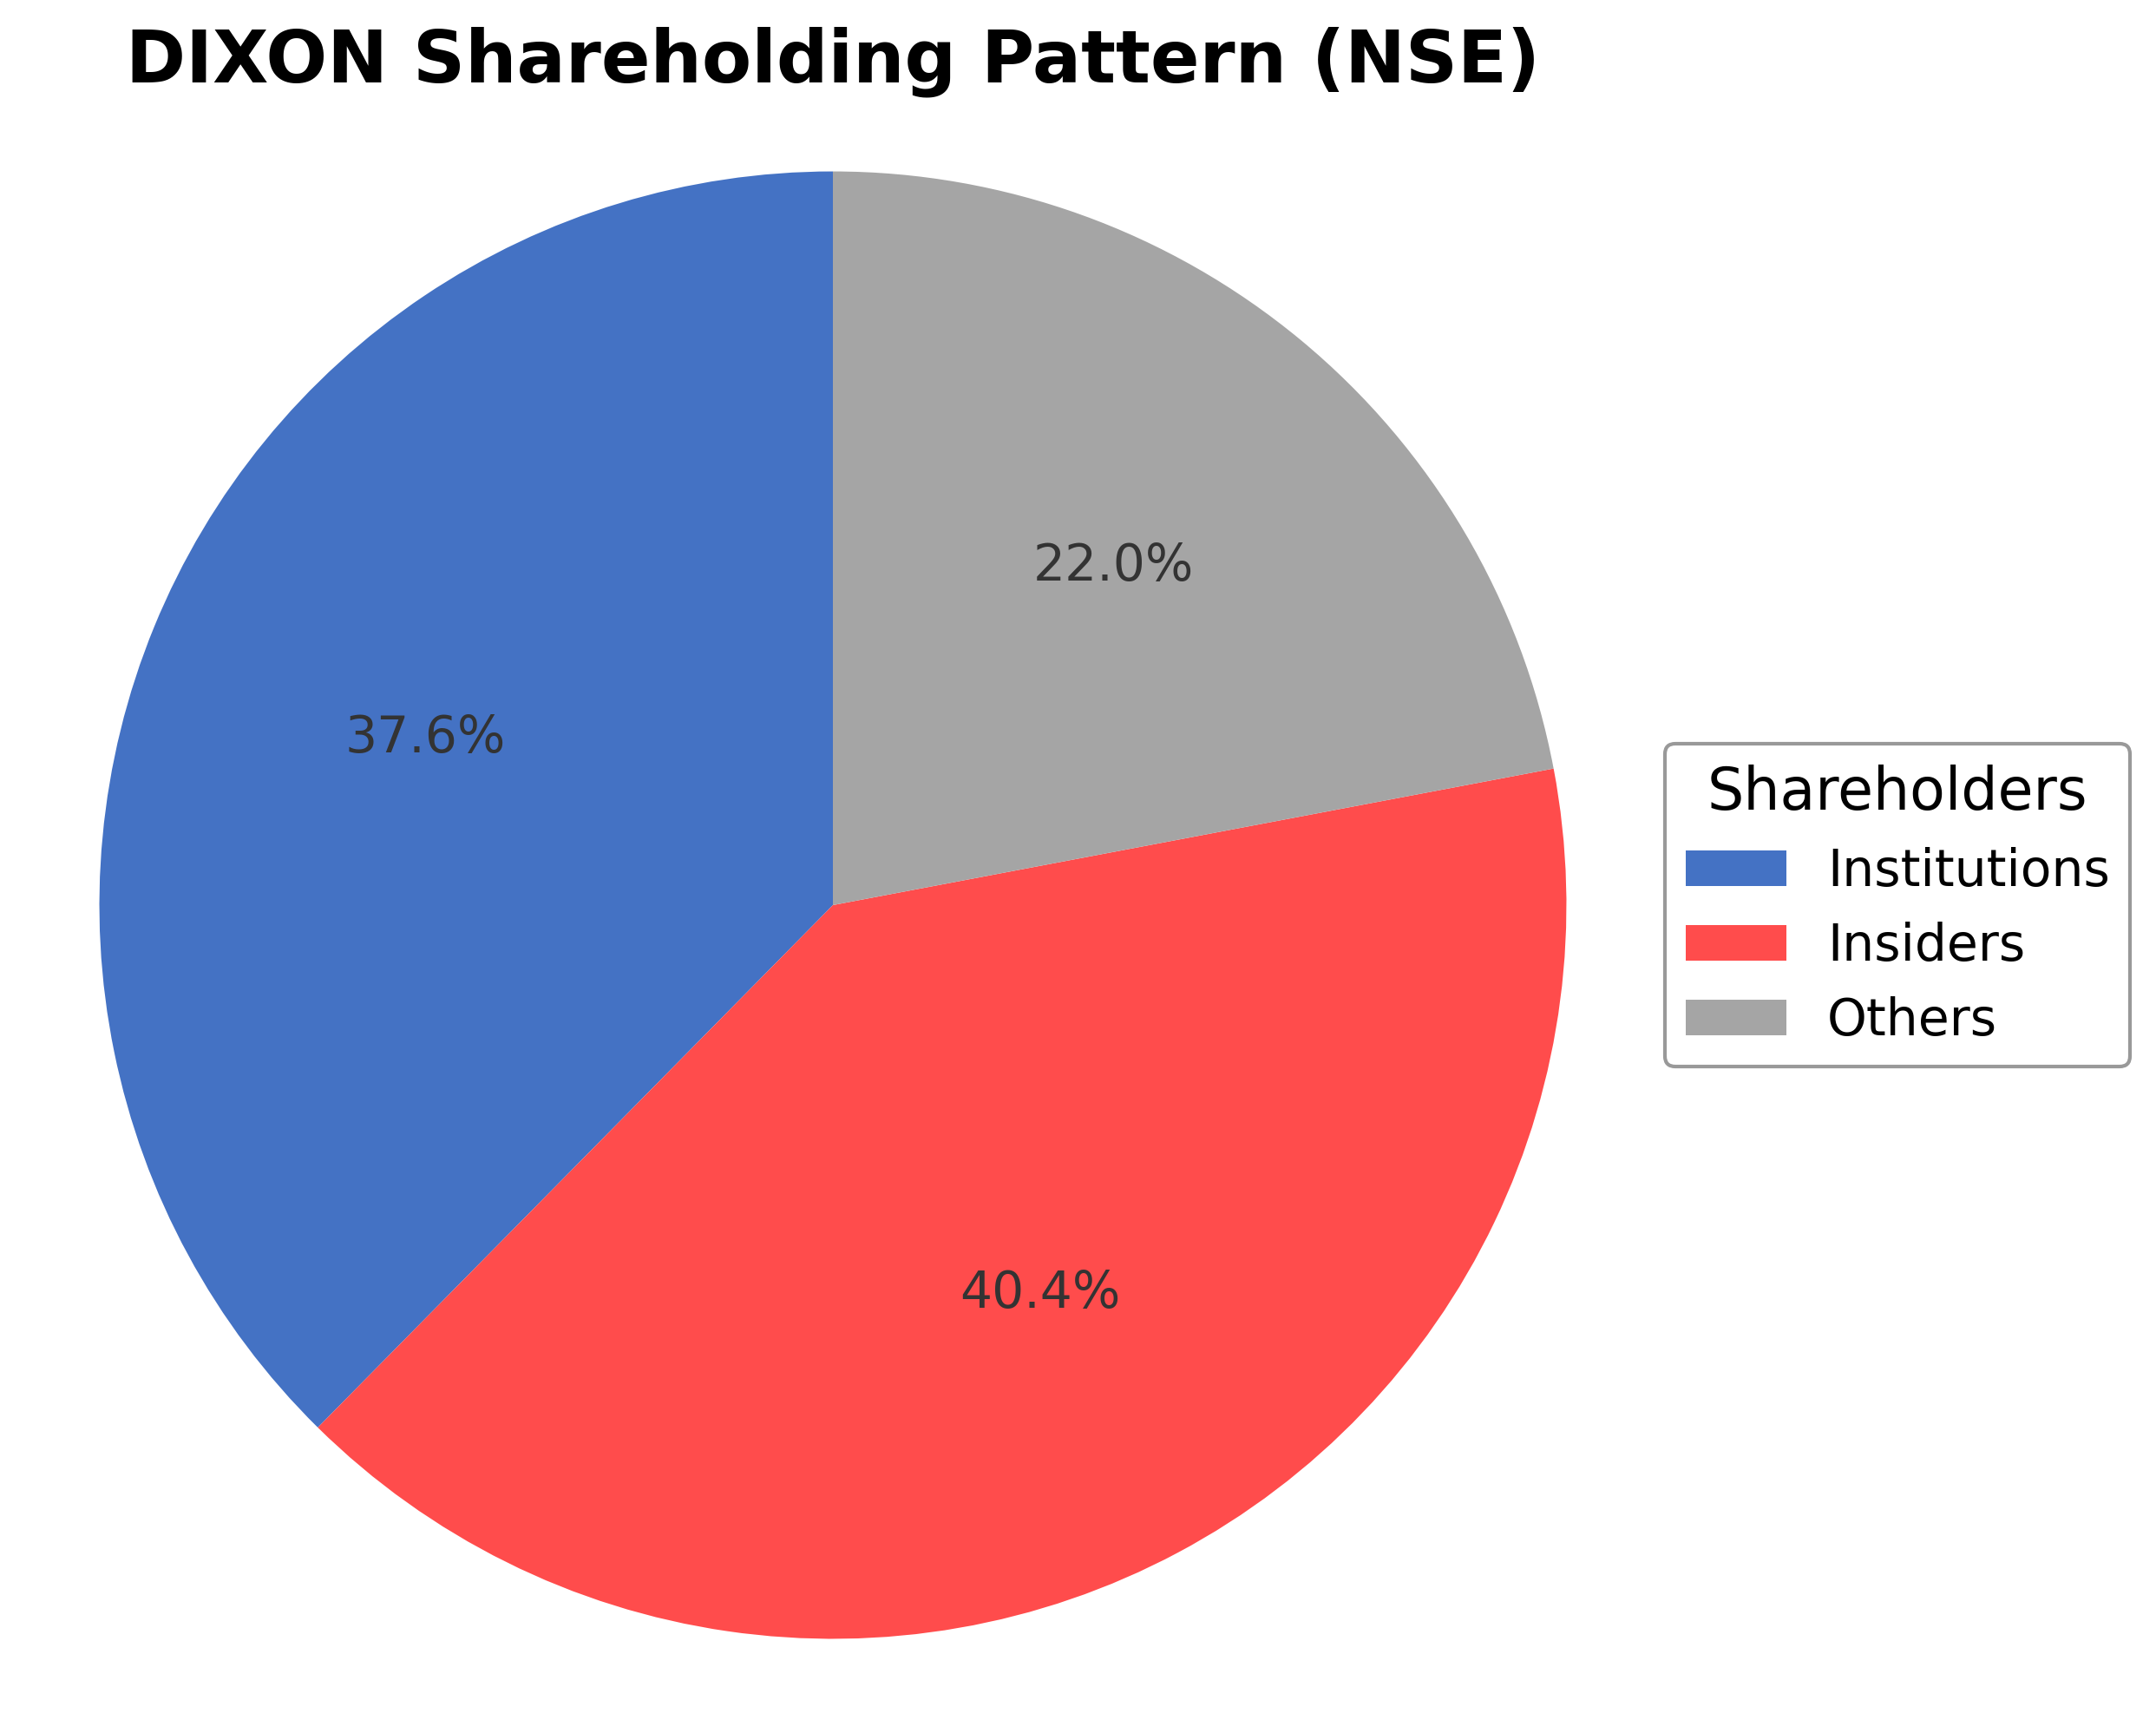
Shareholding Pattern
Sector and Industry Analysis
The Indian consumer durables sector, encompassing electronics, lighting, and home appliances, is witnessing robust growth driven by rising domestic demand and government initiatives. The electronic manufacturing services (EMS) industry alone is valued at approximately $23.5 billion, with significant expansion expected in mobile production, projected to grow fivefold to ₹10.5 lakh crore by FY26. Key players include Dixon Technologies, which holds a 3-4% market share, alongside other established firms in segments like wires and cables.
Industry trends highlight a shift towards original design manufacturing (ODM) and original equipment manufacturing (OEM) with increasing localization under government schemes like the Production Linked Incentive (PLI). Companies are expanding capacities in LED TVs, lighting, and mobile segments, leveraging cost optimization and new product launches to enhance margins. Barriers to entry remain high due to capital intensity, technology requirements, and established client relationships, with firms like Dixon benefiting from scale and government support.
The regulatory environment is shaped by government policies such as the PLI scheme, which incentivizes domestic manufacturing and export growth, particularly in electronics and LED lighting components. Compliance with quality standards and export regulations is critical, with ongoing support expected to boost industry competitiveness. The outlook remains positive, with planned investments and capacity expansions aligned with regulatory incentives fostering sustained sector growth.
Note: Analysis synthesized from industry research, market reports, and regulatory filings. Information is subject to change based on market conditions.
Financial Ratios Dashboard
Illustrative Scenario Analysis
DCF Assumptions:
Method: Two-Stage EPS-Priority Model
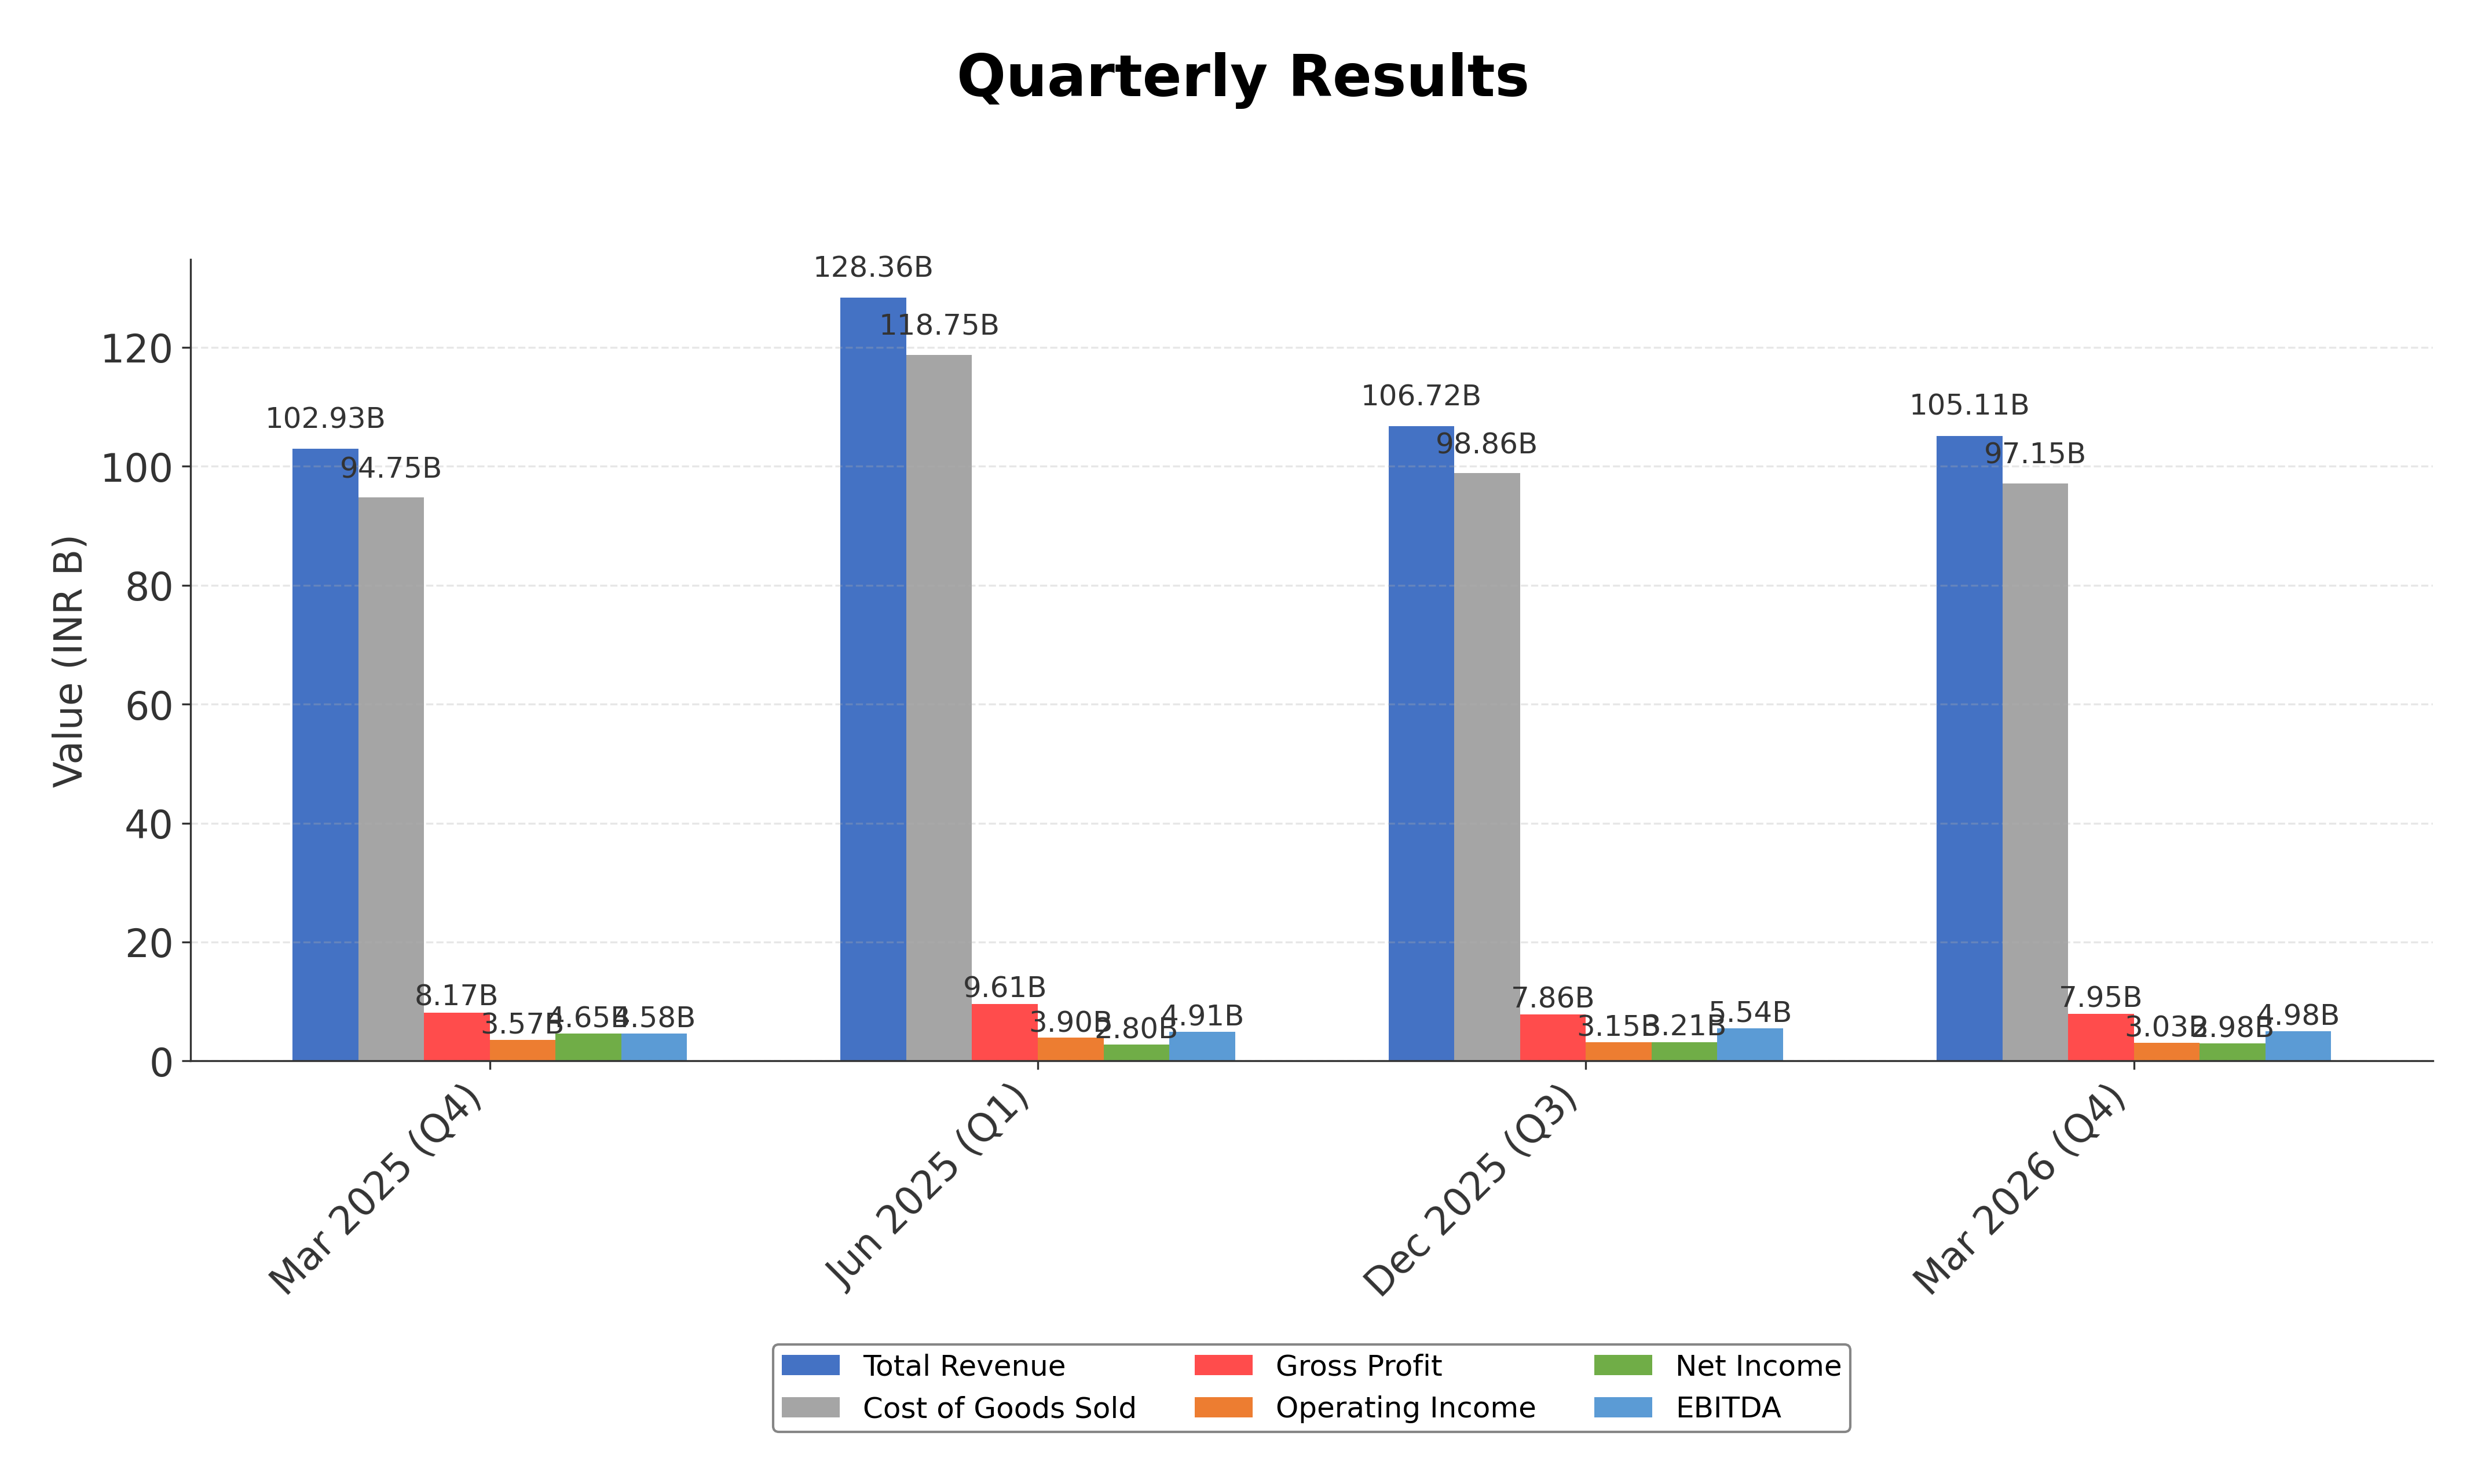
Financials
Peer Analysis
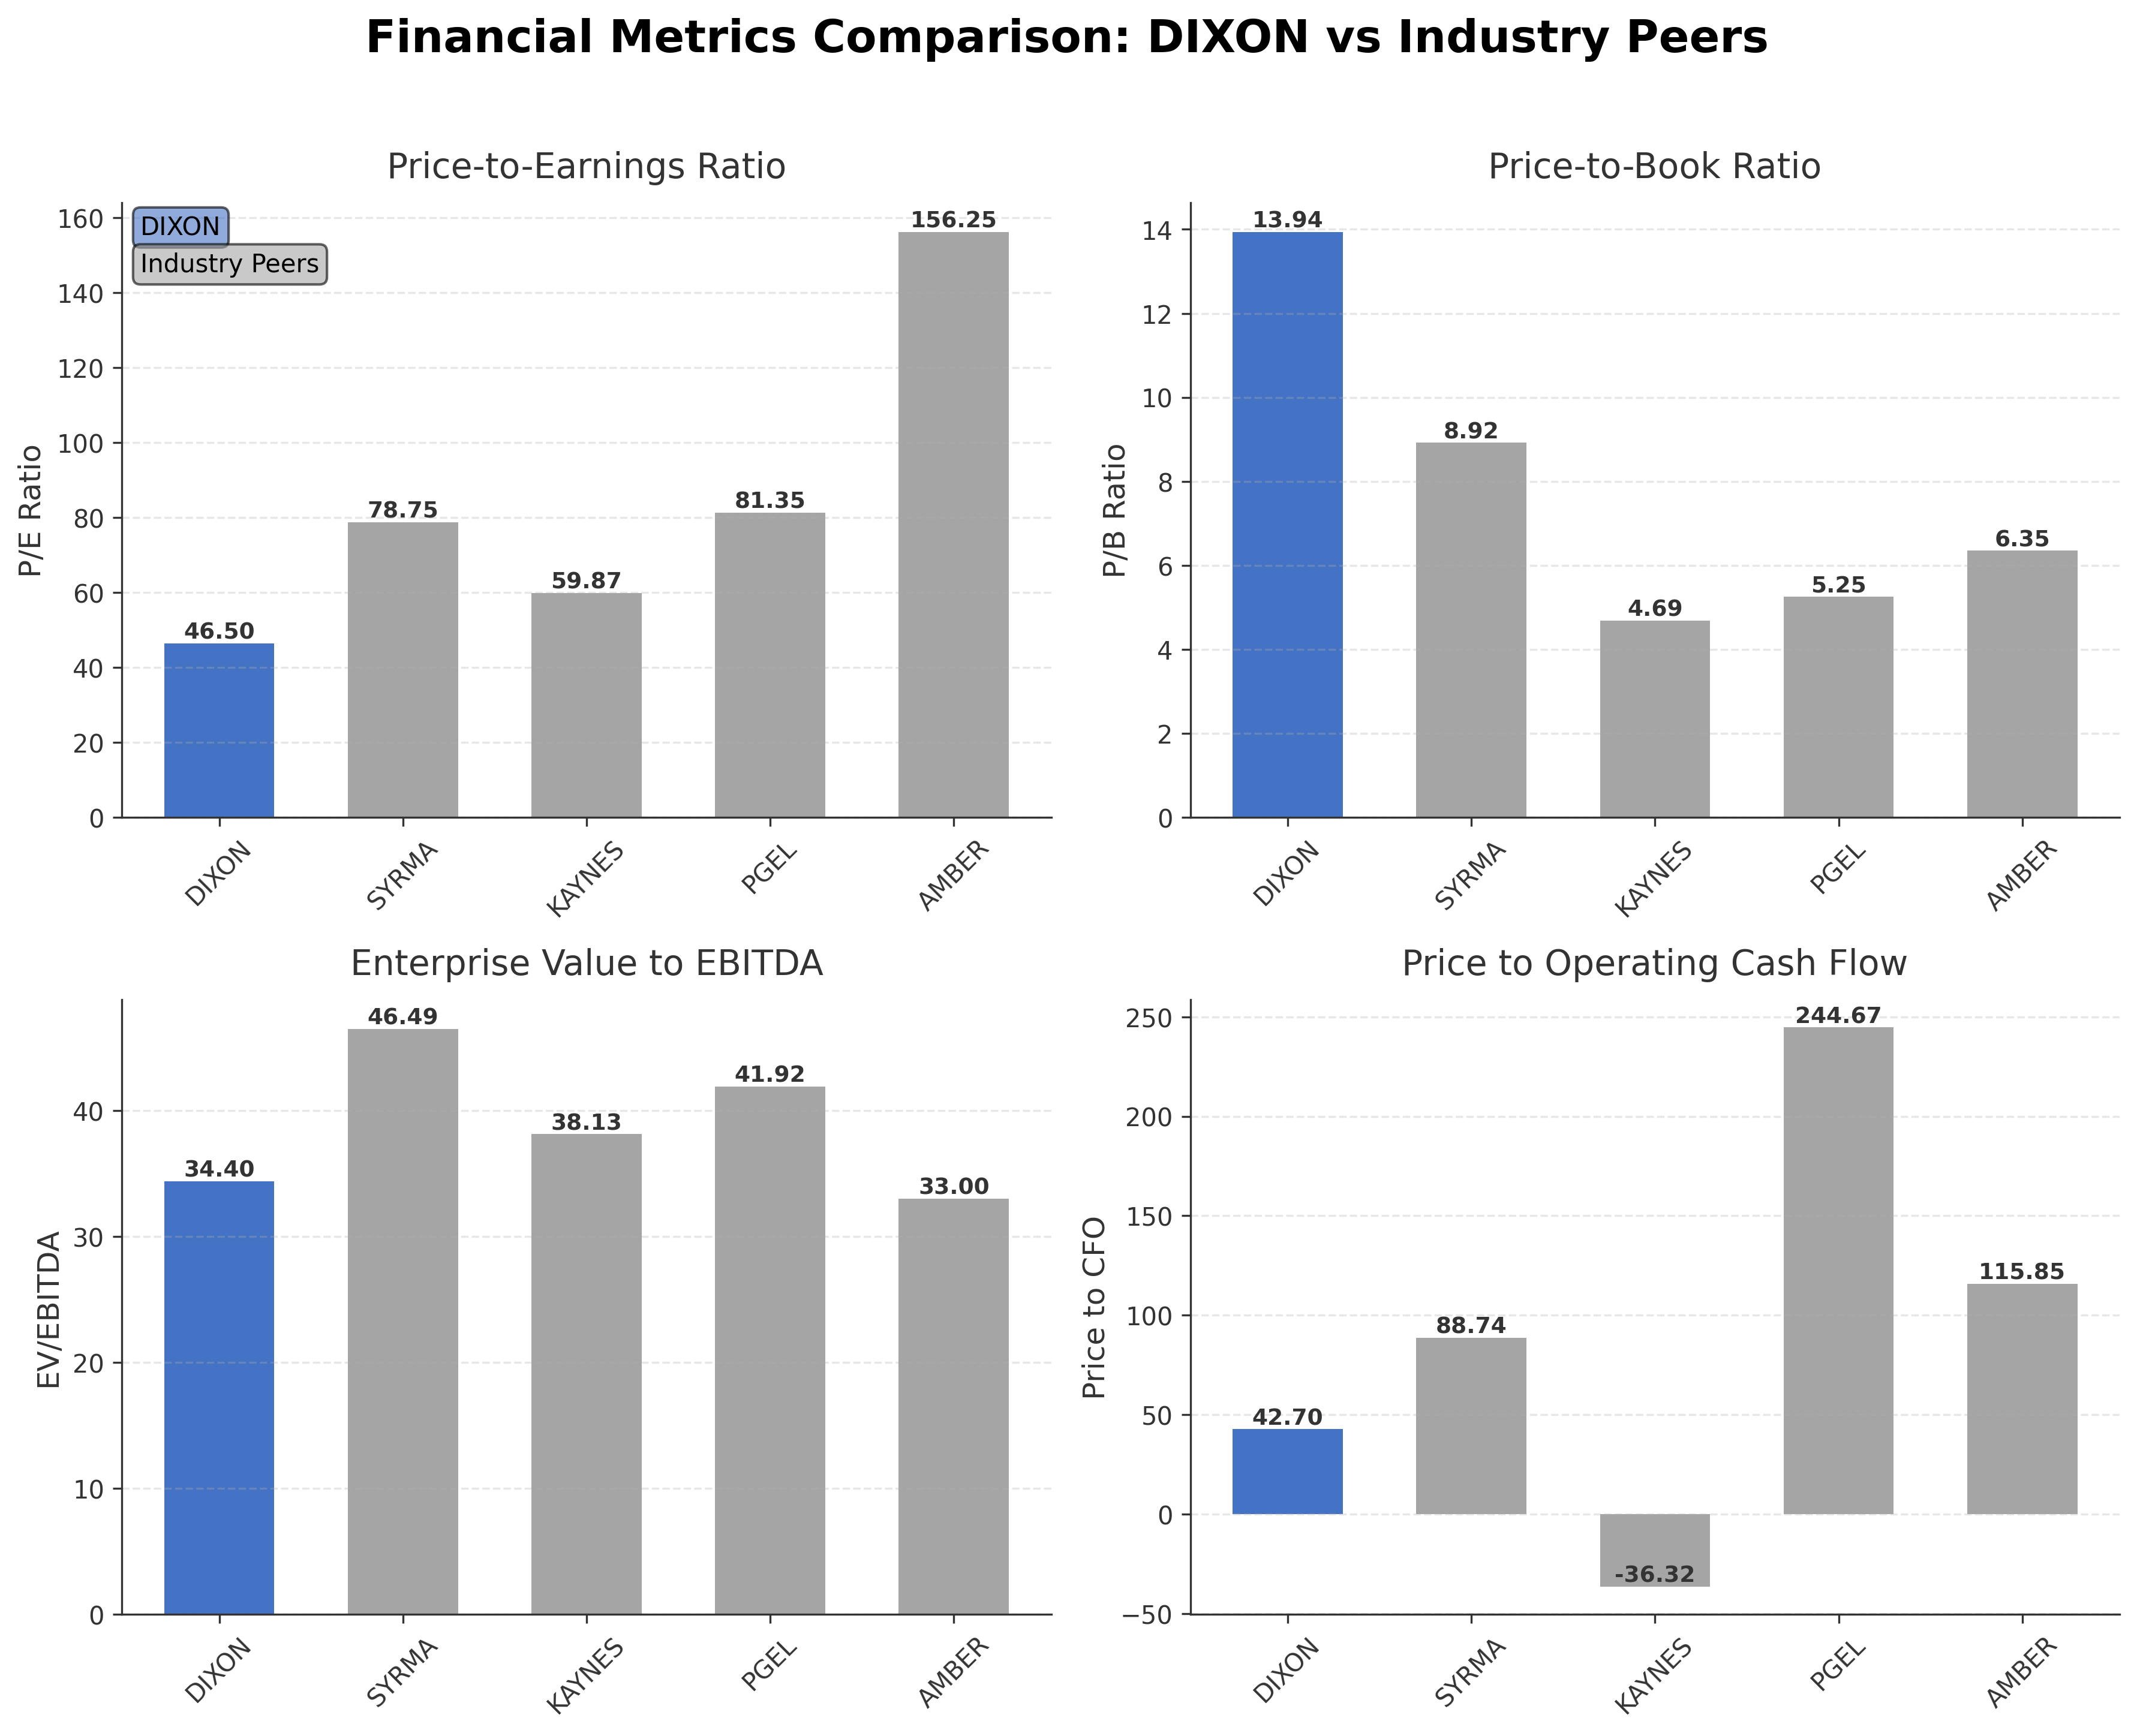
| Company Name | Market Cap | P/E Ratio | P/B Ratio | EV/EBITDA | Price to CFO |
|---|---|---|---|---|---|
| Dixon Technologies (India) Ltd. | ₹761.06B | 46.50 | 13.94 | 34.40 | 42.70 |
| Syrma SGS Technology Ltd. | ₹256.96B | 78.75 | 8.92 | 46.49 | 88.74 |
| Kaynes Technology India Ltd. | ₹218.07B | 59.87 | 4.69 | 38.13 | -36.32 |
| PG Electroplast Ltd. | ₹162.01B | 81.35 | 5.25 | 41.92 | 244.67 |
| Amber Enterprises India Ltd. | ₹278.23B | 156.25 | 6.35 | 33.00 | 115.85 |
Comparison Analysis: Dixon Technologies (India) Ltd. stands out among its regional peers with the highest market capitalization at ₹761.06 billion and a superior return on equity of 37.13%, indicating robust profitability. Its valuation multiples, including a P/E ratio of 46.50 and EV/EBITDA of 34.40, are lower than some peers like Amber Enterprises and PG Electroplast, which exhibit higher P/E ratios but lower ROE, suggesting Dixon balances growth with efficiency. The company’s price-to-cash-flow ratio of 42.70 is more moderate compared to peers such as PG Electroplast and Amber Enterprises, which have significantly higher ratios, indicating relatively better cash flow valuation. Overall, Dixon demonstrates a strong financial profile with competitive valuation metrics within the consumer electronics manufacturing sector.
Financial Metrics Comparison with Peers
Financial Statements
Comprehensive financial data including income, balance sheet, and cash flow metrics
Income Statement
| fiscal_date | 2026-03-31 | 2025-03-31 | 2024-03-31 | 2023-03-31 | 2022-03-31 |
|---|---|---|---|---|---|
| Sales | 488.73B | 388.60B | 176.14B | 121.73B | 106.70B |
| Cost Of Goods | 452.77B | 358.33B | 160.93B | 110.49B | 98.04B |
| Gross Profit | 35.96B | 30.27B | 15.21B | 11.25B | 8.66B |
| Operating Expense Other Operating Expenses | 10.18B | 9.52B | 1.79B | 1.14B | 956.10M |
| Operating Income | 14.74B | 12.27B | 5.42B | 4.07B | 3.02B |
| Non Operating Interest Expense | 1.37B | 1.54B | 713.60M | 563.40M | 427.30M |
| Pretax Income | 20.71B | 15.70B | 4.94B | 3.45B | 2.55B |
| Income Tax | 4.26B | 3.37B | 1.19B | 897.00M | 643.80M |
| Net Income | 16.44B | 12.33B | 3.75B | 2.55B | 1.90B |
| Eps Basic | 271.59 | 205.70 | 61.64 | 43.00 | 32.29 |
| Eps Diluted | 269.35 | 202.58 | 61.27 | 42.69 | 31.98 |
| Basic Shares Outstanding | 52.97M | 53.26M | 59.66M | 59.42M | 58.90M |
| Diluted Shares Outstanding | 52.97M | 53.26M | 59.66M | 59.42M | 58.90M |
| Ebit | 22.08B | 17.24B | 5.65B | 4.01B | 2.97B |
| Ebitda | 26.01B | 15.45B | 7.21B | 5.16B | 3.80B |
| Net Income Continuous Operations | 20.49B | 15.52B | 4.84B | 3.43B | 2.55B |
| Minority Interests | -2.06B | -1.37B | -71.70M | 4.40M | -1.60M |
| Preferred Stock Dividends | 0.00 | 0.00 | 0.00 | 0.00 | 0.00 |
| Operating Expense Selling General And Administrative | N/A | 569.50M | 465.90M | 402.30M | 359.40M |
| Non Operating Interest Income | N/A | 81.20M | 11.20M | 12.90M | 6.60M |
Data provided by Twelve Data
Balance Sheet
| fiscal_date | 2026-03-31 | 2025-03-31 | 2024-03-31 | 2023-03-31 | 2022-03-31 |
|---|---|---|---|---|---|
| Cash And Cash Equivalents | 7.67B | 2.28B | 1.98B | 2.15B | 1.76B |
| Accounts Receivable | 65.30B | 69.65B | 23.18B | 17.15B | 13.56B |
| Total Assets | 191.62B | 167.67B | 69.91B | 46.79B | 42.77B |
| Total Liabilities | 137.75B | 132.98B | 52.69B | 33.95B | 32.80B |
| Long Term Debt | 8.20B | 4.99B | 4.25B | 3.98B | 4.95B |
| Shareholders Equity | 53.87B | 34.69B | 17.22B | 12.85B | 9.97B |
Data provided by Twelve Data
Cash Flow Statement
| fiscal_date | 2026-03-31 | 2025-03-31 | 2024-03-31 | 2023-03-31 | 2022-03-31 |
|---|---|---|---|---|---|
| Operating Activities Net Income | 20.49B | 15.52B | 4.84B | 3.43B | 2.55B |
| Operating Activities Stock Based Compensation | 608.10M | 851.20M | 122.10M | 118.20M | 107.40M |
| Operating Activities Other Non Cash Items | 1.26B | 1.37B | 648.30M | 587.40M | 435.10M |
| Operating Activities Accounts Receivable | 5.76B | -30.49B | -6.03B | -3.59B | -2.66B |
| Operating Activities Other Assets Liabilities | 3.61B | -24.77B | -10.36B | 4.94B | -4.19B |
| Operating Activities Operating Cash Flow | 31.73B | -37.52B | -10.78B | 5.48B | -3.76B |
| Investing Activities Capital Expenditures | 96.40M | 437.60M | 158.60M | 109.80M | 32.50M |
| Investing Activities Net Acquisitions | -4.31B | -723.50M | N/A | N/A | N/A |
| Investing Activities Purchase Of Investments | -105.55B | -10.71B | 0.00 | -428.50M | -503.70M |
| Investing Activities Sale Of Investments | 109.19B | 8.22B | 385.50M | 1.36B | 5.80M |
| Investing Activities Other Investing Activity | -1.39B | -226.30M | 39.70M | -62.60M | -52.10M |
| Investing Activities Investing Cash Flow | -1.96B | -3.00B | 583.80M | 976.60M | -517.50M |
| Financing Activities Long Term Debt Issuance | 3.60B | 2.46B | 39.50M | 333.60M | 2.25B |
| Financing Activities Long Term Debt Payments | -5.32B | -1.94B | -302.40M | -1.96B | -80.20M |
| Financing Activities Short Term Debt Issuance | 1.08B | 57.70M | -13.00M | -1.15B | 852.60M |
| Financing Activities Common Stock Issuance | 2.47B | 1.40B | 468.90M | 335.70M | 642.00M |
| Financing Activities Common Dividends | -1.18B | -329.10M | -178.60M | -118.70M | -58.60M |
| Financing Activities Other Financing Charges | 162.80M | N/A | 208.20M | N/A | N/A |
| Financing Activities Financing Cash Flow | 807.80M | 1.65B | 222.60M | -2.56B | 3.61B |
| End Cash Position | 7.67B | 2.31B | 2.00B | 2.17B | 1.76B |
| Free Cash Flow | 7.15B | 2.10B | -1.20M | 2.65B | -1.48B |
Data provided by Twelve Data
Technical Analysis
Key Insights
- Dixon Technologies is currently in a consolidative phase with price trading below its 200-day moving average of ₹12,649 and 50-day moving average of ₹11,351, indicating a neutral to slightly bearish trend in the medium term.
- Key support levels are identified near ₹11,000 and ₹9,600, while resistance is observed around ₹12,800 and the 200-day moving average at ₹12,649.
- The stock is positioned below the 10-day, 50-day, and 200-day moving averages, suggesting limited upward momentum at present.
- Momentum indicators show RSI near neutral levels around 50, MACD is flat with no clear crossover, and stochastic oscillators indicate a lack of strong directional bias.
- Across daily, weekly, and monthly timeframes, the stock exhibits sideways movement with no definitive breakout or breakdown pattern established.
- Current technical setup suggests potential for range-bound trading with volatility likely to increase upon significant news such as regulatory approval or earnings announcements.
Trending News
1. Headline: Dixon Stock - Analyst views and sector context at week’s end
Summary: Dixon Technologies (India) Ltd (INE424L01027) shares trade on the National Stock Exchange of India and the BSE in Indian rupees; recent delayed quotes place the price in the mid-INR 12,000 area as of 06/19/2026, 18:45 IST.
Sentiment: neutral
2. Headline: Rs 12,000 Puts — 3.5% Below Current Price — Draw 3,829 Contracts on Dixon Technologies (India) Ltd
Summary: Rs 12,000 put options on Dixon Technologies (India) Ltd attracted 3,829 contracts on 19 Jun 2026, representing significant activity at a strike price 3.5% below the stock’s current level of Rs 12,443. This surge in put trading comes amid a recent two-day decline in the stock, raising questions ...
Sentiment: negative
3. Headline: One of Dixon Tech's biggest bulls sees further legs to its growth outlook; Details here - CNBC TV18
Summary: Shares of Dixon Technologies (India) Ltd. are expected to remain in focus on Thursday, June 18, after global brokerage firm Macquarie reiterated its bullish stance on the stock and flagged potential upside from the company's proposed joint venture with Vivo.
Sentiment: positive
4. Headline: Rs 11,000 Puts Draw 3,698 Contracts on Dixon Technologies as Stock Holds Near Rs 12,700
Summary: The stock is trading at Rs 12,695, just below its recent intraday high of Rs 12,735, while put options at the Rs 11,000 strike have attracted 3,698 contracts on 17 Jun 2026. This significant put activity, concentrated well below the current price, suggests a nuanced picture of hedging and cautious positioning rather than outright bearish conviction. ... Dixon Technologies (India) Ltd ...
Sentiment: negative
5. Headline: Dixon Tech, Amber, PGEL, Syrma, Epack shares: Demand recovery in sight; stocks a buy? - BusinessToday
Summary: BOB Capital Markets has rolled ... for EMS stocks to June 2028 earnings and said Amber Enterprises remains its preferred pick. BOB Capital Markets has assigned a 'Buy' rating to Amber Enterprises India Ltd, PG Electroplast Ltd (PGEL) and EPACK Durable Ltd, while recommending a 'Hold' on Dixon Technologies (India) Ltd ...
Sentiment: positive
Powered by Brave
Recent Updates
News Summary
As of June 17, 2026. Dixon Technologies (India) Ltd. experienced a notable share price rally exceeding 5% following reports that the Indian government is likely to approve its proposed joint venture with Vivo within the month. This regulatory milestone is anticipated to significantly boost Dixon's presence in the smartphone manufacturing sector. JPMorgan's analysis supports this outlook, projecting a revenue uplift of ₹30,000 crore from the JV, with expected operations commencing in the third quarter of the fiscal year. The brokerage maintains an overweight rating with a price target of ₹12,700, which the stock surpassed during trading, reflecting strong market confidence. Analyst consensus remains broadly positive, with 22 out of 32 covering analysts recommending a buy, underscoring optimism about Dixon’s growth prospects tied to the Vivo partnership.
News Sentiment
The overall sentiment from recent updates is cautiously optimistic, driven primarily by the anticipated regulatory approval of the Vivo joint venture, which is expected to materially enhance revenue and market share. Positive market reactions, including a sharp share price increase and bullish analyst commentary, contrast with neutral tones from official statements clarifying no fresh developments beyond regulatory processes. This mix reflects a market balancing hopeful growth catalysts against the procedural nature of approvals. The sentiment is tempered by the need for formal confirmation and execution of the JV, suggesting a watchful but constructive outlook.
Source List
- https://www.goodreturns.in/news/dixon-tech-share-price-today-jumps-over-5-centre-likely-to-approve-vivo-joint-venture-in-june-buy-1516121.html
- https://cnbctv18.com/market/dixon-technologies-share-price-vivo-jv-potential-approval-prospects-revenue-margins-eps-target-upside-19926973.htm/amp
Analytical Overview
Analysis Summary
Dixon Technologies’ valuation metrics, including a trailing P/E of 46.5 and forward P/E of 48.9, are in line with the consumer electronics industry average of approximately 46.5, indicating the stock is priced at a premium consistent with growth expectations. The company’s modest revenue growth of 2.1% and strong operating cash flow of ₹17.8 billion demonstrate a stable growth trajectory supported by healthy cash generation. Financial health is solid with a low debt-to-equity ratio of 0.18 and positive free cash flow of ₹9.1 billion, reflecting prudent leverage and liquidity management. Sector-specific opportunities arise from government initiatives like 'Make in India' and the expanding domestic electronics market, while challenges include regulatory approvals and competitive pressures. India’s regulatory environment and consumer trends favor domestic manufacturing, providing a supportive backdrop for Dixon’s strategic expansion.
Overall Business and Market Assessment
Supporting Factors: Key supporting factors include Dixon’s strong return on equity of 37.13%, robust cash flow generation, and the potential revenue uplift from the Vivo joint venture. Risks to monitor involve regulatory uncertainties surrounding the JV approval and competitive dynamics in the consumer electronics manufacturing sector. The appropriate investment timeframe is medium to long term, considering the company’s growth initiatives and sector evolution. Overall, the analysis reflects a balanced outlook with promising growth drivers tempered by valuation premiums and execution risks.
Risk Factors: No data
SWOT Analysis
Strengths
- Dixon Technologies has a strong return on equity of 37.13%, indicating high profitability.
- The company maintains robust operating cash flow of ₹17.8 billion and positive free cash flow.
- Low debt-to-equity ratio of 0.18 supports financial stability and prudent leverage.
- Strategic positioning in India’s growing consumer electronics manufacturing sector.
Weaknesses
- Modest gross margin of 7.57% limits profitability expansion.
- Quarterly earnings growth declined by 36%, indicating short-term profit pressure.
- High price-to-book ratio of 13.94 suggests premium valuation.
- Stock trades below its 200-day moving average, reflecting recent technical weakness.
Opportunities
- Potential revenue uplift of ₹30,000 crore from the proposed Vivo joint venture.
- Government initiatives like 'Make in India' support domestic manufacturing growth.
- Expanding demand for consumer electronics in India and emerging markets.
- Increasing institutional investor interest signals confidence in growth prospects.
Threats
- Regulatory approvals for joint ventures remain uncertain and may delay growth.
- Intense competition from domestic and international electronics manufacturers.
- Macroeconomic factors and supply chain disruptions could impact operations.
- Market volatility reflected in significant put option activity suggests cautious sentiment.
Company Description
Dixon Technologies (India) Ltd. is a prominent electronic manufacturing services provider, primarily engaged in the development, production, and distribution of consumer electronics. The company's operations cover a wide array of product segments including LED televisions, washing machines, lighting products, mobile phones, and other home appliances. Dixon Technologies plays a critical role in the manufacturing ecosystem by offering complete solutions from design to delivery. This enables its clients, which include major consumer electronics brands, to bring their products to market efficiently and cost-effectively. The company is a key player in India's electronics sector, gaining significance due to the country's increasing demand for manufactured goods and the push for domestic production under initiatives like "Make in India." With a strong emphasis on technological innovation and quality, Dixon continues to expand its capabilities, making it a vital component of the modern electronics supply chain.