
Dixon Technologies (India) Ltd (DIXON)
Stock Analysis Report
Stock Journey
Key Positives and Key Risks
Pros
- Dixon Technologies has a strong return on equity of 31.58%, indicating efficient use of shareholder capital.
- The mobile and EMS division contributes 84% of revenue, demonstrating successful growth in a key segment.
- The company maintains a substantial market capitalization of ₹677.65 billion, reflecting market confidence.
Cons
- The stock trades at a high price-to-book ratio of 14.96, suggesting elevated valuation risk.
- Operating cash flow is negative at -₹37.5 billion TTM, indicating potential liquidity concerns.
- The share price has declined nearly 50% from its 52-week high, reflecting recent market volatility.
Disclosure: This information is for general awareness and does not constitute investment advice
Report Summary
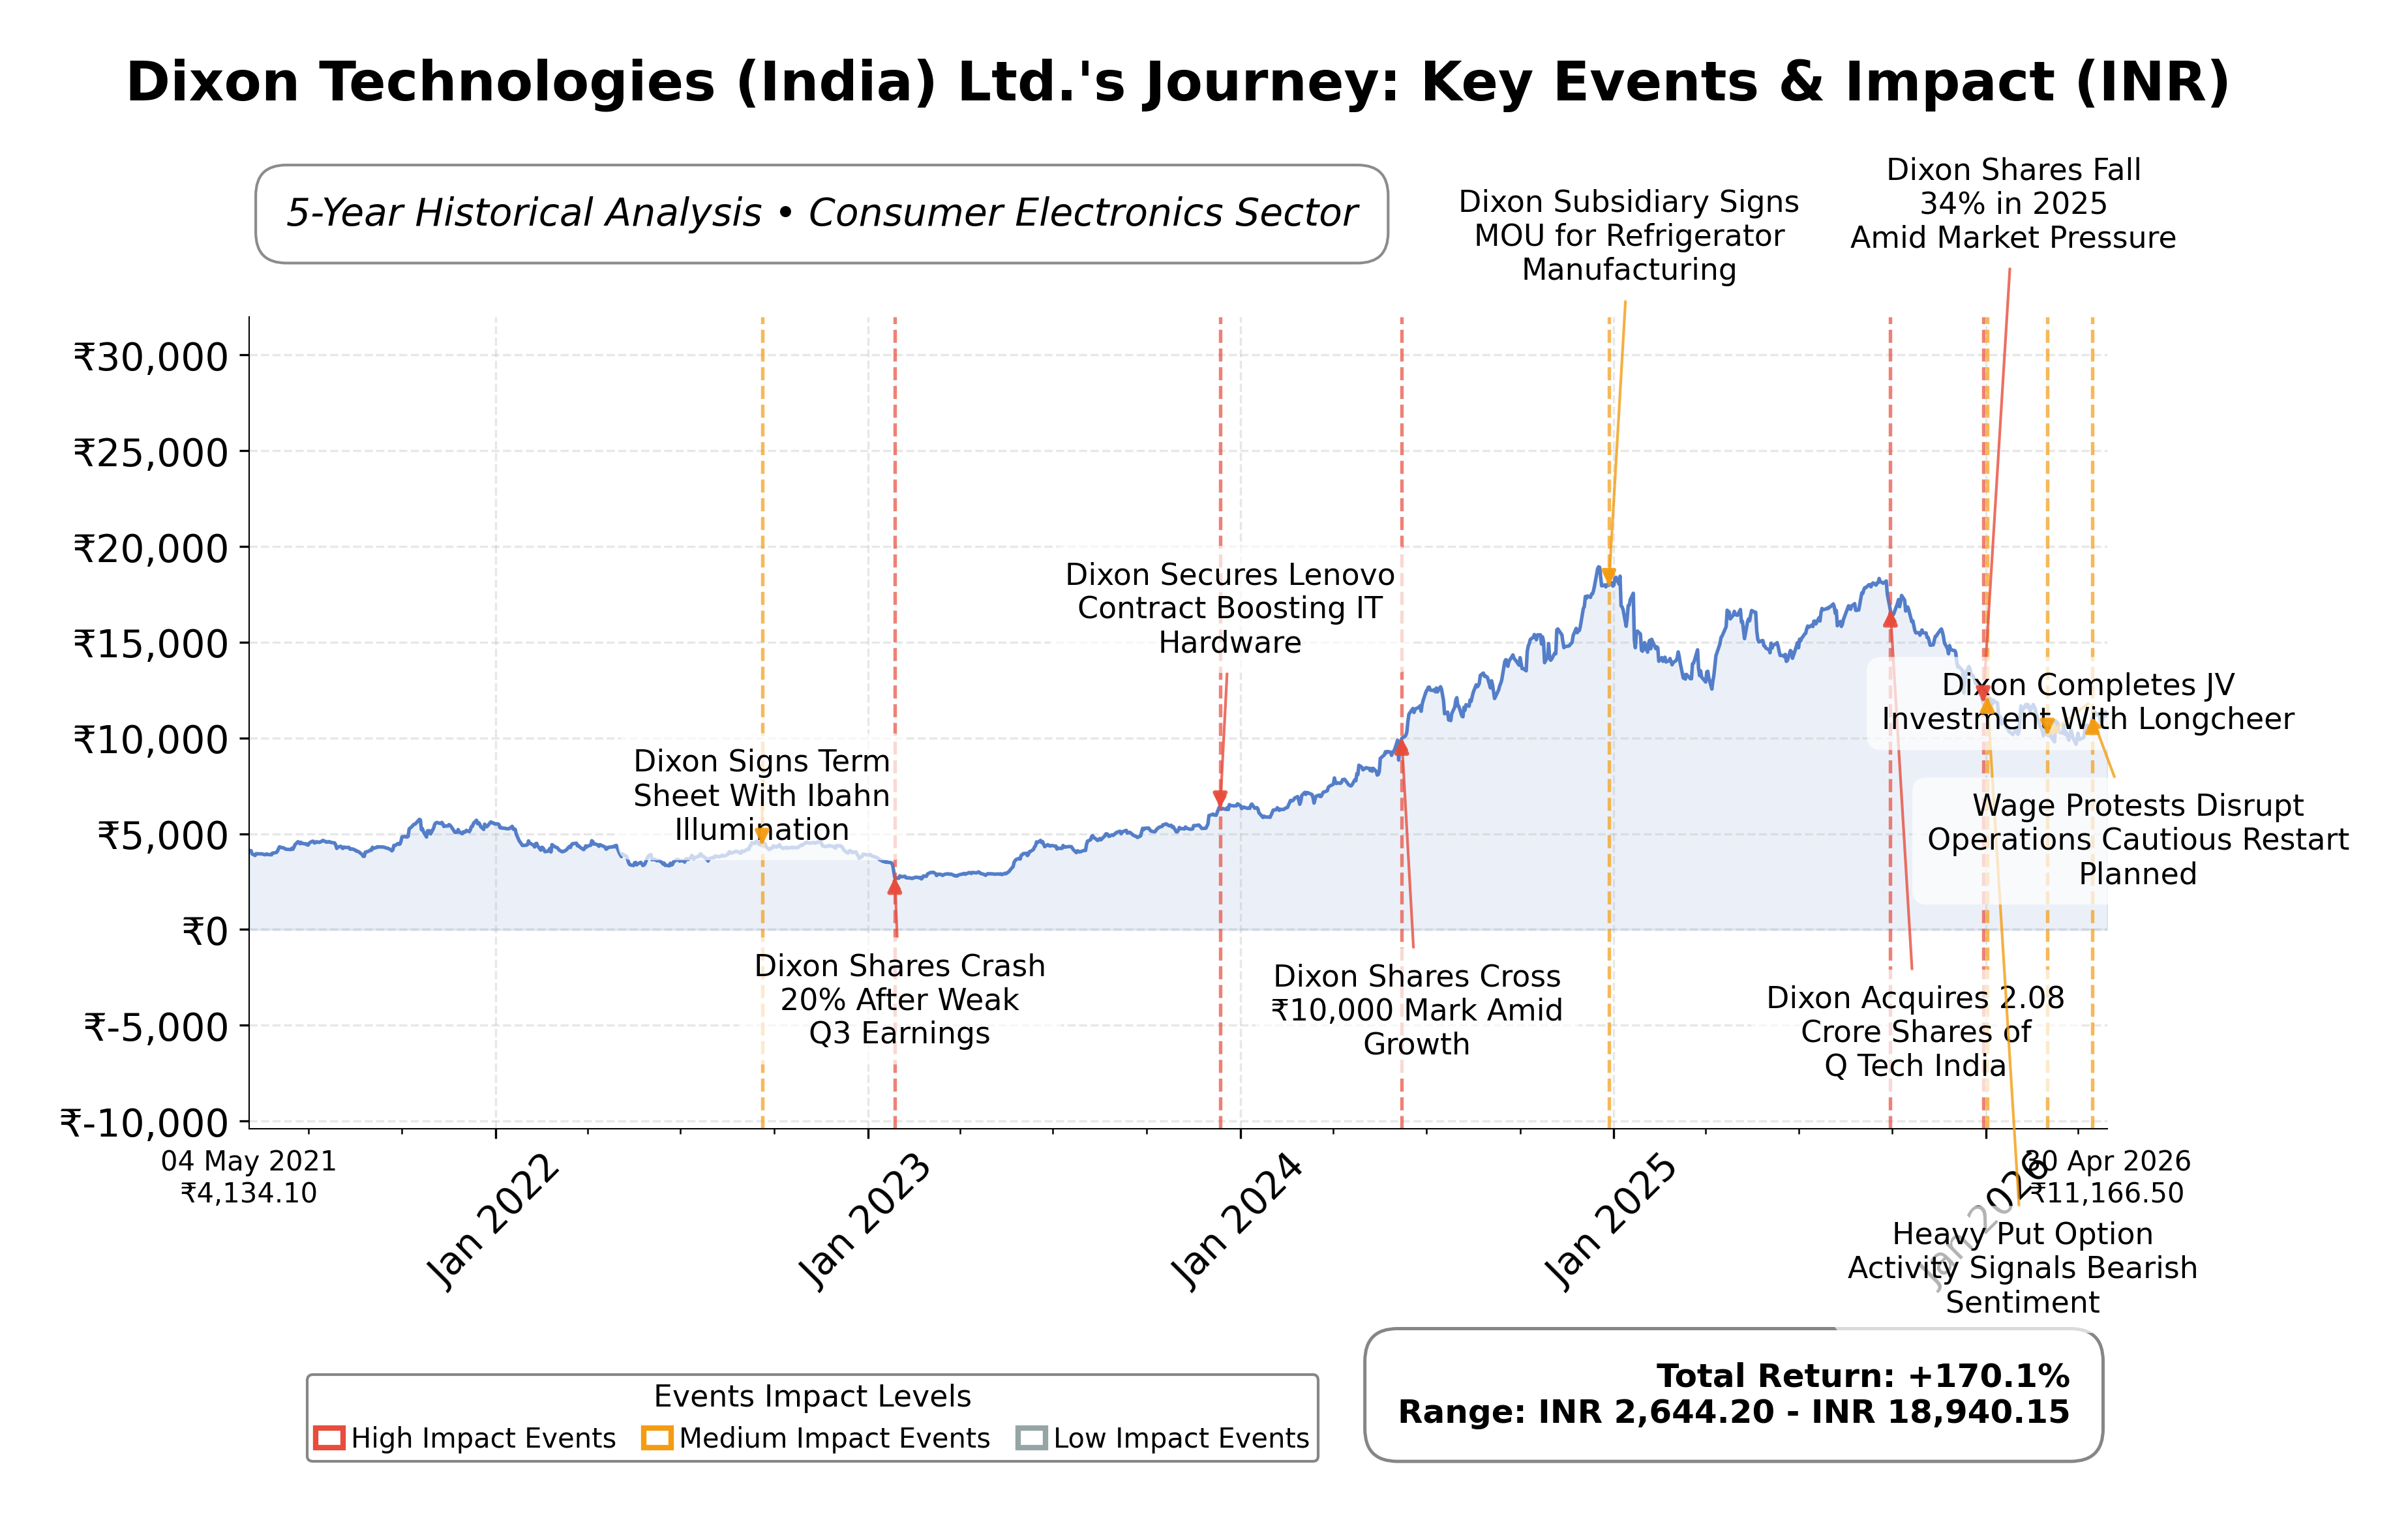
Dixon Technologies (India) Ltd. is a leading electronic manufacturing services (EMS) provider listed on the National Stock Exchange of India (NSE), operating within the technology sector focused on consumer electronics. The company specializes in the design, production, and distribution of a broad range of products including LED televisions, washing machines, lighting products, mobile phones, and other home appliances. Positioned as a key contract manufacturer for major consumer electronics brands, Dixon plays a pivotal role in India's domestic electronics supply chain, benefiting from government initiatives like "Make in India" that emphasize local manufacturing.
Financially, Dixon reported trailing twelve months (TTM) revenue of approximately ₹486.5 billion with a gross margin of 7.36%, operating margin of 2.96%, and net profit margin of 3.25%, reflecting moderate profitability in a competitive industry. The company’s return on equity (ROE) stands at a robust 31.58%, while return on assets (ROA) is 6.53%, indicating efficient use of shareholder capital and assets. Return on invested capital (ROIC) is similarly strong, supporting the company’s operational effectiveness despite relatively thin margins typical of contract manufacturing.
Valuation metrics show a trailing price-to-earnings (P/E) ratio of 40.84 and a forward P/E of 58.91, suggesting the market prices Dixon at a premium relative to current earnings expectations. The price-to-book (P/B) ratio is elevated at 14.96, and the enterprise value to EBITDA (EV/EBITDA) multiple is 34.02, indicating high valuation multiples possibly reflecting growth prospects. The stock trades at ₹11,166.50, down from a 52-week high of ₹18,471 and above the 52-week low of ₹9,600, highlighting significant volatility and a nearly 50% decline from peak levels.
Dixon’s strengths include a strong market capitalization of approximately ₹678 billion, a solid ROE, and strategic positioning as a key EMS player in India’s growing electronics sector. However, risks include high valuation multiples, modest profit margins, and a recent decline in stock price. The company has recently entered a joint venture to expand into wireless audio solutions, reflecting strategic initiatives to diversify offerings. Foreign institutional investors have slightly reduced holdings in recent quarters, indicating some caution among large investors.
Technical indicators show mixed signals with the stock trading below its 200-day moving average and near key support levels, while options market activity suggests near-term interest around the ₹11,000 strike price. Recent news reflects robust trading volumes and active market participation. Overall, the data suggests a cautious stance with attention to valuation and market dynamics, favoring close monitoring of operational and market developments.
Company and Industry Overview
Company Basics
Price Performance
Company Size
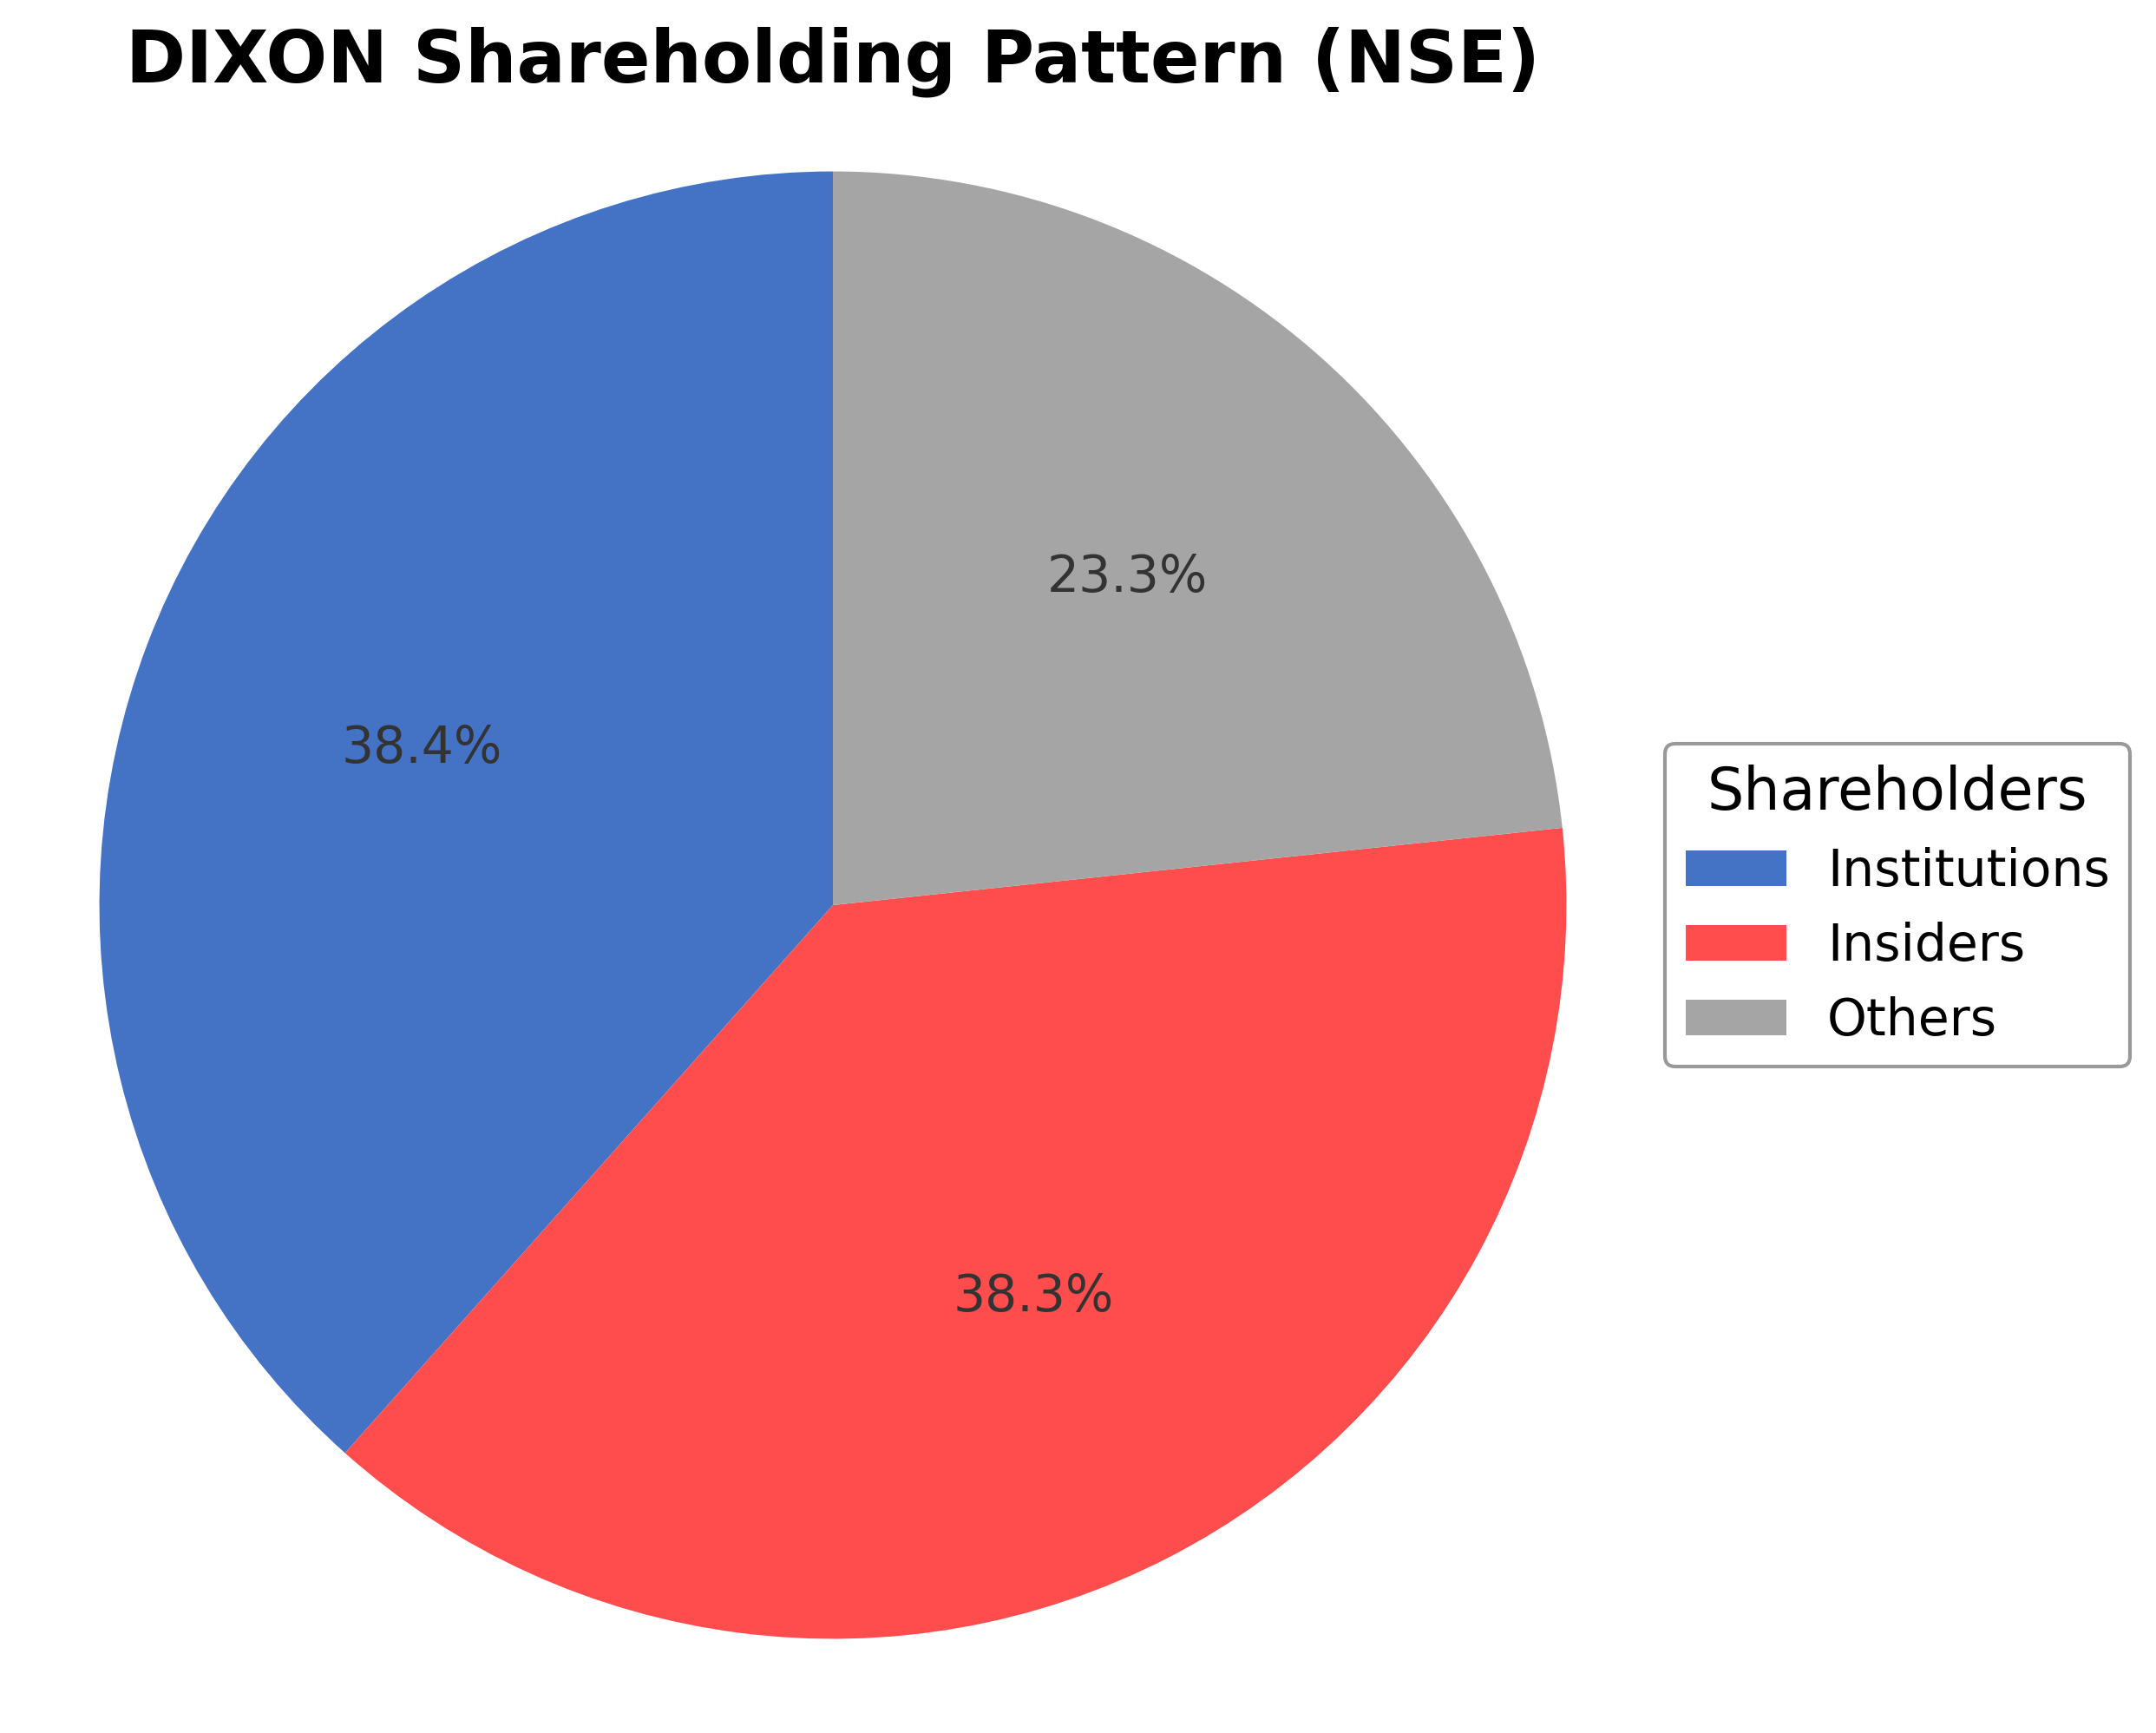
Shareholding Pattern
Sector and Industry Analysis
The Indian electronic manufacturing services (EMS) sector is valued at approximately $23.5 billion, with significant growth driven by rising domestic production and government incentives. The consumer durables segment, including mobile devices, LED TVs, lighting, and home appliances, is expanding rapidly, supported by increasing demand and technological advancements. Key players include Dixon Technologies, which holds a 3-4% market share, alongside other established manufacturers catering to both OEM and ODM segments.
Industry dynamics are shaped by strong growth in mobile and EMS segments, with companies leveraging the government’s Production Linked Incentive (PLI) scheme to scale operations and diversify product portfolios. The sector faces moderate barriers to entry due to capital intensity and technological expertise requirements, but established firms benefit from economies of scale and strategic partnerships with global brands. Competitive positioning hinges on innovation, cost optimization, and expanding manufacturing capacities to meet rising domestic and export demand.
Regulatory support through the PLI scheme has been a major catalyst, encouraging domestic manufacturing and reducing import dependence. Compliance with evolving quality and environmental standards remains critical, influencing operational costs and product development. The outlook remains positive as policy measures continue to incentivize capacity expansion and export growth, positioning the sector for sustained expansion in the medium term.
Note: Analysis synthesized from industry research, market reports, and regulatory filings. Information is subject to change based on market conditions.
Financial Ratios Dashboard
Illustrative Scenario Analysis
DCF Assumptions:
Method: Two-Stage EPS-Priority Model
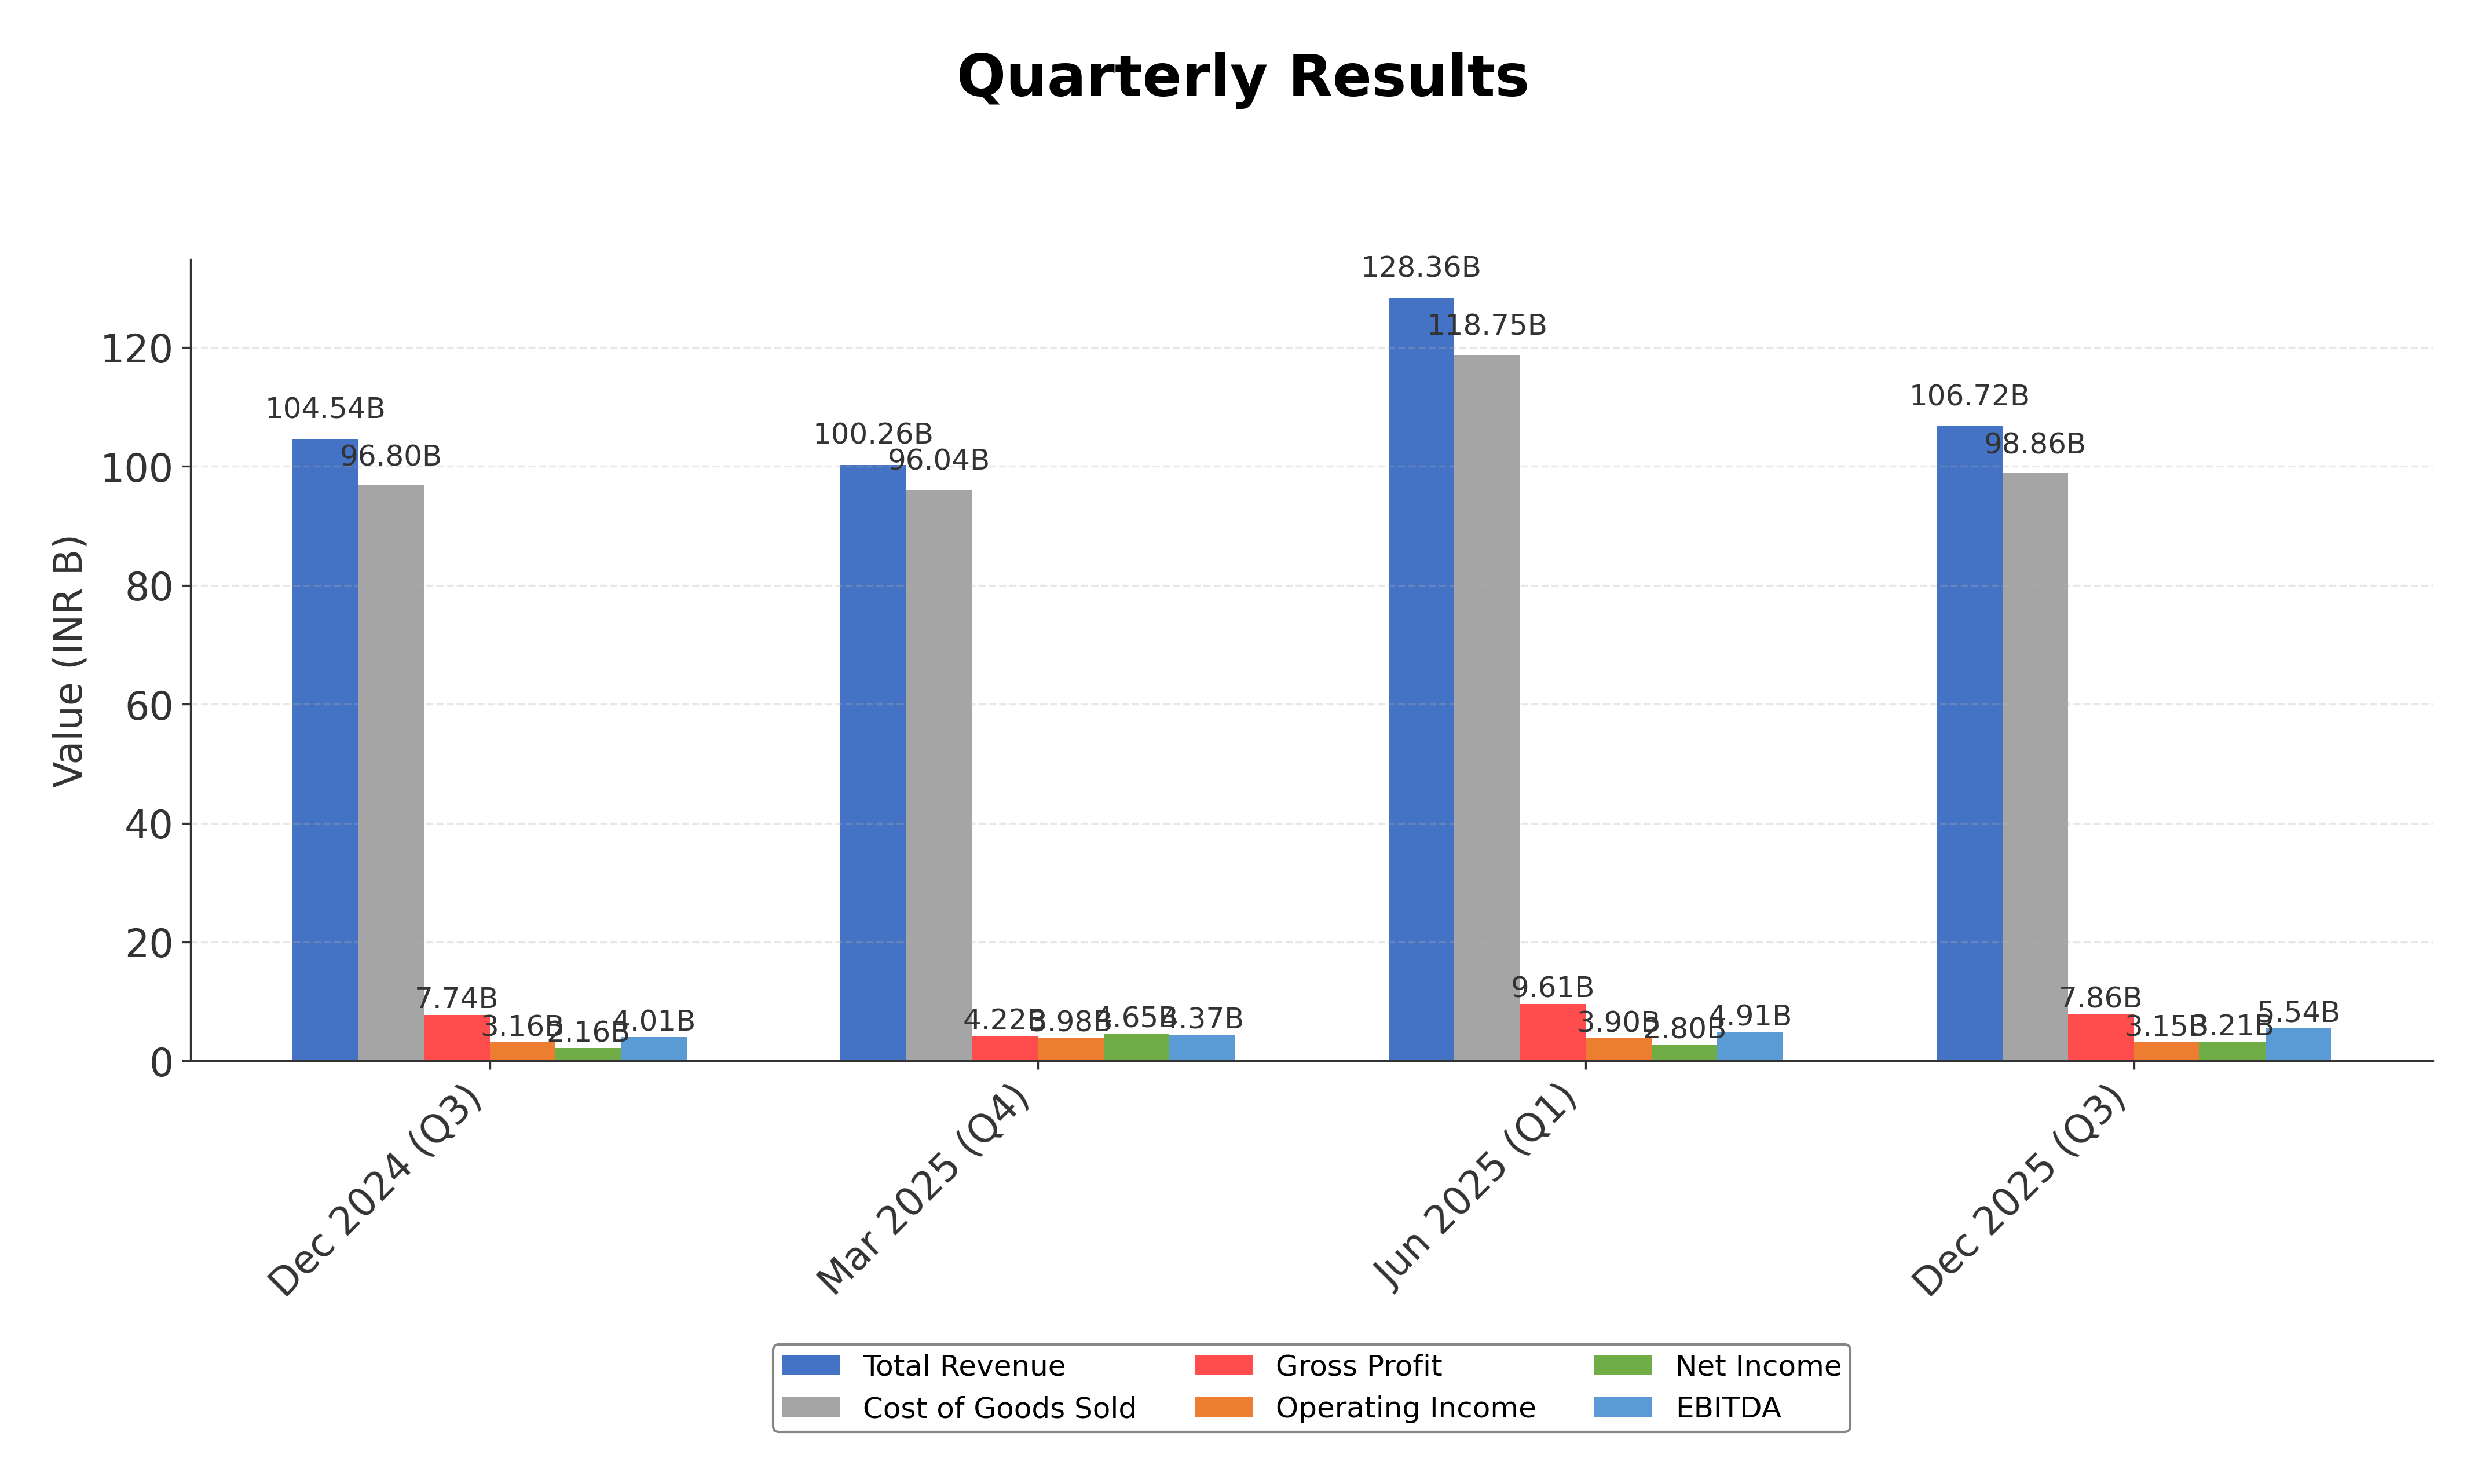
Financials
Peer Analysis
| Company Name | Market Cap | P/E Ratio | P/B Ratio | EV/EBITDA | Price to CFO |
|---|---|---|---|---|---|
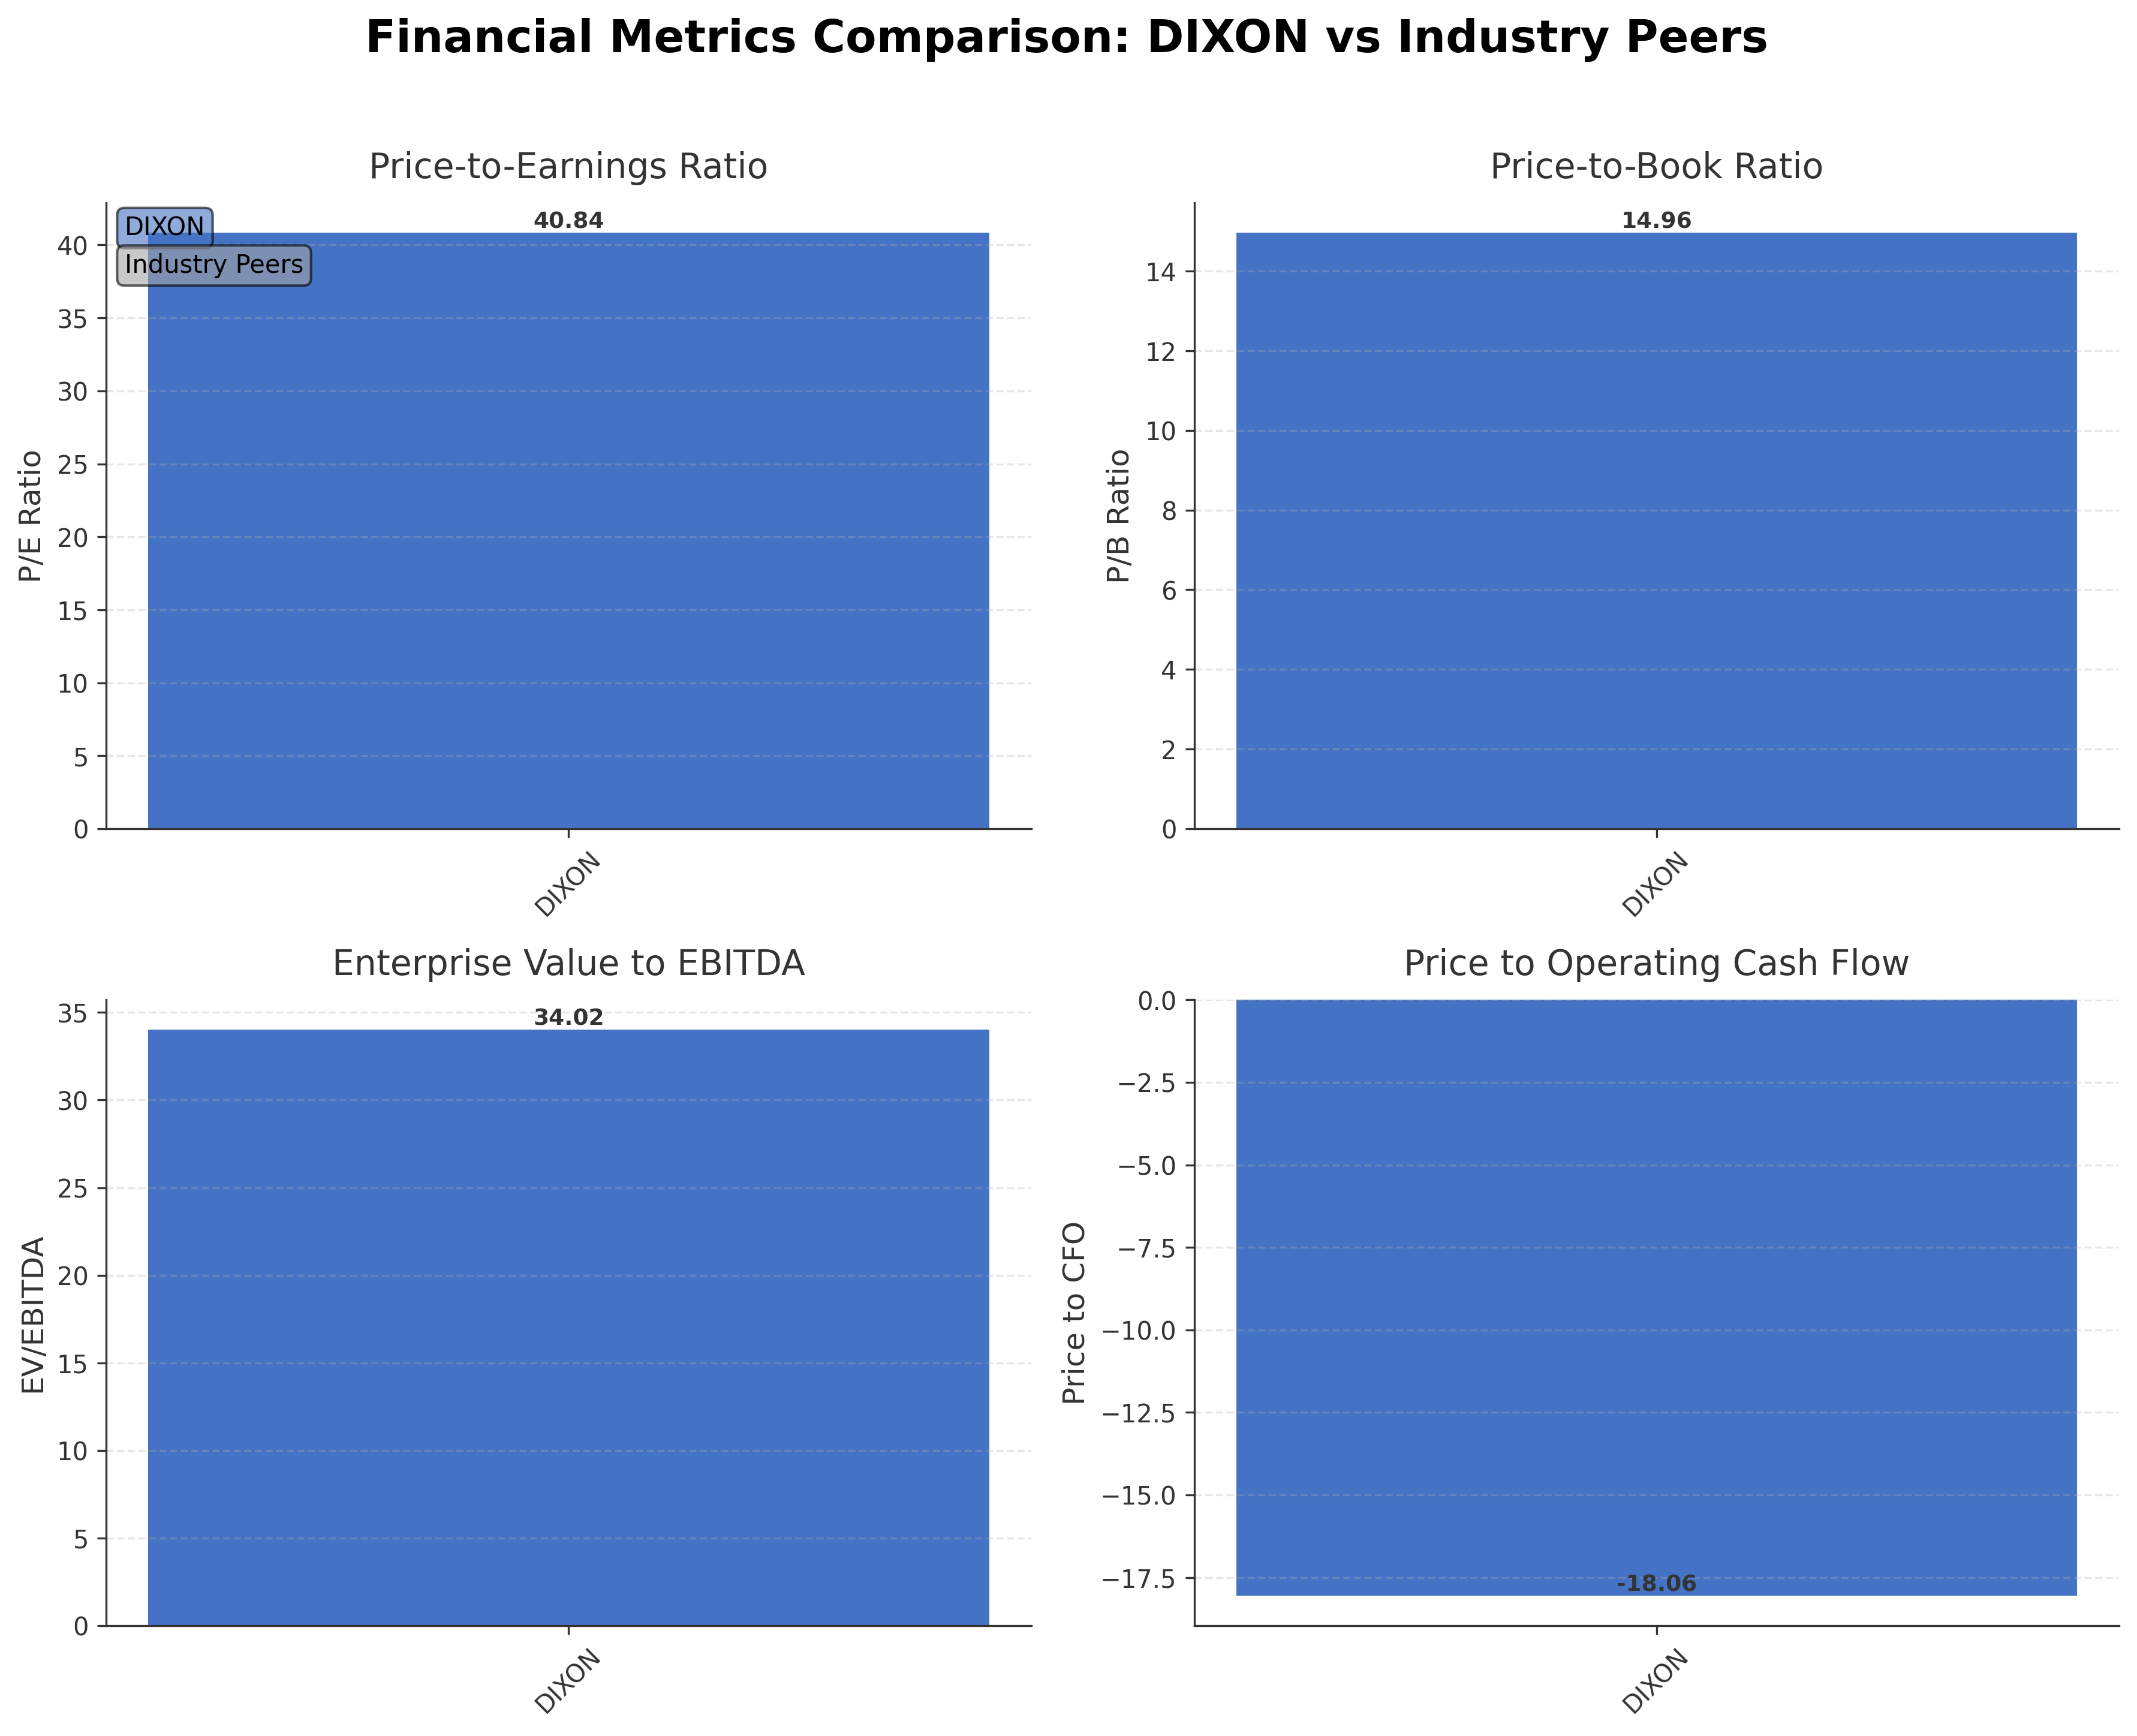
| Dixon Technologies (India) Ltd. | ₹677.65B | 40.84 | 14.96 | 34.02 | -18.06 |
Comparison Analysis: Dixon Technologies currently stands as a dominant player in the Indian consumer electronics manufacturing sector with a market capitalization of ₹677.65 billion, significantly larger than most regional peers. Its trailing P/E ratio of 40.84 and EV/EBITDA of 34.02 indicate a premium valuation relative to typical industry levels. The company’s return on equity at 31.58% reflects strong profitability and efficient capital use compared to peers. However, the elevated price-to-book ratio of 14.96 and negative price to cash flow ratio suggest market expectations of growth but also potential concerns regarding cash flow generation. Overall, Dixon’s financial metrics portray it as a well-established leader with high valuation multiples relative to its industry cohort.
Financial Metrics Comparison with Peers
Financial Statements
Comprehensive financial data including income, balance sheet, and cash flow metrics
Income Statement
| fiscal_date | 2025-03-31 | 2024-03-31 | 2023-03-31 | 2022-03-31 | 2021-03-31 |
|---|---|---|---|---|---|
| Sales | 385.93B | 176.14B | 121.73B | 106.70B | 64.48B |
| Cost Of Goods | 359.62B | 160.93B | 110.49B | 98.04B | 57.79B |
| Gross Profit | 26.32B | 15.21B | 11.25B | 8.66B | 6.69B |
| Operating Expense Selling General And Administrative | 569.50M | 465.90M | 402.30M | 359.40M | 294.60M |
| Operating Expense Other Operating Expenses | 2.55B | 1.79B | 1.14B | 956.10M | 706.90M |
| Operating Income | 12.68B | 5.42B | 4.07B | 3.02B | 2.51B |
| Non Operating Interest Income | 81.20M | 11.20M | 12.90M | 6.60M | 4.50M |
| Non Operating Interest Expense | 1.44B | 713.60M | 563.40M | 427.30M | 270.50M |
| Pretax Income | 15.70B | 4.94B | 3.45B | 2.55B | 2.17B |
| Income Tax | 3.37B | 1.19B | 897.00M | 643.80M | 572.10M |
| Net Income | 12.33B | 3.75B | 2.55B | 1.90B | 1.60B |
| Eps Basic | 182.83 | 61.64 | 43.00 | 32.29 | 27.49 |
| Eps Diluted | 180.06 | 61.27 | 42.69 | 31.98 | 26.87 |
| Basic Shares Outstanding | 59.92M | 59.66M | 59.42M | 58.90M | 58.13M |
| Diluted Shares Outstanding | 59.92M | 59.66M | 59.42M | 58.90M | 58.13M |
| Ebit | 17.14B | 5.65B | 4.01B | 2.97B | 2.44B |
| Ebitda | 15.24B | 7.21B | 5.16B | 3.80B | 2.90B |
| Net Income Continuous Operations | 15.52B | 4.84B | 3.43B | 2.55B | 2.17B |
| Minority Interests | -1.37B | -71.70M | 4.40M | -1.60M | 0.00 |
| Preferred Stock Dividends | 0.00 | 0.00 | 0.00 | 0.00 | 0.00 |
Source: Financial statements and regulatory filings
Balance Sheet
| fiscal_date | 2025-03-31 | 2024-03-31 | 2023-03-31 | 2022-03-31 | 2021-03-31 |
|---|---|---|---|---|---|
| Cash And Cash Equivalents | 2.28B | 1.98B | 2.15B | 1.76B | 636.70M |
| Accounts Receivable | 69.65B | 23.18B | 17.15B | 13.56B | 10.89B |
| Total Assets | 167.67B | 69.91B | 46.79B | 42.77B | 28.46B |
| Total Liabilities | 132.98B | 52.69B | 33.95B | 32.80B | 21.08B |
| Long Term Debt | 4.99B | 4.25B | 3.98B | 4.95B | 2.10B |
| Shareholders Equity | 34.69B | 17.22B | 12.85B | 9.97B | 7.37B |
Source: Financial statements and regulatory filings
Cash Flow Statement
| fiscal_date | 2025-03-31 | 2024-03-31 | 2023-03-31 | 2022-03-31 | 2021-03-31 |
|---|---|---|---|---|---|
| Operating Activities Net Income | 15.52B | 4.84B | 3.43B | 2.55B | 2.17B |
| Operating Activities Stock Based Compensation | 851.20M | 122.10M | 118.20M | 107.40M | 93.80M |
| Operating Activities Other Non Cash Items | 1.37B | 648.30M | 587.40M | 435.10M | 264.20M |
| Operating Activities Accounts Receivable | -30.49B | -6.03B | -3.59B | -2.66B | -5.74B |
| Operating Activities Other Assets Liabilities | -24.77B | -10.36B | 4.94B | -4.19B | -2.74B |
| Operating Activities Operating Cash Flow | -37.52B | -10.78B | 5.48B | -3.76B | -5.95B |
| Investing Activities Capital Expenditures | 437.60M | 158.60M | 109.80M | 32.50M | 2.20M |
| Investing Activities Net Acquisitions | -723.50M | N/A | N/A | N/A | 0.00 |
| Investing Activities Purchase Of Investments | -2.49B | 0.00 | -428.50M | -503.70M | -957.90M |
| Investing Activities Sale Of Investments | 1.90M | 385.50M | 1.36B | 5.80M | 3.90M |
| Investing Activities Other Investing Activity | -226.30M | 39.70M | -62.60M | -52.10M | -1.51M |
| Investing Activities Investing Cash Flow | -3.00B | 583.80M | 976.60M | -517.50M | -953.31M |
| Financing Activities Long Term Debt Issuance | 2.46B | 39.50M | 333.60M | 2.25B | 708.20M |
| Financing Activities Long Term Debt Payments | -1.94B | -302.40M | -1.96B | -80.20M | -19.80M |
| Financing Activities Short Term Debt Issuance | 57.70M | -13.00M | -1.15B | 852.60M | -10.50M |
| Financing Activities Common Stock Issuance | 1.40B | 468.90M | 335.70M | 642.00M | 268.60M |
| Financing Activities Common Dividends | -329.10M | -178.60M | -118.70M | -58.60M | N/A |
| Financing Activities Financing Cash Flow | 1.65B | 222.60M | -2.56B | 3.61B | 946.50M |
| End Cash Position | 2.31B | 2.00B | 2.17B | 1.76B | 638.40M |
| Free Cash Flow | 2.10B | -1.20M | 2.65B | -1.48B | 19.40M |
| Financing Activities Other Financing Charges | N/A | 208.20M | N/A | N/A | N/A |
Source: Financial statements and regulatory filings
Technical Analysis
Key Insights
- Dixon Technologies is currently in a consolidation phase with price action showing a series of lower highs and support near ₹10,800, indicating a cautious trend direction.
- Key support levels are identified around ₹10,500 and ₹9,600, while resistance is observed near ₹11,500 and the 50-day moving average at ₹10,517.
- The stock is trading below its 200-day moving average of ₹13,645, with the 50-day moving average also acting as a near-term resistance level.
- Momentum indicators show RSI near 45, suggesting neutral momentum; MACD is slightly bearish with a recent crossover below the signal line; Stochastic oscillator is in the mid-range indicating no extreme conditions.
- Across daily, weekly, and monthly timeframes, the stock exhibits mixed signals with short-term weakness but longer-term support levels intact.
- Potential market scenarios include a test of support near ₹10,500 with a possible rebound if volume increases, or further downside pressure if support breaks, in line with mixed momentum indicators.
Trending News
1. Headline: How Dixon Became India’s Invisible Manufacturing Giant
Summary: Walk into an electronics store and pick up a TV, a phone, or a washing machine.
Sentiment: neutral
2. Headline: Stay Informed with MarketsMojo News: Stock Market Insights, Portfolio Tracking, Alerts, and Expert Analyses
Summary: Latest news on Stocks in Action, Trending Stocks, Stock Analysis, Result Analysis, Corporate News, Stock Market News, IPOs, Mutual Funds, Global Markets, and Investment Ideas at MarketsMojo. Enhance your financial decisions with insightful stock market analysis, seamless portfolio tracking, ...
Sentiment: neutral
3. Headline: EMS Stock That Manufactures Vivo’s Smartphones to Buy Now for an Upside of 24%; Do You Own It?
Summary: Synopsis:-Citing smartphone volume ... into the stock. Shares of India’s largest EMS company are back in the spotlight, as brokerage re-rates with two familiar headwinds refusing to fade: surging global memory chip prices and a joint venture approval that remains stuck in regulatory limbo. With a market capitalization of Rs. 67,957 crore, the shares of Dixon Technologies (India) Ltd...
Sentiment: neutral
4. Headline: Dixon Technologies: From Rs 18,472 to Rs 9,605 in Six Months: Here Is What Actually Went Wrong
Summary: The business is not broken. But three things hit simultaneously and the market was not priced for even one of them.
Sentiment: neutral
5. Headline: Dixon Technologies (India) Ltd is Rated Hold
Summary: Dixon Technologies (India) Ltd is rated 'Hold' by MarketsMojo. This rating was last updated on 03 Nov 2025, reflecting a change from the previous 'Buy' rating. However, all fundamentals, returns, and financial metrics discussed here are current as of 30 April 2026, providing investors with the latest insight into the stock...
Sentiment: neutral
Recent Updates
News Summary
As of 4 May 2026. Dixon Technologies (India) Ltd has solidified its position as a key contract manufacturer in India's electronics sector, producing a diverse range of consumer electronics including televisions, mobile phones, and washing machines. The company has expanded its business segments, notably increasing the mobile and EMS division's contribution to 84% of revenue in 9M FY25 from 43% in FY23, reflecting rapid growth in mobile phone manufacturing. Despite a recent stock price decline from ₹18,472 to ₹9,600 over six months, the underlying business fundamentals remain strong with consistent profit growth and a robust return on equity exceeding 30%. Institutional investors hold a significant portion of shares, although promoter holdings have decreased slightly over the past three years. The company has also entered a joint venture to design and manufacture wireless audio solutions, indicating strategic diversification. Financially, Dixon reported TTM revenue of approximately ₹486.5 billion and net income of ₹15.8 billion, with a current ratio near 1.04 and manageable debt levels, supporting operational stability.
News Sentiment
The overall sentiment from recent updates is mixed but leans toward neutral with cautious optimism. Positive aspects include strong revenue growth, expanding mobile EMS business, and strategic initiatives such as the joint venture in wireless audio solutions. However, the significant stock price decline and slight reduction in promoter holdings introduce elements of caution. Institutional investors have maintained substantial stakes, reflecting confidence in the company’s long-term prospects despite near-term volatility. The balanced sentiment underscores the importance of monitoring market conditions and operational execution going forward.
Source List
- https://digest.groww.in/p/how-dixon-became-indias-invisible
- https://www.screener.in/company/DIXON/consolidated/
- https://www.alphaspread.com/security/nse/dixon/investor-relations
- https://m.economictimes.com/markets/stocks/news/midcap-meltdown-12-stocks-slide-up-to-50-from-52-week-highs-fiis-cut-stakes/dixon-technologies-india/slideshow/130437303.cms
Analytical Overview
Analysis Summary
Dixon Technologies’ valuation metrics, including a trailing P/E of 40.84 and forward P/E of 58.91, are elevated compared to the consumer electronics industry average P/E of approximately 40.8, indicating a premium pricing that reflects growth expectations but also heightened valuation risk. The company’s revenue growth of 2.1% quarterly and strong cash flow trends, including a positive levered free cash flow of ₹10.95 billion TTM despite negative operating cash flow, suggest ongoing operational investments and cash management dynamics. Financial health appears stable with a debt-to-equity ratio of 0.30 and a current ratio slightly above 1, indicating adequate liquidity and manageable leverage. Sector-specific challenges include intense competition and margin pressures typical of EMS businesses, while opportunities arise from India’s increasing focus on domestic manufacturing and expanding mobile phone production. Considering India-specific factors, the regulatory environment supports local manufacturing with initiatives like 'Make in India,' and consumer trends favor increased electronics consumption, providing a favorable backdrop for Dixon’s growth.
Overall Business and Market Assessment
Supporting Factors: Dixon’s robust return on equity exceeding 31%, strategic expansion in the mobile EMS segment contributing 84% of recent revenues, and a strong market capitalization reflecting market confidence
Risk Factors: the high valuation multiples, recent stock price volatility with a nearly 50% decline from the 52-week high, and slight promoter shareholding reduction which may affect governance perception
SWOT Analysis
Strengths
- Dixon Technologies has a strong return on equity of over 31%.
- The company holds a leading position in India's electronics manufacturing services sector.
- Robust market capitalization of approximately ₹678 billion supports financial stability.
- Strategic joint ventures and diversification into wireless audio solutions enhance growth prospects.
Weaknesses
- High valuation multiples with a P/B ratio near 15 may limit upside potential.
- Profit margins remain modest with net margin around 3.25%.
- Operating cash flow is negative despite positive free cash flow, indicating cash management challenges.
- Promoter shareholding has decreased over recent years, potentially impacting governance.
Opportunities
- Growing domestic demand for consumer electronics under 'Make in India' initiative.
- Expansion in mobile phone manufacturing segment which now accounts for 84% of revenue.
- Increasing adoption of smart home appliances and IoT devices in India.
- Potential to capitalize on regulatory support for local manufacturing and exports.
Threats
- Intense competition in the EMS and consumer electronics sectors.
- Volatility in global supply chains and raw material prices.
- Regulatory delays affecting joint ventures and business expansions.
- Market sentiment impacted by recent stock price declines and institutional investor caution.
Company Description
Dixon Technologies (India) Ltd. is a prominent electronic manufacturing services provider, primarily engaged in the development, production, and distribution of consumer electronics. The company's operations cover a wide array of product segments including LED televisions, washing machines, lighting products, mobile phones, and other home appliances. Dixon Technologies plays a critical role in the manufacturing ecosystem by offering complete solutions from design to delivery. This enables its clients, which include major consumer electronics brands, to bring their products to market efficiently and cost-effectively. The company is a key player in India's electronics sector, gaining significance due to the country's increasing demand for manufactured goods and the push for domestic production under initiatives like "Make in India." With a strong emphasis on technological innovation and quality, Dixon continues to expand its capabilities, making it a vital component of the modern electronics supply chain.