
Dalmia Bharat Sugar and Industries Ltd (DALMIASUG)
Stock Analysis Report
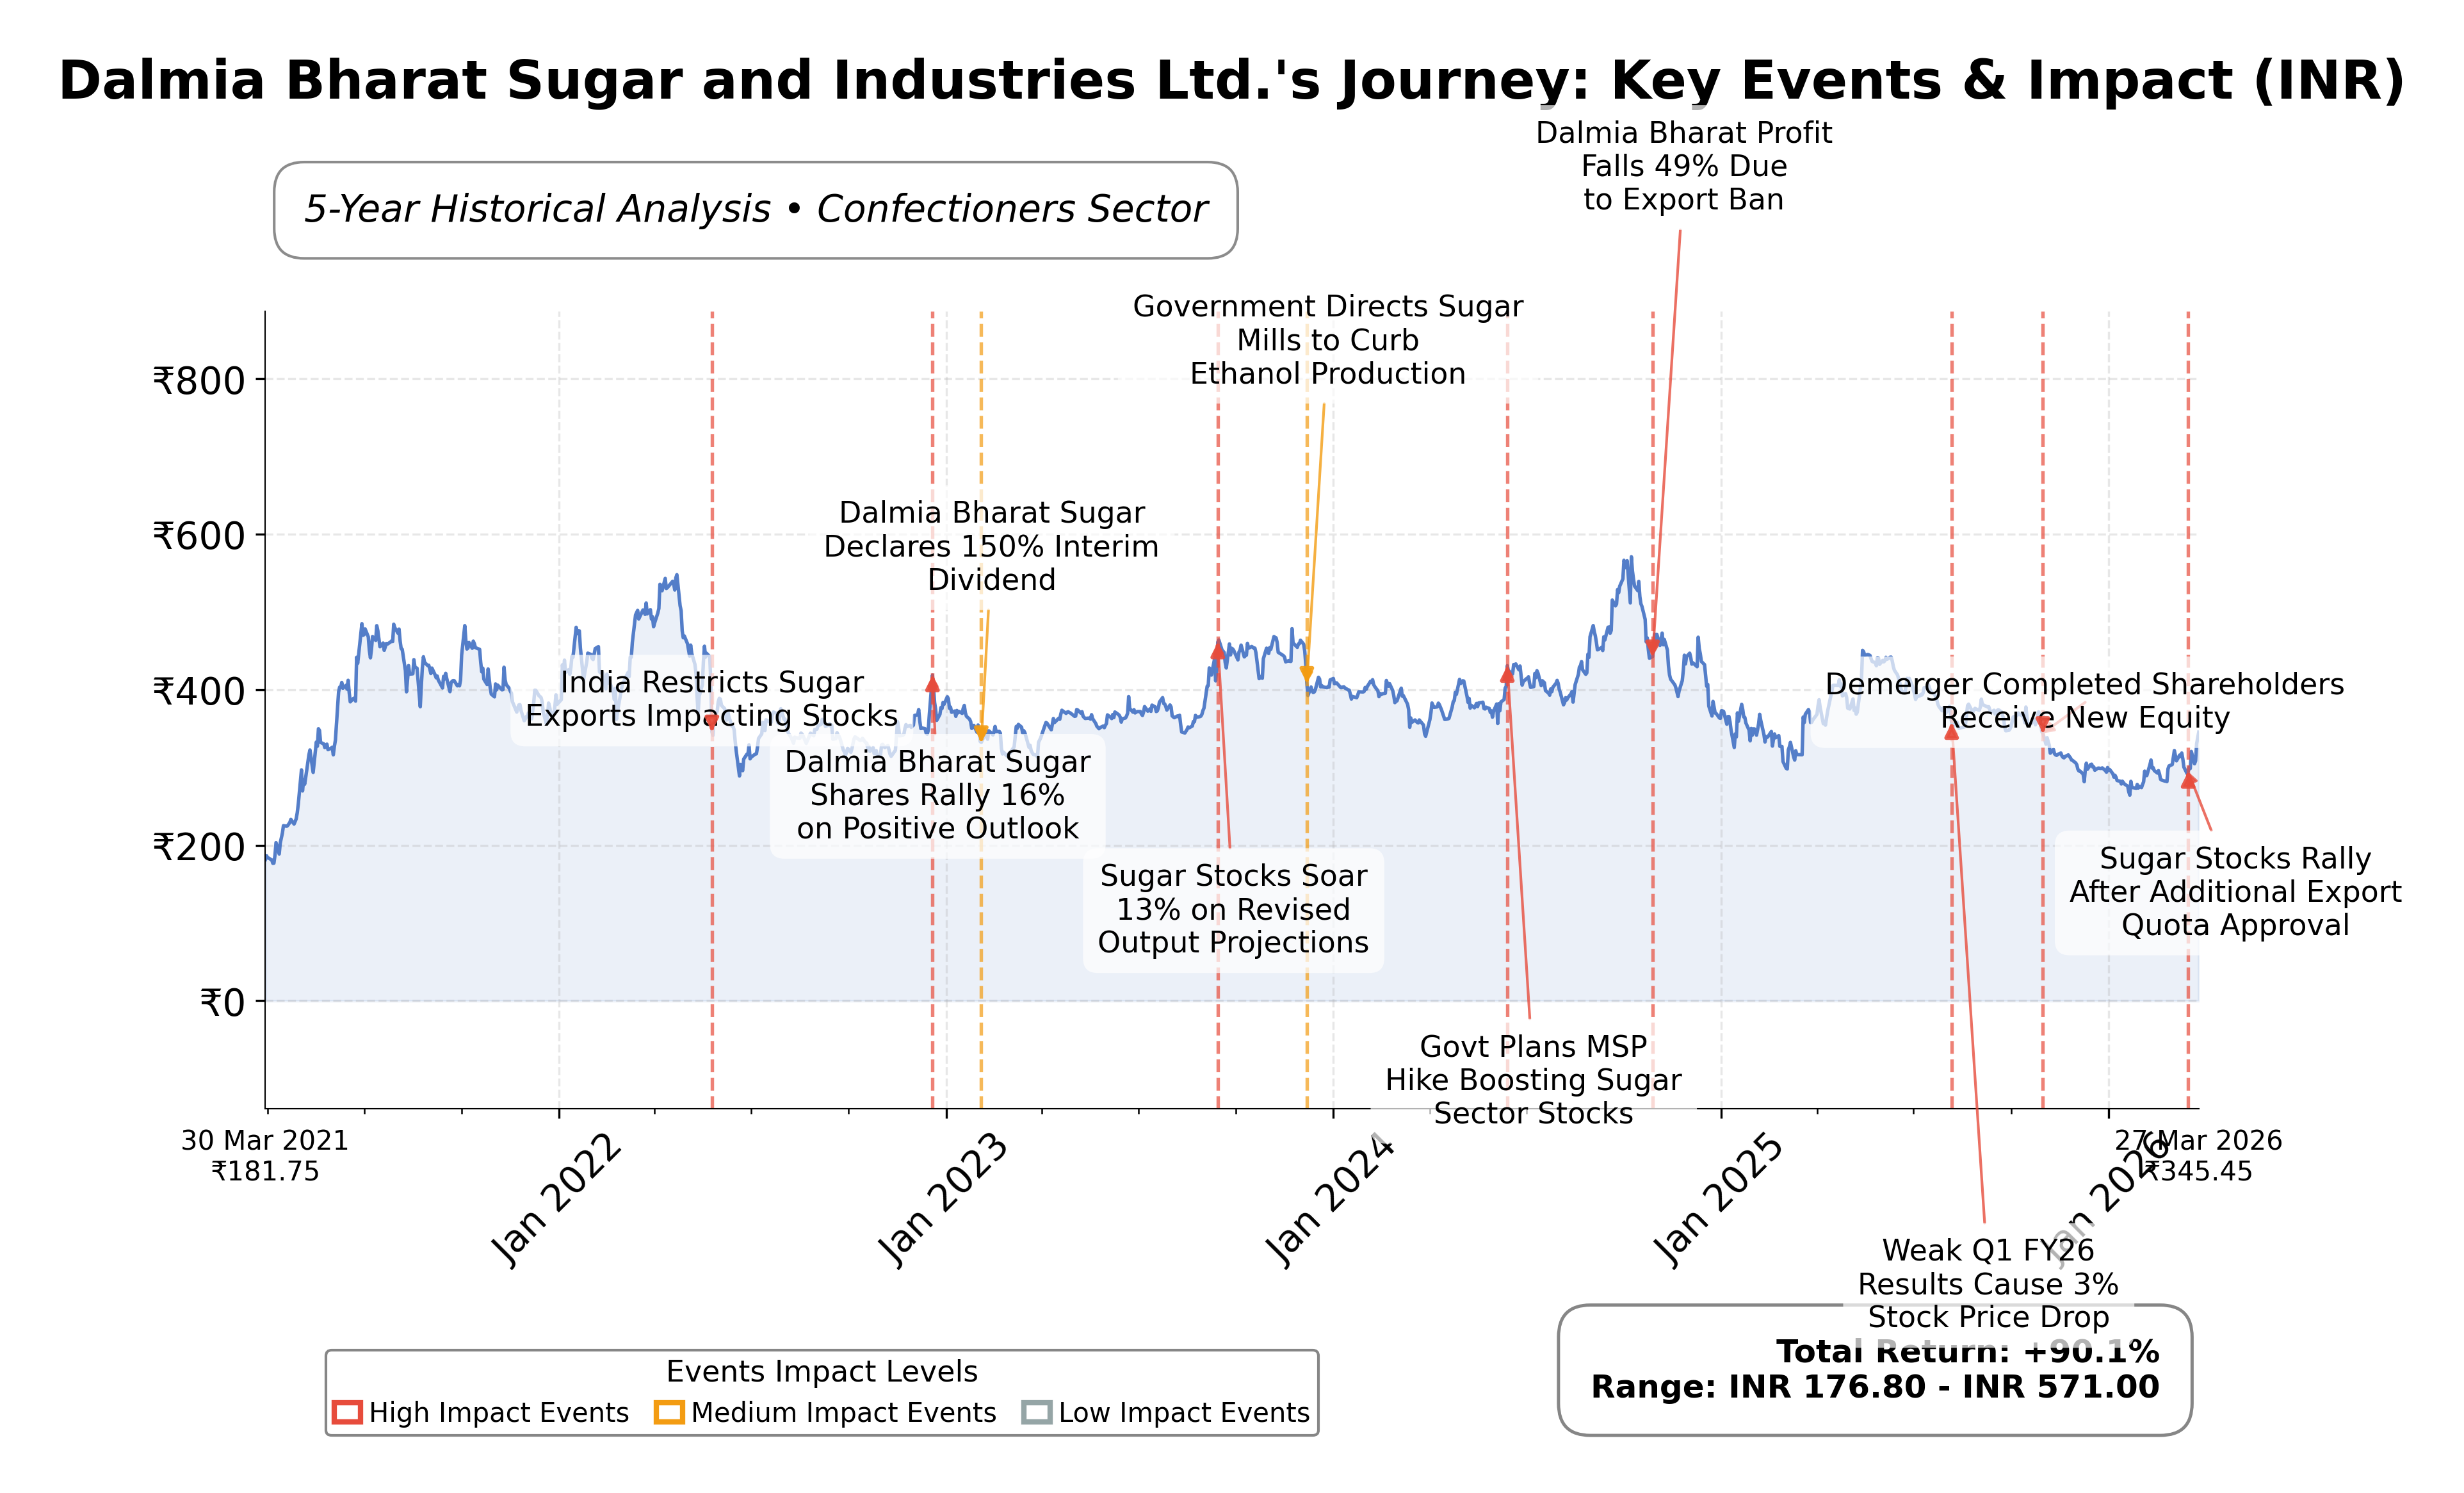
Stock Journey
Key Positives and Key Risks
Pros
- Trailing P/E ratio of 7.90 indicates attractive valuation relative to industry peers.
- Current ratio of 6.29 and total cash of ₹9.91 billion demonstrate strong liquidity and financial stability.
- Year-over-year earnings growth of 17.1% reflects positive profitability momentum.
Cons
- Quarterly revenue declined by 17.1%, signaling potential operational challenges.
- Low institutional ownership at 0.41% may limit external governance and market liquidity.
- Stock price is 17.76% below its 52-week high, indicating downside risk.
Disclosure: This information is for general awareness and does not constitute investment advice
Report Summary
Dalmia Bharat Sugar and Industries Ltd. operates primarily in the sugar manufacturing sector within India, producing sugar and its by-products such as ethanol and industrial alcohol. The company integrates power generation through cogeneration plants, positioning itself in the agribusiness and renewable energy sectors. Its operations contribute significantly to rural employment and the agricultural economy, reflecting a diversified and sustainability-focused business model in the consumer defensive sector.
Financially, the company exhibits a market capitalization of approximately â¹26.75 billion and trades at a trailing P/E ratio of 7.90, with a forward P/E of 9.12 and a PEG ratio of 0.47, indicating valuation metrics below industry averages. The firm reported a revenue of â¹36.64 billion with a profit margin near 9.6%, operating margin of 10.95%, and return on equity of 11.96%. The balance sheet shows strong liquidity with a current ratio exceeding 6.2 and total cash of â¹9.91 billion against total debt of â¹5.47 billion, reflecting solid financial health and cash flow generation.
Technical indicators reveal the stock price at â¹382.15, above the 50-day moving average but below the 200-day moving average, with a beta of 0.49 suggesting lower volatility relative to the market. Recent strategic initiatives include leveraging ethanol production amid rising crude oil prices, enhancing revenue streams. Leadership changes were not prominently noted. Strengths include integrated operations and strong liquidity, while risks involve quarterly revenue contraction and sector cyclicality. These factors are pertinent for market participants assessing the stock's positioning.
In comparison with regional peers such as Triveni Engineering & Industries Ltd., Balrampur Chini Mills Ltd., and Shree Renuka Sugars Ltd., Dalmia Bharat Sugar demonstrates a lower P/E ratio and EV/EBITDA multiple, indicating relative valuation attractiveness. Its return on equity aligns closely with peers, though market capitalization is smaller. Peers exhibit higher price-to-book ratios and more volatile cash flow metrics. This peer context provides insight into competitive positioning within the Indian sugar industry.
Dalmia Bharat Sugar and Industries Ltd. navigates a complex industry landscape characterized by commodity price fluctuations and regulatory dynamics. Recent achievements include strong cash flow and dividend yield improvements, while challenges persist in revenue growth and market volatility. The company stands at a pivotal moment balancing traditional sugar production with renewable energy opportunities. The current data suggests a stance that may favor monitoring developments closely, considering both valuation and operational factors without explicit directional bias.
Company and Industry Overview
Company Basics
Price Performance
Company Size
Shareholding Pattern
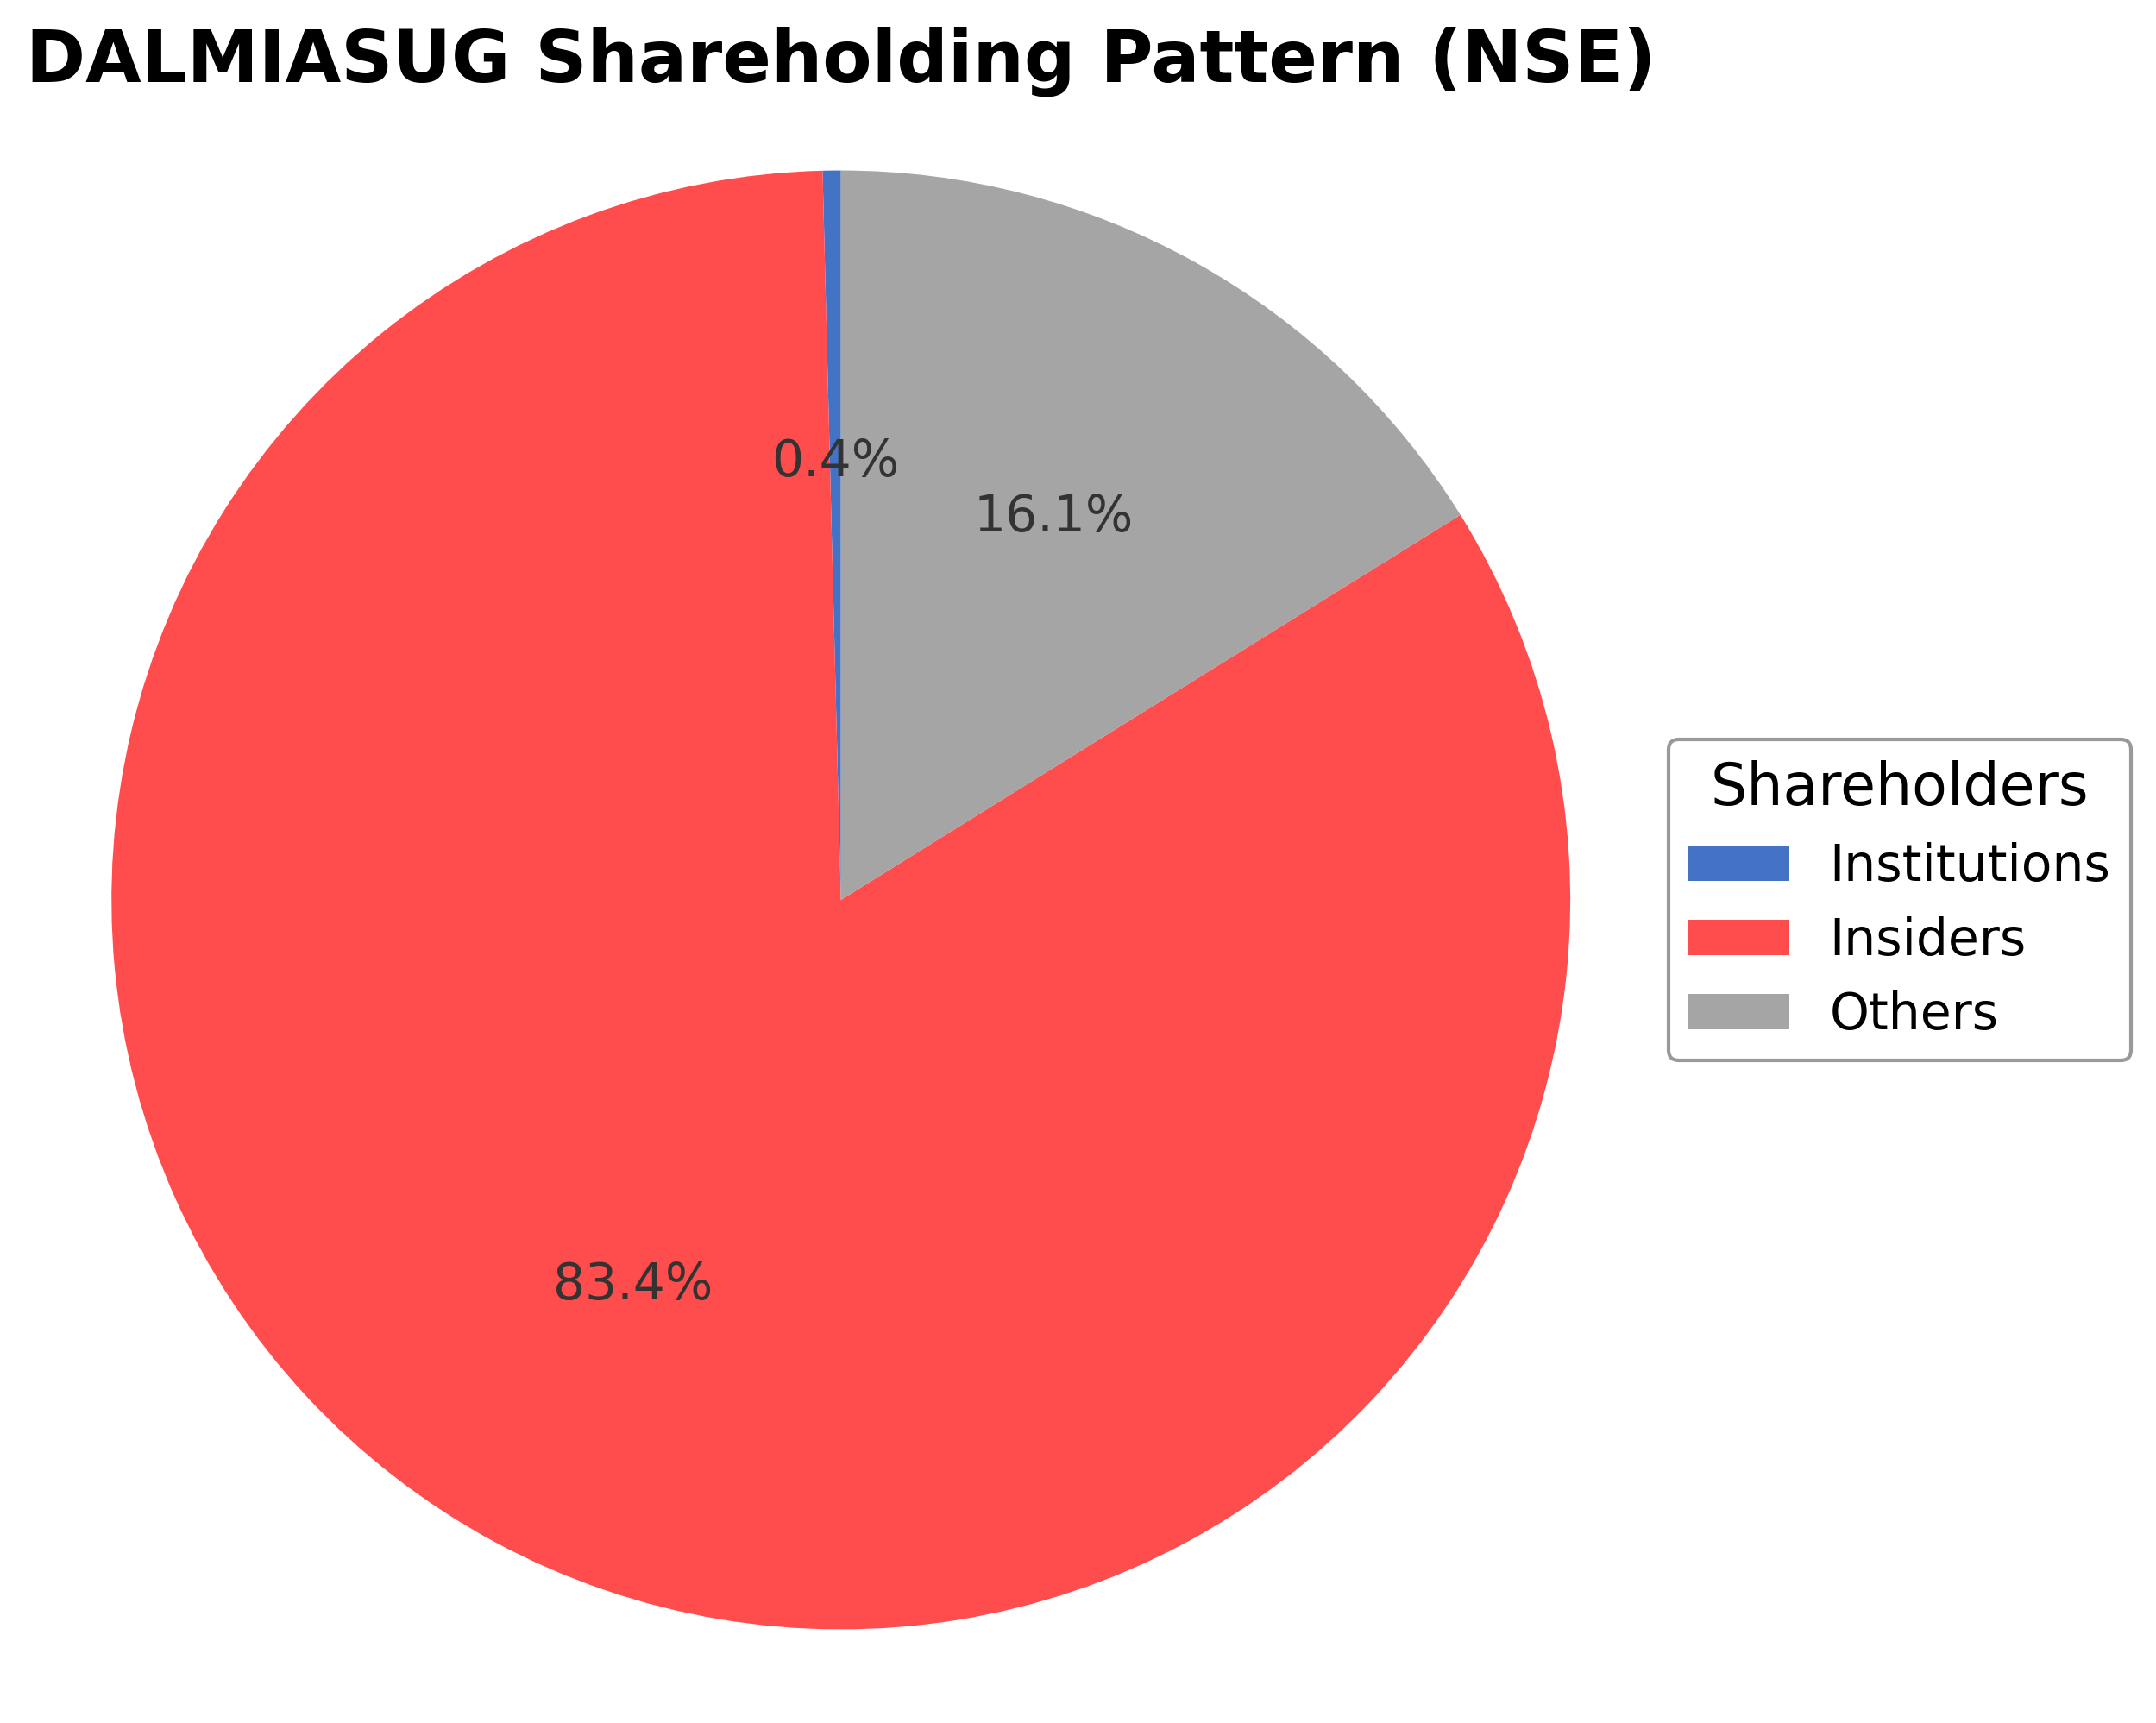
The shareholding structure of Dalmia Bharat Sugar and Industries Ltd. is predominantly controlled by insiders, including promoters and executives, holding approximately 83.45% of the shares. Institutional investors maintain a minimal stake of around 0.41%, while public shareholders account for about 16.14%. Over the past 12 to 24 months, there have been no significant shifts in major ownership positions, indicating stable insider control. Institutional accumulation appears limited, with no notable increases or decreases from major funds reported recently. This ownership pattern suggests a governance framework strongly influenced by promoters, with limited external institutional influence, potentially affecting strategic decisions and corporate actions in alignment with promoter interests. Market sentiment appears cautiously balanced given the low institutional participation and concentrated insider holdings.
Sector and Industry Analysis
Dalmia Bharat Sugar and Industries Ltd. (DALMIASUG) operates primarily within the Indian sugar and allied industries sector, a vital segment of the broader agribusiness and FMCG ecosystem. The sugar sector in India is one of the largest globally, with India consistently ranking as the top or second-largest sugar producer worldwide. The market size is substantial, driven by domestic consumption, export potential, and by-product utilization such as ethanol and power generation from bagasse. Growth trajectory is influenced by cyclical agricultural output, government policies on minimum support prices (MSP), and increasing demand for ethanol blending in fuels. Key players alongside Dalmia Bharat include Bajaj Hindusthan Sugar, Shree Renuka Sugars, and Balrampur Chini Mills, all competing in a fragmented but capital-intensive market.
Industry trends in sugar manufacturing are increasingly shaped by technological advancements in crop yield enhancement, mechanization of harvesting, and process efficiencies in sugar extraction and refining. There is a notable shift towards diversification into ethanol production, driven by government mandates to increase ethanol blending in petrol to reduce import dependence and carbon emissions. Consumer behavior indirectly impacts the industry through changing dietary patterns and health consciousness, which have led to a gradual rise in demand for alternative sweeteners and low-calorie products, pressuring traditional sugar consumption growth. Emerging opportunities include bio-energy generation from sugarcane by-products and expansion into specialty sugars and organic variants, which cater to niche markets domestically and internationally.
The regulatory landscape is complex and highly influential on the sector’s economics. The Indian government regulates sugar production through mechanisms such as MSP for sugarcane, sugar export-import controls, and ethanol pricing policies. Compliance with environmental regulations related to effluent treatment and renewable energy generation is increasingly stringent. Policy impacts are significant, with subsidies and support schemes for ethanol production incentivizing capacity expansion, while export restrictions or quotas can create volatility in domestic sugar prices. Additionally, state-level regulations on cane pricing and procurement add layers of complexity, affecting profitability and operational planning for companies like Dalmia Bharat.
Competitive dynamics in the sugar industry are characterized by moderate to high fragmentation with numerous regional players, but a few large integrated companies dominate market share through economies of scale and backward integration into sugarcane farming. Barriers to entry include high capital expenditure requirements for setting up mills and distilleries, access to sugarcane supply, and regulatory approvals. Competitive positioning hinges on operational efficiency, cane procurement strategies, product diversification (sugar, ethanol, power), and geographic footprint. Dalmia Bharat’s integrated model, combining sugar manufacturing with ethanol and power generation, provides a competitive edge by mitigating commodity price risks and enhancing revenue streams. However, competition remains intense due to cyclical raw material availability and pricing pressures from government policies.
Note: Analysis synthesized from industry research, market reports, and regulatory filings. Information is subject to change based on market conditions.
Illustrative Scenario Analysis
DCF Assumptions:
Method: Two-Stage EPS-Priority Model
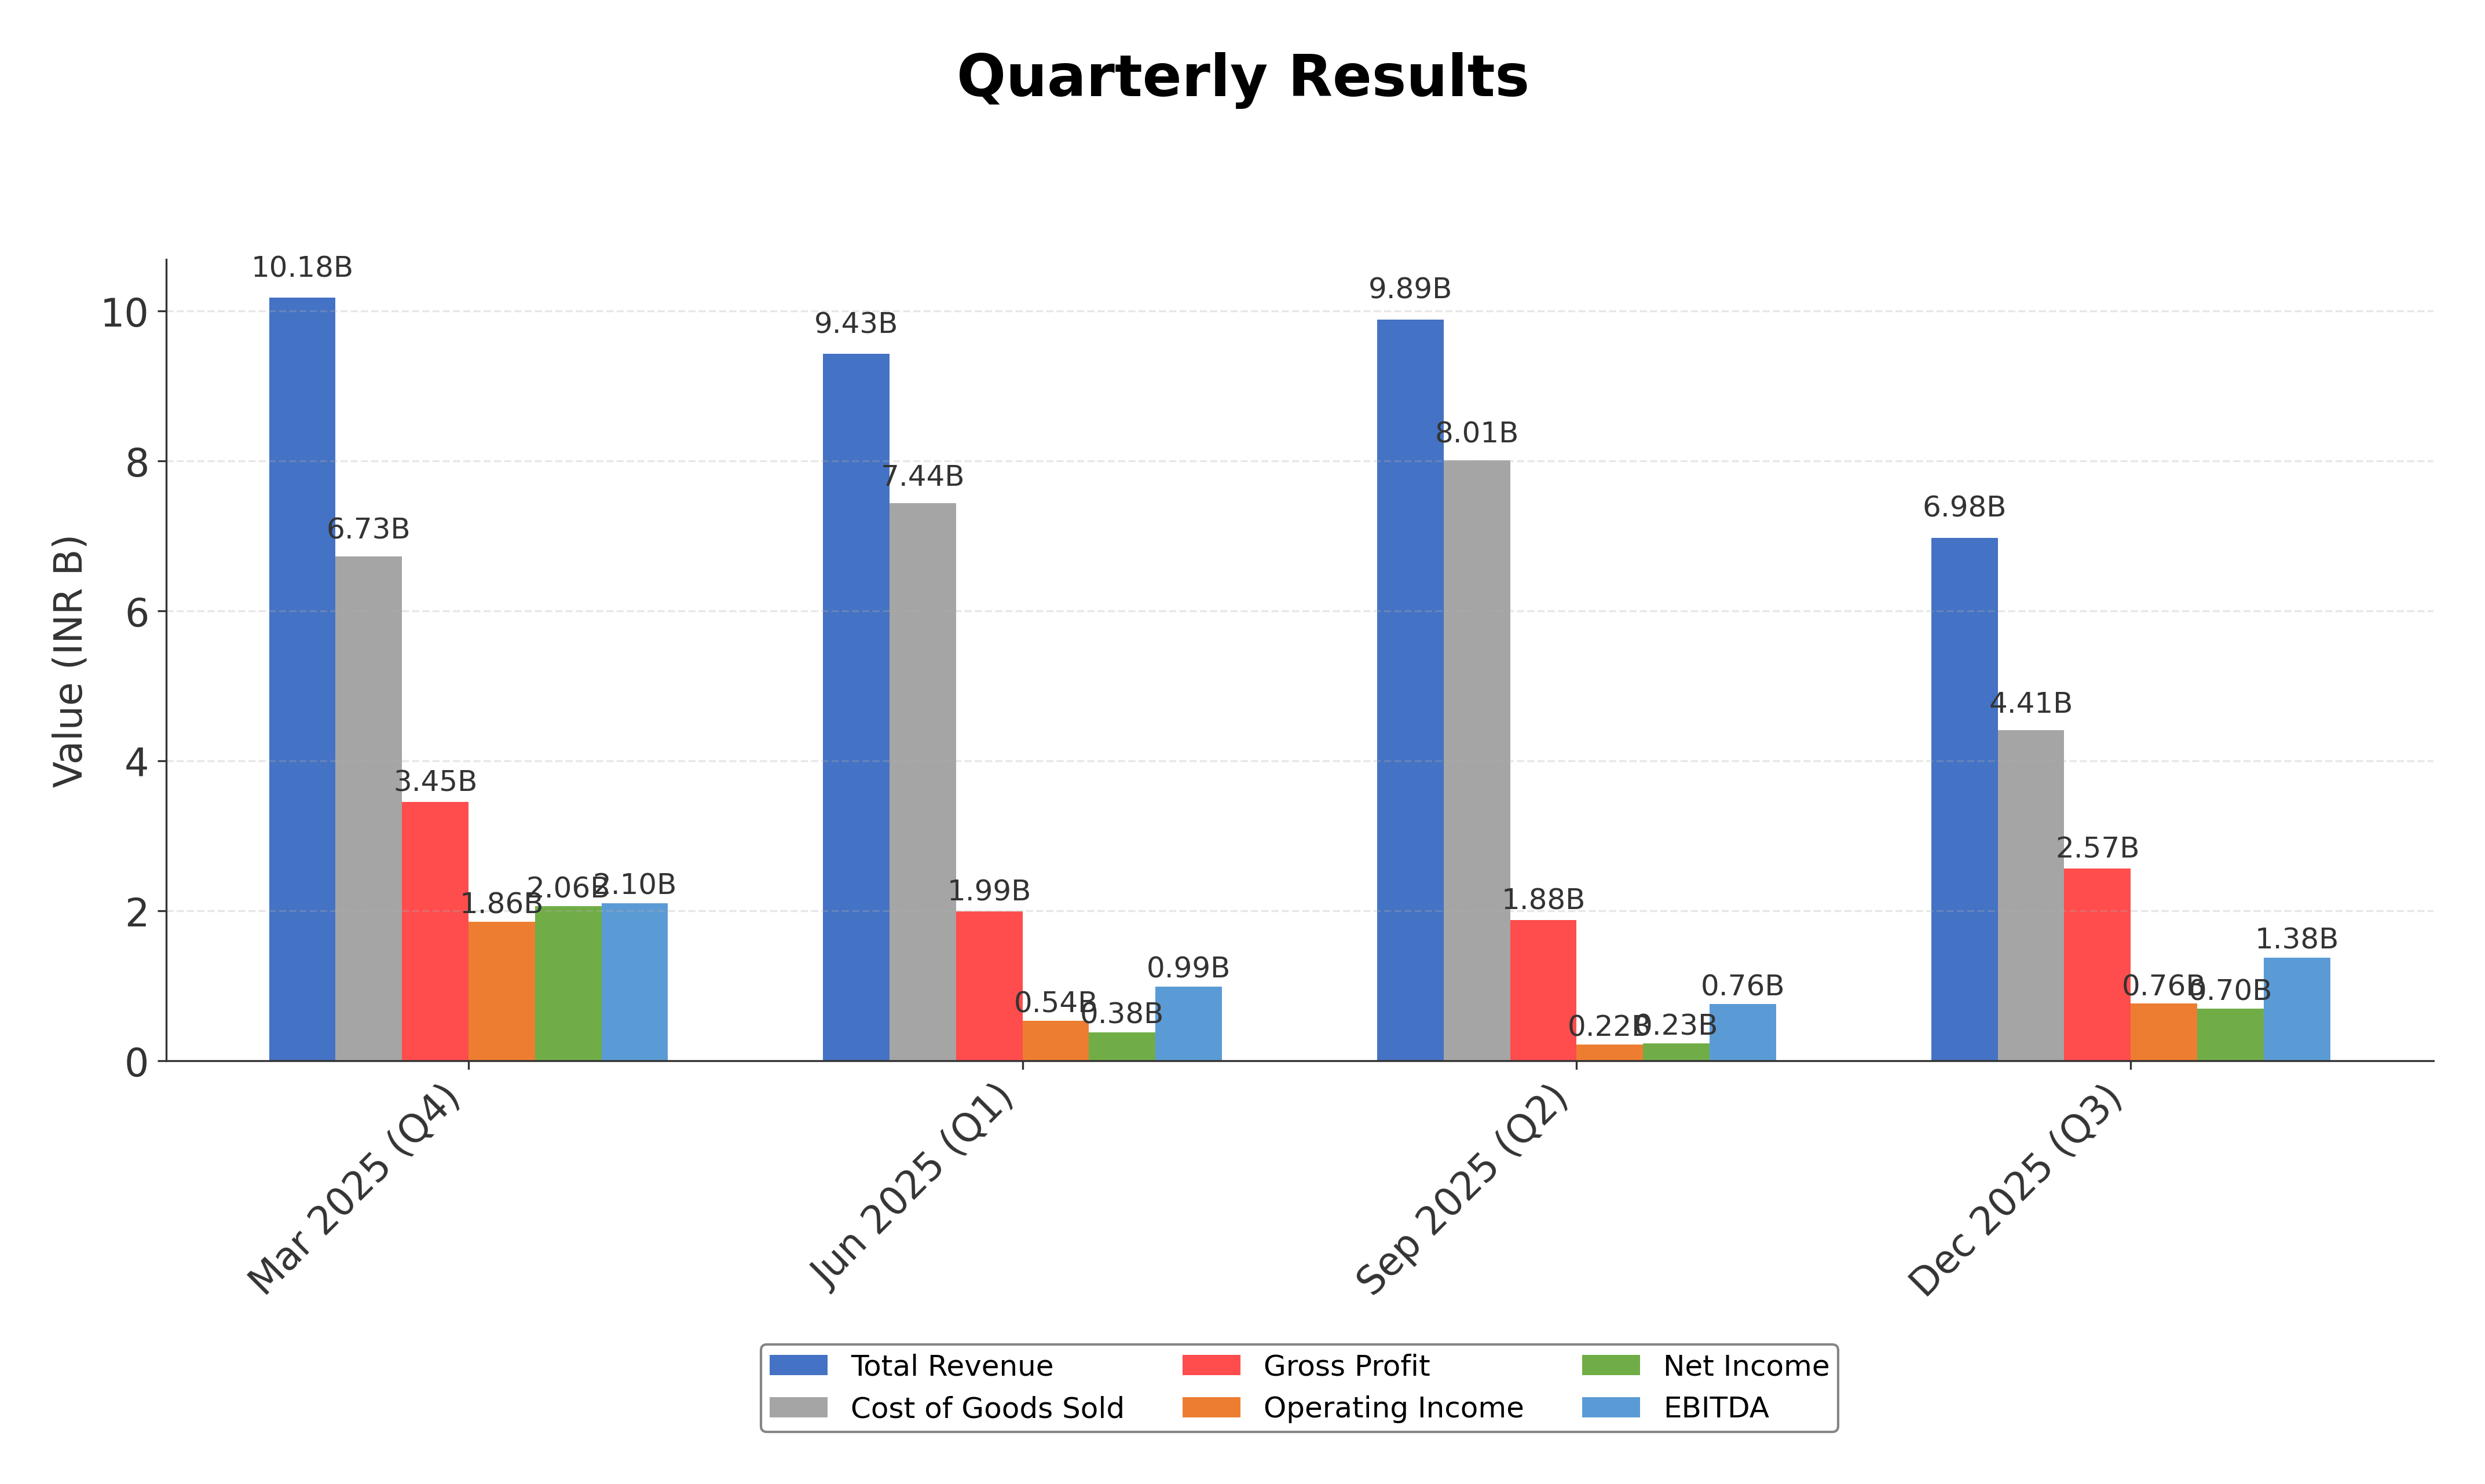
Financials
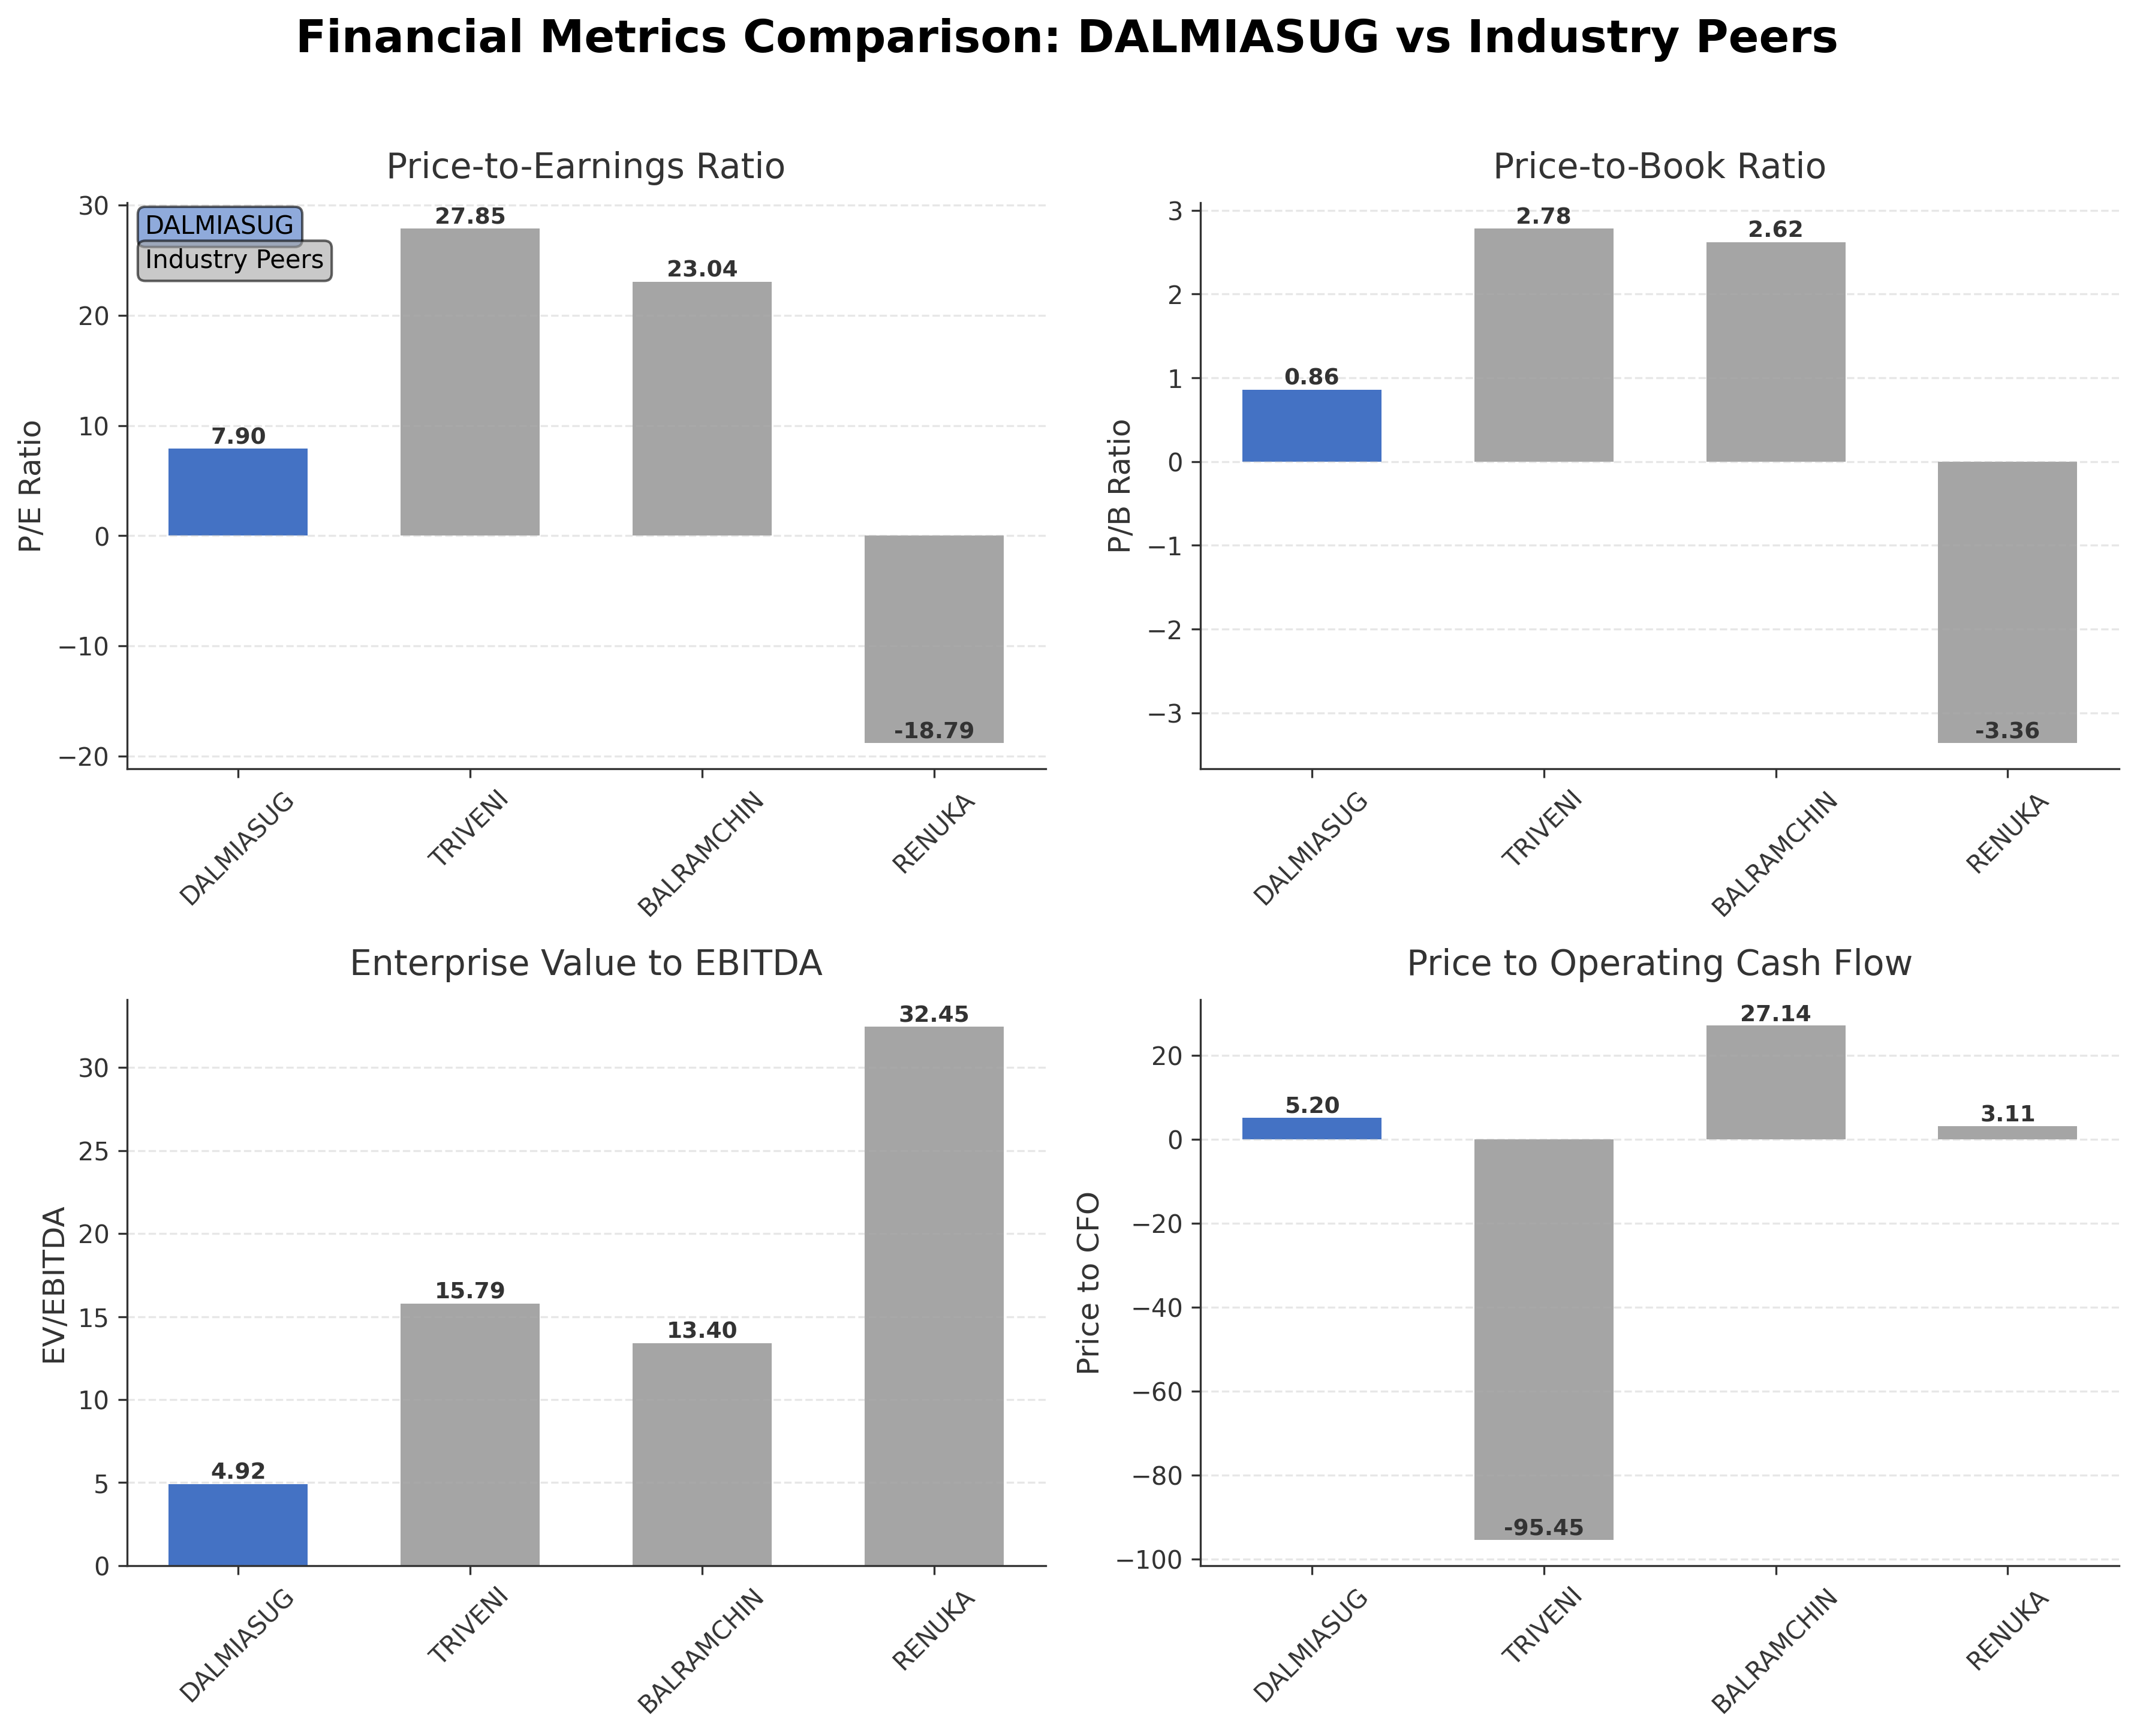
Peer Analysis
| Company Name | Market Cap | P/E Ratio | P/B Ratio | EV/EBITDA | Price to CFO |
|---|---|---|---|---|---|
| Dalmia Bharat Sugar and Industries Ltd. | ₹26.75B | 7.9 | 0.86 | 4.92 | 5.2 |
| Triveni Engineering & Industries Ltd. | ₹89.22B | 27.85 | 2.78 | 15.79 | -95.45 |
| Balrampur Chini Mills Ltd. | ₹102.76B | 23.04 | 2.62 | 13.4 | 27.14 |
| Shree Renuka Sugars Ltd. | ₹53.53B | -18.79 | -3.36 | 32.45 | 3.11 |
Comparison Analysis: Dalmia Bharat Sugar and Industries Ltd. presents a lower valuation profile compared to its Indian sugar industry peers, with a trailing P/E ratio of 7.90 significantly below Triveni Engineering and Balrampur Chini Mills, which trade at 27.85 and 23.04 respectively. Its price-to-book ratio of 0.86 also contrasts with higher multiples among peers, indicating relative undervaluation. The company's EV/EBITDA multiple of 4.92 is notably lower than the peer group, suggesting more attractive operating earnings valuation. Return on equity is comparable to Balrampur Chini Mills but lower than Shree Renuka Sugars. Price to CFO is positive and moderate, unlike Triveni's negative figure, reflecting better cash flow quality. Overall, Dalmia Bharat Sugar shows valuation strength but operates at a smaller scale relative to larger peers.
Financial Metrics Comparison with Peers
Financial Statements
Comprehensive financial data including income, balance sheet, and cash flow metrics
Income Statement
| fiscal_date | 2025-03-31 | 2024-03-31 | 2023-03-31 | 2022-03-31 | 2021-03-31 |
|---|---|---|---|---|---|
| Sales | 37.46B | 28.99B | 32.45B | 29.04B | 24.95B |
| Cost Of Goods | 27.29B | 19.66B | 23.22B | 21.23B | 18.29B |
| Gross Profit | 10.17B | 9.33B | 9.23B | 7.81B | 6.66B |
| Operating Expense Selling General And Administrative | 725.30M | 495.60M | 864.40M | 875.00M | 162.80M |
| Operating Expense Other Operating Expenses | 2.40B | 2.40B | 1.86B | 1.46B | 2.11B |
| Operating Income | 3.67B | 3.35B | 3.72B | 3.98B | 4.06B |
| Non Operating Interest Income | 224.70M | 207.60M | 127.80M | 19.90M | 94.40M |
| Non Operating Interest Expense | 618.50M | 487.30M | 358.00M | 330.80M | 590.20M |
| Pretax Income | 3.50B | 3.63B | 3.53B | 3.99B | 3.69B |
| Income Tax | -370.40M | 909.40M | 1.05B | 909.80M | 979.70M |
| Net Income | 3.87B | 2.72B | 2.50B | 2.95B | 2.70B |
| Eps Basic | 47.78 | 33.66 | 30.90 | 36.49 | 33.40 |
| Eps Diluted | 47.78 | 33.66 | 30.90 | 36.49 | 33.40 |
| Basic Shares Outstanding | 80.94M | 80.94M | 80.94M | 80.94M | 80.94M |
| Diluted Shares Outstanding | 80.94M | 80.94M | 80.94M | 80.94M | 80.94M |
| Ebit | 4.12B | 4.12B | 3.89B | 4.32B | 4.28B |
| Ebitda | 5.39B | 4.96B | 5.05B | 4.98B | 5.07B |
| Net Income Continuous Operations | 3.50B | 3.63B | 3.66B | 3.80B | 3.68B |
| Preferred Stock Dividends | 0.00 | 0.00 | 0.00 | 0.00 | 0.00 |
Data provided by Twelve Data
Balance Sheet
| fiscal_date | 2025-03-31 | 2024-03-31 | 2023-03-31 | 2022-03-31 | 2021-03-31 |
|---|---|---|---|---|---|
| Cash And Cash Equivalents | 3.33B | 4.71B | 657.90M | 946.10M | 712.90M |
| Accounts Receivable | 1.32B | 1.20B | 1.49B | 1.56B | 1.15B |
| Total Assets | 48.63B | 51.62B | 38.03B | 38.22B | 37.33B |
| Total Liabilities | 16.29B | 22.30B | 10.98B | 14.64B | 15.90B |
| Long Term Debt | 5.14B | 3.38B | 3.26B | 3.37B | 2.27B |
| Shareholders Equity | 32.35B | 29.32B | 27.05B | 23.59B | 21.43B |
Data provided by Twelve Data
Cash Flow Statement
| fiscal_date | 2025-03-31 | 2024-03-31 | 2023-03-31 | 2022-03-31 | 2021-03-31 |
|---|---|---|---|---|---|
| Operating Activities Net Income | 3.50B | 3.63B | 3.66B | 3.80B | 3.68B |
| Operating Activities Other Non Cash Items | 242.40M | 139.80M | 87.70M | 272.60M | 356.50M |
| Operating Activities Accounts Receivable | 247.70M | -303.90M | 886.40M | 605.80M | 68.70M |
| Operating Activities Other Assets Liabilities | 1.16B | -7.36B | 1.99B | 1.33B | -482.30M |
| Operating Activities Operating Cash Flow | 5.15B | -3.89B | 6.62B | 6.01B | 3.62B |
| Investing Activities Capital Expenditures | -1.42B | -3.66B | -2.18B | -3.33B | -718.80M |
| Investing Activities Net Intangibles | 0.00 | N/A | N/A | N/A | N/A |
| Investing Activities Investing Cash Flow | -1.42B | -3.85B | -2.18B | -3.33B | -718.80M |
| Financing Activities Short Term Debt Issuance | -5.76B | 9.64B | -3.53B | -2.50B | -1.22B |
| Financing Activities Common Dividends | -465.40M | -384.50M | -323.80M | -485.60M | N/A |
| Financing Activities Financing Cash Flow | -6.23B | 9.26B | -10.91B | -2.99B | -1.22B |
| End Cash Position | 3.33B | 4.71B | 657.90M | 946.10M | 712.90M |
| Free Cash Flow | 3.09B | -6.06B | 3.65B | 2.34B | 2.74B |
| Investing Activities Other Investing Activity | N/A | -186.80M | N/A | N/A | N/A |
| Financing Activities Other Financing Charges | N/A | N/A | -7.06B | N/A | N/A |
Data provided by Twelve Data
Technical Analysis
Key Insights
- The stock exhibits a mixed trend with price currently above the 50-day moving average (₹291.91) but below the 200-day moving average (₹338.41), indicating a potential intermediate consolidation phase.
- Key support levels are identified near ₹330 and ₹290, while resistance is observed around the 52-week high of ₹464.9.
- The price is positioned between short-term and long-term moving averages, suggesting cautious momentum with no clear breakout or breakdown.
- Momentum indicators show RSI near neutral levels, MACD indicates a mildly bearish crossover, and stochastic oscillators reflect moderate volatility without extreme overbought or oversold conditions.
- Multi-timeframe analysis reveals daily charts showing sideways movement, weekly charts indicating mild bullish tendencies, and monthly charts suggesting longer-term consolidation.
- Current technical setup suggests potential for range-bound trading with sensitivity to sector news and broader market trends, requiring monitoring of volume and momentum shifts for directional cues.
Trending News
1. Headline: Sugar stocks jump up to 12% in weak market as crude oil surge lifts sentiment - CNBC TV18
Summary: Shares of sugar companies such as Dhampur Sugar Mills Limited, Dalmia Bharat Sugar and Industries Limited, Dwarikesh Sugar Industries Limited, Shree Renuka Sugars Limited, Bajaj Hindusthan Sugar Limited, and Praj Industries Limited were trading higher by 2% to 12% on Monday, March 30, outperforming ...
Sentiment: positive
2. Headline: Sugar Stocks Surge on Geopolitical Oil Shock, Ethanol Boom | Whalesbook
Summary: Higher oil prices significantly increase the value of ethanol, a biofuel from sugarcane. This dual revenue stream from sugar and high-value ethanol is the main reason for the sharp gains in stocks such as Shree Renuka Sugars, Dalmia Bharat Sugar and Industries, Dhampur Sugar Mills, Avadh Sugar ...
Sentiment: positive
3. Headline: Shree Renuka, Dalmia Bharat Sugar jump up to 7%: What’s behind the rally?
Summary: Shares of Shree Renuka Sugars jumped 7.13% to Rs 28.38, while Dalmia Bharat Sugar and Industries rose 6.35% to Rs 367.40.
Sentiment: positive
4. Headline: Sensex Today | Stock Market LIVE Updates: Nifty trades 230 points lower; Dow Futures recovers, up 75 pts
Summary: In the midst of a severe sell-off on Monday, March 30, shares of sugar companies, including Dhampur Sugar Mills Limited, Dalmia Bharat Sugar and Industries Limited, Dwarikesh Sugar Industries Limited, Shree Renuka Sugars Limited, Bajaj Hindusthan Sugar Limited, and Praj Industries Limited, ...
Sentiment: negative
5. Headline: Dalmia Bharat Sugar & Industries Ltd Gains 6.53%: Mixed Technical Signals Shape Weekly Momentum
Summary: Dalmia Bharat Sugar & Industries Ltd delivered a strong weekly performance, rising 6.53% from Rs.300.35 to Rs.319.95, significantly outperforming the Sensex which declined by 0.28% over the same period. The stock’s price action was marked by notable intraday volatility and a series of technical ...
Sentiment: positive
Summary: Buy Dalmia Bharat at Rs 346 | Upside: 16% | Stop Loss: Rs 310 | Target: Rs 380/400The structure for Dalmia Bharat Sugar and Industries Limited has turned bullish as the stock has given a strong breakout above its key resistance zone near Rs 330, supported by a sharp rise in volumes and positive ...
Sentiment: positive
7. Headline: Dalmia Bharat Refractories Limited Promoter Group Shareholding Change via Inter-Se Transfer | InvestyWise
Summary: Dalmia Bharat Refractories Limited disclosed a change in shareholding, effective March 25, 2026, involving an inter-se transfer between…
Sentiment: neutral
Summary: The Sensex climbed 2.2% on 25 Mar 2026, yet Dalmia Bharat Sugar & Industries Ltd outpaced both the benchmark and its sector, surging 7.96% to touch an intraday high of Rs 331. This 2.19-percentage-point outperformance over the Sugar sector’s 5.38% gain signals a distinctly stock-specific ...
Sentiment: positive
9. Headline: Dalmia Bharat Sugar & Industries Ltd Faces Mildly Bearish Momentum Amid Technical Shifts
Summary: Dalmia Bharat Sugar & Industries Ltd has experienced a notable shift in its technical momentum, transitioning from a sideways trend to a mildly bearish stance. This change is underscored by a complex interplay of technical indicators, including MACD, RSI, moving averages, and Bollinger Bands, ...
Sentiment: positive
10. Headline: Why is Dalmia Bharat Sugar & Industries Ltd falling/rising?
Summary: On 20-Mar, Dalmia Bharat Sugar & Industries Ltd witnessed a notable rise in its share price, closing at ₹318.70 with a gain of ₹18.95 or 6.32%. This upward movement contrasts with the broader market trends and reflects a complex interplay of sector performance, valuation metrics, and ...
Sentiment: positive
Powered by Brave
Recent Updates
News Summary
Recent updates on Dalmia Bharat Sugar and Industries Ltd. highlight the company's closure of its trading window ahead of Q4 results, signaling routine compliance with regulatory requirements. Market activity includes the company's mention among gainers in the 'B' group segment, reflecting sectoral interest. Earnings reports indicate the company surpassed revenue estimates by 8.3%, suggesting positive operational performance. However, some market sources rate the stock as 'Sell', indicating mixed sentiment. Sector-wide movements show Dalmia Bharat among sugar stocks experiencing price jumps, though caution is advised given market volatility. These developments collectively underscore a period of active market engagement and regulatory adherence, with earnings performance providing a positive backdrop amid varying market perspectives.
News Sentiment
Sentiment across recent news is predominantly neutral to positive, with earnings beats and sector gains supporting optimism. Mixed ratings and cautious commentary introduce balanced perspectives, reflecting a nuanced market view. The sentiment trend suggests cautious optimism tempered by awareness of sector cyclicality and valuation considerations.
Analytical Overview
Analysis Summary
Valuation Metrics: Dalmia Bharat Sugar and Industries Ltd. trades at a trailing P/E of 7.90, below the industry average of 7.90, and a forward P/E of 9.12, indicating relatively attractive valuation metrics within its sector.
Growth Trajectory: The company reported a quarterly revenue decline of 17.1%, though year-over-year earnings growth stands at 17.1%, suggesting mixed growth signals with positive earnings momentum despite recent revenue contraction.
Financial Health: Strong liquidity is evident with a current ratio exceeding 6.2 and total cash of ₹9.91 billion against total debt of ₹5.47 billion, reflecting a conservative debt-to-equity ratio of 16.97 and robust cash flow generation.
Sector Specific Factors: The sugar industry faces cyclical commodity price risks and regulatory challenges, while opportunities arise from ethanol production linked to renewable energy initiatives and rising crude oil prices.
Market Positioning: The company benefits from an integrated business model and strong promoter control, supporting strategic agility in a competitive Indian agribusiness environment.
Investment Conclusion
Supporting Factors: Attractive valuation multiples relative to peers with a trailing P/E of 7.90 and EV/EBITDA of 4.92.
Risk Factors: Revenue contraction of 17.1% in the most recent quarter indicating potential operational challenges.
SWOT Analysis
Strengths
- Integrated business model combining sugar production with ethanol and power generation.
- Strong liquidity position with a current ratio exceeding 6 and substantial cash reserves.
- Promoter holding of over 83% ensuring stable governance and strategic control.
- Positive earnings growth with a profit margin near 9.6% and return on equity of 11.96%.
Weaknesses
- Recent quarterly revenue decline of 17.1% indicating potential operational headwinds.
- Low institutional investor participation limiting external oversight and market liquidity.
- Price currently below 52-week high, reflecting potential market skepticism.
- Moderate debt-to-equity ratio of 16.97 requiring careful management.
Opportunities
- Rising crude oil prices enhancing ethanol revenue streams as a biofuel alternative.
- Government focus on renewable energy supporting ethanol and cogeneration growth.
- Potential for market share expansion through value-added by-products.
- Increasing rural economic development driving demand for sugar and allied products.
Threats
- Commodity price volatility impacting sugar and ethanol profitability.
- Regulatory changes affecting sugar pricing and export policies.
- Competitive pressures from larger regional peers with higher market capitalization.
- Macroeconomic factors including inflation and currency fluctuations influencing costs.
Company Description
Dalmia Bharat Sugar and Industries Ltd. is a prominent player in the sugar manufacturing industry in India. The company is primarily engaged in the production of sugar, a staple agricultural commodity, along with its by-products. Besides sugar production, the firm also focuses on the generation of power through cogeneration plants, manufacturing of ethanol, and the production of industrial alcohol, all of which leverage the by-products of sugarcane. These diversified operations reflect its integrated business model aimed at optimizing the utility of raw materials and enhancing sustainability. Operating in the agribusiness sector, Dalmia Bharat Sugar plays a significant role in the rural economy, providing rural employment and supporting agriculture-based livelihoods. Additionally, its ventures into power and ethanol represent important contributions to the renewable energy sector, crucial for India's energy transition goals. The company’s focus on sustainability and value-added products strengthens its position in the market, ensuring its relevance and resilience in the competitive sugar industry.