
Credo Technology Group Holding Ltd (CRDO)
Stock Analysis Report
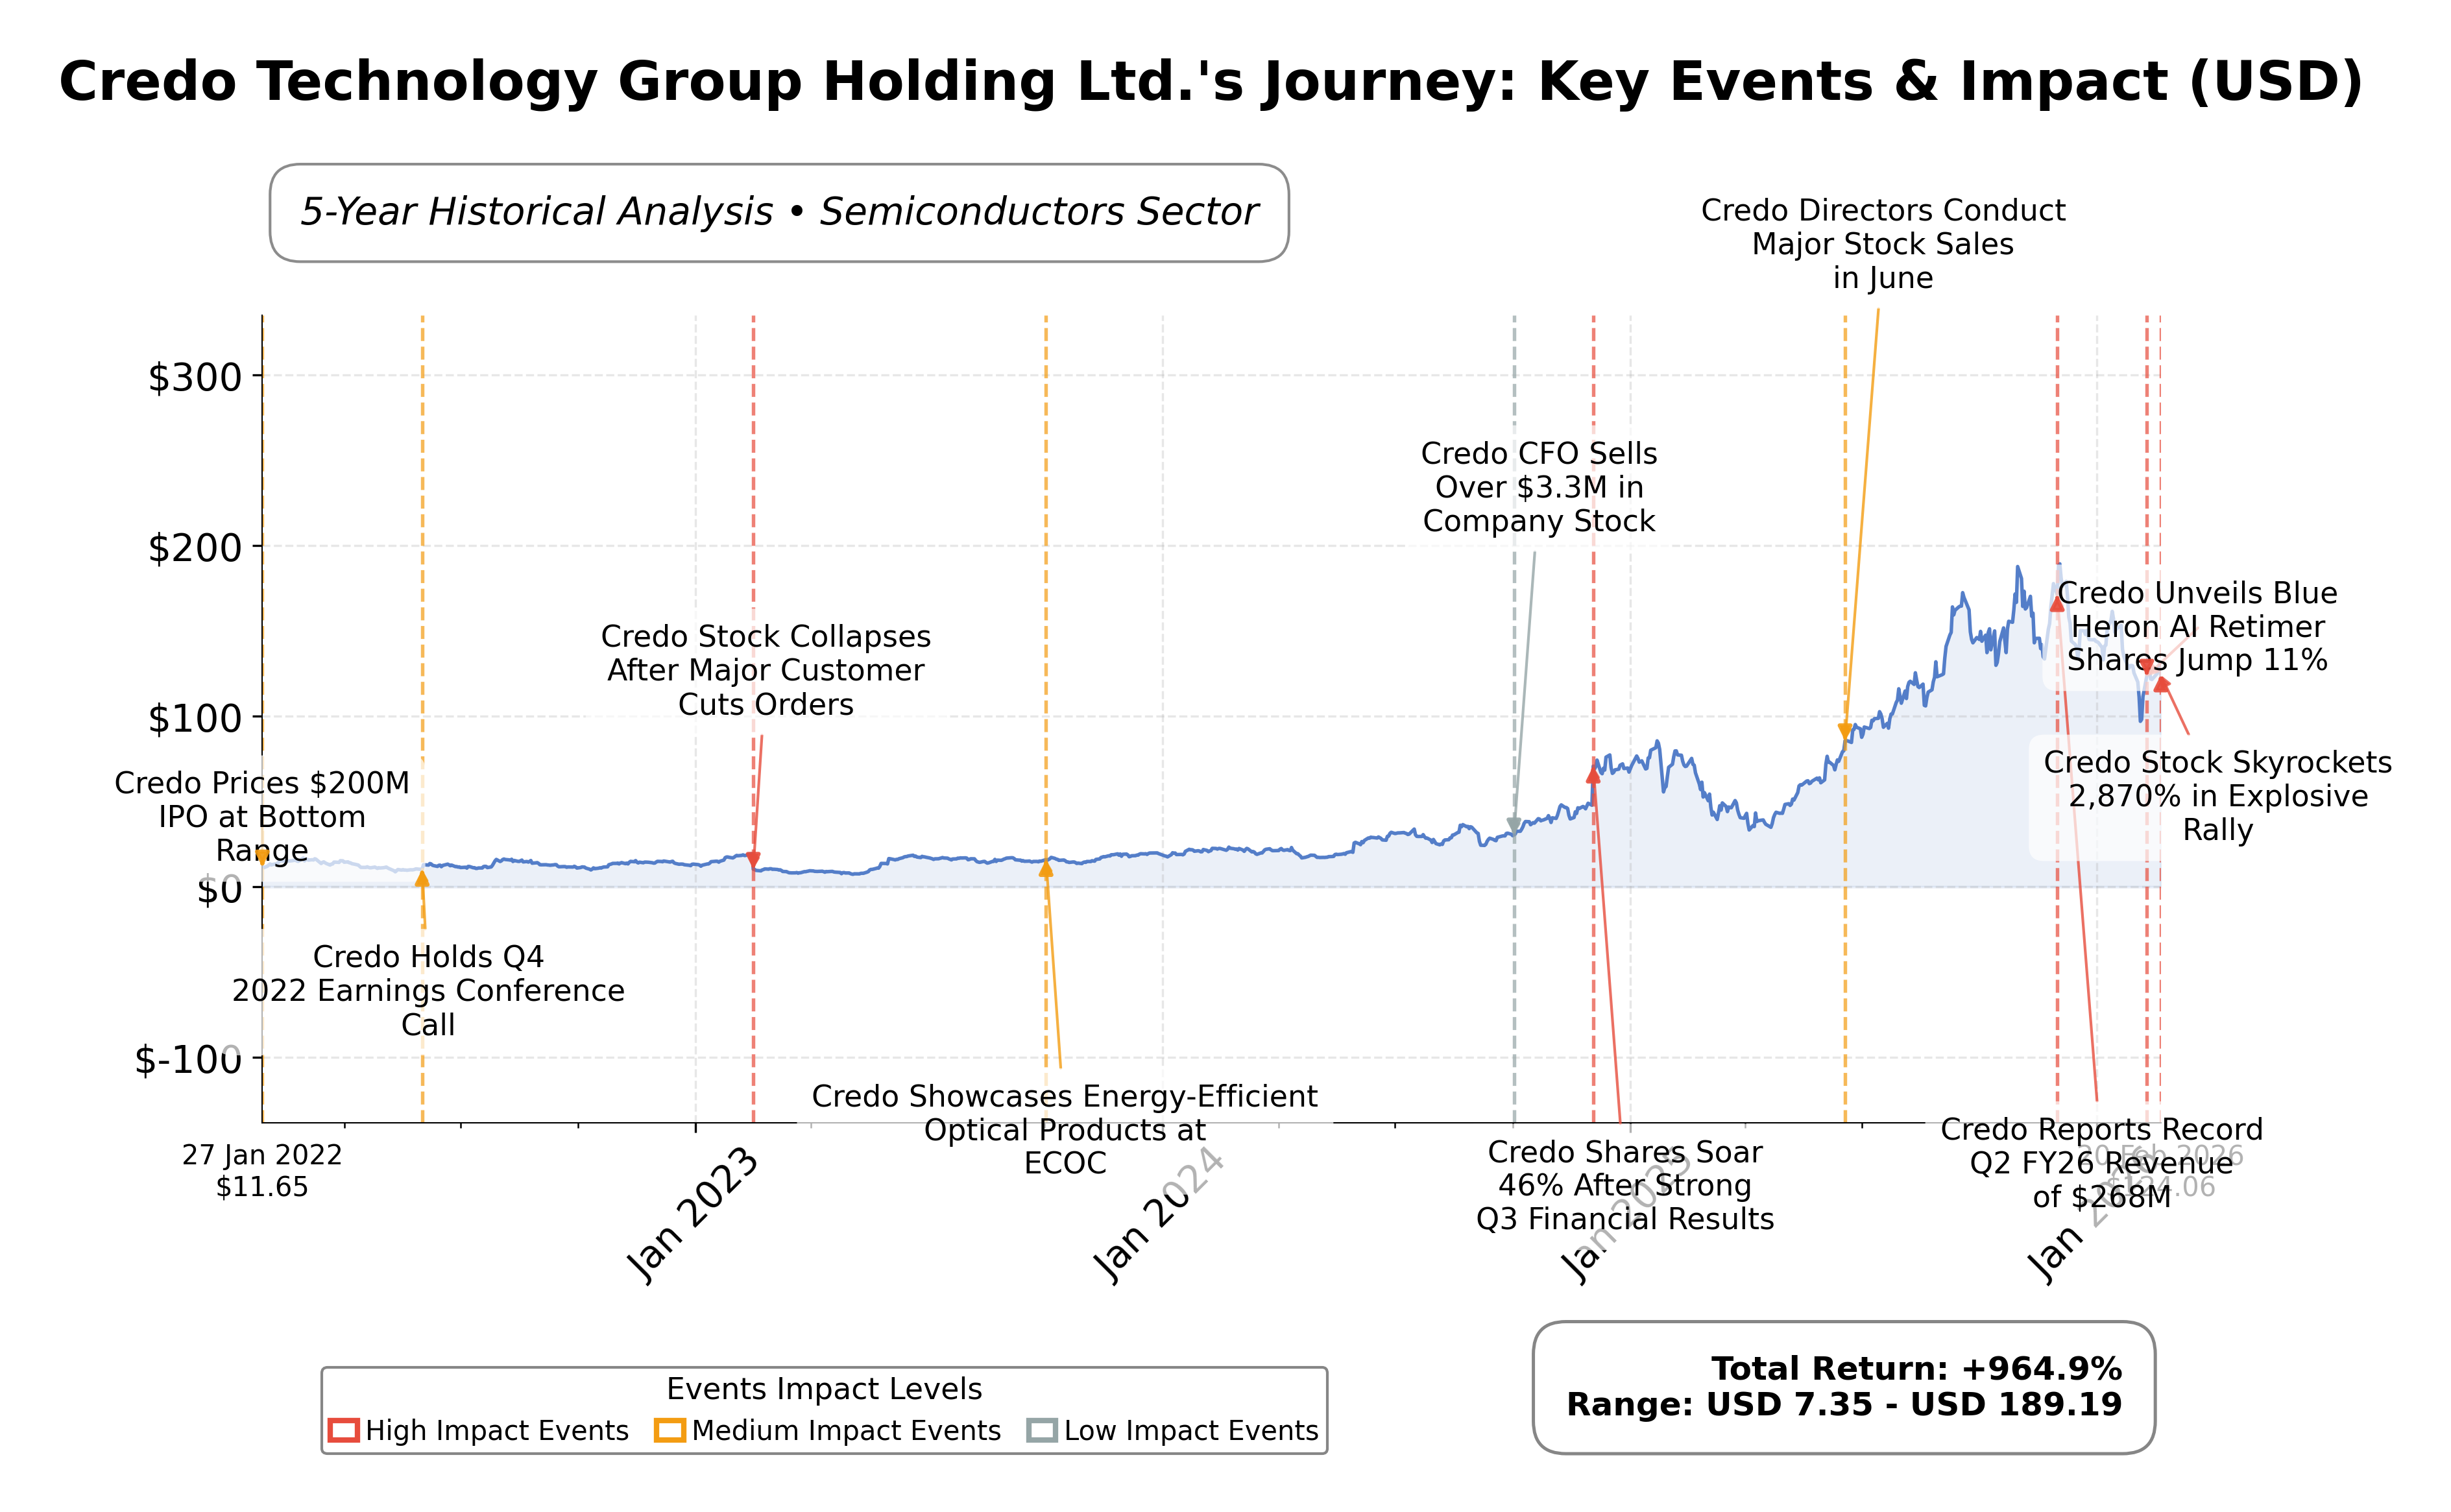
Stock Journey
Key Positives and Key Risks
Pros
- Revenue growth of 2.72% quarterly and profit margin of 26.6% indicate solid operational performance.
- Strong liquidity with $813.57 million in cash and a current ratio of 8.86 supports financial stability.
- Institutional ownership at 80.9% reflects confidence from major investment entities.
Cons
- High trailing P/E ratio of 106.03 and price-to-book of 17.22 suggest premium valuation risks.
- Stock exhibits high volatility with a beta of 2.65, implying elevated market risk.
- Recent stock price decline of approximately 32% over the past month signals short-term uncertainty.
Disclosure: This information is for general awareness and does not constitute investment advice
Report Summary
Credo Technology Group Holding Ltd. operates in the semiconductor industry, specializing in high-speed connectivity solutions essential for modern data infrastructure. The company develops advanced semiconductors, optical components, and system-level products that support data centers, cloud services, and enterprise networks. Positioned as a key player in Silicon Valley, Credo focuses on energy-efficient designs and sustainability within the technology sector.
Financially, Credo exhibits strong revenue growth with a trailing twelve-month revenue of approximately $796 million and a profit margin of 26.6%. The stock trades at a high trailing P/E ratio of 106.03, with a forward P/E of 28.18, reflecting market expectations of future earnings growth. The company maintains a robust balance sheet with a current ratio of 8.86 and substantial cash reserves of over $813 million against modest debt levels. Valuation metrics such as price-to-book at 17.22 and enterprise value to EBITDA near 96 indicate a premium valuation relative to earnings.
Technical indicators show the stock price currently around $124, below its 52-week high of $213.80 but well above the 50-day and 200-day moving averages, suggesting recent price consolidation. The company has recently achieved PCIe 6.0 certification, signaling technological advancement and potential market expansion. Institutional ownership is high at 80.9%, with insider holdings around 11.4%, indicating strong governance interest. Risks include a high beta of 2.65, implying elevated volatility, and valuation pressures given the premium multiples.
In comparison with peers in the semiconductor industry listed on US exchanges, Credo's market capitalization of $22.41 billion is smaller than giants like Taiwan Semiconductor Manufacturing Co. ($1.92 trillion) and NVIDIA ($4.62 trillion) but competitive among mid-cap players. Its P/E ratio is higher than most peers except Intel, which has an exceptionally high P/E. Price-to-book and EV/EBITDA ratios are also elevated relative to peers such as Qualcomm and Marvell Technology, indicating a relatively expensive valuation profile within its sector and geography.
Credo Technology Group stands at a pivotal juncture in the semiconductor connectivity market, marked by significant technological certifications and growing revenue streams. While the company benefits from strong institutional support and a healthy balance sheet, it faces challenges related to valuation multiples and market volatility. The ongoing developments in AI and data center demand present opportunities alongside competitive pressures. Given the current data, a balanced approach that monitors evolving market conditions and company performance may align with prudent evaluation strategies.
Company and Industry Overview
Company Basics
Price Performance
Company Size
Shareholding Pattern
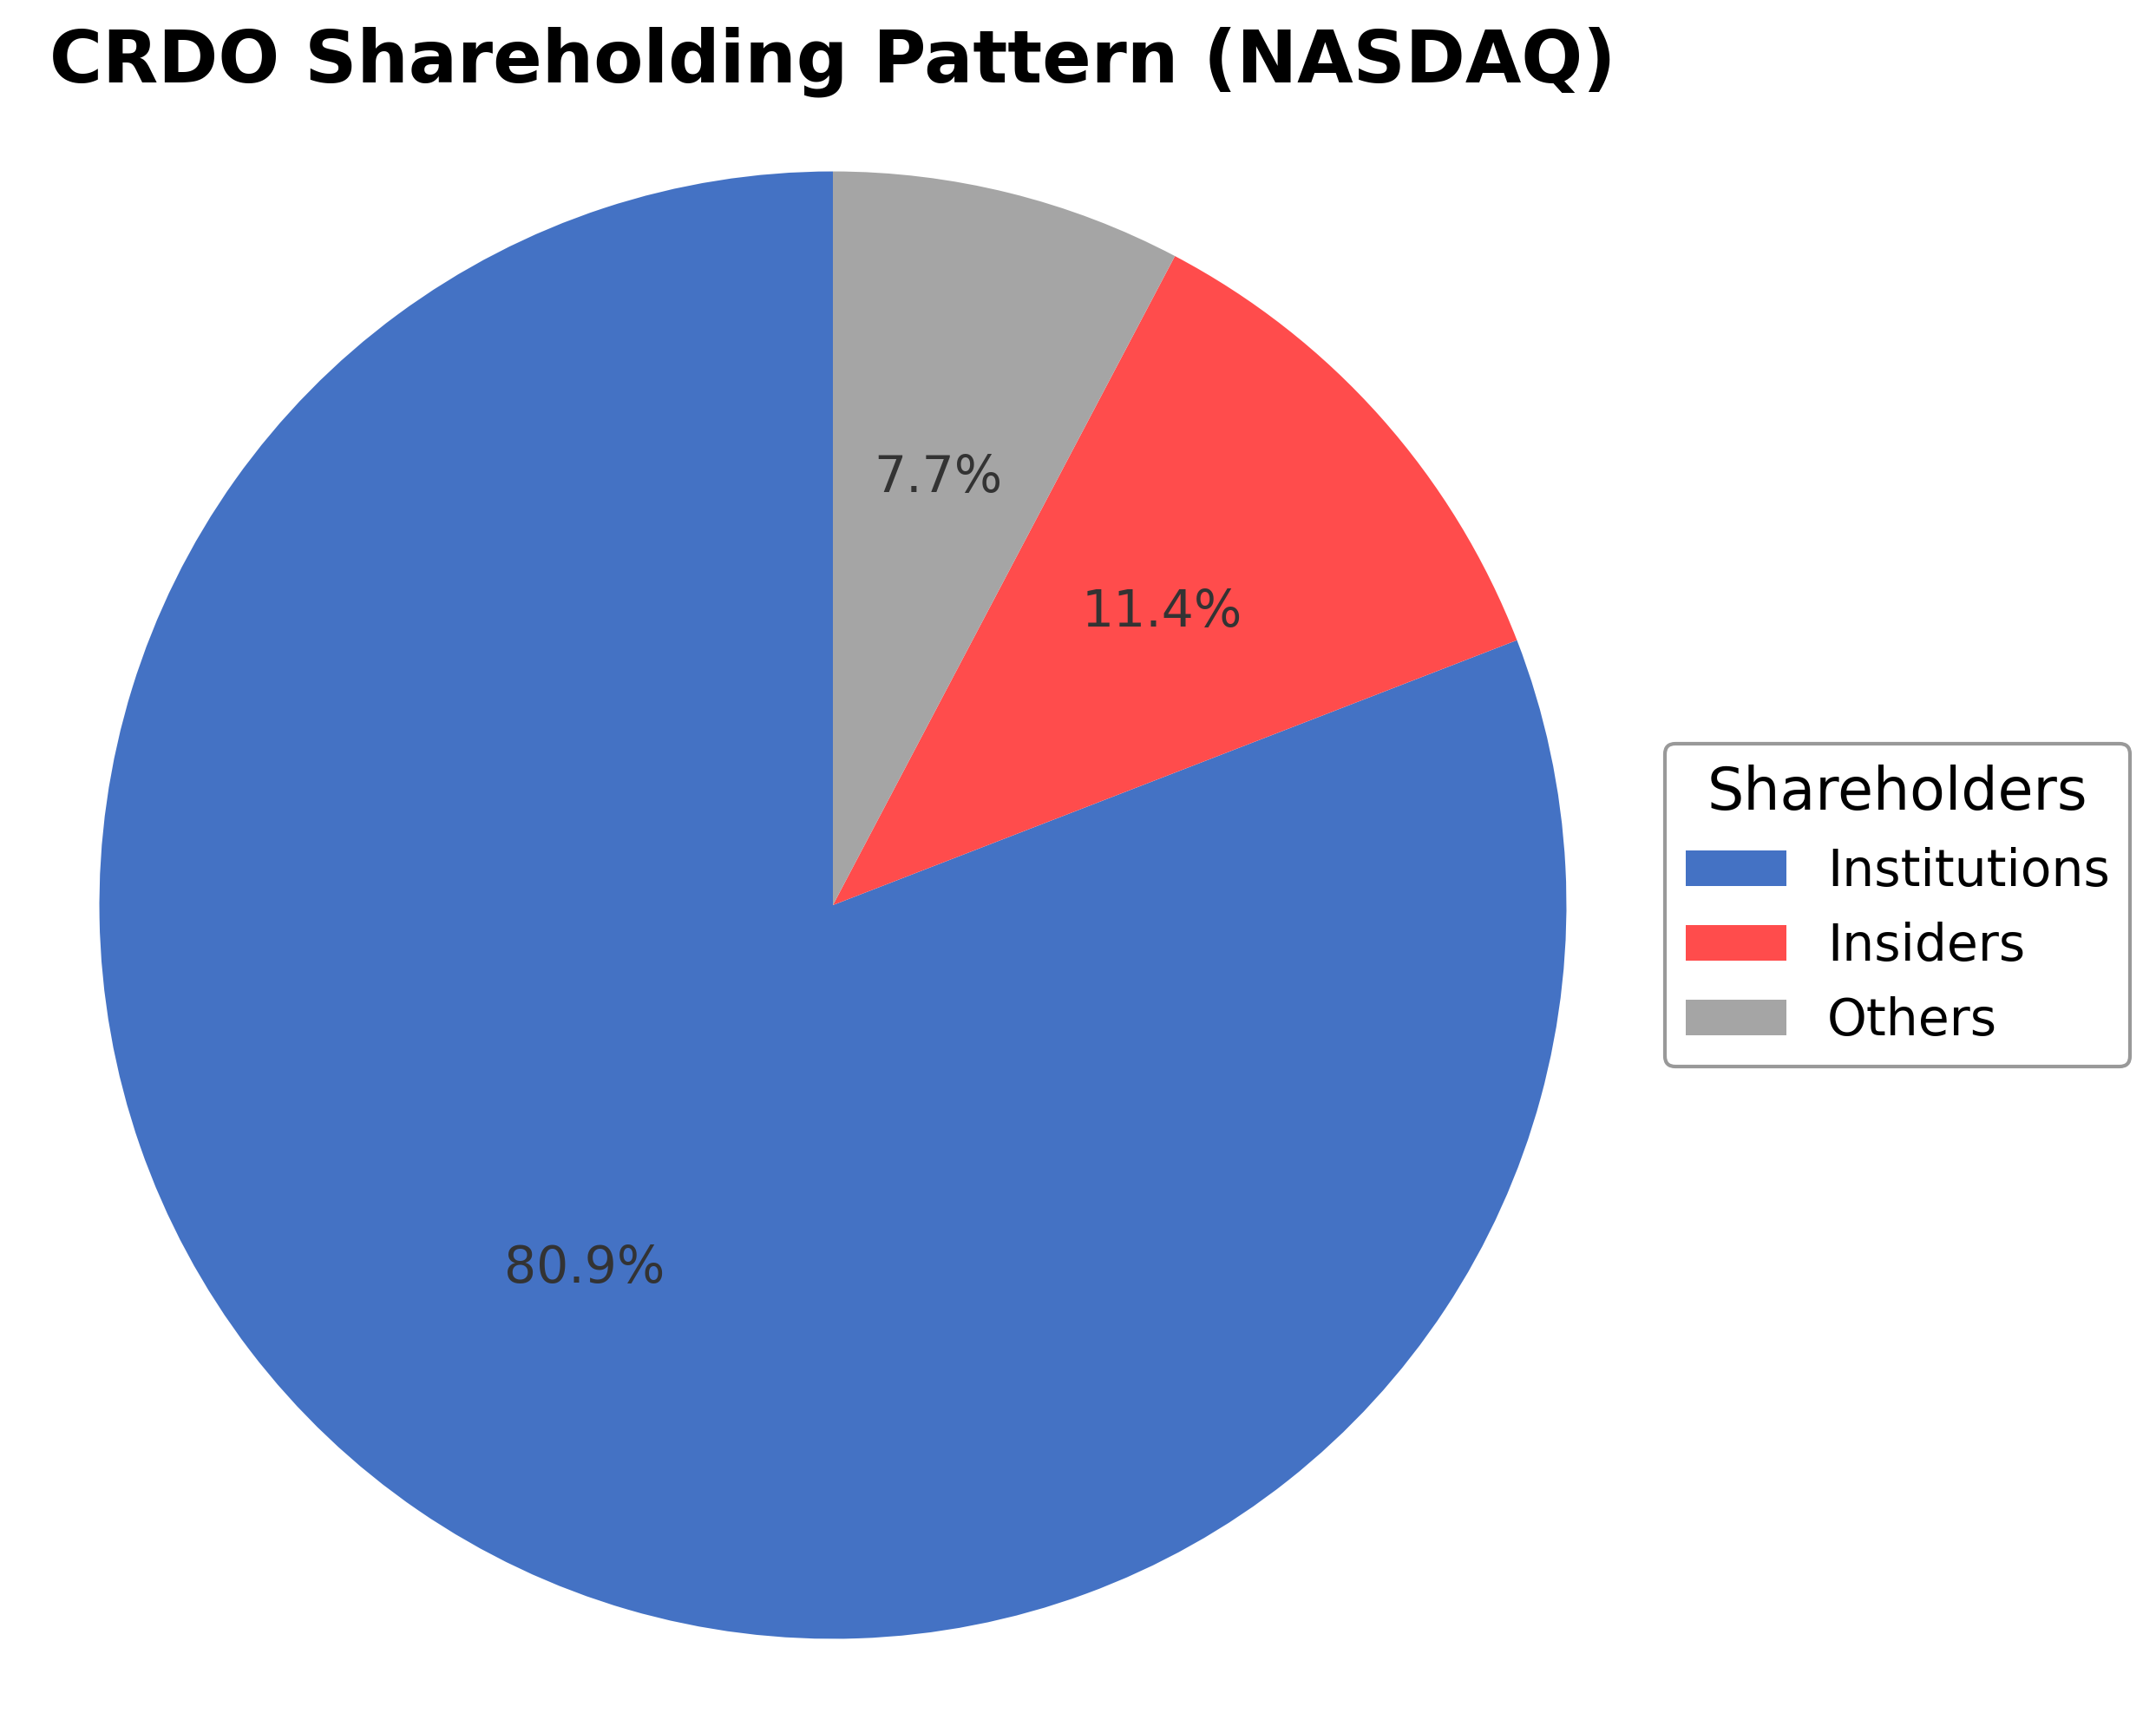
Credo Technology Group Holding Ltd. exhibits a shareholding structure dominated by institutional investors holding approximately 80.88% of shares, reflecting strong confidence from mutual funds, pension funds, and asset managers. Insiders, including executives and board members, hold about 11.40%, indicating meaningful internal ownership and alignment with corporate governance. The remaining 7.72% is held by public shareholders and other retail investors. Over the past 12-24 months, institutional ownership has shown slight accumulation, with major funds like Vanguard Group increasing positions, suggesting positive market sentiment. This ownership distribution supports strategic decision-making and may influence future corporate actions, maintaining a balance between external investor expectations and internal leadership interests.
Sector and Industry Analysis
Credo Technology Group Holding Ltd. (CRDO) operates within the semiconductor sector, specifically focusing on high-speed connectivity solutions for data center and networking applications. The semiconductor sector is a critical enabler of the global digital economy, with a market size exceeding $600 billion as of recent estimates and projected compound annual growth rates (CAGR) in the mid-to-high single digits driven by expanding demand in cloud computing, artificial intelligence (AI), and 5G infrastructure. Key players in this sector include integrated device manufacturers and fabless companies such as Broadcom, NVIDIA, AMD, and Marvell Technology, alongside specialized firms like Credo that focus on connectivity components such as active electrical cables (AECs), SerDes chiplets, and optical interconnects.
Industry trends are strongly shaped by rapid technological advancements and evolving data center architectures. There is a pronounced shift towards higher bandwidth, lower latency, and energy-efficient interconnect solutions to support AI workloads and hyperscale cloud environments. Credo’s portfolio, including HiWire active electrical cables and PAM4 optical DSPs, aligns with the growing adoption of PCIe Gen5/Gen6 and Ethernet standards at 400G and beyond. The rise of AI and machine learning workloads has accelerated demand for advanced connectivity solutions that can handle massive data throughput while minimizing power consumption. Additionally, the industry is witnessing a gradual transition from traditional electrical interconnects to co-packaged optics, although this remains nascent and presents both a competitive threat and an innovation opportunity for players like Credo.
The regulatory landscape for semiconductor companies is complex and multifaceted, involving export controls, intellectual property protections, and environmental compliance. U.S.-China geopolitical tensions have intensified scrutiny on technology transfers and supply chain security, impacting companies with cross-border operations like Credo, which serves markets in the U.S., Taiwan, Mainland China, and Hong Kong. Compliance with the U.S. Export Administration Regulations (EAR) and restrictions on certain semiconductor technologies is critical. Additionally, patent licensing agreements and IP enforcement are vital for protecting proprietary technologies in this highly competitive sector. Environmental regulations also increasingly influence manufacturing and product design, emphasizing energy efficiency and sustainability.
Competitive dynamics in the semiconductor connectivity niche are characterized by high technological barriers to entry, significant R&D investment requirements, and the necessity for close collaboration with hyperscale cloud providers and OEMs. Credo’s competitive positioning benefits from its diversified five-pillar connectivity platform, strong IP portfolio, and early mover advantage in active electrical cables for data centers. However, competition from large semiconductor conglomerates and emerging optical interconnect startups creates pressure on pricing and innovation cycles. Market structure is moderately consolidated, with a few dominant players controlling large portions of the supply chain, but niche specialists like Credo can capture growth by addressing specific high-performance segments. The capital intensity and rapid pace of technological change serve as natural barriers, while customer concentration among hyperscalers demands continuous product differentiation and reliability.
Note: Analysis synthesized from industry research, market reports, and regulatory filings. Information is subject to change based on market conditions.
Illustrative Scenario Analysis
DCF Assumptions:
Method: Two-Stage EPS-Priority Model
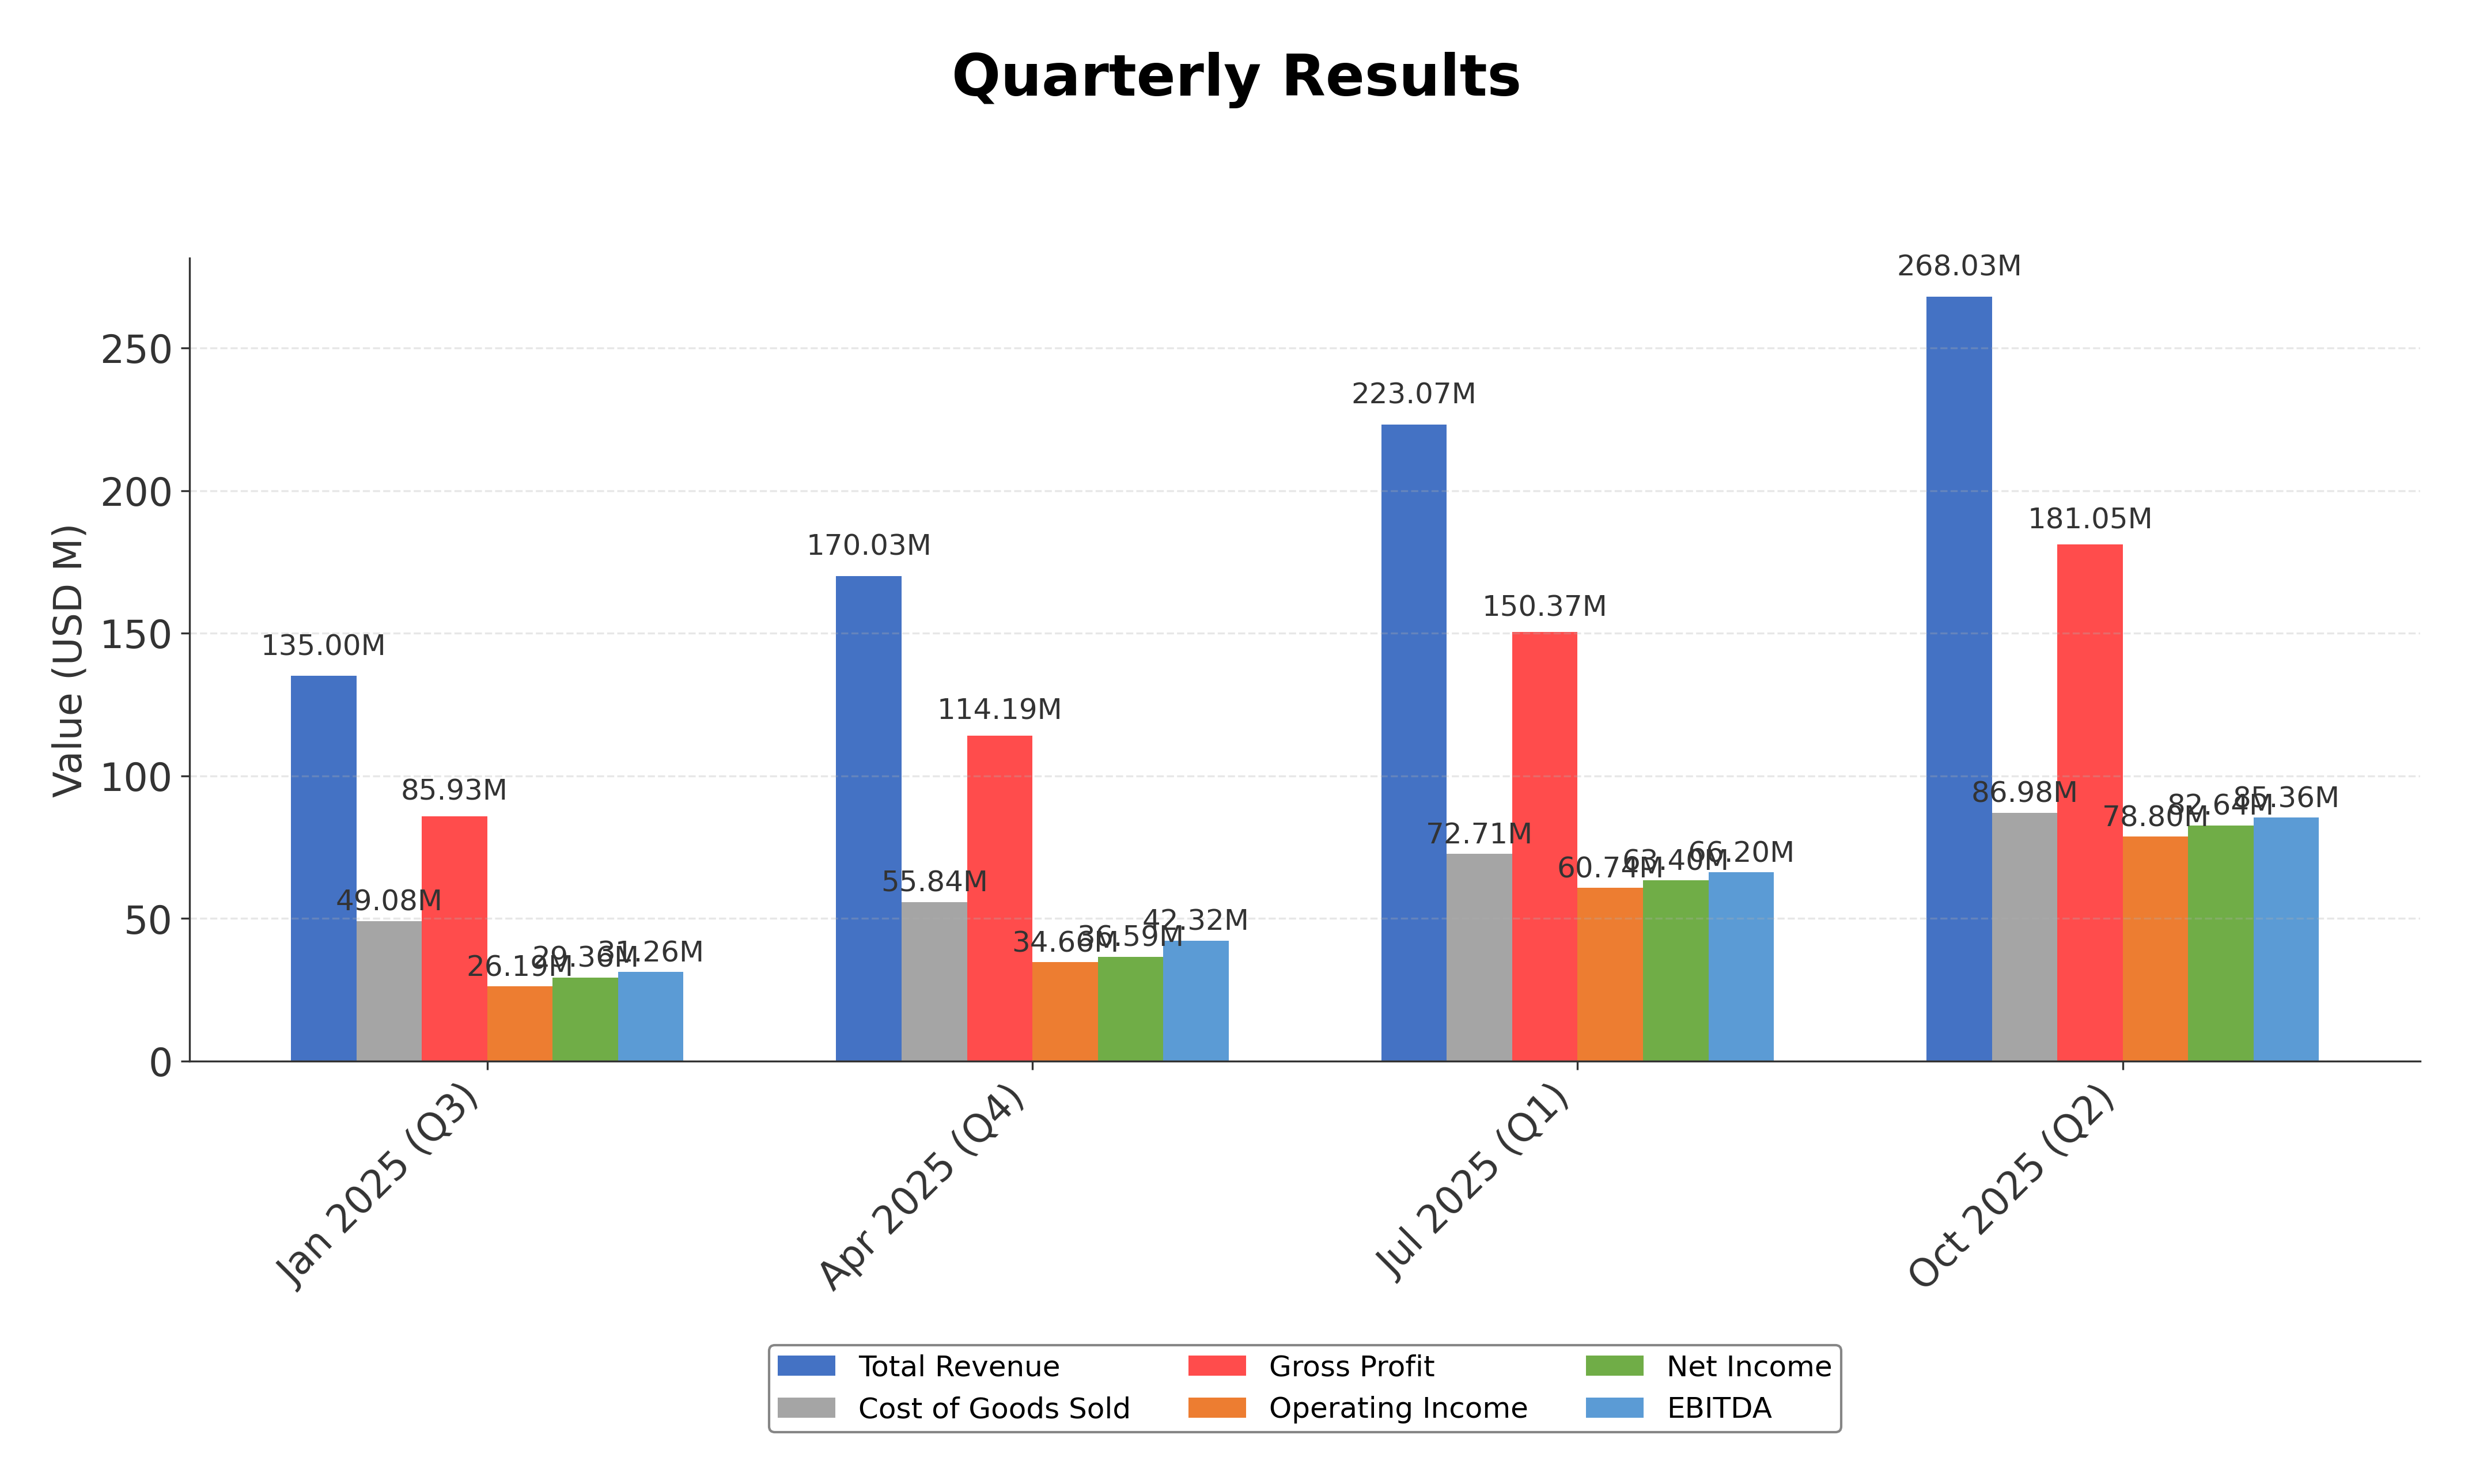
Financials
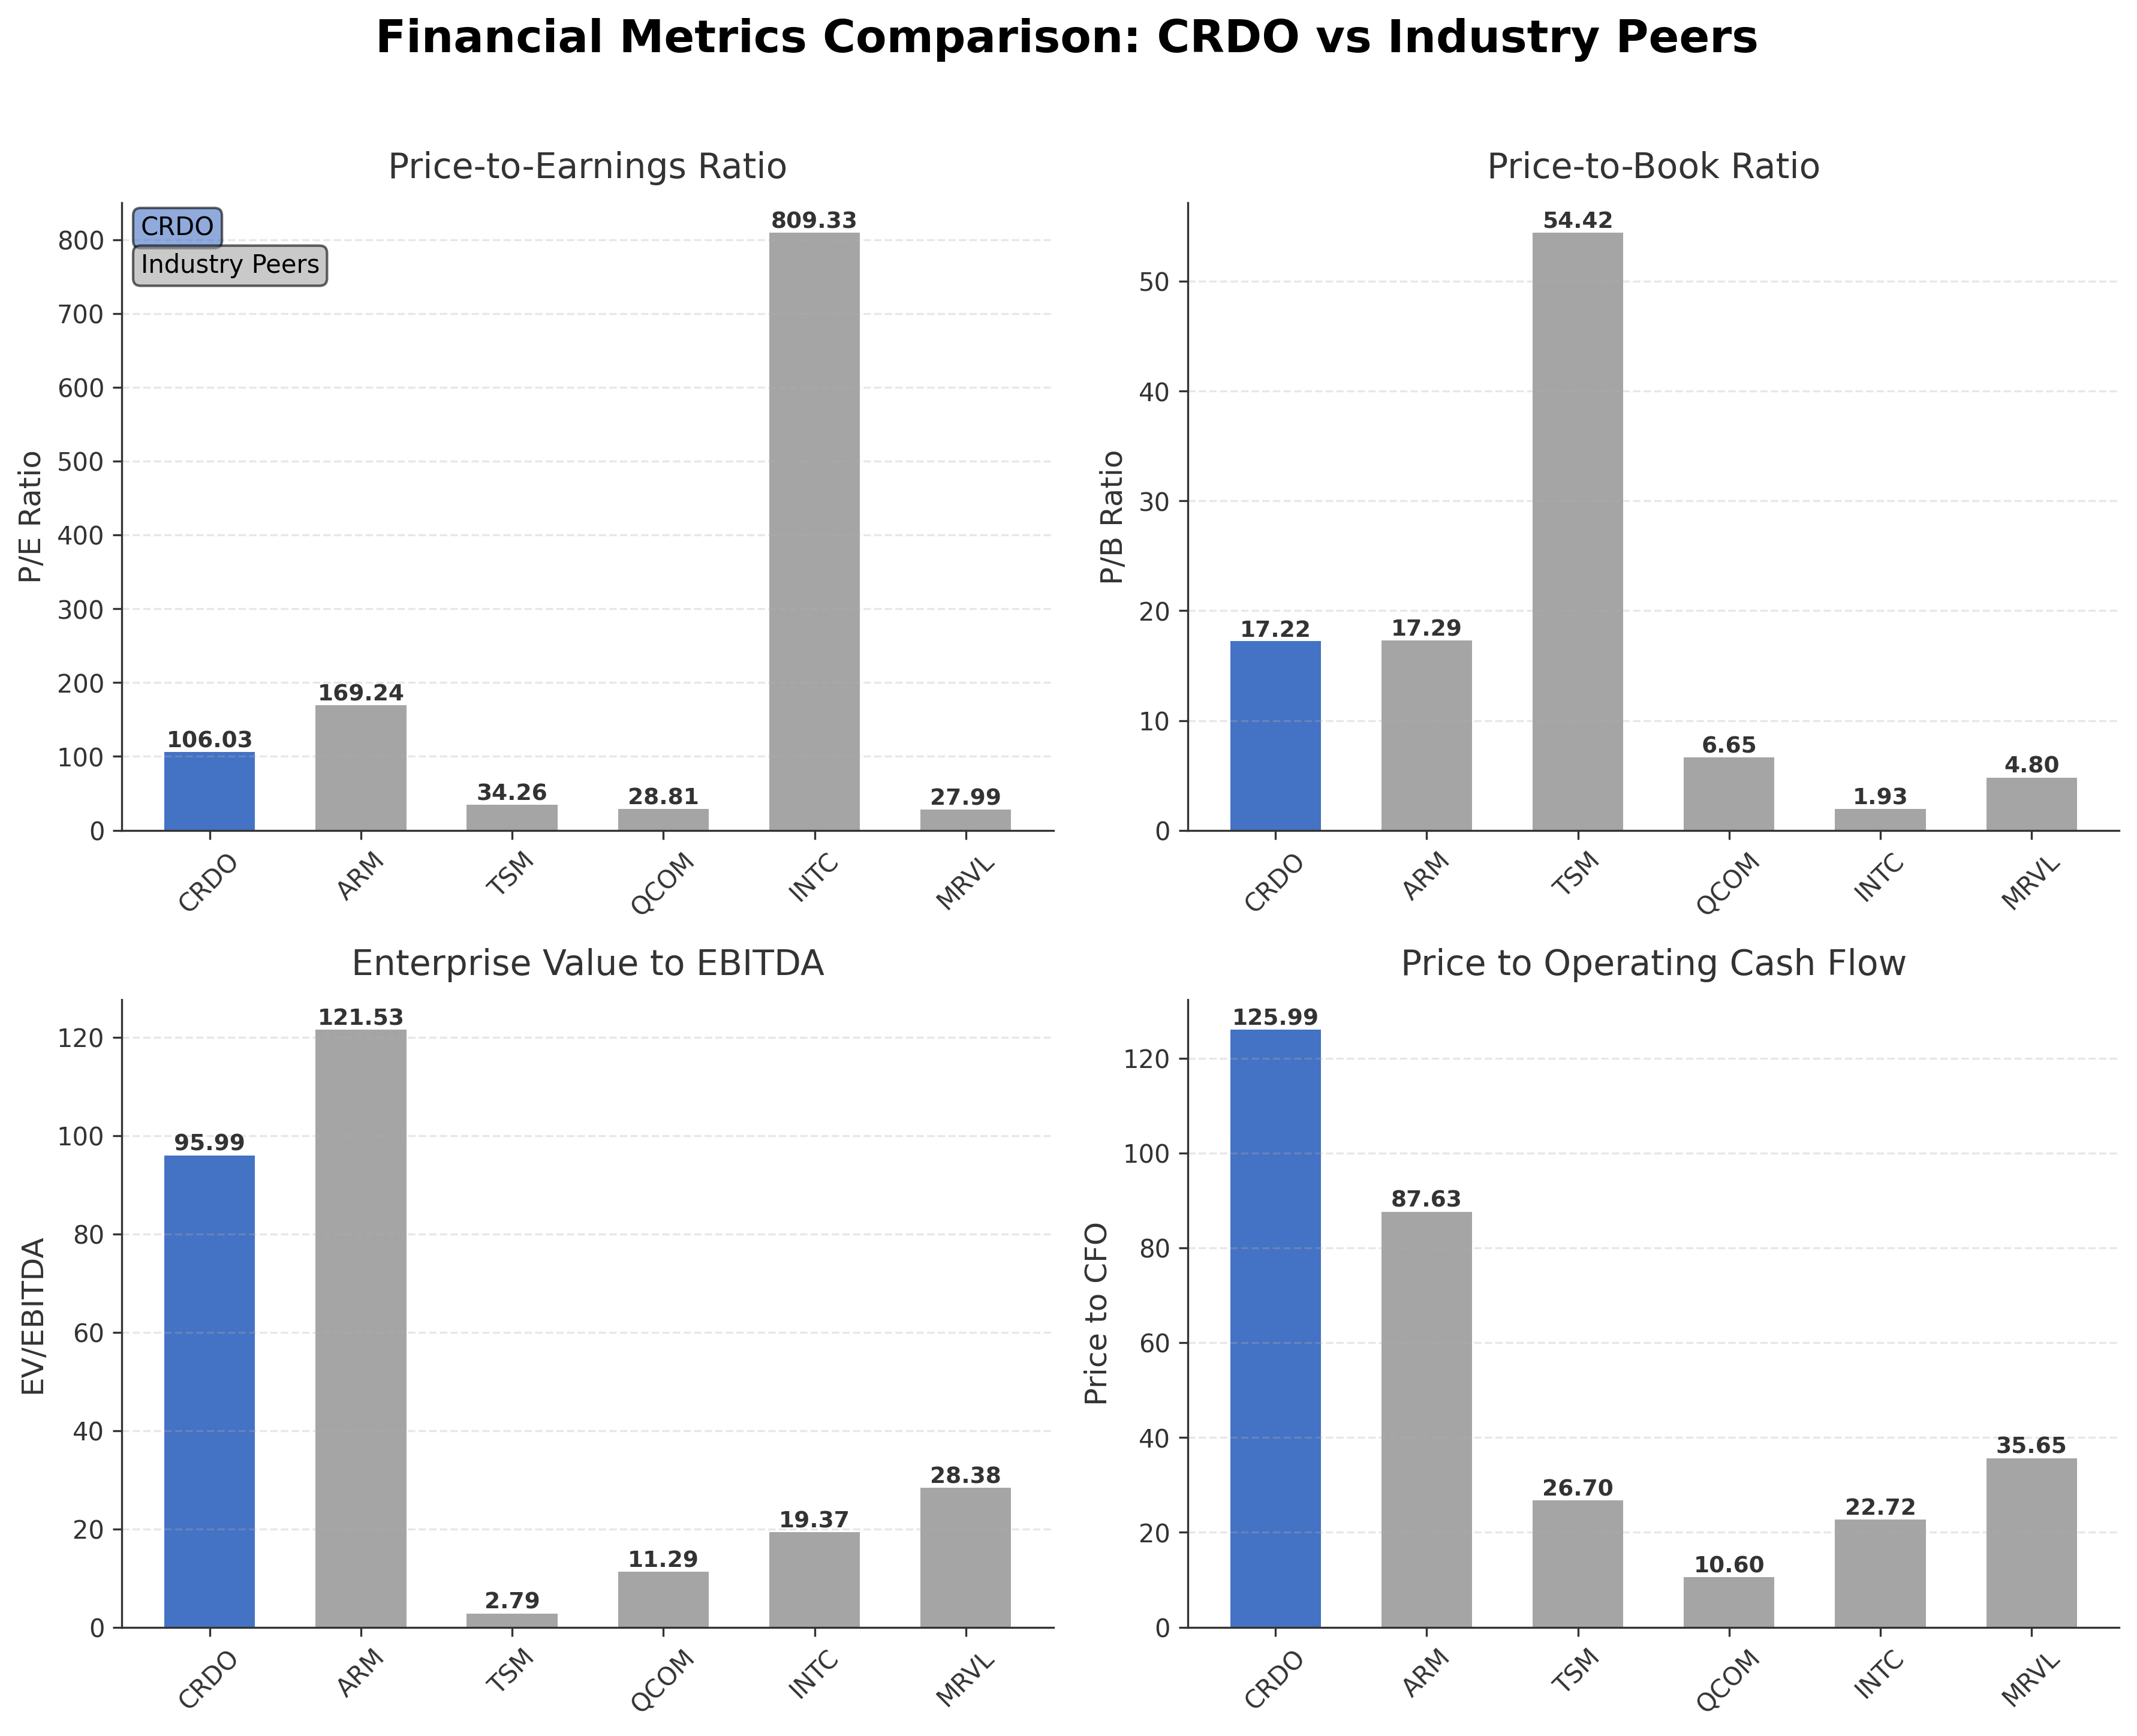
Peer Analysis
| Company Name | Market Cap | P/E Ratio | P/B Ratio | EV/EBITDA | Price to CFO |
|---|---|---|---|---|---|
| Credo Technology Group Holding Ltd. | $22.41B | 106.03 | 17.22 | 95.99 | 125.99 |
| Arm Holdings plc American Depositary Receipt | $133.37B | 169.24 | 17.29 | 121.53 | 87.63 |
| Taiwan Semiconductor Manufacturing Co. Ltd. ADR | $1.92T | 34.26 | 54.42 | 2.79 | 26.70 |
| QUALCOMM Incorporated | $152.60B | 28.81 | 6.65 | 11.29 | 10.60 |
| Intel Corporation | $220.34B | 809.33 | 1.93 | 19.37 | 22.72 |
| Marvell Technology, Inc. | $67.41B | 27.99 | 4.80 | 28.38 | 35.65 |
Comparison Analysis: Credo Technology Group's valuation metrics indicate a higher P/E ratio and price-to-book multiple compared to most regional semiconductor peers, reflecting a premium market valuation. While its market capitalization is smaller than major industry leaders like TSM and NVIDIA, Credo's EV/EBITDA and price-to-CFO ratios are significantly elevated, suggesting expectations for strong future growth but also higher valuation risk. Peers such as Qualcomm and Marvell present more moderate valuation multiples, highlighting Credo's relatively expensive positioning within the sector.
Financial Metrics Comparison with Peers
Financial Statements
Comprehensive financial data including income, balance sheet, and cash flow metrics
Income Statement
| fiscal_date | 2025-04-30 | 2024-04-30 | 2023-04-30 | 2022-04-30 | 2021-04-30 |
|---|---|---|---|---|---|
| Sales | 436.77M | 192.97M | 184.19M | 106.48M | 58.70M |
| Cost Of Goods | 153.87M | 73.54M | 78.00M | 42.46M | 20.42M |
| Gross Profit | 282.91M | 119.43M | 106.19M | 64.02M | 38.28M |
| Operating Expense Research And Development | 145.99M | 95.53M | 76.77M | 47.95M | 34.84M |
| Operating Expense Selling General And Administrative | 98.92M | 60.19M | 48.25M | 34.90M | 28.67M |
| Operating Income | 38.00M | -36.29M | -18.83M | -18.83M | -25.23M |
| Other Income Expense | 16.87M | 13.55M | 914.00K | -3.38M | -62.00K |
| Pretax Income | 54.87M | -22.75M | -17.91M | -22.21M | -25.30M |
| Income Tax | 2.69M | 5.62M | -1.37M | -37.00K | 2.21M |
| Net Income | 52.18M | -28.37M | -16.55M | -22.18M | -27.51M |
| Eps Basic | 0.31 | -0.18 | -0.11 | -0.25 | -0.20 |
| Eps Diluted | 0.29 | -0.18 | -0.11 | -0.25 | -0.20 |
| Basic Shares Outstanding | 167.50M | 155.09M | 147.15M | 88.40M | 139.95M |
| Diluted Shares Outstanding | 167.50M | 155.09M | 147.15M | 88.40M | 139.95M |
| Ebit | 38.00M | -36.29M | -18.83M | -18.83M | -25.23M |
| Ebitda | 60.81M | -21.76M | -6.91M | -10.91M | -23.02M |
| Net Income Continuous Operations | 52.18M | -28.37M | -16.55M | -22.18M | -27.51M |
| Minority Interests | N/A | N/A | N/A | 0.00 | 0.00 |
Data provided by Twelve Data
Balance Sheet
| fiscal_date | 2025-04-30 | 2024-04-30 | 2023-04-30 | 2022-04-30 | 2021-04-30 |
|---|---|---|---|---|---|
| Cash And Cash Equivalents | 236.33M | 66.94M | 108.58M | 259.32M | 103.76M |
| Accounts Receivable | 162.14M | 59.66M | 49.54M | 29.52M | 13.64M |
| Total Assets | 809.26M | 601.93M | 397.29M | 375.69M | 155.49M |
| Total Liabilities | 127.67M | 61.73M | 49.65M | 41.53M | 210.92M |
| Long Term Debt | 12.69M | 11.13M | 12.87M | 14.81M | 0.00 |
| Shareholders Equity | 681.58M | 540.20M | 347.63M | 334.16M | -55.43M |
Data provided by Twelve Data
Cash Flow Statement
| fiscal_date | 2025-04-30 | 2024-04-30 | 2023-04-30 | 2022-04-30 | 2021-04-30 |
|---|---|---|---|---|---|
| Operating Activities Net Income | 52.18M | -28.37M | -16.55M | -22.18M | -27.51M |
| Operating Activities Depreciation | 21.94M | 13.77M | 9.51M | 4.79M | 2.22M |
| Operating Activities Stock Based Compensation | 77.36M | 39.02M | 23.52M | 9.19M | 2.57M |
| Operating Activities Accounts Receivable | -102.48M | -22.24M | -18.41M | -20.55M | -1.97M |
| Operating Activities Accounts Payable | 41.93M | 8.81M | -3.84M | 4.75M | 1.34M |
| Operating Activities Other Assets Liabilities | -63.78M | 14.72M | -29.17M | -26.21M | -6.66M |
| Operating Activities Operating Cash Flow | 27.14M | 25.71M | -34.94M | -50.21M | -30.01M |
| Investing Activities Capital Expenditures | -36.06M | -15.65M | -21.71M | -17.58M | -6.06M |
| Investing Activities Purchase Of Investments | -258.73M | -403.59M | -159.23M | 0.00 | 0.00 |
| Investing Activities Sale Of Investments | 406.78M | 169.75M | 50.00M | 0.00 | 0.00 |
| Investing Activities Investing Cash Flow | 111.99M | -249.49M | -130.94M | -17.58M | -6.06M |
| Financing Activities Common Stock Issuance | 0.00 | 173.43M | 0.00 | 201.45M | 99.35M |
| Financing Activities Other Financing Charges | -15.56M | -5.21M | -616.00K | N/A | N/A |
| Financing Activities Financing Cash Flow | -15.56M | 168.22M | -616.00K | 201.45M | 76.44M |
| End Cash Position | 236.33M | 66.94M | 108.58M | 259.32M | 103.76M |
| Income Tax Paid | 1.45M | 1.05M | 1.20M | 427.00K | 1.22M |
| Free Cash Flow | 29.02M | 17.09M | -46.33M | -48.41M | -48.42M |
| Financing Activities Common Stock Repurchase | N/A | N/A | 0.00 | 0.00 | -22.91M |
Data provided by Twelve Data
Technical Analysis
Key Insights
- The current trend shows consolidation with the stock price trading below its 52-week high but above key moving averages, indicating a stable but cautious price action.
- Key support levels are near $120, with resistance observed around $140 and the 52-week high at $213.80.
- The price remains above the 10-day, 50-day (approximately $141.54), and 200-day (approximately $122.50) moving averages, suggesting underlying medium to long-term bullish momentum.
- Momentum indicators such as RSI and MACD indicate moderate strength without overbought or oversold conditions, reflecting balanced market sentiment.
- Analysis across daily, weekly, and monthly timeframes shows consistent price support with potential for volatility given the stock's beta of 2.65.
- Current technical setup suggests possible sideways movement with opportunities for breakout if resistance levels are surpassed, while downside risk remains if support levels fail.
Trending News
1. Headline: Credo Technology Group (NASDAQ:CRDO) Stock Price Down 5.1% – What’s Next?
Summary: Shares of Credo Technology Group Holding Ltd. declined 5.1% recently, trading as low as $123.43 with volume down 25% from average daily levels. The price movement reflects short-term market volatility and investor caution amid broader sector dynamics.
Sentiment: Negative
2. Headline: Credo Technology Group (NASDAQ:CRDO) Stock Acquired Rep. Gilbert Ray Cisneros, Jr.
Summary: Representative Gilbert Ray Cisneros, Jr. disclosed a purchase of Credo Technology Group shares valued between $1,001 and $15,000, signaling interest from political figures in the company's equity.
Sentiment: Neutral
3. Headline: Vanguard Group Inc. Boosts Stock Position in Credo Technology Group Holding Ltd $CRDO
Summary: Vanguard Group increased its holdings in Credo Technology Group by 0.9% in the third quarter, reflecting institutional confidence and accumulation amid market fluctuations.
Sentiment: Positive
4. Headline: CRDO Stock Skyrockets 2,870% — Inside Credo Technology Group’s Explosive Rally
Summary: Credo Technology Group has experienced an extraordinary rally from its all-time low near $7.20 to a recent high around $213.80, highlighting significant investor interest and growth potential in its market niche.
Sentiment: Positive
5. Headline: How Shifting Analyst Narratives Are Reframing Credo Technology Group Holding (CRDO) And Its Valuation
Summary: Analysts have adjusted Credo Technology’s fair value estimate downward slightly from $214.27 to $208.38, alongside a minor change in discount rates, reflecting evolving views on risk and revenue growth projections.
Sentiment: Negative
Powered by Brave
Recent Updates
News Summary
Recent news on Credo Technology Group highlights a mixed market environment. The company maintains a strong outlook supported by PCIe 6.0 certification and positive revenue guidance, which underscores its technological leadership in high-speed data connectivity. However, the stock has experienced a significant price decline of approximately 32% over the past month, raising concerns about short-term volatility. Institutional investors like Vanguard have increased their holdings, signaling confidence amid market fluctuations. Analyst coverage by Goldman Sachs with a buy rating and price target reflects optimism about Credo's data center edge, although some narrative adjustments have trimmed fair value estimates. These developments collectively indicate a dynamic phase balancing growth prospects with market risks.
News Sentiment
Sentiment across recent news is mixed but leans toward cautious optimism. Positive themes include technological certifications, institutional accumulation, and strategic analyst coverage. Negative sentiments arise from recent stock price declines and valuation adjustments. Neutral reports focus on leadership activity and market positioning. Overall, the sentiment suggests attentive monitoring of both growth catalysts and volatility factors.
Analytical Overview
Analysis Summary
Valuation Metrics: Credo Technology's trailing P/E of 106.03 significantly exceeds the industry average, indicating a premium valuation. The forward P/E of 28.18 suggests market expectations of earnings growth, yet the PEG ratio is negative, reflecting complex growth-to-valuation dynamics.
Growth Trajectory: Revenue growth is positive at 2.72% quarterly, supported by increasing gross margins of 67.5% and operating margins near 29.4%. Cash flow trends show operating cash flow of $178 million and positive free cash flow, indicating operational strength.
Financial Health: The company exhibits a strong liquidity position with a current ratio of 8.86 and cash reserves exceeding $813 million, while total debt remains low at $16.4 million. The debt-to-equity ratio is modest at 1.28, supporting financial stability.
Sector Specific Factors: The semiconductor sector faces rapid innovation cycles and supply chain challenges, but Credo's focus on high-speed connectivity and energy efficiency aligns with growing demand in AI and data center markets. Competitive pressures and valuation volatility remain relevant considerations.
Market Positioning: Credo holds a strategic position in the technology sector with strong institutional backing and technological certifications, enhancing its competitive advantages within the global semiconductor landscape.
Investment Conclusion
Supporting Factors: Strong revenue growth and profitability margins support operational robustness.
Risk Factors: Elevated valuation multiples relative to peers may imply market pricing risks.
SWOT Analysis
Strengths
- Strong revenue growth with high gross and operating margins.
- Robust liquidity position with substantial cash reserves.
- Technological leadership demonstrated by PCIe 6.0 certification.
- High institutional ownership supporting governance and stability.
Weaknesses
- Premium valuation multiples relative to industry peers.
- High stock price volatility indicated by beta of 2.65.
- Negative PEG ratio reflecting complex growth valuation dynamics.
- Limited dividend yield offering no income return to shareholders.
Opportunities
- Expanding demand for high-speed connectivity in AI and data centers.
- Potential market share gains through energy-efficient product innovations.
- Strategic partnerships and certifications enhancing market positioning.
- Growth in hyperscale cloud and enterprise network infrastructure.
Threats
- Intense competition from larger semiconductor companies.
- Market sensitivity to valuation adjustments and investor sentiment.
- Supply chain disruptions impacting production and delivery.
- Regulatory and geopolitical risks affecting global operations.
Company Description
Credo Technology Group Holding Ltd. is a provider of connectivity solutions critical for modern high-speed networks and data infrastructure. Specializing in delivering cutting-edge products designed to optimize bandwidth, Credo serves a pivotal role in addressing the ever-increasing demand for efficient data transmission. Its offerings encompass high-performance semiconductors, optical components, and system-level solutions that are essential for data center, hyperscale cloud, service providers, and enterprise networks. Credo is at the forefront of a technological shift, bolstering the architecture that supports the digital ecosystem by enabling faster and more reliable data flows. Headquartered in the heart of Silicon Valley, Credo Technology Group has established itself as a significant player in the tech industry by fostering innovations that drive network efficiency and reduce operational costs. By focusing on energy-efficient designs and extensive industry partnerships, the company contributes to the broader market imperative of green computing solutions, thereby supporting sustainability in tech advancements. Through its technological prowess and strategic market positioning, Credo Technology Group holds a vital place in the infrastructure behind seamless global connectivity.