

Costco Wholesale Corporation (COST)
Stock Analysis Report
Stock Journey
Key Positives and Key Risks
Pros
- Strong revenue growth of 21.5% indicating robust top-line expansion.
- High return on equity at 29.65% reflecting efficient capital utilization.
- Operating cash flow of $15.0 billion supporting financial flexibility.
Cons
- Elevated trailing P/E ratio of 53.50 suggesting premium valuation.
- Recent product recall highlighting potential operational and reputational risks.
- Debt-to-equity ratio of 60.26% indicating moderate leverage.
Disclosure: This information is for general awareness and does not constitute investment advice
Report Summary
Costco Wholesale Corporation operates a global chain of membership-based warehouse clubs, primarily in the discount stores industry within the consumer defensive sector. Listed on NASDAQ under the symbol COST, the company serves millions of members worldwide through its United States, Canada, and International segments. Its product offerings include groceries, general merchandise, electronics, appliances, apparel, and additional services such as gasoline, pharmacy, optical, food courts, and travel. Costco’s business model emphasizes bulk purchasing and member loyalty, positioning it as a key player in value-driven retail procurement.
Financially, Costco reported trailing twelve months (TTM) revenue of approximately $286.3 billion with a gross margin of 12.76%, operating margin of 3.67%, and net profit margin of 2.99%. The company’s return on equity (ROE) stands at 29.65%, return on assets (ROA) at 8.72%, and return on invested capital (ROIC) is reflected in an enterprise value to EBITDA ratio of 33.75. These metrics indicate strong profitability and efficient capital utilization despite relatively modest profit margins typical of the retail warehouse club model.
Valuation metrics show a trailing price-to-earnings (P/E) ratio of 53.50 and a forward P/E of 45.61, with a price-to-book (P/B) ratio of 27.58 and an enterprise value to EBITDA (EV/EBITDA) of 33.75. The market capitalization is approximately $456.2 billion. The stock trades at $968.00, within a 52-week range of $844.06 to $1,096.50, suggesting it is currently positioned below its annual high but above its low, reflecting moderate price stability relative to its valuation multiples.
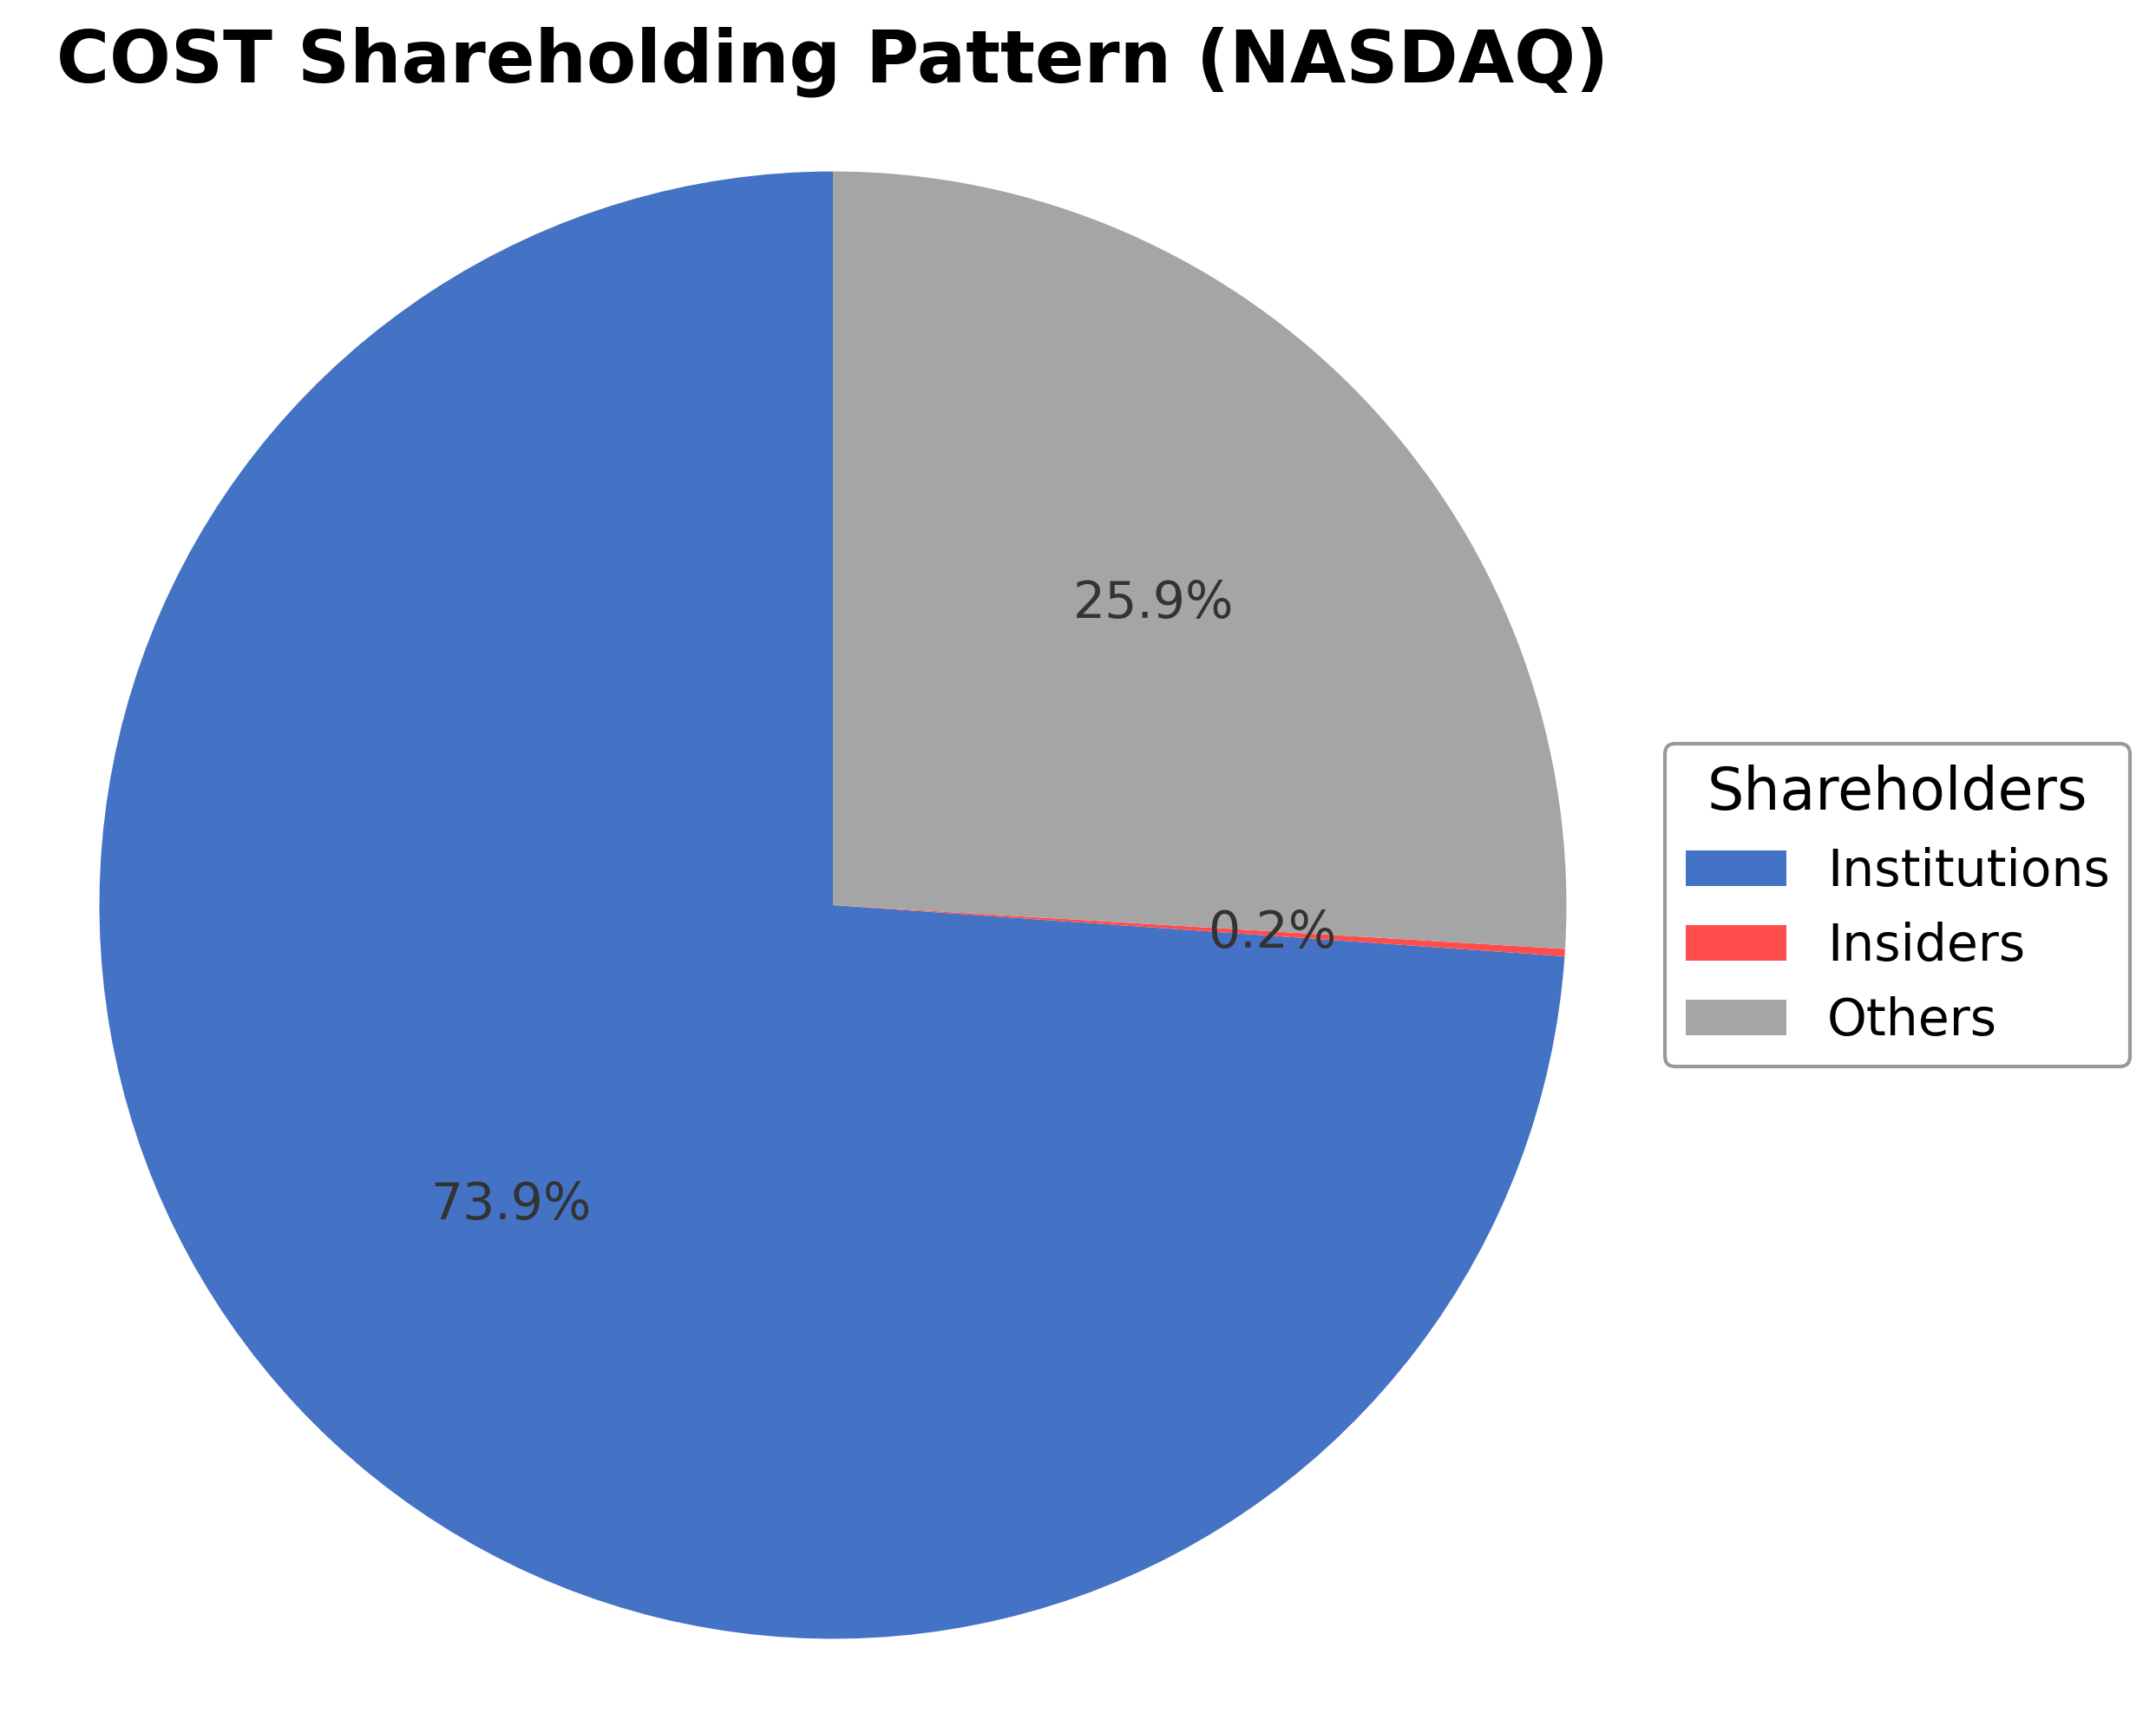
Costco’s notable strengths include strong operating cash flow of $15.0 billion TTM, a manageable debt-to-equity ratio of 60.26%, and a high institutional ownership of 73.89%, indicating robust market confidence. Key risks involve regulatory scrutiny, competitive pressures in the retail sector, and potential supply chain disruptions. Recent strategic developments include increased gas sales volumes amid rising fuel prices and ongoing institutional trading activity, with some funds increasing and others reducing positions.
Technically, the stock shows a stable trend with current price above the 200-day moving average but near the 50-day average, supported by momentum indicators signaling moderate strength. Market conditions suggest a balanced environment where accumulation and profit-taking dynamics coexist, warranting continued observation of price and volume patterns for directional cues.
Company and Industry Overview
Company Basics
Price Performance
Company Size
Shareholding Pattern
Sector and Industry Analysis
The consumer defensive sector, encompassing essential goods and services, remains resilient amid economic fluctuations due to steady demand for everyday products. The discount stores industry, a significant segment within this sector, has experienced consistent growth driven by consumer preference for value and bulk purchasing. Major players include Costco Wholesale Corporation, Walmart, and Target, which leverage scale and supply chain efficiencies to capture market share in a competitive retail landscape.
Industry trends highlight a shift toward membership-based warehouse clubs and e-commerce integration, with companies like Costco emphasizing curated product selections and private labels to enhance customer loyalty and margins. Competitive dynamics are shaped by high barriers to entry, including substantial capital investment for warehouse infrastructure and supply chain networks. Retailers increasingly focus on omnichannel strategies, digital innovation, and ancillary services such as pharmacy and travel to differentiate offerings and drive traffic.
The regulatory environment for discount stores involves compliance with consumer protection laws, labor regulations, and trade policies affecting tariffs and import costs. Recent emphasis on wage standards and sustainability reporting impacts operational costs and corporate responsibility initiatives. Ongoing scrutiny of supply chain practices and data privacy regulations also influences strategic planning, requiring retailers to adapt to evolving legal frameworks while maintaining competitive positioning.
Note: Analysis synthesized from industry research, market reports, and regulatory filings. Information is subject to change based on market conditions.
Financial Ratios Dashboard
Illustrative Scenario Analysis
DCF Assumptions:
Method: Two-Stage EPS-Priority Model
Financials
Peer Analysis
| Company Name | Market Cap | P/E Ratio | P/B Ratio | EV/EBITDA | Price to CFO |
|---|---|---|---|---|---|
| Costco Wholesale Corporation | $456.18B | 53.50 | 27.58 | 33.75 | 30.39 |
| Target Corporation | $57.04B | 16.59 | 3.52 | 9.37 | 8.15 |
| Walmart Inc. | $ 0.00 | N/A | N/A | N/A | N/A |
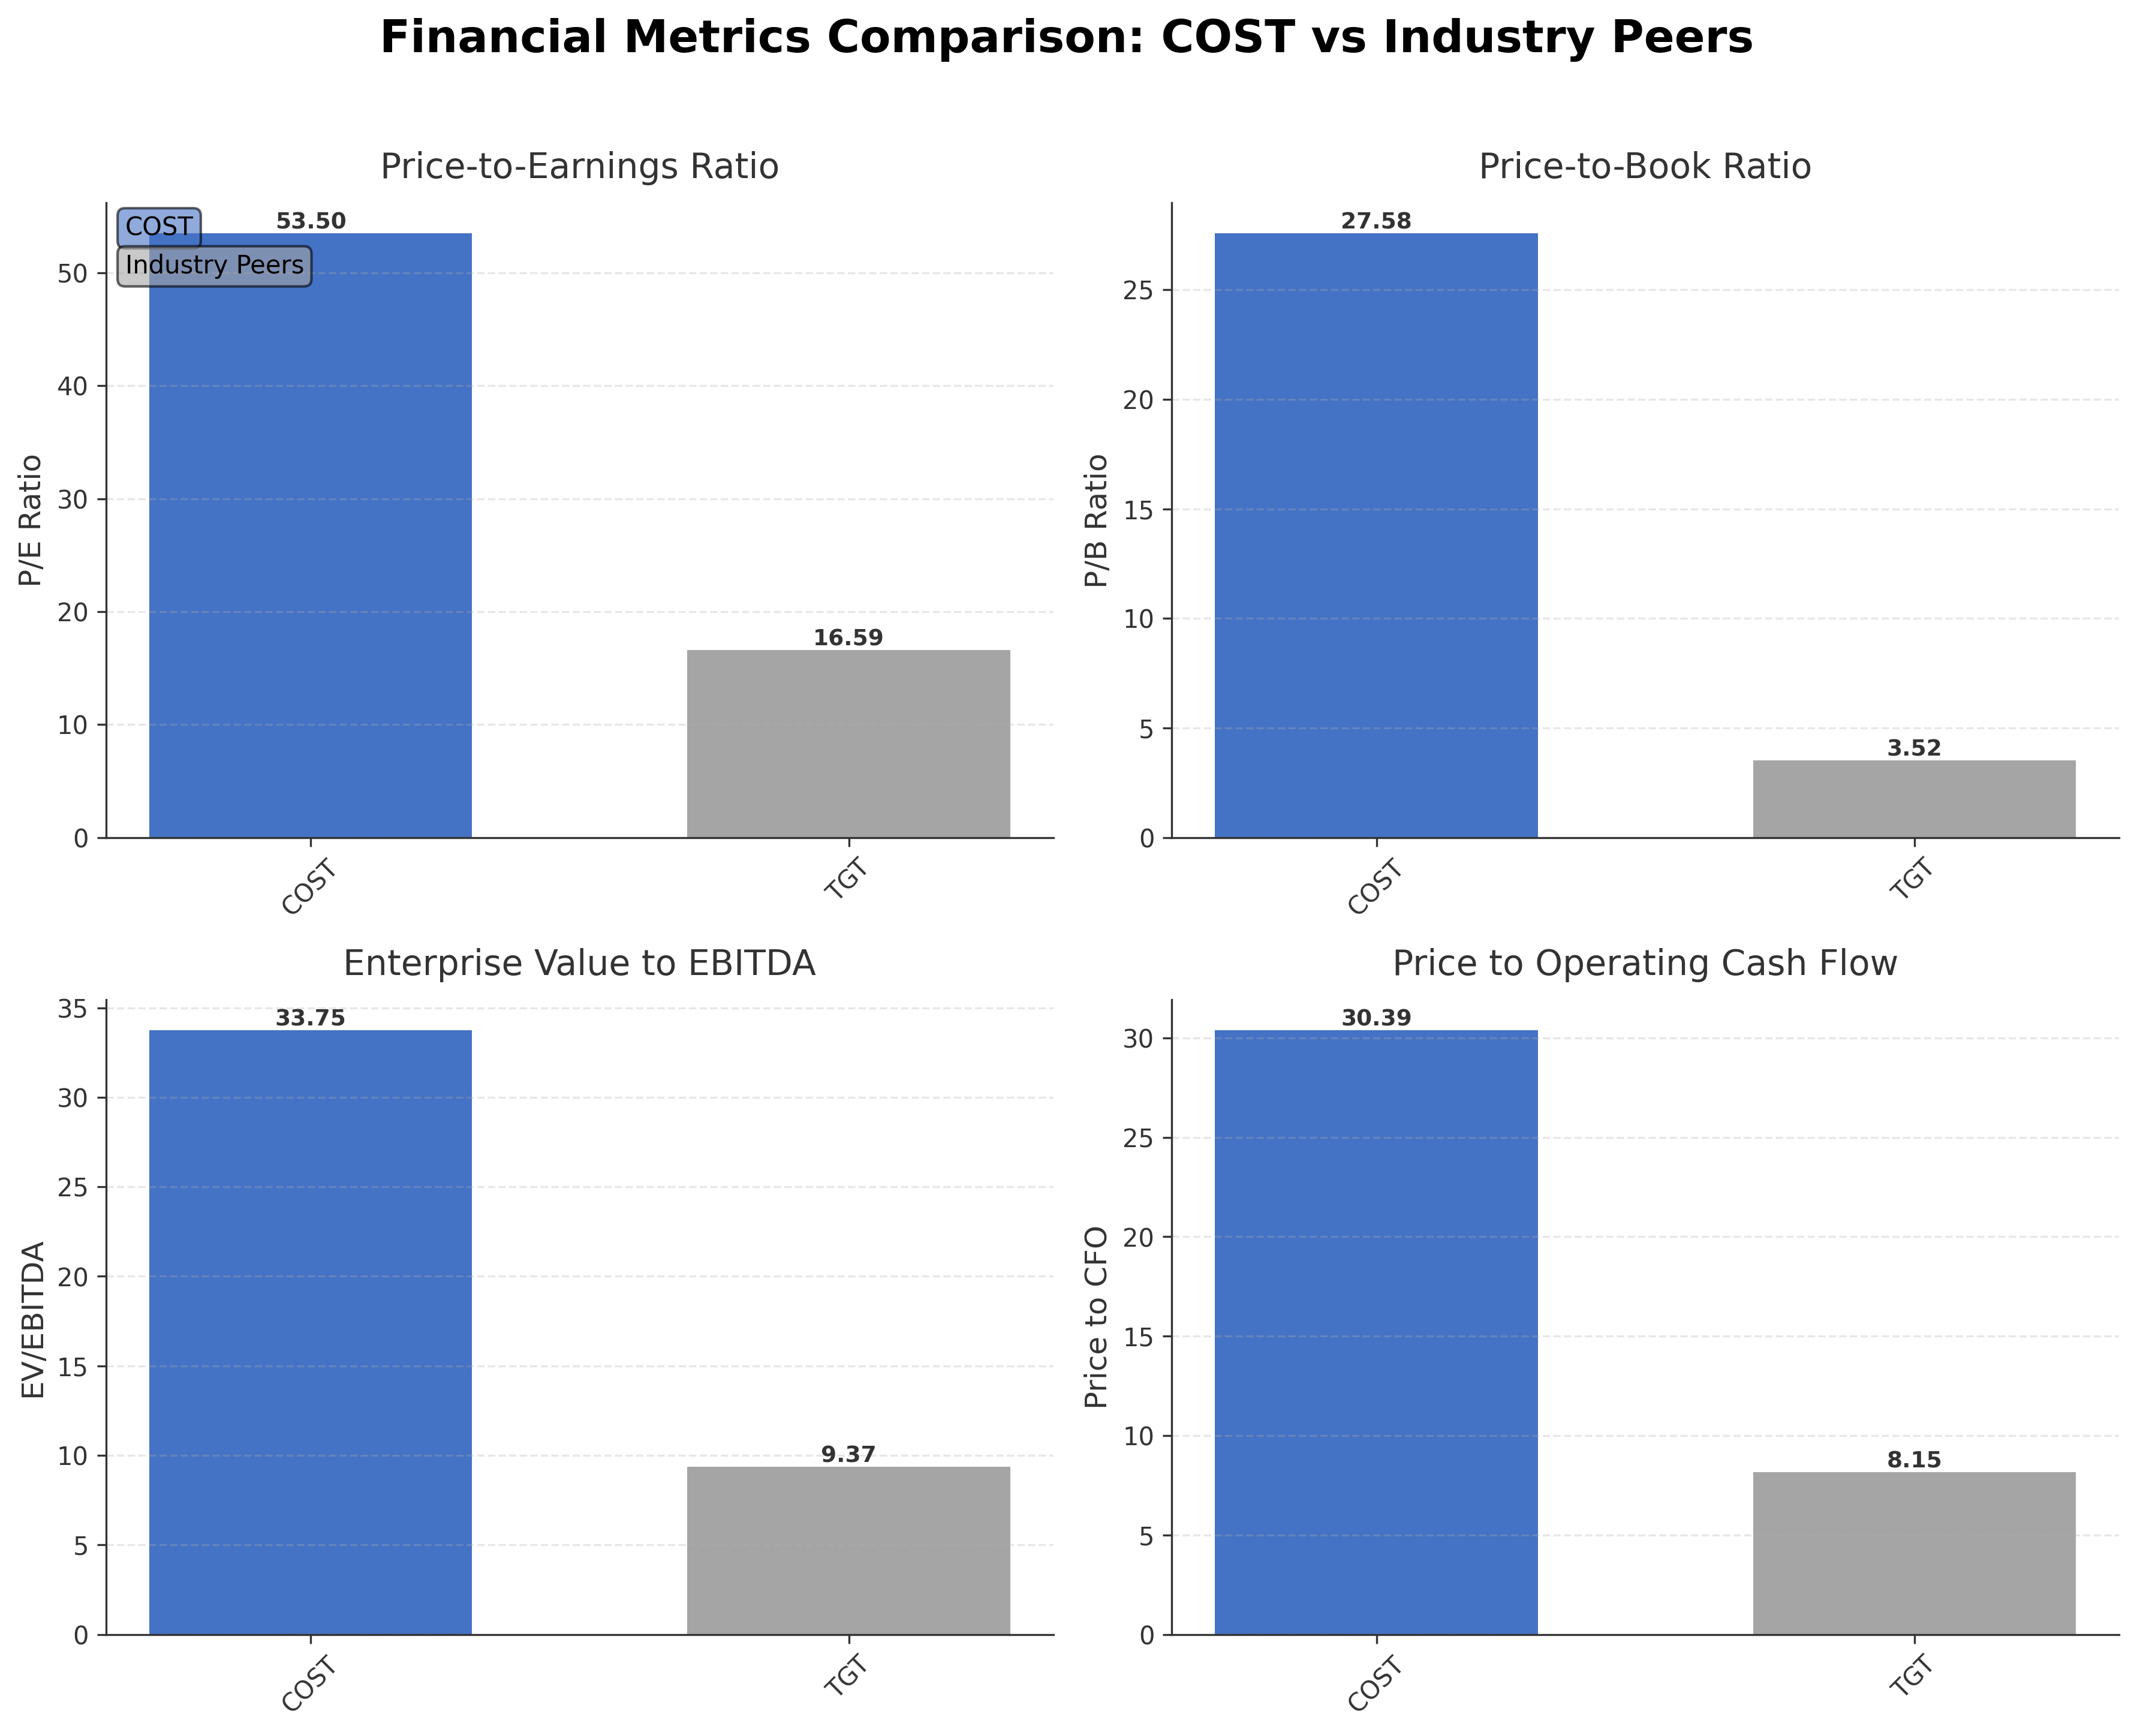
Comparison Analysis: Costco Wholesale Corporation exhibits significantly higher valuation multiples compared to its peer Target Corporation, with a trailing P/E of 53.50 versus 16.59 and a P/B ratio of 27.58 against 3.52. Its EV/EBITDA and price to CFO ratios are also markedly elevated, reflecting a premium pricing relative to fundamentals. However, Costco's return on equity of 29.65% surpasses Target's 22.00%, indicating superior profitability and capital efficiency. Walmart data is unavailable for direct comparison. Overall, Costco stands out for its strong financial performance but trades at a substantial premium compared to regional industry peers.
Financial Metrics Comparison with Peers
Financial Statements
Comprehensive financial data including income, balance sheet, and cash flow metrics
Income Statement
| fiscal_date | 2025-08-31 | 2024-08-31 | 2023-08-31 | 2022-08-31 | 2021-08-31 |
|---|---|---|---|---|---|
| Sales | 275.24B | 254.45B | 242.29B | 226.95B | 195.93B |
| Cost Of Goods | 239.89B | 222.36B | 212.59B | 199.38B | 170.68B |
| Gross Profit | 35.35B | 32.09B | 29.70B | 27.57B | 25.25B |
| Operating Expense Selling General And Administrative | 24.97B | 22.81B | 21.59B | 19.78B | 18.54B |
| Operating Income | 10.38B | 9.29B | 8.11B | 7.79B | 6.71B |
| Non Operating Interest Income | 505.00M | 533.00M | 504.00M | 99.00M | 87.00M |
| Non Operating Interest Expense | 154.00M | 169.00M | 160.00M | 158.00M | 171.00M |
| Other Income Expense | 84.00M | 26.00M | 29.00M | 106.00M | 56.00M |
| Pretax Income | 10.82B | 9.74B | 8.49B | 7.84B | 6.68B |
| Income Tax | 2.72B | 2.37B | 2.19B | 1.93B | 1.60B |
| Net Income | 8.10B | 7.37B | 6.29B | 5.92B | 5.08B |
| Eps Basic | 18.24 | 16.59 | 14.18 | 13.17 | 11.30 |
| Eps Diluted | 18.21 | 16.56 | 14.16 | 13.14 | 11.27 |
| Basic Shares Outstanding | 443.99M | 443.91M | 443.85M | 443.65M | 443.09M |
| Diluted Shares Outstanding | 443.99M | 443.91M | 443.85M | 443.65M | 443.09M |
| Ebit | 10.97B | 9.91B | 8.65B | 8.00B | 6.85B |
| Ebitda | 13.31B | 12.12B | 10.70B | 9.79B | 8.58B |
| Net Income Continuous Operations | 8.10B | 7.37B | 6.29B | 5.92B | 5.08B |
| Minority Interests | N/A | 0.00 | 0.00 | -71.00M | -72.00M |
| Operating Expense Other Operating Expenses | N/A | N/A | N/A | N/A | 76.00M |
Data provided by Twelve Data
Balance Sheet
| fiscal_date | 2025-08-31 | 2024-08-31 | 2023-08-31 | 2022-08-31 | 2021-08-31 |
|---|---|---|---|---|---|
| Cash And Cash Equivalents | 14.16B | 9.91B | 13.70B | 10.20B | 11.26B |
| Accounts Receivable | 3.20B | 2.72B | 2.29B | 2.24B | 1.80B |
| Total Assets | 77.10B | 69.83B | 68.99B | 64.17B | 59.27B |
| Total Liabilities | 47.94B | 46.21B | 43.94B | 43.52B | 41.19B |
| Long Term Debt | 8.17B | 8.17B | 7.80B | 8.97B | 9.33B |
| Shareholders Equity | 29.16B | 23.62B | 25.06B | 20.65B | 18.08B |
Data provided by Twelve Data
Cash Flow Statement
| fiscal_date | 2025-08-31 | 2024-08-31 | 2023-08-31 | 2022-08-31 | 2021-08-31 |
|---|---|---|---|---|---|
| Operating Activities Net Income | 8.10B | 7.37B | 6.29B | 5.92B | 5.08B |
| Operating Activities Depreciation | 2.43B | 2.24B | 2.08B | 1.90B | 1.78B |
| Operating Activities Stock Based Compensation | 860.00M | 818.00M | 774.00M | 724.00M | 665.00M |
| Operating Activities Other Non Cash Items | 303.00M | 315.00M | 412.00M | 377.00M | 286.00M |
| Operating Activities Accounts Payable | 404.00M | 1.94B | -382.00M | 1.89B | 1.84B |
| Operating Activities Other Assets Liabilities | 1.36B | -1.33B | 1.40B | -3.45B | -835.00M |
| Operating Activities Operating Cash Flow | 13.45B | 11.35B | 10.57B | 7.32B | 8.87B |
| Investing Activities Capital Expenditures | -5.50B | -4.71B | -4.32B | -3.89B | -3.59B |
| Investing Activities Purchase Of Investments | -1.03B | -1.47B | -1.62B | -1.12B | -1.33B |
| Investing Activities Sale Of Investments | 1.14B | 1.79B | 937.00M | 1.15B | 1.45B |
| Investing Activities Other Investing Activity | 74.00M | -19.00M | 36.00M | -48.00M | -62.00M |
| Investing Activities Investing Cash Flow | -5.31B | -4.41B | -4.97B | -3.92B | -3.54B |
| Financing Activities Long Term Debt Issuance | 0.00 | 498.00M | 0.00 | 0.00 | 188.00M |
| Financing Activities Long Term Debt Payments | -1.11B | -2.13B | -1.30B | -986.00M | -161.00M |
| Financing Activities Short Term Debt Issuance | -46.00M | 8.00M | -18.00M | 47.00M | 41.00M |
| Financing Activities Common Stock Repurchase | -903.00M | -700.00M | -676.00M | -439.00M | -496.00M |
| Financing Activities Common Dividends | -2.18B | -9.04B | -1.25B | -1.50B | -5.75B |
| Financing Activities Other Financing Charges | -393.00M | -315.00M | -303.00M | -1.41B | -124.00M |
| Financing Activities Financing Cash Flow | -4.64B | -11.68B | -3.55B | -4.29B | -6.30B |
| End Cash Position | 14.16B | 9.91B | 13.70B | 10.20B | 11.26B |
| Income Tax Paid | 2.92B | 2.32B | 2.23B | 1.94B | 1.53B |
| Interest Paid | 106.00M | 129.00M | 125.00M | 145.00M | 149.00M |
| Free Cash Flow | 7.84B | 6.63B | 6.75B | 3.50B | 5.37B |
| Operating Activities Deferred Taxes | N/A | N/A | N/A | -37.00M | 59.00M |
| Investing Activities Net Acquisitions | N/A | N/A | N/A | 0.00 | 0.00 |
Data provided by Twelve Data
Technical Analysis
Key Insights
- Costco's current trend shows a stable upward movement with price consolidating near the 50-day moving average at approximately $1,007 and above the 200-day moving average near $957, indicating medium to long-term bullish momentum.
- Key support levels are identified near the 52-week low at $844 and the 200-day moving average around $957, while resistance is observed near the 52-week high of $1,096 and the 50-day moving average at $1,007.
- The stock price currently trades below the 50-day moving average but comfortably above the 200-day moving average, suggesting a potential short-term consolidation within a longer-term uptrend.
- Momentum indicators such as RSI and MACD reflect moderate strength with RSI near neutral levels and MACD showing a slight positive crossover, indicating balanced momentum without extreme overbought or oversold conditions.
- Multi-timeframe analysis reveals consistent price support on weekly and monthly charts, with daily charts showing minor fluctuations around moving averages, reflecting a stable technical setup.
- Potential market scenarios include continuation of the current consolidation phase with possible upward breakout if volume increases, or a retest of support levels if momentum weakens.
Trending News
1. Headline: 1,738 Shares in Costco Wholesale Corporation $COST Purchased by SBI Okasan Asset Management Co.Ltd.
Summary: SBI Okasan Asset Management Co.Ltd. purchased a new position in shares of Costco Wholesale Corporation (NASDAQ:COST - Free Report) during the fourth quarter, according to the company in its most recent Form 13F filing with the Securities & Exchange Commission. The firm purchased 1,738 shares of
Sentiment: neutral
2. Headline: Intech Investment Management LLC Sells 4,792 Shares of Costco Wholesale Corporation $COST
Summary: Intech Investment Management LLC reduced its position in shares of Costco Wholesale Corporation (NASDAQ:COST - Free Report) by 11.6% in the 4th quarter, according to the company in its most recent filing with the Securities and Exchange Commission. The firm owned 36,606 shares of the retailer's sto
Sentiment: negative
3. Headline: Costco Wholesale Q3 Earnings Call Highlights
Summary: Interested in Costco Wholesale Corporation? Here are five stocks we like better.
Sentiment: positive
4. Headline: Costco says it saw 'record-breaking' gas volumes amid rising prices
Summary: Costco saw "recording-breaking volumes" of gas sales and said rising fuel prices drove first-time members to its stations.
Sentiment: positive
5. Headline: Upcoming Earnings Reports: Costco (COST), Dell (DELL), and Others
Summary: GuruAI Model Portfolios All-In-One ... Widgets Stock Market Holidays Transcripts Search ... Chat Support Create a ticket User Engagement Meeting 469-248-6885 Status Take Survey Give us your feedback ... On May 28, 2026, investors are eagerly anticipating the earnings announcement from Costco Wholesale Corporation ...
Sentiment: neutral
Powered by Brave
Recent Updates
News Summary
As of 2026-05-28. Costco Wholesale Corporation reported record-breaking gas sales volumes during its recent quarter, driven by rising fuel prices that attracted many first-time members to its gas stations, positively impacting overall performance. Concurrently, the company initiated a recall of Agio Menlo Woven Patio Swings sold from February to March 2026 due to seat detachments causing injuries, with consumers eligible for free repairs. These developments highlight Costco's ability to capitalize on market trends while managing product safety concerns promptly. The gas sales surge underscores operational strength, whereas the recall reflects proactive risk management in consumer product safety.
News Sentiment
The overall sentiment from recent updates is mixed yet leans toward neutral to slightly positive. Positive momentum stems from record gas sales volumes boosting membership and revenue, while the recall of patio swings introduces a cautionary note regarding product safety. Institutional trading activity shows both accumulation and reduction, reflecting balanced market views. The combination of operational growth and risk mitigation efforts suggests a stable outlook with manageable challenges.
Source List
- https://cnbc.com/2026/05/28/costco-cost-q3-2026-earnings.html
Analytical Overview
Analysis Summary
Costco Wholesale Corporation’s valuation metrics, including a trailing P/E of 53.50 and forward P/E of 45.61, are significantly higher than the industry average P/E of 53.50, indicating a premium valuation relative to peers. The company’s revenue growth rate of 21.5% and strong operating cash flow of $15.0 billion demonstrate a robust growth trajectory supported by solid cash generation. Financial health is sound with a debt-to-equity ratio of 60.26% and free cash flow of approximately $6.7 billion, reflecting manageable leverage and liquidity. Sector-specific challenges include competitive pressures in discount retail and supply chain risks, while opportunities arise from expanding membership and ancillary services. Market positioning and competitive advantages such as bulk purchasing and member loyalty underpin Costco’s resilience in the consumer defensive sector.
Overall Business and Market Assessment
Supporting Factors: Costco’s strong revenue growth of 21.5%, high return on equity at 29.65%, and substantial operating cash flow of $15.0 billion, which collectively indicate operational strength and profitability
Risk Factors: the elevated valuation multiples that may limit upside potential and the recent product recall that highlights reputational and operational risks
SWOT Analysis
Strengths
- Strong brand recognition and loyal membership base.
- Robust revenue growth of 21.5% and high return on equity of 29.65%.
- Significant operating cash flow of $15.0 billion supporting financial flexibility.
- Efficient bulk purchasing model reducing costs and enhancing value.
Weaknesses
- High valuation multiples with P/E ratio of 53.50 and P/B ratio of 27.58.
- Relatively low profit margins typical of warehouse club retailing.
- Moderate debt-to-equity ratio of 60.26% indicating leverage.
- Limited insider ownership at 0.16% reducing direct management stake.
Opportunities
- Expansion of ancillary services such as gasoline and pharmacy driving membership growth.
- Potential to increase international market penetration.
- Rising fuel prices boosting gas sales volumes and revenue.
- Technological enhancements to improve operational efficiency.
Threats
- Intense competition in the discount retail sector.
- Regulatory scrutiny and compliance risks.
- Supply chain disruptions impacting inventory availability.
- Product safety issues as evidenced by recent patio swing recall.
Company Description
Costco Wholesale Corporation operates a global chain of membership-based warehouse clubs, offering high-quality goods and services at low prices. Customers access a vast selection of products through annual membership fees, including groceries, general merchandise, electronics, appliances, and apparel. The company provides additional services such as gasoline, pharmacy, optical, food courts, and travel offerings. Its business spans three main segments: United States, Canada, and International, with warehouses serving millions of members worldwide. Grocery items constitute a significant portion of sales, complemented by non-food merchandise and ancillary services that enhance the shopping experience. Founded in 1983 and headquartered in Issaquah, Washington, Costco Wholesale Corporation emphasizes bulk purchasing, efficient operations, and member loyalty in the discount retail sector. This model supports its role as a key player in the consumer defensive industry, catering to both individual households and small businesses seeking value-driven procurement.