
Coromandel International Ltd (COROMANDEL)
Stock Analysis Report
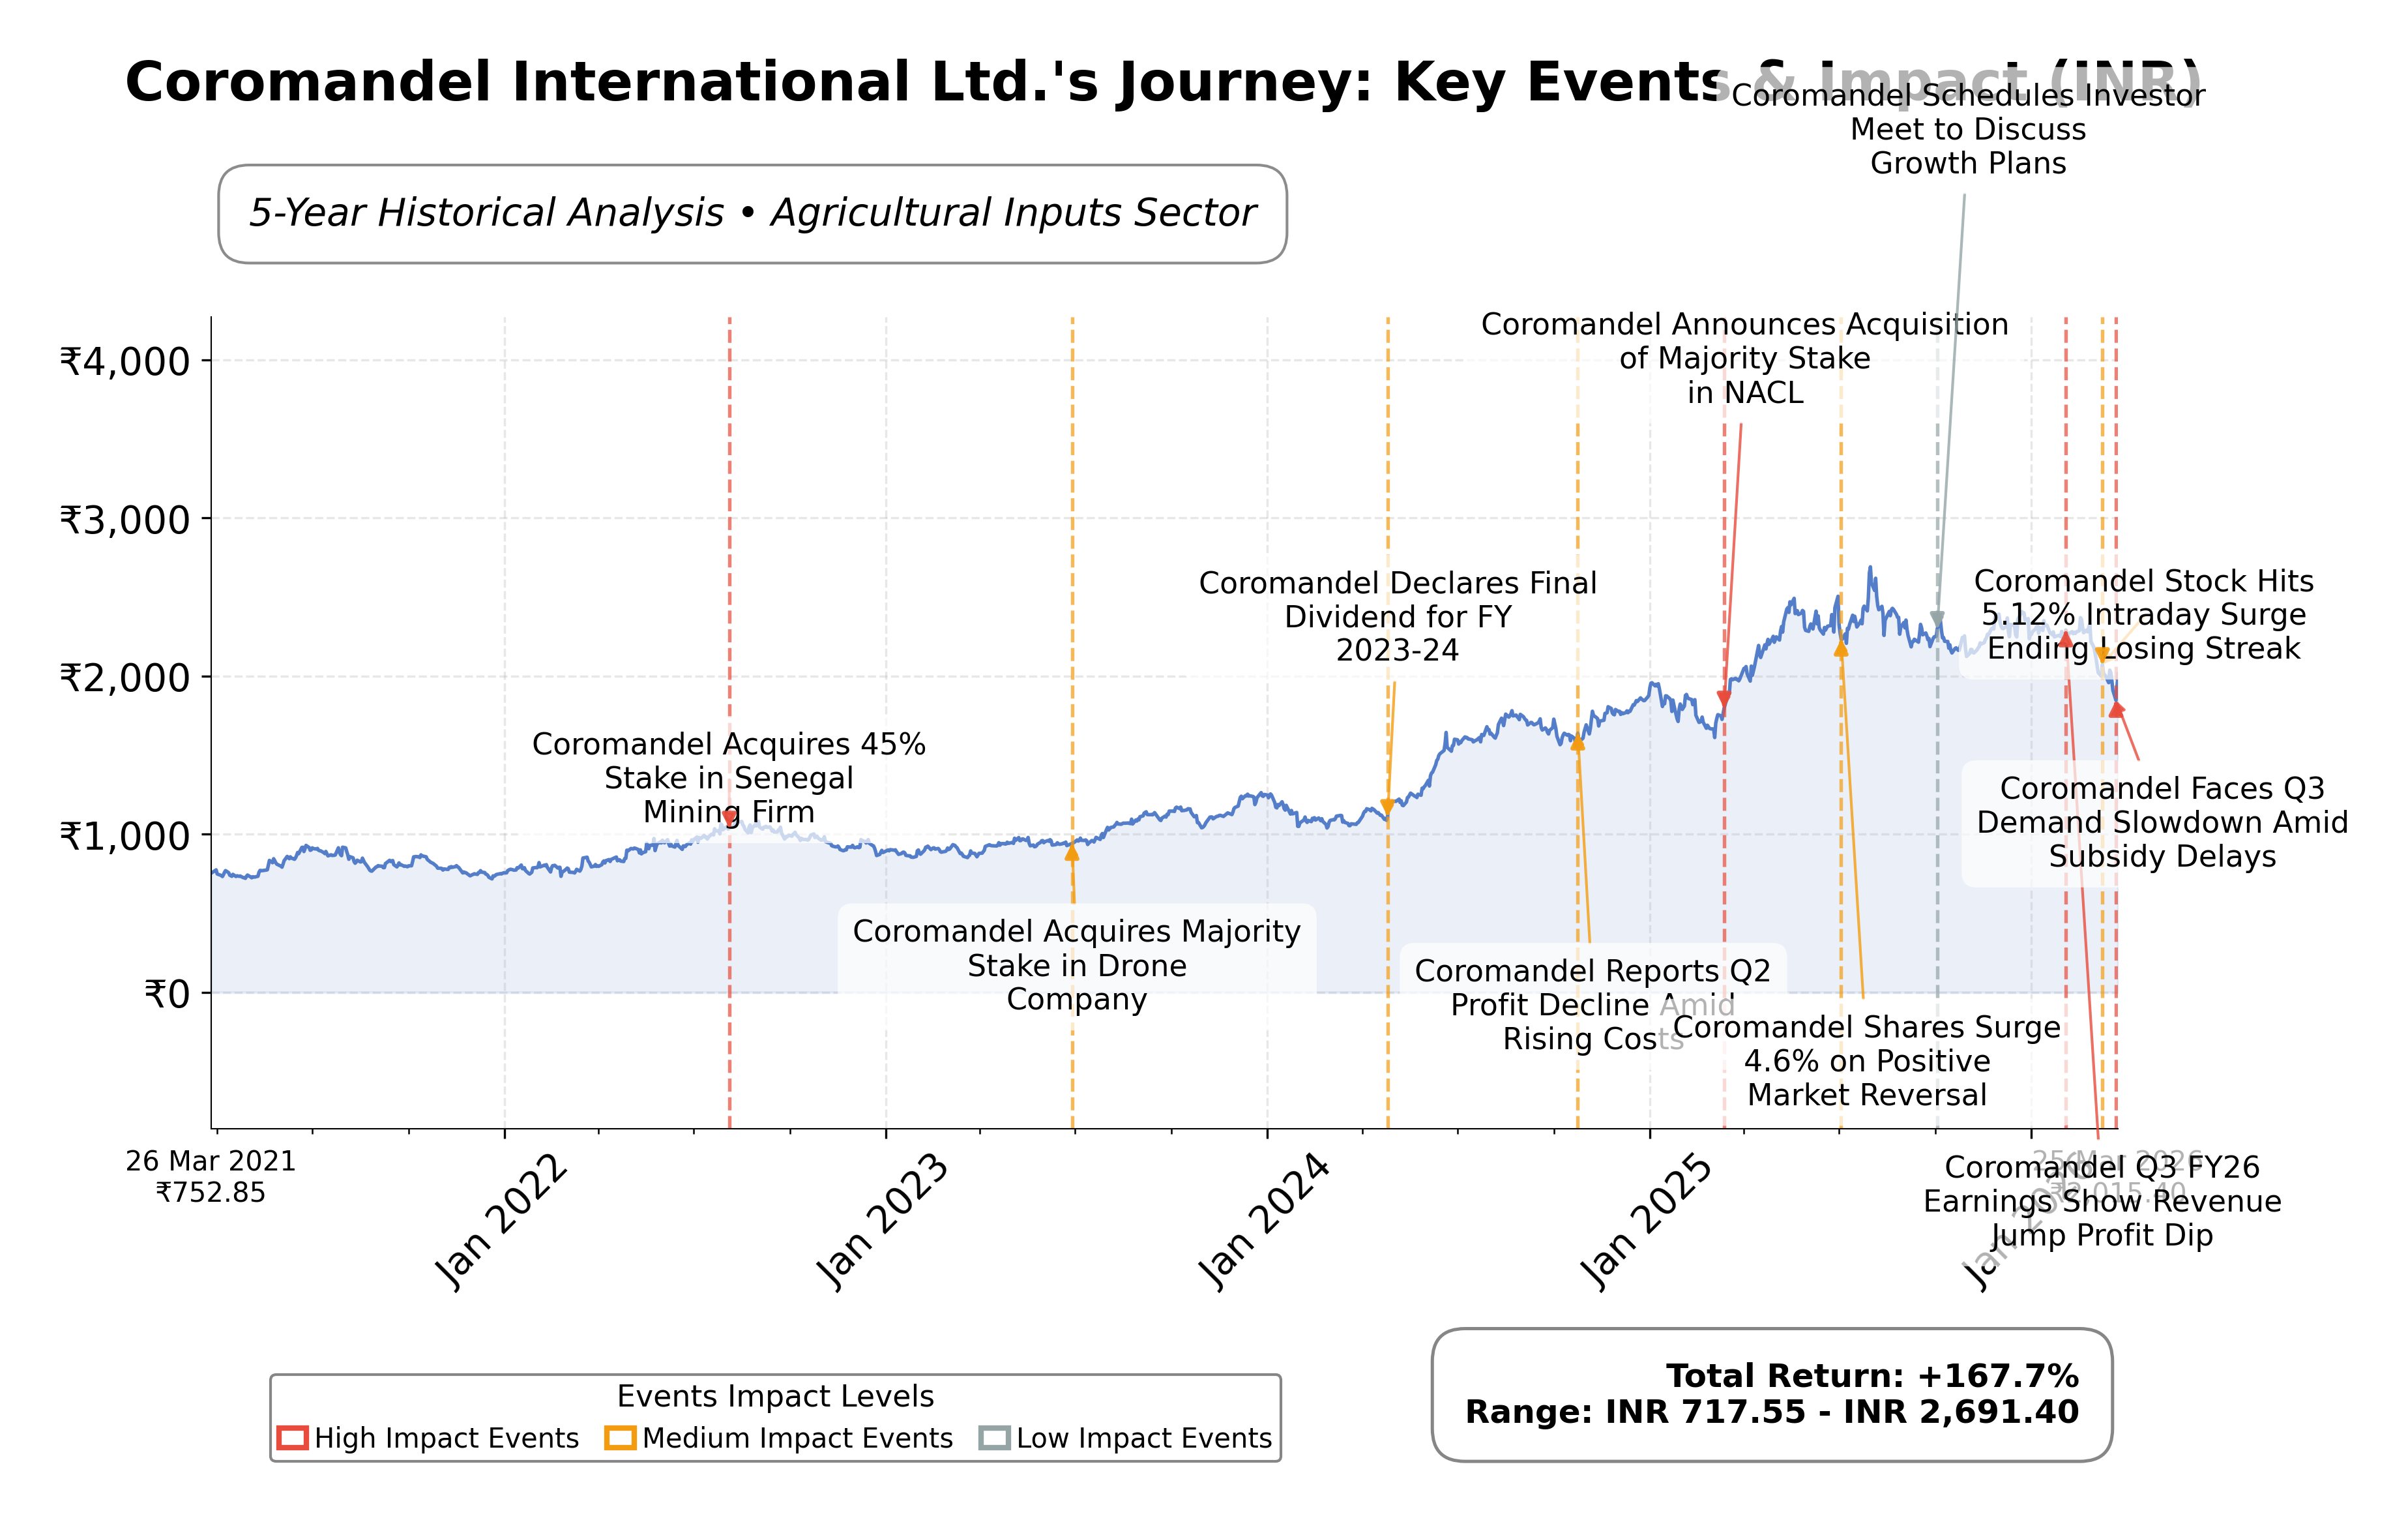
Stock Journey
Key Positives and Key Risks
Pros
- Revenue growth of 26.6% year-over-year demonstrates strong top-line momentum supporting operational expansion.
- Return on equity of 18.41% indicates efficient use of shareholder capital and solid profitability.
- Total cash reserves of ₹42.63 billion provide liquidity strength and financial flexibility.
Cons
- Stock trading near 52-week low with a downside risk of approximately 25% from recent highs reflects market caution.
- Negative quarterly earnings growth year-over-year (-1.2%) signals potential near-term profitability pressure.
- Sectoral headwinds including monsoon disruptions and subsidy uncertainties pose risks to volume and margin stability.
Disclosure: This information is for general awareness and does not constitute investment advice
Report Summary
Coromandel International Ltd. operates primarily in the agricultural inputs sector, focusing on the production and distribution of fertilizers, crop protection chemicals, and specialty nutrients. Positioned as one of India's leading agri-solutions providers, the company supports agricultural productivity and sustainability through innovative products and an extensive distribution network. Headquartered in Secunderabad, India, Coromandel plays a vital role in reinforcing the agricultural infrastructure aligned with national priorities on food security and sustainable farming.
Financially, Coromandel International reports a market capitalization of approximately â¹563.21 billion with a trailing P/E ratio of 23.53 and a forward P/E of 20.23, reflecting valuation metrics close to the industry average. The company demonstrates solid profitability with a profit margin of 7.87%, return on equity at 18.41%, and operating margin near 7.44%. Its enterprise value to EBITDA stands at 17.60, indicating moderate valuation relative to earnings. The firm maintains a healthy balance sheet with a current ratio of 1.89, total cash of â¹42.63 billion, and manageable debt levels.
Technically, Coromandel's stock price currently trades near â¹2015.40, below its 52-week high of â¹2718.90 but above the 52-week low of â¹1855.05, indicating some downside risk. The company has recently undertaken strategic initiatives including a significant acquisition of a controlling stake in NACL Industries and an aggressive capital expenditure plan aimed at margin expansion. Leadership changes and reclassification of promoter holdings have also been noted. Key risks include sectoral headwinds such as monsoon disruptions and subsidy uncertainties, while strengths lie in its market leadership and innovation capabilities.
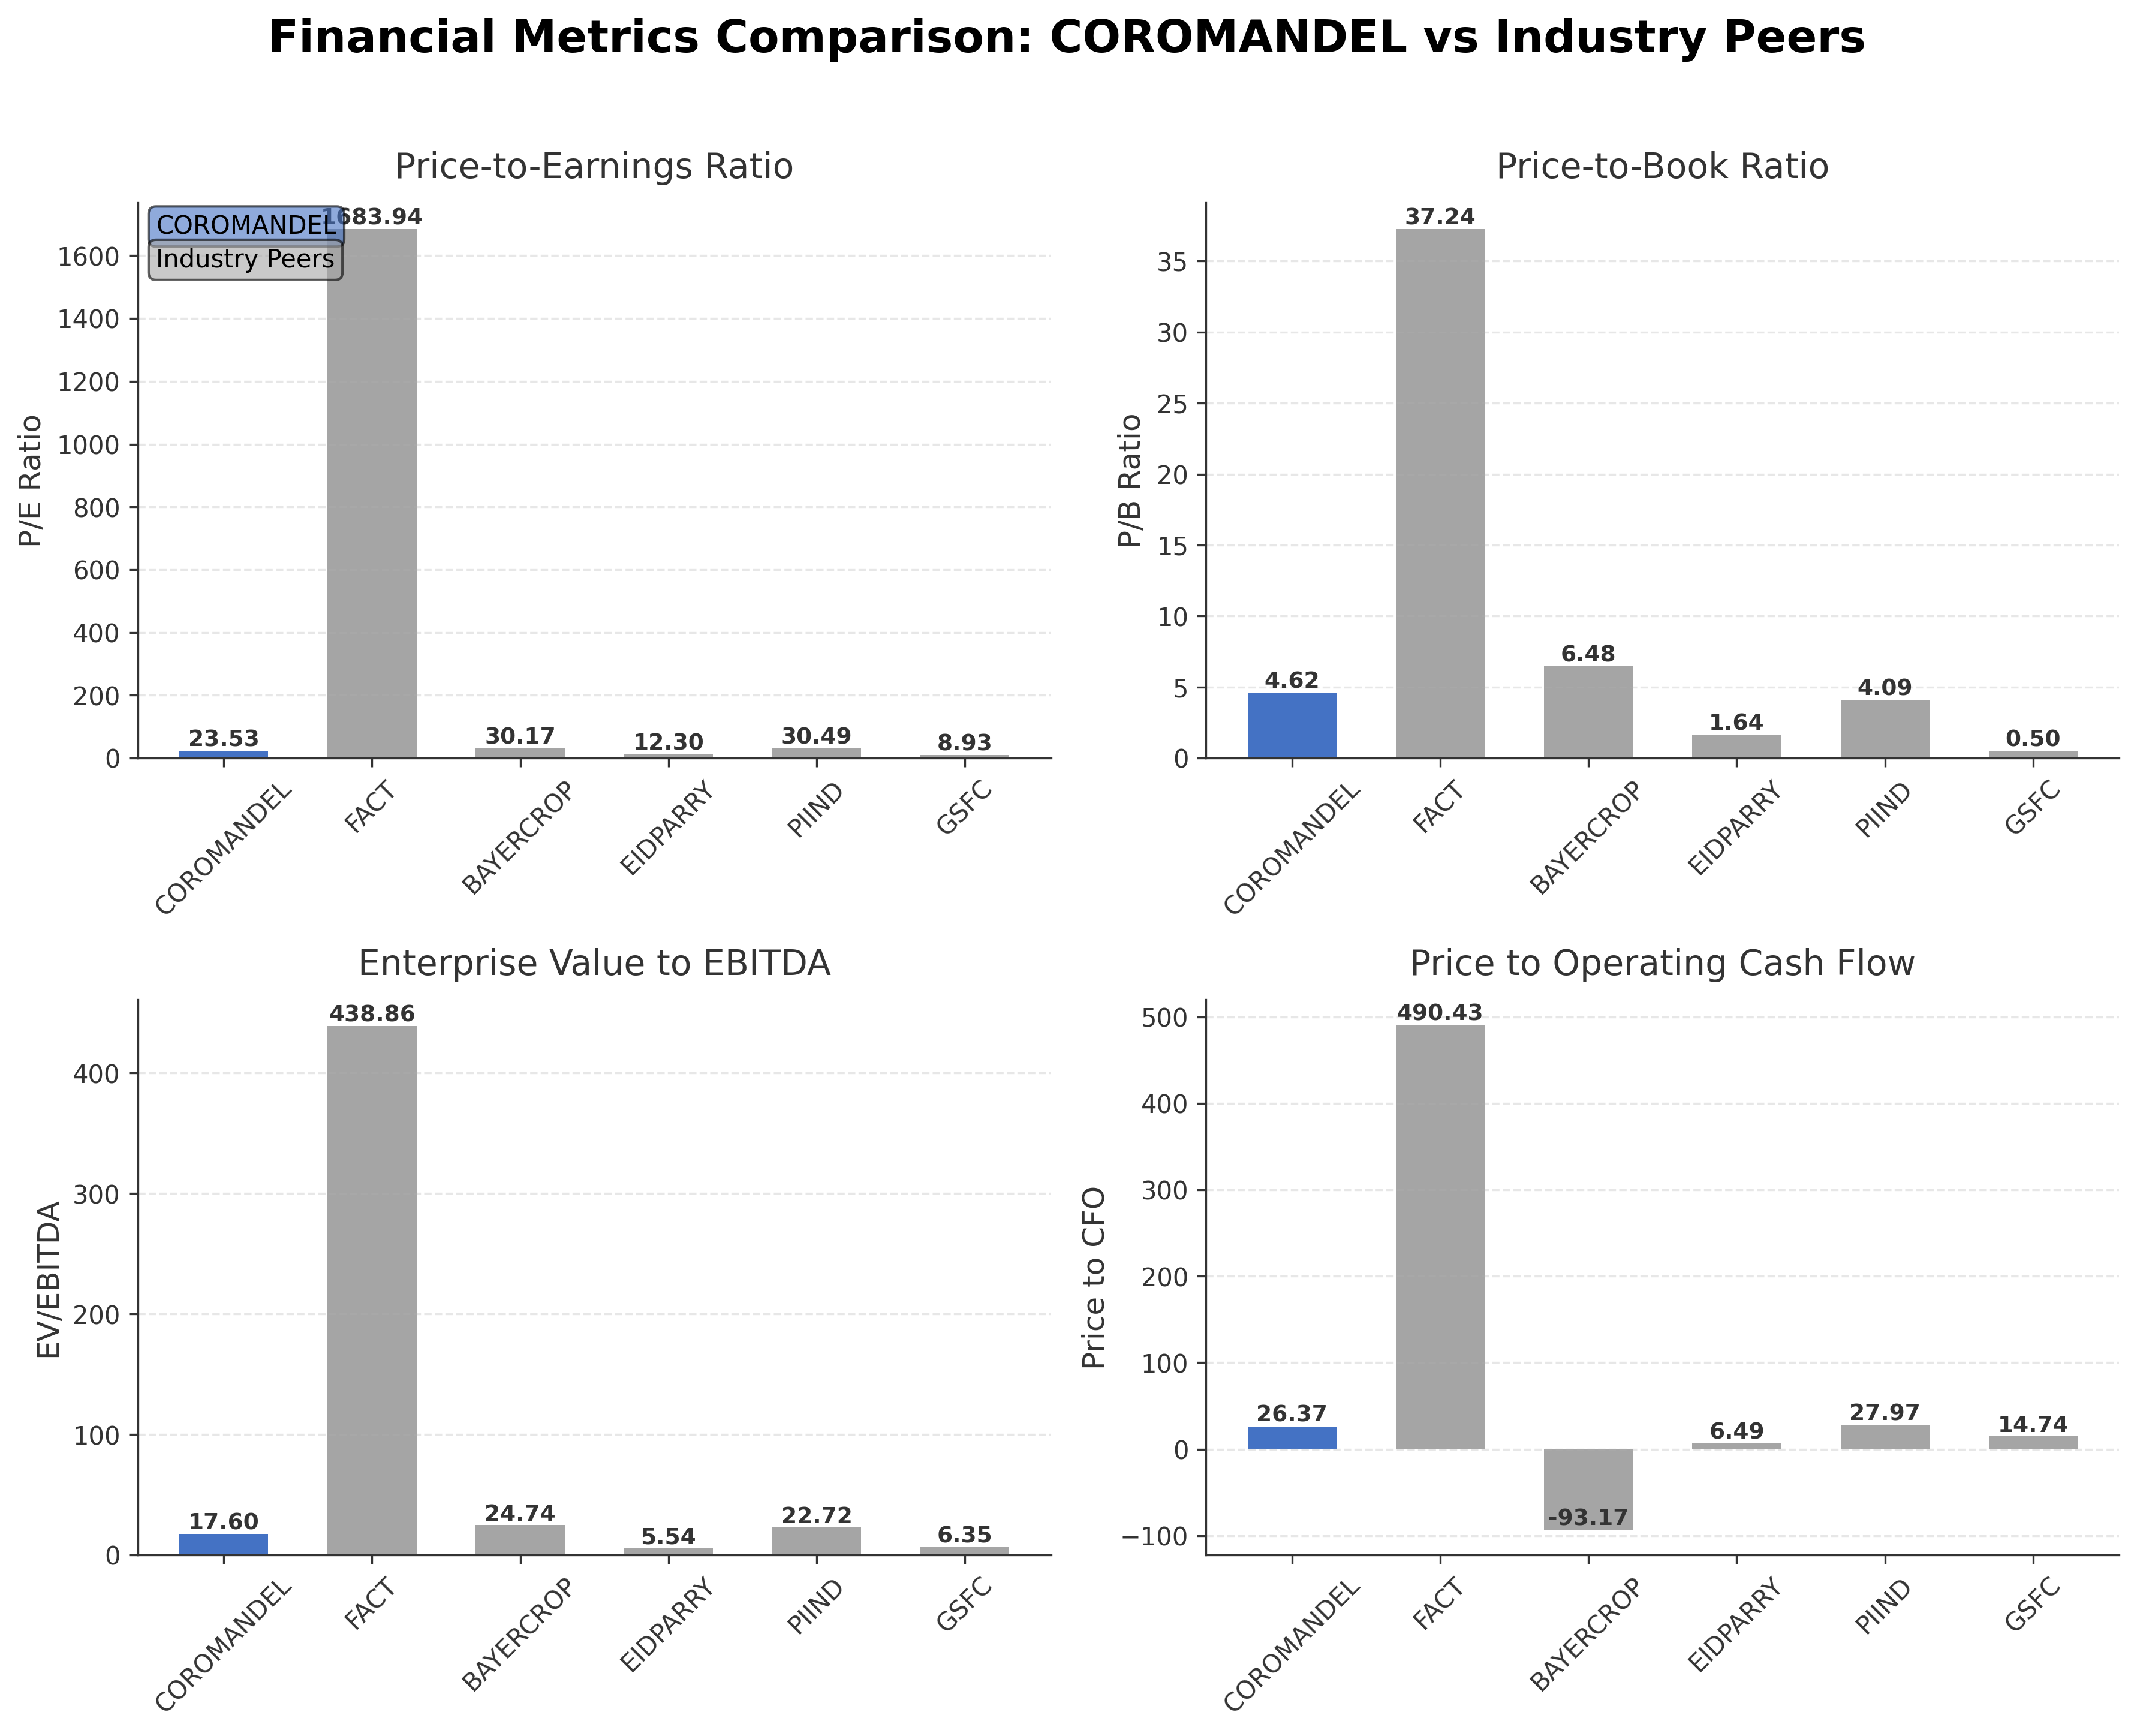
Within the Indian agricultural inputs industry, Coromandel International compares favorably against peers such as Fertilisers & Chemicals Travancore Ltd., Bayer CropScience Ltd., EID Parry India Ltd., PI Industries Ltd., and Gujarat State Fertilizers & Chemicals Ltd. Coromandel holds the largest market capitalization among these peers and exhibits a balanced valuation profile with moderate P/E and P/B ratios. Its return on equity is competitive, though some peers show lower valuations and different growth profiles, reflecting a diverse competitive landscape in the region.
Coromandel International stands as a key protagonist navigating the evolving agricultural inputs sector in India, marked by recent achievements including strategic acquisitions and capital investments aimed at growth and margin improvement. The company faces ongoing challenges such as demand fluctuations and regulatory uncertainties, which could impact performance. The stakes involve maintaining market leadership and capitalizing on growth opportunities amid sector volatility. Observers evaluating the stock may find a nuanced outlook that warrants close monitoring of operational execution and market developments, suggesting a balanced approach to engagement with the equity.
Company and Industry Overview
Company Basics
Price Performance
Company Size
Shareholding Pattern
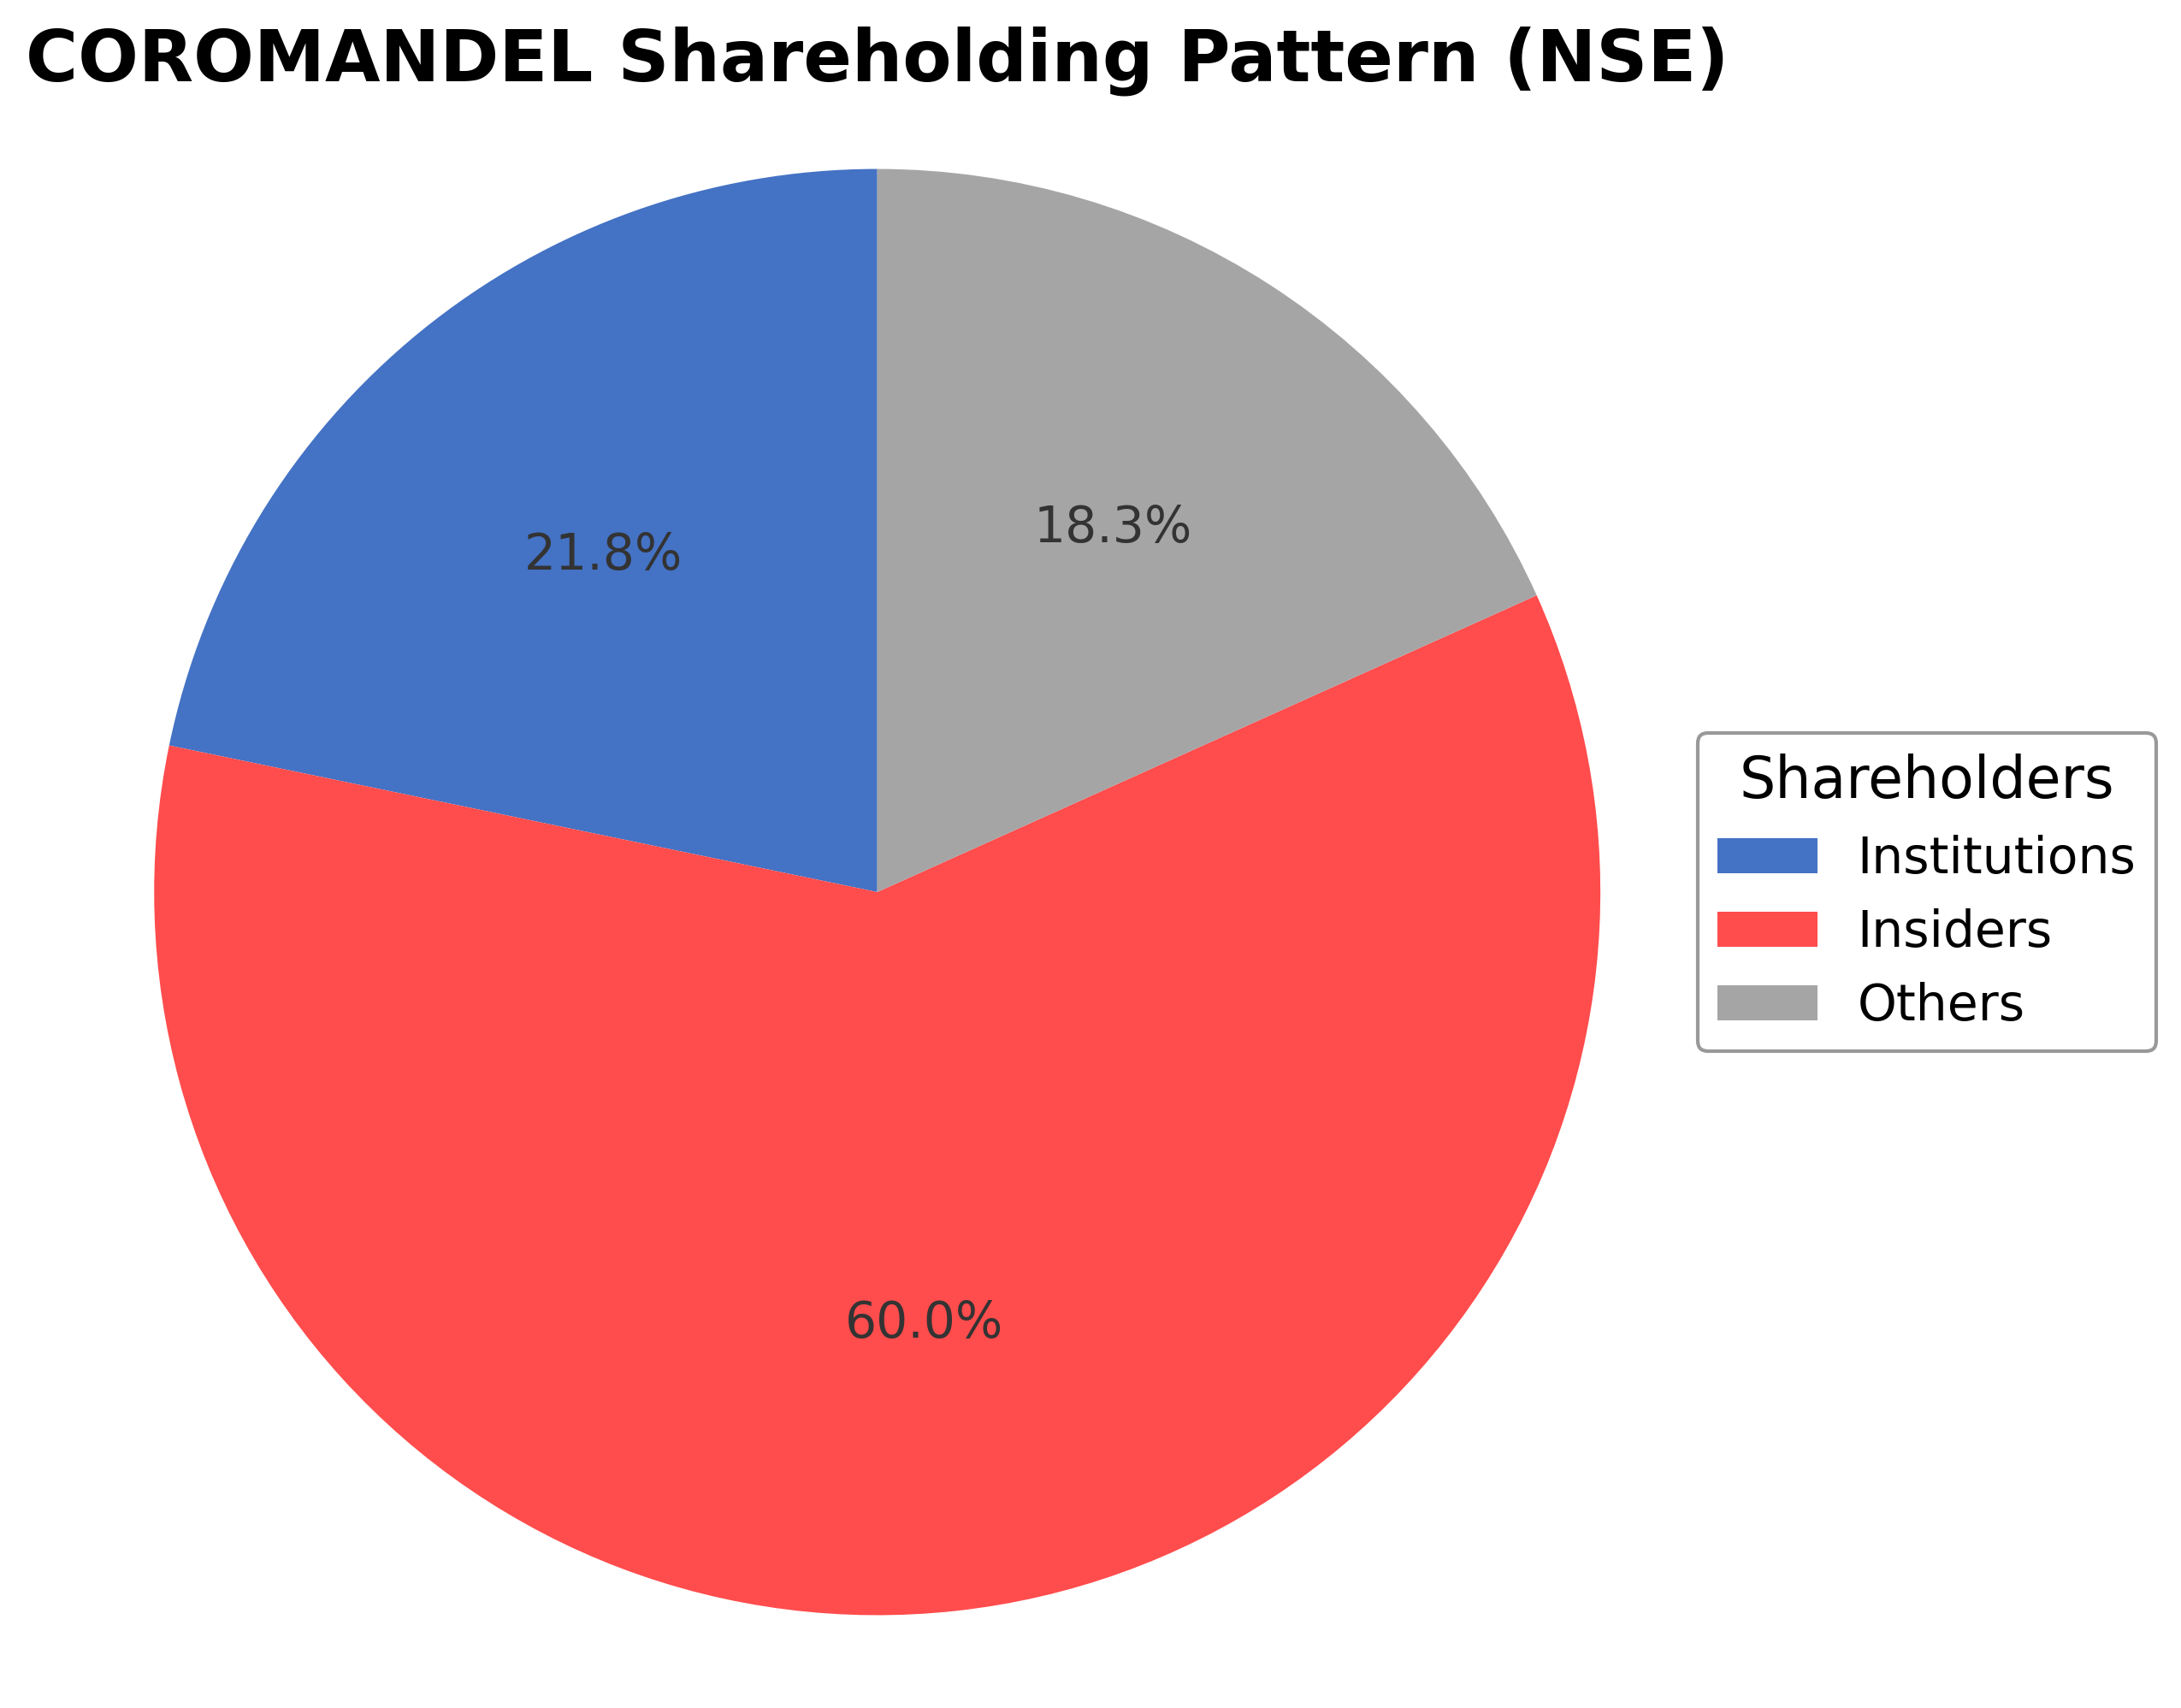
Coromandel International Ltd.'s ownership structure is dominated by insiders, including executives and board members, holding approximately 59.98% of shares, indicating strong promoter control. Institutional investors, such as mutual funds and asset managers, hold 21.75%, reflecting moderate institutional interest. The remaining 18.27% is held by public shareholders, including retail investors and employee stock plans. Over the past 12-24 months, there have been no significant shifts reported in major shareholding positions. Institutional accumulation appears stable without notable large-scale increases or decreases by major funds. This ownership pattern suggests a governance framework with promoter influence balanced by institutional oversight, potentially impacting strategic decisions and corporate actions in alignment with long-term objectives.
Sector and Industry Analysis
Coromandel International Ltd operates primarily within the Indian agrochemicals and fertilizers sector, a critical component of the broader agriculture industry. The sector is sizable, with India being one of the largest consumers and producers of fertilizers globally, driven by the country’s vast agrarian economy. The Indian fertilizer market is estimated to be worth several billion dollars, with a steady growth trajectory supported by government initiatives aimed at enhancing agricultural productivity and ensuring food security. Key players in this sector include Coromandel International, Rashtriya Chemicals & Fertilizers, Chambal Fertilizers, and major multinational corporations such as Nutrien and Yara International. The sector growth is propelled by increasing crop intensification, diversification into high-value crops, and rising adoption of balanced fertilization practices.
Industry trends in the agrochemical and fertilizer space reflect a gradual shift towards sustainable and precision agriculture. Technological advancements such as biofertilizers, micronutrients, and customized nutrient formulations are gaining traction, driven by the need to improve soil health and reduce environmental impact. Consumer behavior among farmers is evolving with increased awareness of crop nutrition and yield optimization, facilitated by digital platforms and extension services. Emerging opportunities include the integration of digital agriculture tools for soil testing and nutrient management, as well as expanding the portfolio into specialty fertilizers and crop protection chemicals. Additionally, the push towards organic farming and eco-friendly inputs presents a niche yet growing segment within the industry.
The regulatory landscape governing the fertilizer and agrochemical sector in India is complex and heavily influenced by government policies. The sector is subject to extensive regulation concerning subsidy frameworks, pricing controls, quality standards, and environmental compliance. The government’s fertilizer subsidy regime, aimed at making fertilizers affordable for farmers, significantly impacts pricing and profitability dynamics for companies like Coromandel. Compliance with environmental regulations, including restrictions on certain chemical formulations and mandates for safe handling and storage, is increasingly stringent. Policy initiatives such as the promotion of neem-coated urea and the Fertilizer Control Order (FCO) enforcement shape product offerings and market conduct. Furthermore, international trade policies and import tariffs affect raw material sourcing and cost structures.
Competitive dynamics in the Indian fertilizer and agrochemical sector are characterized by a mix of large integrated players and smaller regional companies. The market structure tends towards oligopolistic competition with high entry barriers due to capital intensity, regulatory approvals, and distribution network requirements. Coromandel International holds a strong competitive position with a diversified product portfolio spanning fertilizers, crop protection chemicals, and specialty nutrients, supported by robust R&D capabilities and extensive rural distribution channels. The company benefits from backward integration in raw material sourcing and manufacturing efficiencies. Competitive pressures arise from both domestic players and multinational entrants, necessitating continuous innovation and cost optimization. Brand reputation, farmer relationships, and government policy alignment are critical factors influencing market share and profitability in this sector.
Note: Analysis synthesized from industry research, market reports, and regulatory filings. Information is subject to change based on market conditions.
Illustrative Scenario Analysis
DCF Assumptions:
Method: Two-Stage EPS-Priority Model
Financials
Peer Analysis
| Company Name | Market Cap | P/E Ratio | P/B Ratio | EV/EBITDA | Price to CFO |
|---|---|---|---|---|---|
| Coromandel International Ltd. | ₹563.21B | 23.53 | 4.62 | 17.6 | 26.37 |
| Fertilisers & Chemicals Travancore Ltd. | ₹512.13B | 1683.94 | 37.24 | 438.86 | 490.43 |
| Bayer CropScience Ltd. | ₹212.14B | 30.17 | 6.48 | 24.74 | -93.17 |
| EID Parry India Ltd. | ₹140.45B | 12.3 | 1.64 | 5.54 | 6.49 |
| PI Industries Ltd. | ₹441.38B | 30.49 | 4.09 | 22.72 | 27.97 |
| Gujarat State Fertilizers & Chemicals Ltd. | ₹61.35B | 8.93 | 0.5 | 6.35 | 14.74 |
Comparison Analysis: Coromandel International Ltd. leads its regional peers in market capitalization and exhibits a balanced valuation profile with a P/E ratio of 23.53 and P/B ratio of 4.62, which are moderate compared to peers such as Fertilisers & Chemicals Travancore Ltd. with an exceptionally high P/E of 1683.94 and Bayer CropScience Ltd. at 30.17. Coromandel’s EV/EBITDA of 17.60 is competitive, reflecting efficient earnings relative to enterprise value, while its return on equity at 18% is among the highest in the peer group, indicating strong profitability. Some peers like EID Parry India Ltd. and Gujarat State Fertilizers & Chemicals Ltd. show lower valuations but also lower returns, highlighting Coromandel’s relative strength in profitability and market position.
Financial Metrics Comparison with Peers
Financial Statements
Comprehensive financial data including income, balance sheet, and cash flow metrics
Income Statement
| fiscal_date | 2025-03-31 | 2024-03-31 | 2023-03-31 | 2022-03-31 | 2021-03-31 |
|---|---|---|---|---|---|
| Sales | 159.37B | 138.63B | 151.29B | 123.17B | 108.33B |
| Cost Of Goods | 179.89B | 166.34B | 236.71B | 143.65B | 98.01B |
| Gross Profit | -20.52B | -27.71B | -85.42B | -20.47B | 10.32B |
| Operating Expense Selling General And Administrative | 13.87B | 12.03B | 11.75B | 10.67B | 9.20B |
| Operating Expense Other Operating Expenses | 11.82B | 10.35B | 10.14B | 8.23B | 8.41B |
| Operating Income | 24.29B | 22.39B | 29.11B | 20.83B | 18.94B |
| Non Operating Interest Income | 2.37B | 1.92B | 1.58B | 1.02B | 416.40M |
| Non Operating Interest Expense | 2.52B | 1.76B | 1.79B | 678.50M | 983.50M |
| Pretax Income | 27.28B | 21.88B | 27.01B | 20.50B | 17.86B |
| Income Tax | 6.73B | 5.48B | 6.88B | 5.21B | 4.57B |
| Net Income | 20.55B | 16.41B | 20.13B | 15.28B | 13.29B |
| Eps Basic | 70.23 | 55.81 | 68.51 | 52.09 | 45.34 |
| Eps Diluted | 70.12 | 55.75 | 68.38 | 51.98 | 45.22 |
| Basic Shares Outstanding | 294.54M | 294.29M | 293.81M | 293.43M | 293.17M |
| Diluted Shares Outstanding | 294.54M | 294.29M | 293.81M | 293.43M | 293.17M |
| Ebit | 29.79B | 23.65B | 28.80B | 21.18B | 18.84B |
| Ebitda | 28.14B | 25.85B | 30.49B | 22.92B | 20.58B |
| Net Income Continuous Operations | 27.28B | 21.88B | 27.01B | 20.50B | 17.86B |
| Minority Interests | 117.50M | 15.50M | 0.00 | N/A | 0.00 |
| Preferred Stock Dividends | 0.00 | 0.00 | 0.00 | 0.00 | 0.00 |
Source: Financial statements and regulatory filings
Balance Sheet
| fiscal_date | 2025-03-31 | 2024-03-31 | 2023-03-31 | 2022-03-31 | 2021-03-31 |
|---|---|---|---|---|---|
| Cash And Cash Equivalents | 2.55B | 11.25B | 13.94B | 7.06B | 6.92B |
| Accounts Receivable | 12.29B | 13.94B | 5.89B | 2.65B | 5.02B |
| Total Assets | 189.28B | 158.51B | 142.35B | 112.85B | 88.95B |
| Total Liabilities | 77.05B | 64.05B | 63.27B | 49.26B | 37.45B |
| Long Term Debt | 5.99B | 4.10B | 3.63B | 3.71B | 3.62B |
| Shareholders Equity | 112.23B | 94.47B | 79.08B | 63.58B | 51.51B |
Source: Financial statements and regulatory filings
Cash Flow Statement
| fiscal_date | 2025-03-31 | 2024-03-31 | 2023-03-31 | 2022-03-31 | 2021-03-31 |
|---|---|---|---|---|---|
| Operating Activities Net Income | 27.28B | 21.88B | 27.01B | 20.50B | 17.86B |
| Operating Activities Stock Based Compensation | 106.10M | 63.00M | 77.10M | 28.10M | 39.90M |
| Operating Activities Other Non Cash Items | -3.26B | -304.40M | 288.40M | -270.20M | 637.60M |
| Operating Activities Accounts Receivable | -1.14B | 2.01B | -24.13B | 5.86B | 28.96B |
| Operating Activities Other Assets Liabilities | -1.62B | -6.06B | -6.58B | -12.31B | 880.70M |
| Operating Activities Operating Cash Flow | 21.36B | 17.60B | -3.34B | 13.81B | 48.38B |
| Investing Activities Capital Expenditures | -4.33B | -5.17B | -5.68B | -2.77B | -1.93B |
| Investing Activities Net Acquisitions | -178.40M | -2.20B | -1.57B | 0.00 | -120.00M |
| Investing Activities Purchase Of Investments | -45.62B | -68.61B | -3.07B | 0.00 | 0.00 |
| Investing Activities Sale Of Investments | 29.11B | 61.86B | 12.84B | 0.00 | 4.00M |
| Investing Activities Investing Cash Flow | -21.02B | -14.82B | 12.77B | -13.01B | -2.04B |
| Financing Activities Short Term Debt Issuance | -516.10M | 471.90M | 45.60M | -15.70M | -16.24B |
| Financing Activities Common Stock Issuance | 167.70M | 166.00M | 196.30M | 43.40M | 143.80M |
| Financing Activities Common Stock Repurchase | -154.80M | -249.40M | 0.00 | N/A | N/A |
| Financing Activities Common Dividends | -3.53B | -1.86B | -3.53B | -3.52B | -5.28B |
| Financing Activities Financing Cash Flow | -4.03B | -1.47B | -3.28B | -3.49B | -37.60B |
| End Cash Position | 2.55B | 11.25B | 13.94B | 7.06B | 6.92B |
| Free Cash Flow | 16.13B | 9.01B | -142.70M | 18.00B | 39.55B |
| Investing Activities Other Investing Activity | N/A | -698.20M | 10.24B | -10.24B | -100.00K |
| Financing Activities Long Term Debt Payments | N/A | N/A | N/A | N/A | -16.24B |
Source: Financial statements and regulatory filings
Technical Analysis
Key Insights
- The current trend shows a consolidation phase with the stock price trading below the 200-day moving average (₹2280.51) and 50-day moving average (₹2208.75), indicating a cautious price action pattern.
- Key support levels are observed near the 52-week low at approximately ₹1855, while resistance is noted around the 50-day and 200-day moving averages near ₹2200-₹2280.
- The stock is trading below its major moving averages (10-day, 50-day, 200-day), suggesting a subdued momentum in the short to medium term.
- Momentum indicators show a neutral to slightly bearish stance with RSI levels near mid-range, MACD indicating weak momentum, and stochastic oscillators reflecting no clear directional bias.
- Multi-timeframe analysis reveals that while daily charts indicate consolidation, weekly and monthly charts show longer-term support but with potential for volatility due to recent price declines.
- Market scenarios based on the current technical setup suggest potential for a range-bound movement with risks of further downside if support levels fail, balanced by possible rebounds if key moving averages are breached upwards.
Trending News
1. Headline: Coromandel International Ltd is Rated Sell
Summary: Coromandel International Ltd is rated 'Sell' by MarketsMOJO, with this rating last updated on 02 March 2026. However, the analysis and financial metrics discussed here reflect the stock's current position as of 25 March 2026, providing investors with an up-to-date perspective on the company’s ...
Sentiment: neutral
2. Headline: Coromandel International Net Worth, Market Cap, CEO, Head Office - The Business Scroll
Summary: Along with an e-commerce platform for ordering and advice, it also offers value-added services like drone spraying, soil testing, crop diagnostics, and weather data. In September 2009, the company changed its name from Coromandel Fertilisers Ltd. to Coromandel International Limited.
Sentiment: neutral
3. Headline: Inside India’s fertilizer crossroads: High stocks and global shocks | Stock Market News
Summary: Market expert Raja Venkatraman shares his top stock picks for 20 March. Here’s his technical outlook and trade strategy.
Sentiment: neutral
4. Headline: Coromandel International stock faces headwinds from Q3 demand slowdown amid India's fertilizer subsi
Summary: Coromandel International (ISIN: INE024A01027) reported softer Q3 volumes due to monsoon disruptions and subsidy uncertainties, with shares dipping on BSE. DACH investors gain targeted exposure to India's agri-chemical growth via this Murugappa Group leader, amid elevated EU input costs.
Sentiment: negative
5. Headline: Coromandel Gets Exchange Nod to Reclassify Algavista Greentech From Promoter Group - TipRanks.com
Summary: Coromandel International Limited ( ($IN:COROMANDEL) ) has provided an update. Coromandel International has announced that both the National Stock Exchange of India ...
Sentiment: positive
6. Headline: Coromandel International Ltd (COROMANDEL)
Summary: See the latest Coromandel International Ltd stock price (COROMANDEL:XNSE), related news, valuation, dividends and more to help you make your investing decisions.
Sentiment: neutral
7. Headline: Coromandel International Ltd Hits Intraday High with 5.12% Surge on 10 Mar 2026
Summary: Coromandel International Ltd recorded a robust intraday performance today, surging to a day’s high of Rs 2,105, marking a 5.3% increase. This rally ended a six-day losing streak, although the stock still underperformed its sector by 2.63% amid a broadly mixed market environment.
Sentiment: positive
8. Headline: Volumes soar at Coromandel International Ltd counter | Capital Market News - Business Standard
Summary: Coromandel International Ltd clocked volume of 11.27 lakh shares by 10:53 IST on BSE, a 35.14 times surge over two-week average daily volume of 32076 shares
Sentiment: positive
9. Headline: Coromandel International Ltd Opens with Significant Gap Down Amid Market Concerns
Summary: Shares of Coromandel International Ltd opened sharply lower on 2 Mar 2026, registering a gap down of 4.28% at the start of trading. This weak opening reflects ongoing market concerns and a continuation of recent downward momentum, with the stock underperforming its sector and broader indices ...
Sentiment: negative
10. Headline: India’s Fertilizer Subsidy Set to Rise Amid Middle East Tensions
Summary: S. Sankarasubramanian, chairman of the Fertilizer Association of India and CEO of Coromandel International Ltd, emphasized that while India relies on West Asia for certain raw materials, domestic fertilizer stocks are currently adequate. He added that diversified sourcing arrangements and ...
Sentiment: negative
Recent Updates
News Summary
Recent developments for Coromandel International Ltd. include a 'Sell' rating by MarketsMojo as of early March 2026, reflecting cautious market sentiment. Trading volumes have surged notably, indicating increased market activity and interest. The stock recently hit a 52-week low amid sectoral downtrends, highlighting near-term challenges. Strategically, the company completed the acquisition of a 53% controlling stake in NACL Industries, aligning with its growth roadmap in agri solutions. Additionally, Coromandel is pursuing an aggressive capital expenditure plan aimed at margin enhancement and earnings stability, signaling commitment to long-term value creation despite current headwinds.
News Sentiment
The overall sentiment across recent news is mixed to neutral, with balanced positive developments such as strategic acquisitions and capital investments countered by market concerns reflected in rating downgrades and share price declines. Positive sentiment is evident in volume surges and corporate actions, while negative sentiment arises from sectoral demand slowdowns and subsidy uncertainties. This blend suggests cautious optimism tempered by awareness of operational and market risks.
Analytical Overview
Analysis Summary
Valuation Metrics: Coromandel International's trailing P/E ratio of 23.53 and forward P/E of 20.23 are closely aligned with the industry average of 23.53, indicating valuation levels consistent with sector norms.
Growth Trajectory: The company shows a strong revenue growth rate of 26.6% year-over-year, supported by positive operating and free cash flow trends, reflecting solid growth momentum.
Financial Health: A low debt-to-equity ratio of approximately 0.12 (derived from total debt to equity of 11.6%) and robust cash reserves of ₹42.63 billion demonstrate healthy financial stability and liquidity.
Sector Specific Factors: The agricultural inputs sector in India faces challenges such as monsoon variability and subsidy policy uncertainties, but also opportunities from government focus on sustainable farming and increasing agri-chemical demand.
Market Positioning: Coromandel benefits from strong market positioning with diversified product offerings and strategic acquisitions, enhancing competitive advantages in the Indian agri-inputs market.
Investment Conclusion
Supporting Factors: No data
Risk Factors: No data
SWOT Analysis
Strengths
- Market leader in India's agricultural inputs sector with diversified product portfolio.
- Strong revenue growth and positive cash flow generation.
- Robust balance sheet with low debt and high liquidity.
- Strategic acquisitions enhancing market presence and capabilities.
Weaknesses
- Profit margins remain moderate relative to some industry peers.
- Stock price volatility with recent declines to 52-week lows.
- Negative quarterly earnings growth year-over-year.
- High price-to-book ratio indicating premium valuation.
Opportunities
- Expansion through capital expenditure aimed at margin improvement.
- Growing demand for sustainable and specialty agri-inputs in India.
- Government focus on agricultural self-sufficiency and subsidies.
- Technological advancements in crop protection and nutrient solutions.
Threats
- Monsoon variability impacting agricultural demand and volumes.
- Uncertainties in fertilizer subsidy policies affecting pricing and margins.
- Global raw material price volatility influencing input costs.
- Competitive pressures from domestic and international players.
Company Description
Coromandel International Ltd. is a prominent player in the agricultural sector, specializing in the production and distribution of fertilizers. It stands out as one of India's leading agri-solutions providers, offering a diverse range of products, including phosphatic fertilizers, crop protection chemicals, and specialty nutrients. The company's products are integral to enhancing the productivity and sustainability of agricultural practices, thereby supporting the primary sector's backbone in India. Coromandel International Ltd. also makes significant strides in research and innovation, constantly developing new formulations to meet the evolving demands of the agriculture industry. The company's extensive network encompasses farmers, industry partners, and distribution channels, ensuring accessibility and efficiency. Its market significance is underscored by its strategic operations that not only aim to boost agricultural output but also contribute to the broader economic discourse on food security and sustainable farming practices. Headquartered in Secunderabad, India, Coromandel International Ltd. plays a crucial role in reinforcing the agricultural infrastructure, aligning with national priorities aimed at achieving greater self-sufficiency in food production.