
Coforge Limited (COFORGE)
Stock Analysis Report
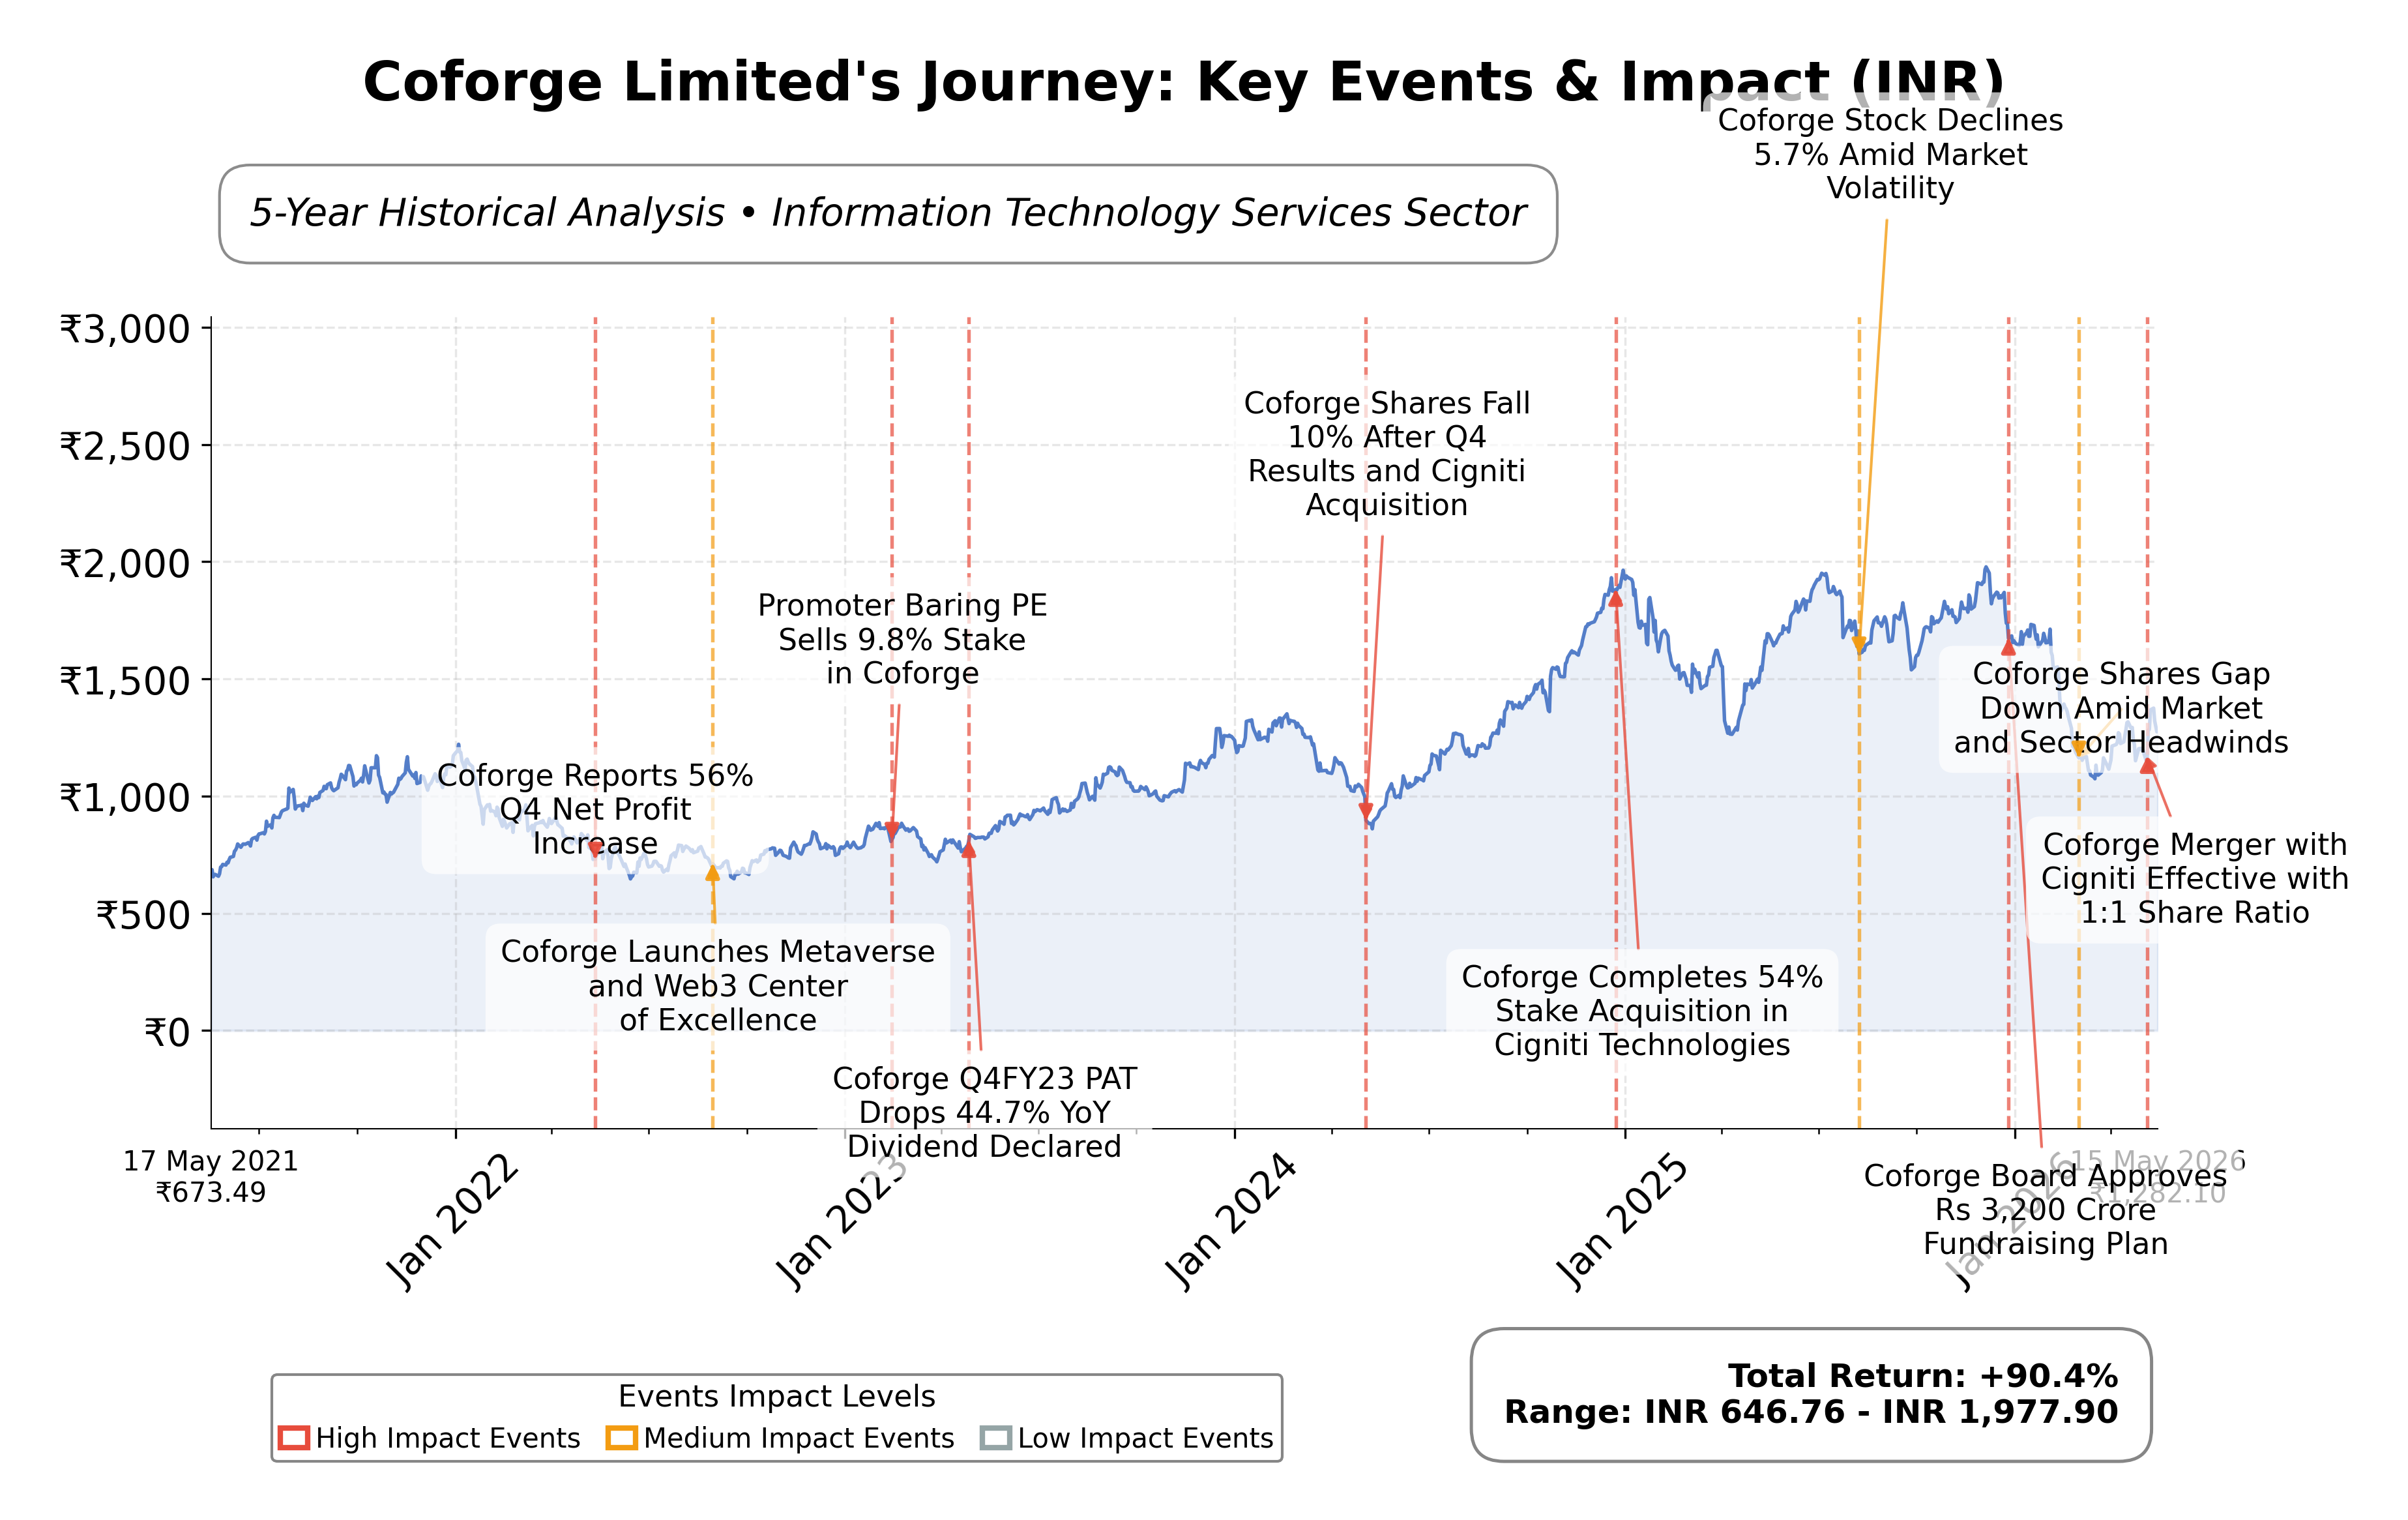
Stock Journey
Key Positives and Key Risks
Pros
- Strong revenue growth of 30.5% year-over-year demonstrates robust demand.
- Healthy return on equity at 18.6% indicates efficient capital utilization.
- Low debt-to-equity ratio of 0.075 supports financial stability and liquidity.
Cons
- Current stock price is down approximately 29% from its 52-week high, reflecting recent market volatility.
- Premium valuation with a trailing P/E of 29.24 may limit near-term upside.
- Competitive pressures and sectoral challenges could impact future margins.
Disclosure: This information is for general awareness and does not constitute investment advice
Report Summary
Coforge Limited is a leading Indian IT services company listed on the NSE, operating within the technology sector. Formerly known as NIIT Technologies, Coforge specializes in digital transformation, cloud services, application management, artificial intelligence, and data analytics. The company serves diverse industries including banking, financial services, insurance, travel, and transportation, positioning itself as a strategic partner for enterprises navigating digital complexities. With a strong global presence and a focus on innovation, Coforge holds a significant market position in the information technology services industry.
Financially, Coforge reported trailing twelve months (TTM) revenue of approximately ₹164.03 billion with a gross margin of 38.1%, operating margin of 16.6%, and net profit margin near 9.5%. The company’s return on equity (ROE) stands at 18.6%, return on assets (ROA) at 10.8%, and return on invested capital (ROIC) reflects efficient capital deployment. These metrics indicate robust profitability and operational efficiency, supported by strong revenue growth of 30.5% year-over-year in the most recent quarter and a significant 134% quarterly earnings growth.
Valuation metrics show a trailing P/E ratio of 29.24 and a forward P/E of 18.63, with a price-to-book ratio of 4.52 and an EV/EBITDA multiple of 14.06. The market capitalization is approximately ₹550.85 billion. The stock currently trades at ₹1,275.70, down about 29% from its 52-week high of ₹1,994, indicating a notable correction from peak levels. These valuation figures suggest the stock is priced at a premium relative to some peers but with forward earnings growth expectations factored in.
Coforge’s strengths include strong cash flow generation with operating cash flow of ₹17.92 billion and free cash flow of ₹17.16 billion, a low debt-to-equity ratio of 0.075, and a high current ratio of 1.61 indicating solid liquidity. The company benefits from market leadership in niche IT services and a diversified client base. Key risks involve competitive pressures in the IT sector, regulatory changes, and macroeconomic uncertainties impacting global IT spending. Recent strategic actions include robust deal wins, an expanding order book, and leadership emphasizing AI integration and digital capabilities.
Technically, the stock shows signs of recovery after recent declines, trading above its 50-day moving average but below the 200-day average, with momentum indicators reflecting improving bullishness. Recent news highlights record quarterly revenue and profit growth, supporting positive operational momentum. Overall, the data suggests a cautious stance with potential for selective accumulation as the company demonstrates strong fundamentals amid valuation and sector headwinds.
Company and Industry Overview
Company Basics
Price Performance
Company Size
Shareholding Pattern
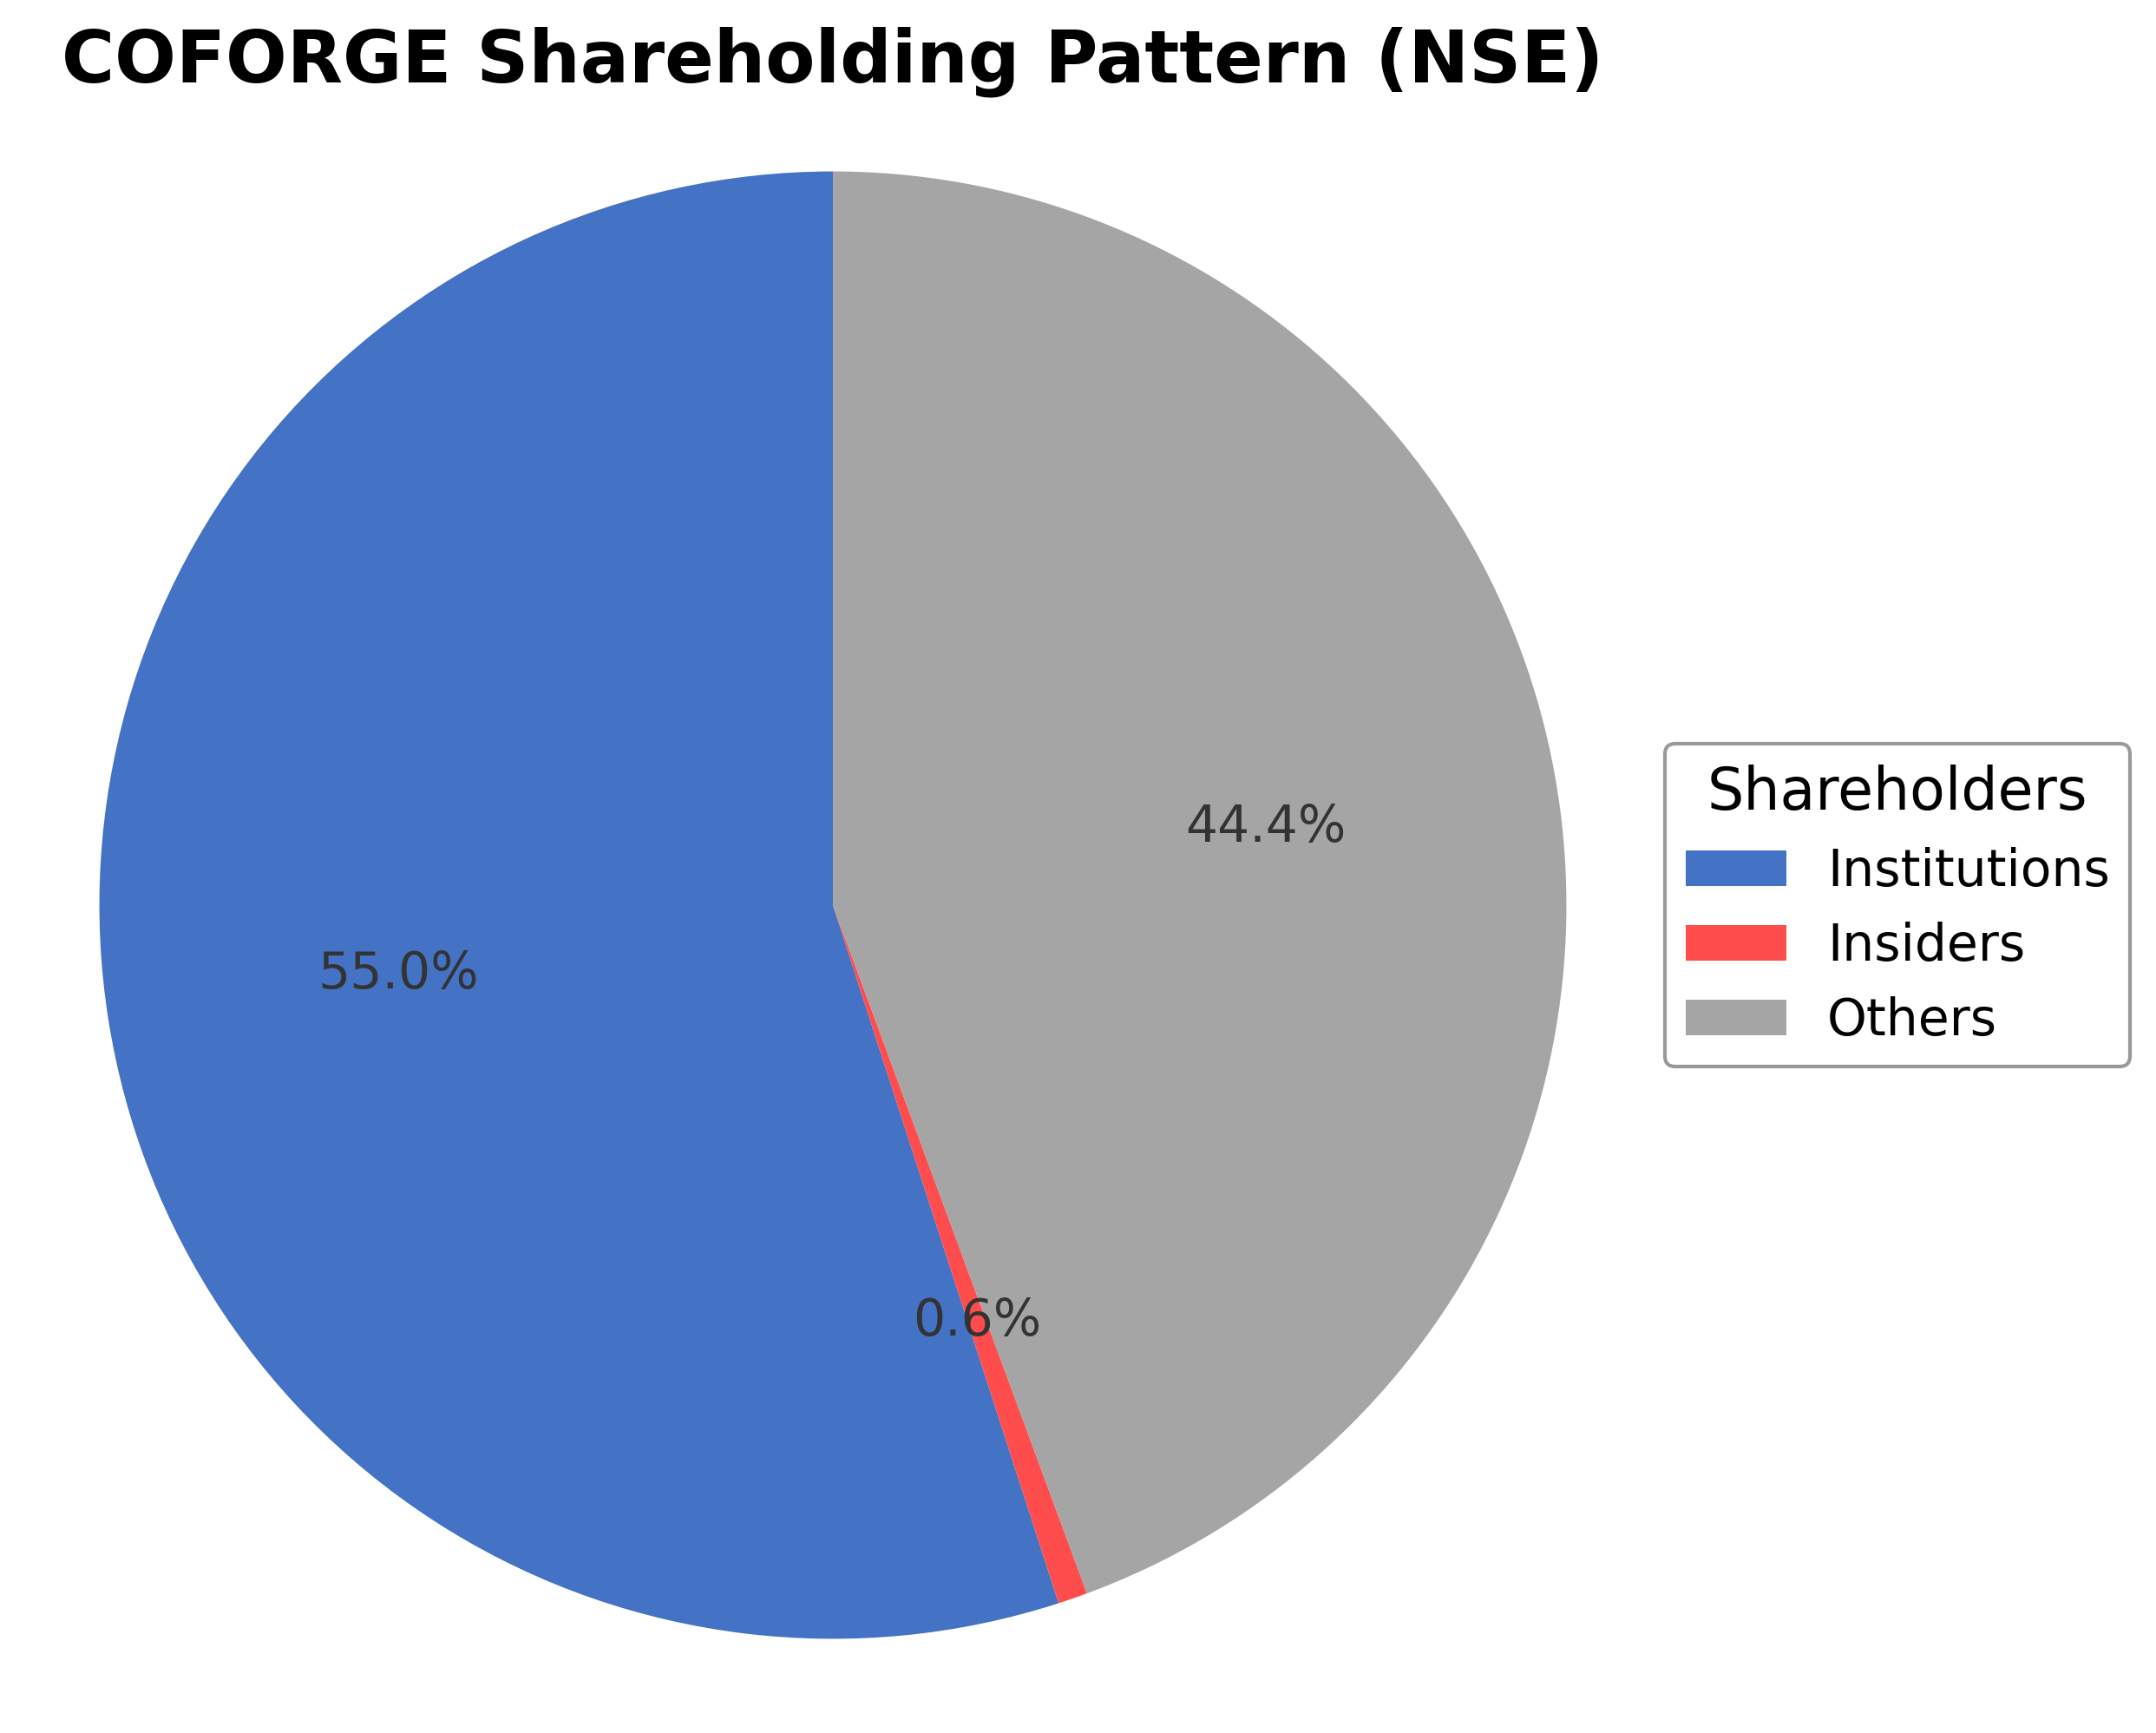
Coforge Limited's ownership structure features insiders holding approximately 0.65% of shares, institutional investors controlling a significant 54.98%, and the remaining 44.37% held by public and other shareholders. Over the past 12-24 months, institutional ownership has shown steady accumulation, reflecting confidence from mutual funds and asset managers. Major institutional investors have increased their stakes, indicating positive market sentiment and governance stability. This ownership distribution supports strategic decision-making aligned with shareholder interests and positions Coforge well within the competitive IT services industry in India.
Sector and Industry Analysis
The Indian IT services sector is a significant contributor to the economy, with a market size exceeding $200 billion and a consistent growth trajectory driven by digital transformation and cloud adoption across industries. Major players include Tata Consultancy Services, Infosys, Wipro, and HCL Technologies, alongside emerging firms like Coforge Limited, which have carved niches in specialized service areas. The sector benefits from a large talent pool and increasing global demand for IT outsourcing and software services.
Industry trends highlight a shift towards automation, artificial intelligence, and cloud-native solutions, with companies investing heavily in innovation to stay competitive. The competitive landscape is marked by intense rivalry, with barriers to entry including the need for skilled workforce, technological expertise, and established client relationships. Firms like Coforge leverage domain-specific knowledge and agile delivery models to differentiate themselves in a crowded marketplace.
The regulatory environment for the IT sector in India is shaped by data protection laws, export-import policies, and intellectual property rights, which influence operational practices and global client engagements. Recent emphasis on data privacy and cybersecurity regulations has prompted companies to enhance compliance frameworks and invest in secure infrastructure. Overall, regulatory developments aim to balance growth facilitation with safeguarding stakeholder interests, impacting strategic planning within the industry.
Note: Analysis synthesized from industry research, market reports, and regulatory filings. Information is subject to change based on market conditions.
Financial Ratios Dashboard
Illustrative Scenario Analysis
DCF Assumptions:
Method: Two-Stage EPS-Priority Model
Financials
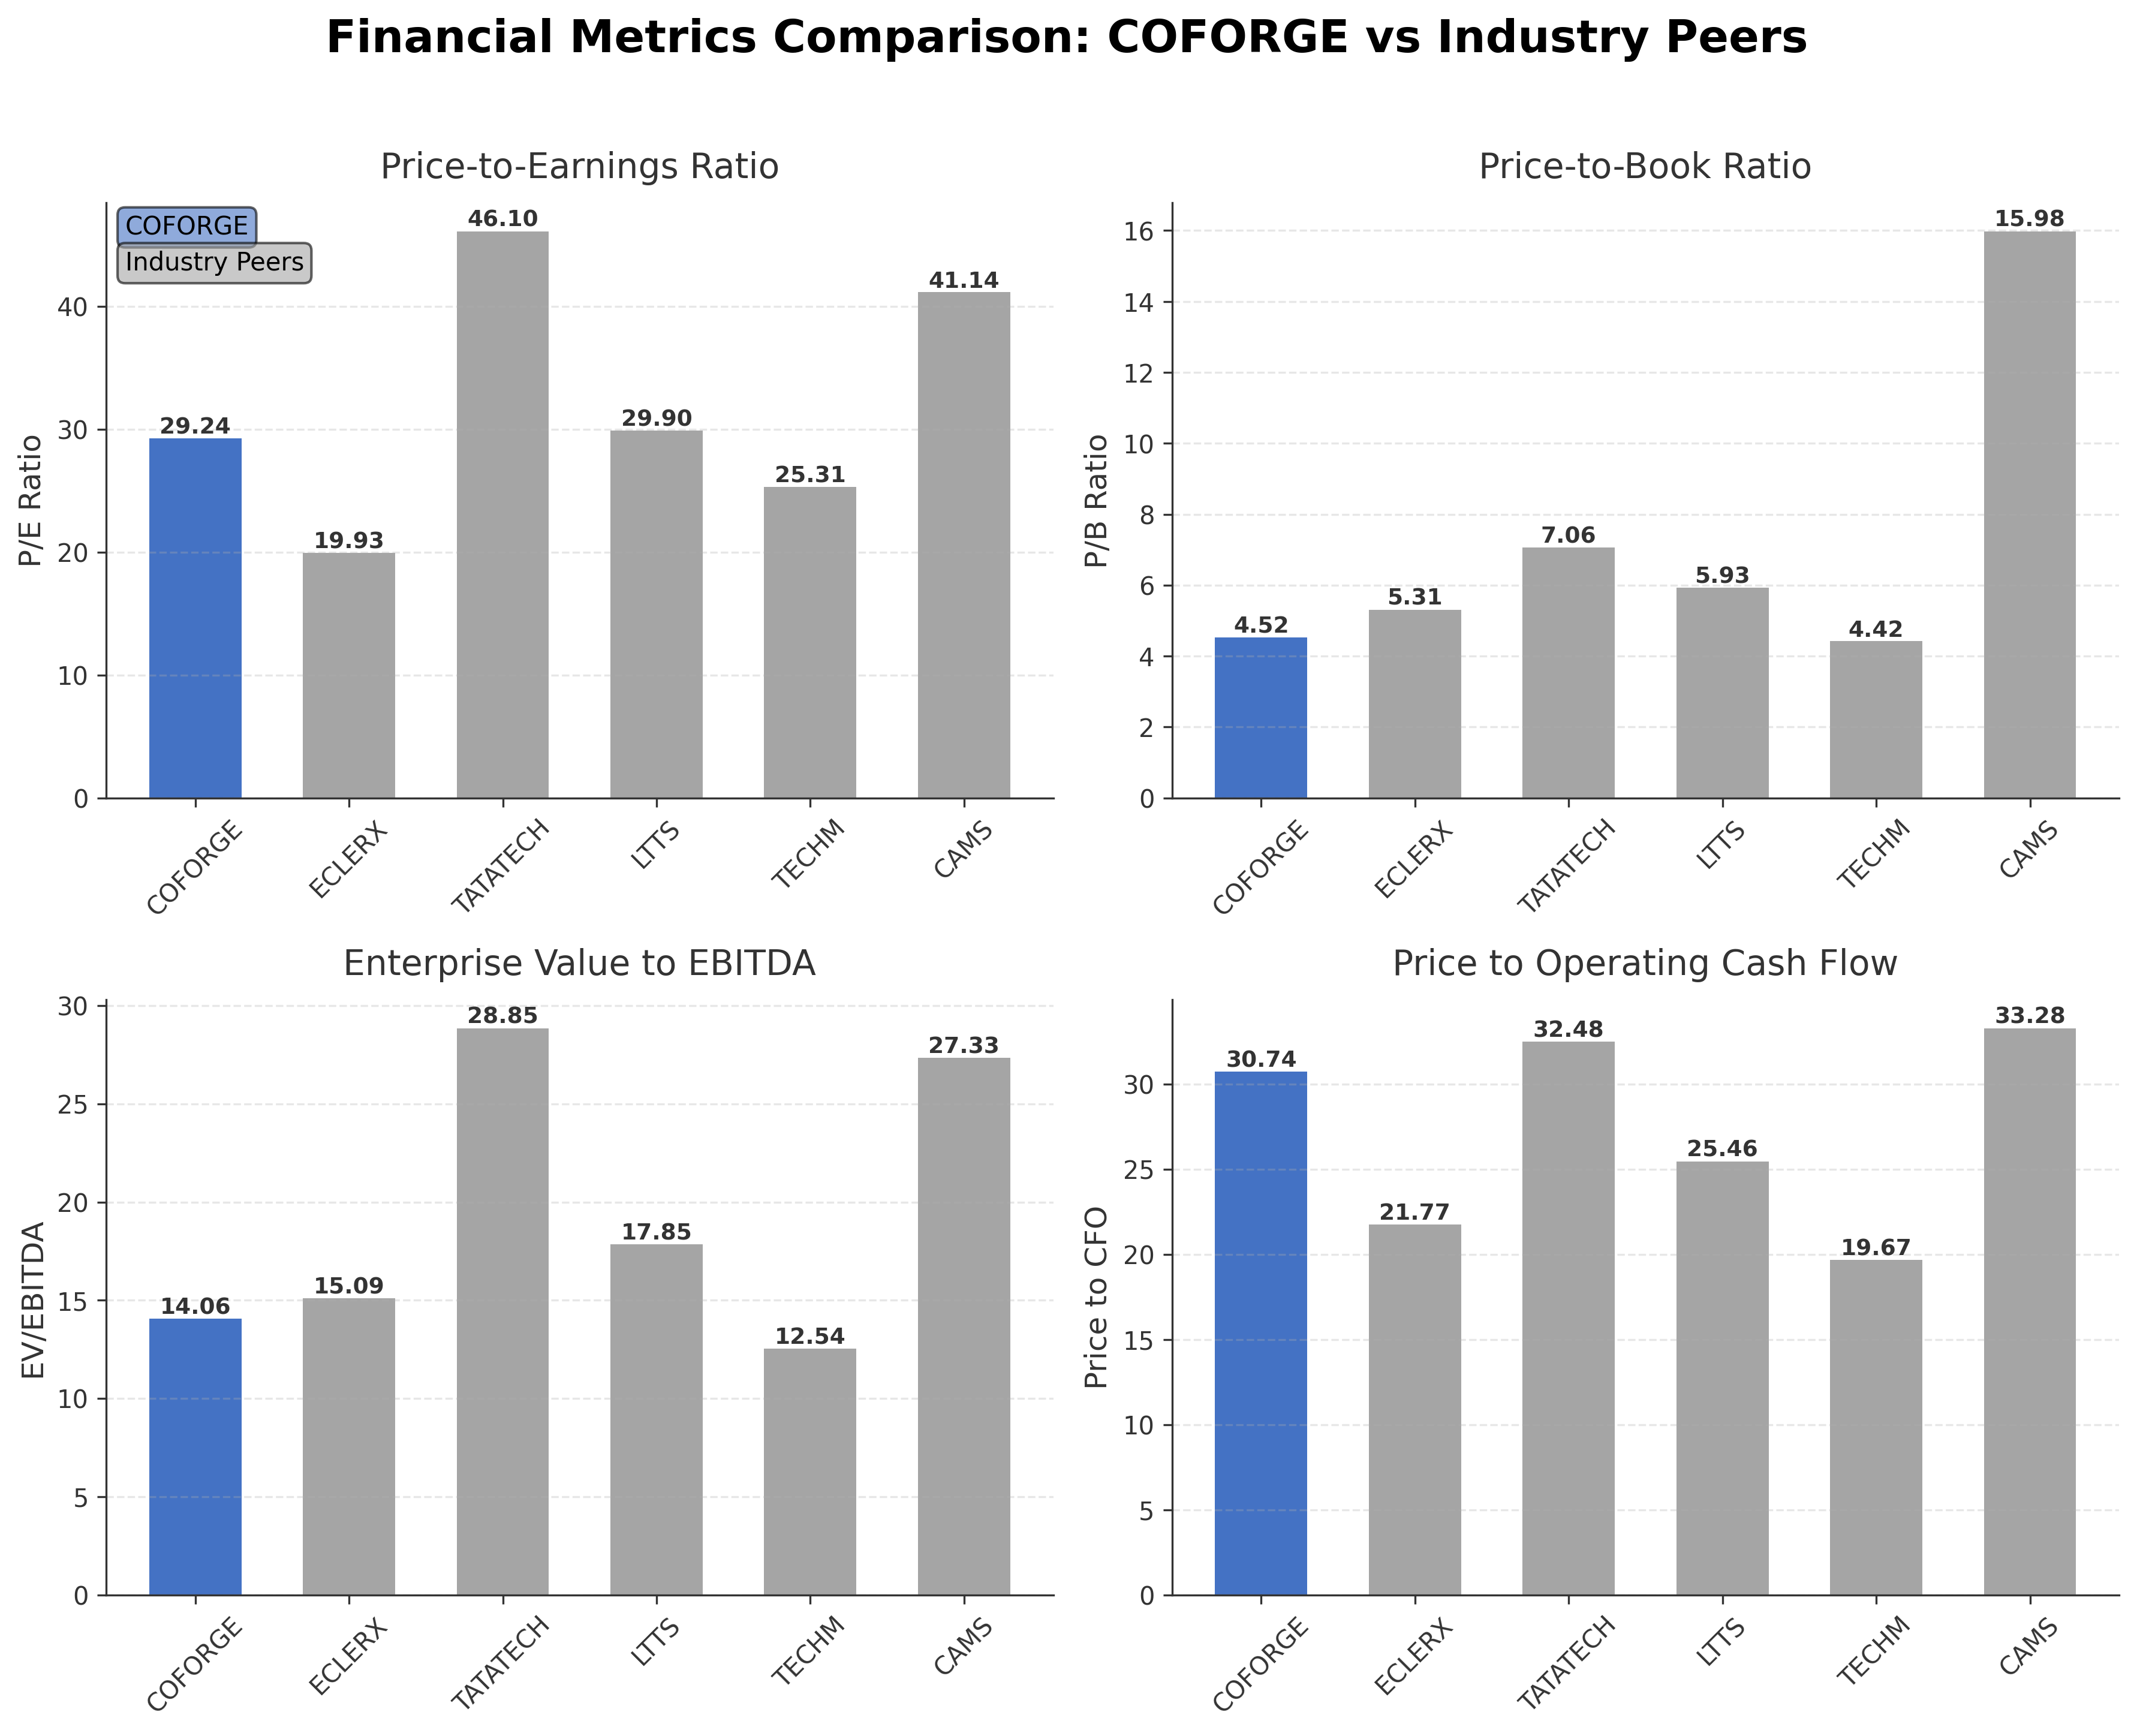
Peer Analysis
| Company Name | Market Cap | P/E Ratio | P/B Ratio | EV/EBITDA | Price to CFO |
|---|---|---|---|---|---|
| Coforge Limited | ₹550.85B | 29.24 | 4.52 | 14.06 | 30.74 |
| Eclerx Services Ltd. | ₹138.21B | 19.93 | 5.31 | 15.09 | 21.77 |
| Tata Technologies Ltd. | ₹251.93B | 46.10 | 7.06 | 28.85 | 32.48 |
| L&T Technology Services Ltd. | ₹370.49B | 29.90 | 5.93 | 17.85 | 25.46 |
| Tech Mahindra Ltd. | ₹1.21T | 25.31 | 4.42 | 12.54 | 19.67 |
| Computer Age Management Services Ltd. | ₹194.42B | 41.14 | 15.98 | 27.33 | 33.28 |
Comparison Analysis: Coforge Limited ranks among the larger market capitalizations in its peer group with ₹550.85 billion, offering a moderate P/E ratio of 29.24 compared to peers ranging from 19.93 to 46.10. Its price-to-book ratio of 4.52 is lower than several peers like Tata Technologies and CAMS, indicating relatively more conservative valuation on book value. The EV/EBITDA multiple of 14.06 is competitive, sitting below Tata Technologies and CAMS but above Tech Mahindra. Coforge’s return on equity at 18.6% is solid, though slightly below Eclerx and CAMS, reflecting efficient capital use. Overall, Coforge presents a balanced profile with reasonable valuation and profitability metrics relative to its Indian IT services peers.
Financial Metrics Comparison with Peers
Financial Statements
Comprehensive financial data including income, balance sheet, and cash flow metrics
Income Statement
| fiscal_date | 2026-03-31 | 2025-03-31 | 2024-03-31 | 2023-03-31 | 2022-03-31 |
|---|---|---|---|---|---|
| Sales | 164.03B | 120.73B | 91.79B | 80.15B | 64.32B |
| Cost Of Goods | 104.27B | 81.49B | 58.90B | 50.81B | 40.54B |
| Gross Profit | 59.76B | 39.24B | 32.89B | 29.34B | 23.78B |
| Operating Expense Selling General And Administrative | 21.92B | 13.90B | 11.71B | 10.82B | 8.18B |
| Operating Expense Other Operating Expenses | 7.37B | 8.12B | 2.55B | 2.17B | 1.81B |
| Operating Income | 23.64B | 12.94B | 11.35B | 10.36B | 8.92B |
| Non Operating Interest Expense | 1.69B | 1.35B | 1.21B | 768.00M | 609.00M |
| Pretax Income | 19.33B | 12.96B | 10.45B | 9.51B | 8.62B |
| Income Tax | 2.58B | 3.33B | 2.09B | 2.06B | 1.47B |
| Net Income | 17.45B | 9.36B | 8.36B | 7.45B | 7.15B |
| Eps Basic | 46.44 | 24.60 | 131.56 | 113.77 | 109.02 |
| Eps Diluted | 45.90 | 24.41 | 129.59 | 111.53 | 106.52 |
| Basic Shares Outstanding | 334.99M | 330.12M | 61.42M | 60.98M | 60.69M |
| Diluted Shares Outstanding | 334.99M | 330.12M | 61.42M | 60.98M | 60.69M |
| Ebit | 21.01B | 14.31B | 11.65B | 10.28B | 9.22B |
| Ebitda | 30.09B | 18.99B | 14.84B | 13.40B | 11.49B |
| Net Income Continuous Operations | 20.03B | 12.54B | 10.45B | 9.51B | 8.62B |
| Minority Interests | -1.89B | -1.24B | -276.00M | -513.00M | -530.00M |
| Preferred Stock Dividends | 0.00 | 0.00 | 0.00 | 0.00 | 0.00 |
| Non Operating Interest Income | N/A | 910.00M | 259.00M | 157.00M | 110.00M |
Source: Financial statements and regulatory filings
Balance Sheet
| fiscal_date | 2026-03-31 | 2025-03-31 | 2024-03-31 | 2023-03-31 | 2022-03-31 |
|---|---|---|---|---|---|
| Cash And Cash Equivalents | 10.94B | 7.96B | 3.21B | 5.70B | 4.47B |
| Accounts Receivable | 39.70B | 25.77B | 18.04B | 16.13B | 13.89B |
| Total Assets | 148.81B | 124.91B | 61.08B | 56.83B | 49.54B |
| Total Liabilities | 52.01B | 41.62B | 23.81B | 25.14B | 21.23B |
| Long Term Debt | 3.35B | 2.80B | 5.72B | 5.17B | 4.30B |
| Shareholders Equity | 96.81B | 83.29B | 37.27B | 31.70B | 28.31B |
Source: Financial statements and regulatory filings
Cash Flow Statement
| fiscal_date | 2026-03-31 | 2025-03-31 | 2024-03-31 | 2023-03-31 | 2022-03-31 |
|---|---|---|---|---|---|
| Operating Activities Net Income | 20.03B | 12.54B | 10.45B | 9.51B | 8.62B |
| Operating Activities Stock Based Compensation | 1.91B | 1.70B | 810.00M | 544.00M | 355.00M |
| Operating Activities Other Non Cash Items | 162.00M | 1.09B | 1.07B | 652.00M | 511.00M |
| Operating Activities Accounts Receivable | -15.52B | -7.42B | -1.67B | -2.13B | -3.15B |
| Operating Activities Other Assets Liabilities | 1.27B | 2.54B | -3.09B | 617.00M | -657.00M |
| Operating Activities Operating Cash Flow | 7.86B | 10.45B | 7.57B | 9.20B | 5.67B |
| Investing Activities Capital Expenditures | -5.95B | -5.57B | -2.60B | -1.54B | -1.48B |
| Investing Activities Net Acquisitions | -208.00M | -20.81B | 0.00 | -1.22B | -8.56B |
| Investing Activities Sale Of Investments | 1.55B | 1.19B | N/A | 0.00 | 450.00M |
| Investing Activities Investing Cash Flow | -4.61B | -25.20B | -2.60B | -2.76B | -9.58B |
| Financing Activities Long Term Debt Issuance | 1.98B | 6.04B | 967.00M | 0.00 | 3.58B |
| Financing Activities Long Term Debt Payments | -5.15B | -3.72B | 0.00 | -180.00M | -59.00M |
| Financing Activities Common Stock Issuance | 3.00M | 22.02B | 7.00M | 18.00M | 51.00M |
| Financing Activities Common Dividends | -5.28B | -4.98B | -4.66B | -3.53B | -3.15B |
| Financing Activities Other Financing Charges | -114.00M | -184.00M | -3.52B | N/A | -729.00M |
| Financing Activities Financing Cash Flow | -8.57B | 19.18B | -7.21B | -3.70B | -311.00M |
| End Cash Position | 10.94B | 7.96B | 3.21B | 5.70B | 4.47B |
| Free Cash Flow | 10.49B | 6.23B | 6.38B | 7.92B | 6.12B |
| Financing Activities Common Stock Repurchase | N/A | N/A | N/A | 0.00 | 0.00 |
Source: Financial statements and regulatory filings
Technical Analysis
Key Insights
- The current trend shows a recovery phase with price action rebounding from recent lows and trading above the 50-day moving average at ₹1,203 but still below the 200-day moving average at ₹1,561.
- Key support levels are identified near ₹1,000 (52-week low) and ₹1,200 (50-day MA), while resistance is observed around ₹1,350 to ₹1,400, coinciding with recent highs and psychological price points.
- The stock is positioned above the short-term 10-day moving average, indicating short-term bullish momentum, but remains under the longer-term 200-day average, suggesting medium-term consolidation.
- Momentum indicators show RSI moving above 65, signaling strengthening bullish momentum; MACD indicates a positive crossover, and stochastic oscillators confirm upward momentum in the short term.
- Across daily, weekly, and monthly timeframes, the stock exhibits signs of bottoming out with improving momentum, though longer-term trends remain cautious due to resistance near 200-day MA.
- Potential market scenarios include continuation of the current rebound if resistance levels are breached, or a retest of support zones if momentum wanes, reflecting a consolidation phase within a broader uptrend.
Trending News
Summary: COFORGE Share Price: Find the latest news on COFORGE Stock Price. Get all the information on COFORGE with historic price charts for NSE / BSE. Experts & Broker view also get the COFORGE Ltd. buy/sell tips detailed news, announcements, Forecasts, Analysts, Valuation, Earning forecasts, Estimates, ...
Sentiment: neutral
2. Headline: Coforge Ltd stock (INE591G01017): recent share weakness and what drives the business
Summary: According to its rating framework, ... that the stock is expected to perform broadly in line with its sector or benchmark in the near term, absent major new catalysts. The rating also acknowledges the company’s strong fundamentals and operational discipline while flagging technical and valuation challenges that could limit immediate upside potential. Outside this specific rating, broader Indian financial media describe Coforge as part of ...
Sentiment: negative
3. Headline: TCS, Infosys, LTM, Coforge: Should you buy IT stocks among sectoral headwinds? - BusinessToday
Summary: Indian IT stocks are having a tough time lately amid the rising AI challenges with major IT player hitting multiyear lows, with select bluechips from the IT space hitting their fresh lows on Thursday.
Sentiment: negative
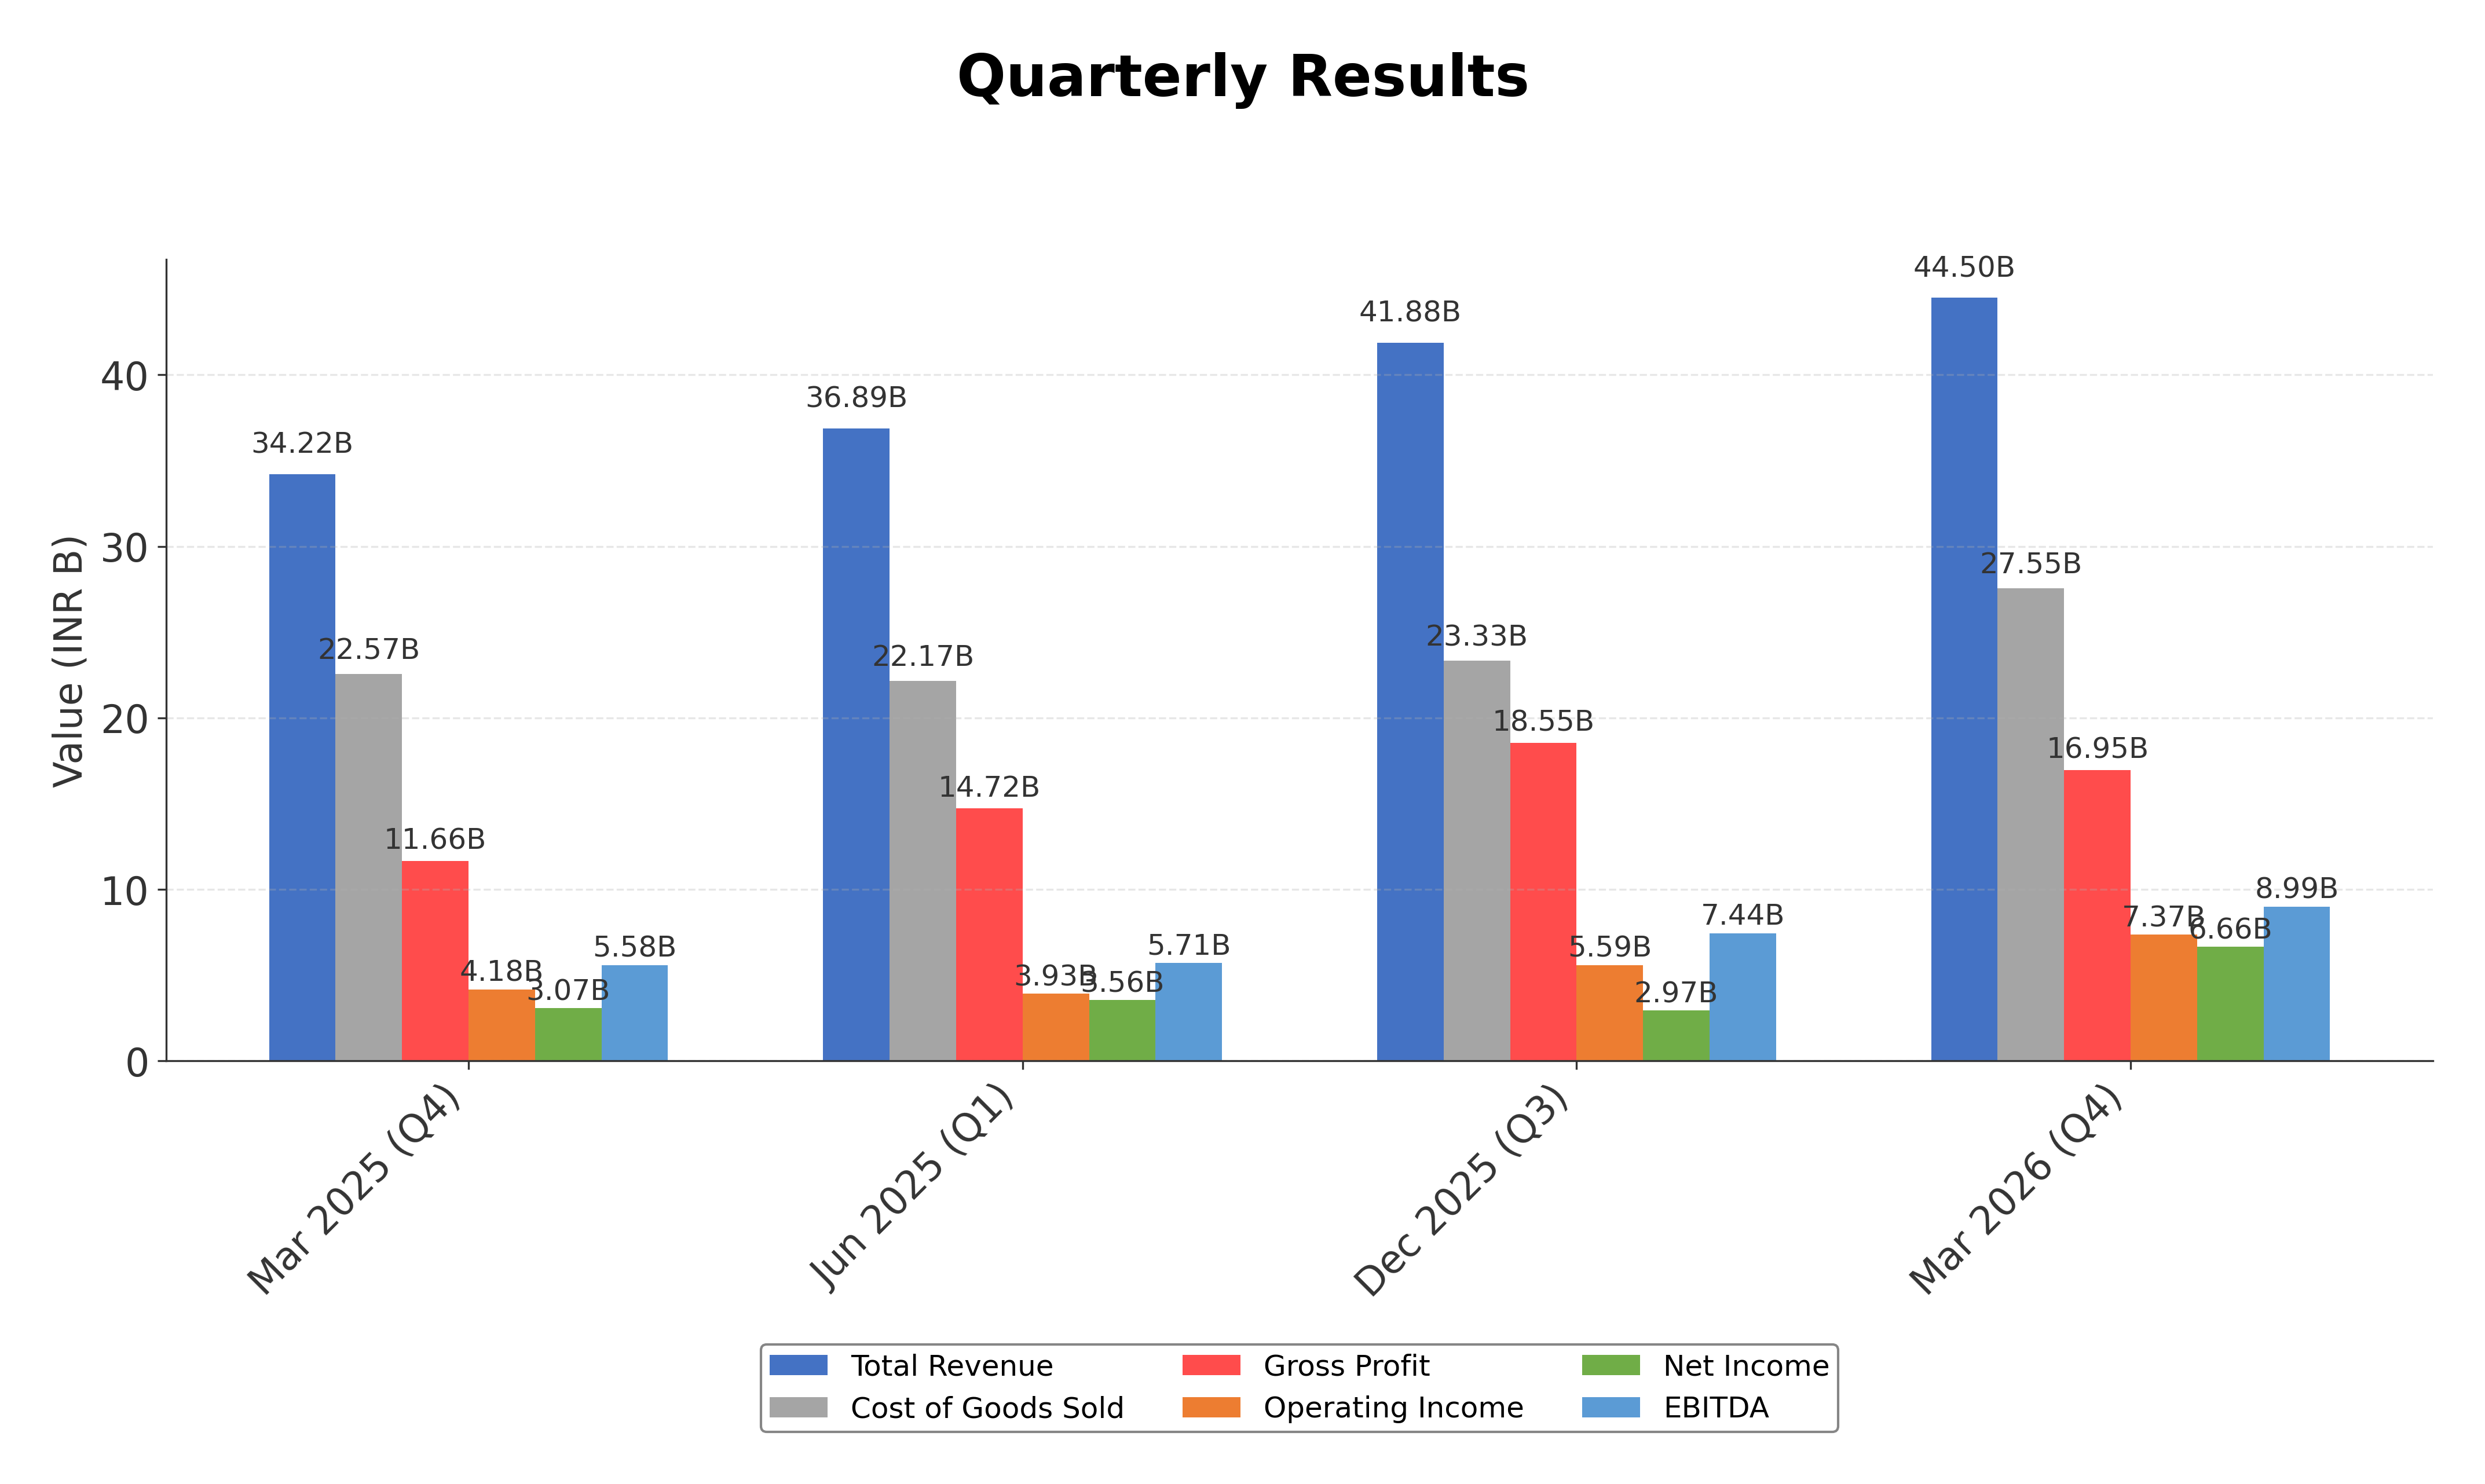
4. Headline: Coforge Ltd stock: Q4 FY26 revenue hits record ?4,450 Cr
Summary: Coforge Ltd reported record Q4 FY26 revenue of ?4,450.50 Cr with net profit up 144.72%, driving a 0.
Sentiment: positive
5. Headline: Coforge's (NSE:COFORGE) Promising Earnings May Rest On Soft Foundations - Simply Wall St News
Summary: Unsurprisingly, Coforge Limited's ( NSE:COFORGE ) stock price was strong on the back of its healthy earnings report...
Sentiment: positive
Recent Updates
News Summary
As of 14.05.2026. Coforge Limited reported record Q4 FY26 revenue of ₹4,450.50 crore with a net profit increase of 144.72%, reflecting strong operational performance and growth momentum. The company’s CEO highlighted a 29.2% year-over-year revenue growth and expanded EBIT margins by 370 basis points to 14.4%, supported by a $1.75 billion executable order book entering FY27. Analysts responded positively, noting strong deal wins including six large deals worth $648 million in Q4, and an expanding order book that supports double-digit organic growth expectations. The acquisition of Encora is expected to further enhance revenue streams. The company continues to emphasize AI integration and digital transformation capabilities, backed by a workforce exceeding 45,000 professionals. These developments underscore Coforge’s solid fundamentals and strategic positioning in the IT services sector.
News Sentiment
The overall sentiment from recent updates is predominantly positive, driven by record revenue and profit growth, strong deal wins, and an expanding order book that provides visibility for sustained growth. Positive analyst commentary and acquisition activity contribute to optimism around the company’s future prospects. However, some caution is noted due to valuation and technical challenges, reflecting a balanced market view. The integration of AI and digital services remains a key theme supporting operational momentum. Collectively, the news portrays a company with robust fundamentals and growth potential tempered by typical sector valuation considerations.
Source List
- https://www.ad-hoc-news.de/boerse/news/ueberblick/coforge-ltd-stock-q4-fy26-revenue-hits-record-4-450-cr/69332944
- https://m.economictimes.com/markets/stocks/news/coforge-shares-surge-6-rally-16-in-three-days-post-q4-results-whats-ahead-for-investors/articleshow/130952721.cms
- https://news.coforge.com/newsroom/in-the-news/coforge-fy26-results-cnbc-tv18
Analytical Overview
Analysis Summary
Coforge’s valuation metrics show a trailing P/E of 29.24 and forward P/E of 18.63, which are broadly in line with the Indian IT services industry average P/E of 29.24, indicating fair valuation relative to peers. The company’s PEG ratio of 0.16 suggests attractive earnings growth potential relative to price. Revenue growth is robust at 30.5% year-over-year, supported by strong cash flow trends with operating cash flow of ₹17.92 billion and free cash flow of ₹17.16 billion, demonstrating solid operational cash generation. Financial health appears strong with a low debt-to-equity ratio of 0.075 and a current ratio of 1.61, reflecting good liquidity and conservative leverage. Sector-specific challenges include competitive pressures and evolving technology demands, while opportunities arise from digital transformation and AI adoption. India-specific factors such as a favorable regulatory environment and growing IT exports support the company’s growth trajectory.
Overall Business and Market Assessment
Supporting Factors: strong revenue and profit growth, robust cash flow generation, and a healthy balance sheet with low leverage
Risk Factors: valuation premiums relative to peers and sector competition that could impact margins
SWOT Analysis
Strengths
- Strong revenue growth of 30.5% year-over-year.
- Healthy profitability with ROE of 18.6% and operating margin of 16.6%.
- Robust cash flow generation with operating cash flow of ₹17.92 billion.
- Low debt-to-equity ratio of 0.075 indicating conservative leverage.
Weaknesses
- Stock trades at a premium valuation with P/E of 29.24 compared to some peers.
- Current price is down nearly 29% from 52-week high, reflecting recent volatility.
- Dependence on competitive IT services sector with rapid technological changes.
Opportunities
- Expanding order book valued at $1.75 billion supports future growth.
- Increasing adoption of AI and digital transformation services.
- Strategic acquisitions like Encora to enhance revenue streams.
Threats
- Intense competition in the global IT services market.
- Potential regulatory changes impacting outsourcing and data security.
- Macroeconomic uncertainties affecting client IT spending.
Company Description
Coforge Limited, formerly known as NIIT Technologies, is a prominent name in the IT services sector, delivering cutting-edge technology solutions to businesses across the globe. This company is recognized for its expertise in digital transformation, cloud services, application management, artificial intelligence, and data analytics. By partnering with industries such as banking, financial services, insurance, travel, and transportation, Coforge plays a vital role in enhancing operational efficiencies and driving innovation. Headquartered in India, Coforge has established a strong presence in key global markets, offering bespoke services tailored to the unique needs of its clients. The company's commitment to agility and deep domain knowledge positions it as a strategic partner for enterprises aiming to navigate the complexities of the digital age. Coforge's influence extends beyond immediate client benefits as it contributes to the broader technological advancements within the industries it serves, reinforcing its status as a significant player in the global IT services market.