


Coal India Ltd (COALINDIA)
Stock Analysis Report
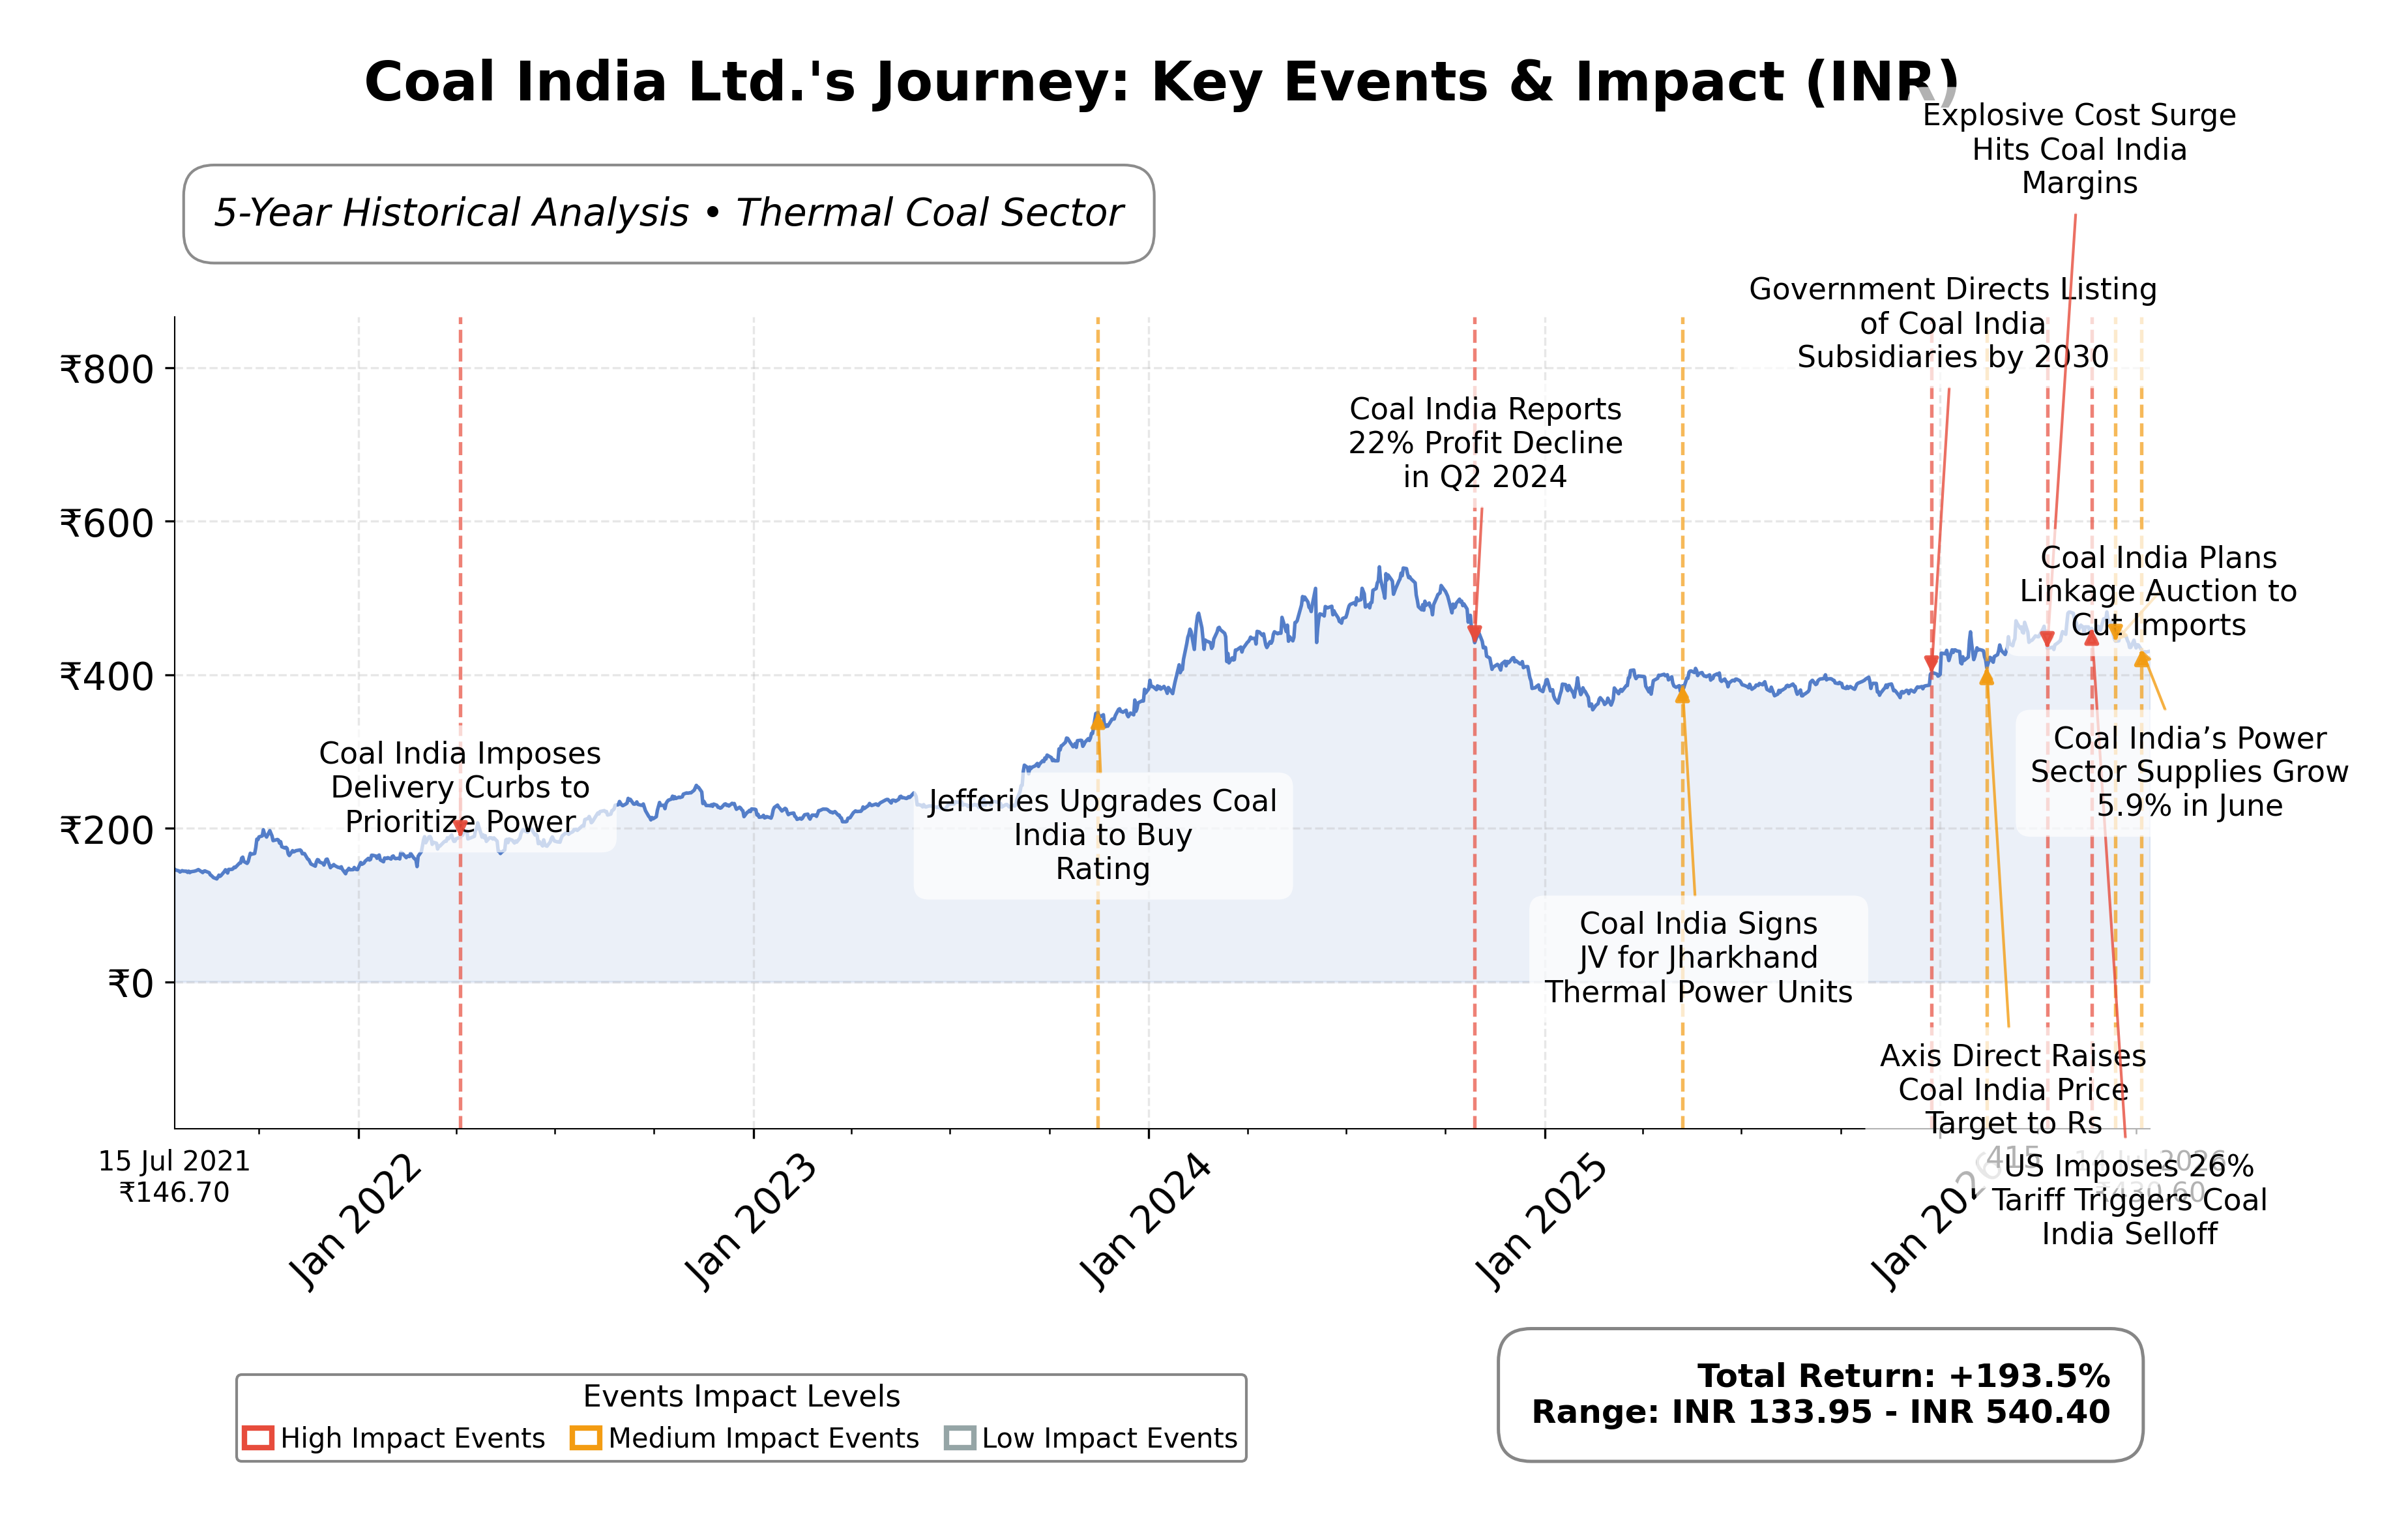
Stock Journey
Key Positives and Key Risks
Pros
- Strong profitability with a 28.1% return on equity indicating efficient capital use.
- Robust cash flow generation with INR 432 billion operating cash flow supporting financial flexibility.
- Reasonable valuation metrics including a forward P/E of 7.49 and PEG ratio of 0.31 suggesting undervaluation relative to growth.
Cons
- Recent 7.5% decline in quarterly coal output may signal operational challenges.
- High dependence on coal exposes the company to regulatory and environmental risks amid energy transition.
- Price-to-book ratio of 2.22 is relatively elevated compared to some peers, indicating limited asset revaluation potential.
Disclosure: This information is for general awareness and does not constitute investment advice
Report Summary
Coal India Ltd. is a state-owned coal mining and energy company listed on the National Stock Exchange of India (NSE) under the Energy sector. Headquartered in Kolkata, it is the world’s largest coal producer by output, primarily engaged in the exploration, mining, and production of thermal and coking coal. The company serves a diverse customer base including power generation companies, steel producers, and cement manufacturers, operating through multiple subsidiaries and hundreds of mines across India. As a key public sector enterprise under the Ministry of Coal, Coal India plays a pivotal role in India’s energy ecosystem and industrial infrastructure.
Financially, Coal India reported trailing twelve months (TTM) revenue of approximately INR 1.68 trillion with a gross margin of 93.8%, an operating margin of 20.9%, and a net profit margin of 18.5%. The company’s return on equity (ROE) stands at 28.1%, and return on assets (ROA) at 7.1%, indicating strong profitability and efficient asset utilization. Its return on invested capital (ROIC) is reflected in an enterprise value to EBITDA ratio of 5.43, underscoring operational efficiency. Quarterly revenue growth was robust at 16.2%, and quarterly earnings growth year-over-year was 12.9%, demonstrating positive momentum in financial performance.
Valuation metrics show a trailing price-to-earnings (P/E) ratio of 8.52 and a forward P/E of 7.49, both below typical industry averages, suggesting the stock is trading at a reasonable valuation relative to earnings. The price-to-book (P/B) ratio is 2.22, and the PEG ratio is 0.31, indicating attractive valuation relative to growth prospects. Market capitalization is approximately INR 2.65 trillion, with the stock price currently at INR 428.35, positioned between its 52-week low of INR 368.65 and high of INR 491.25. The enterprise value stands at INR 2.24 trillion, supporting a moderate EV/EBITDA multiple of 5.43.
Coal India’s strengths include strong cash flow generation with operating cash flow of INR 432 billion and free cash flow of INR 72.4 billion, low debt levels with a total debt to equity ratio of 0.12, and market leadership as the largest coal producer in India. Key risks involve regulatory changes, competition from alternative energy sources, and macroeconomic factors impacting coal demand. Recent strategic initiatives include forming a renewable energy joint venture with a Uttar Pradesh utility, signaling diversification into cleaner energy segments. No recent leadership changes were reported.
Technically, the stock is trading above its 200-day moving average (INR 425.38) and near its 50-day moving average (INR 455.99), indicating a generally positive trend with some resistance near recent highs. Momentum indicators such as RSI and MACD suggest moderate strength without overbought conditions. Recent news highlights a mixed sentiment with positive developments in renewable energy ventures and coal supply increases tempered by a decline in Q1 coal output. Overall, the data suggests a balanced environment where accumulation and cautious observation may be warranted.
Company and Industry Overview
Company Basics
Price Performance
Company Size
Shareholding Pattern
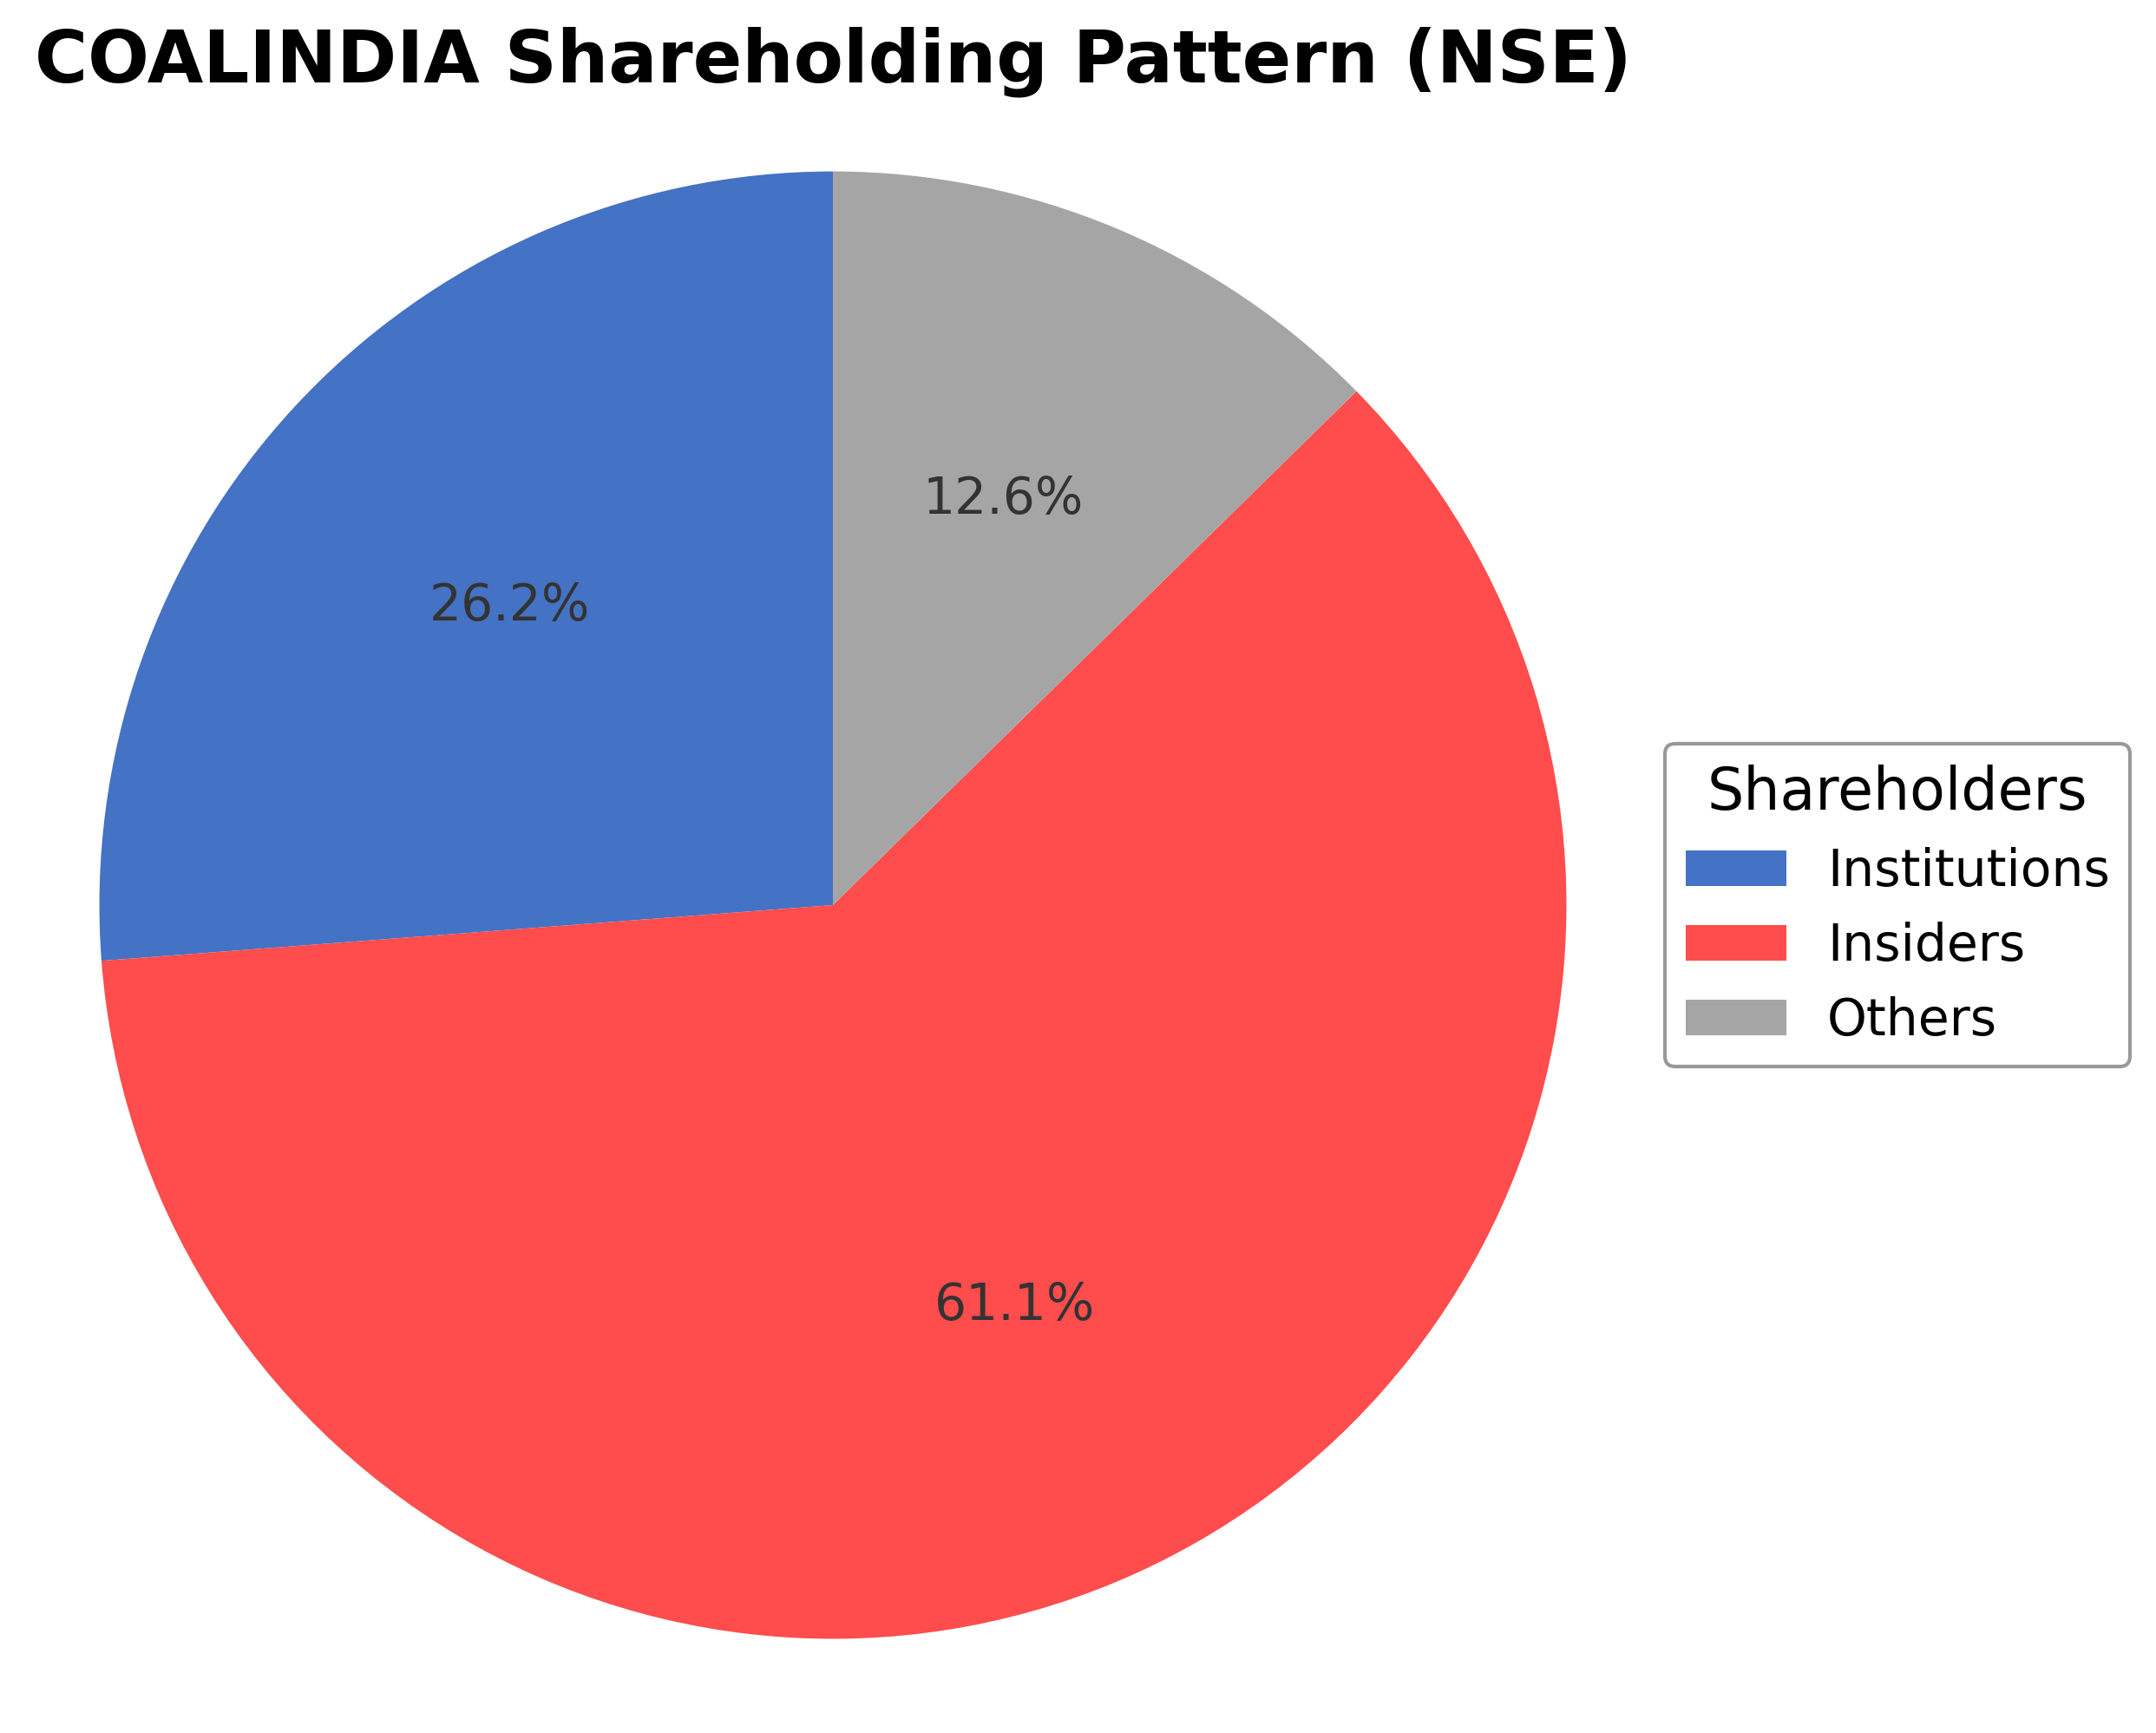
Coal India Ltd.'s ownership structure comprises approximately 61.14% held by insiders, including executives and government-affiliated entities, reflecting strong promoter control. Institutional investors hold about 26.22%, including mutual funds and pension funds, with a notable trend of moderate accumulation over the past 12-24 months. Public shareholders and other retail investors account for roughly 12.64%. This distribution indicates a stable governance framework with significant government influence and institutional interest, which supports strategic continuity and aligns with national energy priorities. The shareholding pattern suggests a balanced market sentiment, with institutional investors maintaining confidence while public participation remains steady.
Sector and Industry Analysis
The Indian coal sector is a significant component of the country's energy landscape, with a market size projected to grow from 1.04 billion tons in 2025 to 1.50 billion tons by 2030, reflecting a CAGR of 7.57%. Coal India Limited is a dominant player in this semi-consolidated market, alongside other major firms such as JSW Energy, NTPC, and Adani Power. The sector primarily serves power generation, industrial, and infrastructural development needs, underpinning India's energy security and economic growth.
Industry trends indicate a continued reliance on thermal coal for power generation, supported by plans to commission new coal-fired plants like the Patratu Super Thermal Project and Uppur Thermal Power Project. However, the market faces challenges from increasing renewable energy capacity, driven by government targets and environmental concerns, which may restrain coal demand growth. Competitive dynamics are shaped by the presence of large public and private sector players, with barriers to entry including capital intensity, regulatory compliance, and resource access.
The regulatory environment is characterized by a dual focus: promoting coal for energy security while aggressively supporting renewable energy expansion to meet climate commitments. Policies aim to increase renewable capacity to 450 GW by 2030, which could reduce coal's share in the energy mix. Government initiatives such as the Solar Park Scheme and Viability Gap Funding reflect this shift, creating a complex landscape where coal companies must navigate evolving environmental regulations and sustainability mandates.
Note: Analysis synthesized from industry research, market reports, and regulatory filings. Information is subject to change based on market conditions.
Financial Ratios Dashboard
Illustrative Scenario Analysis
DCF Assumptions:
Method: Two-Stage EPS-Priority Model
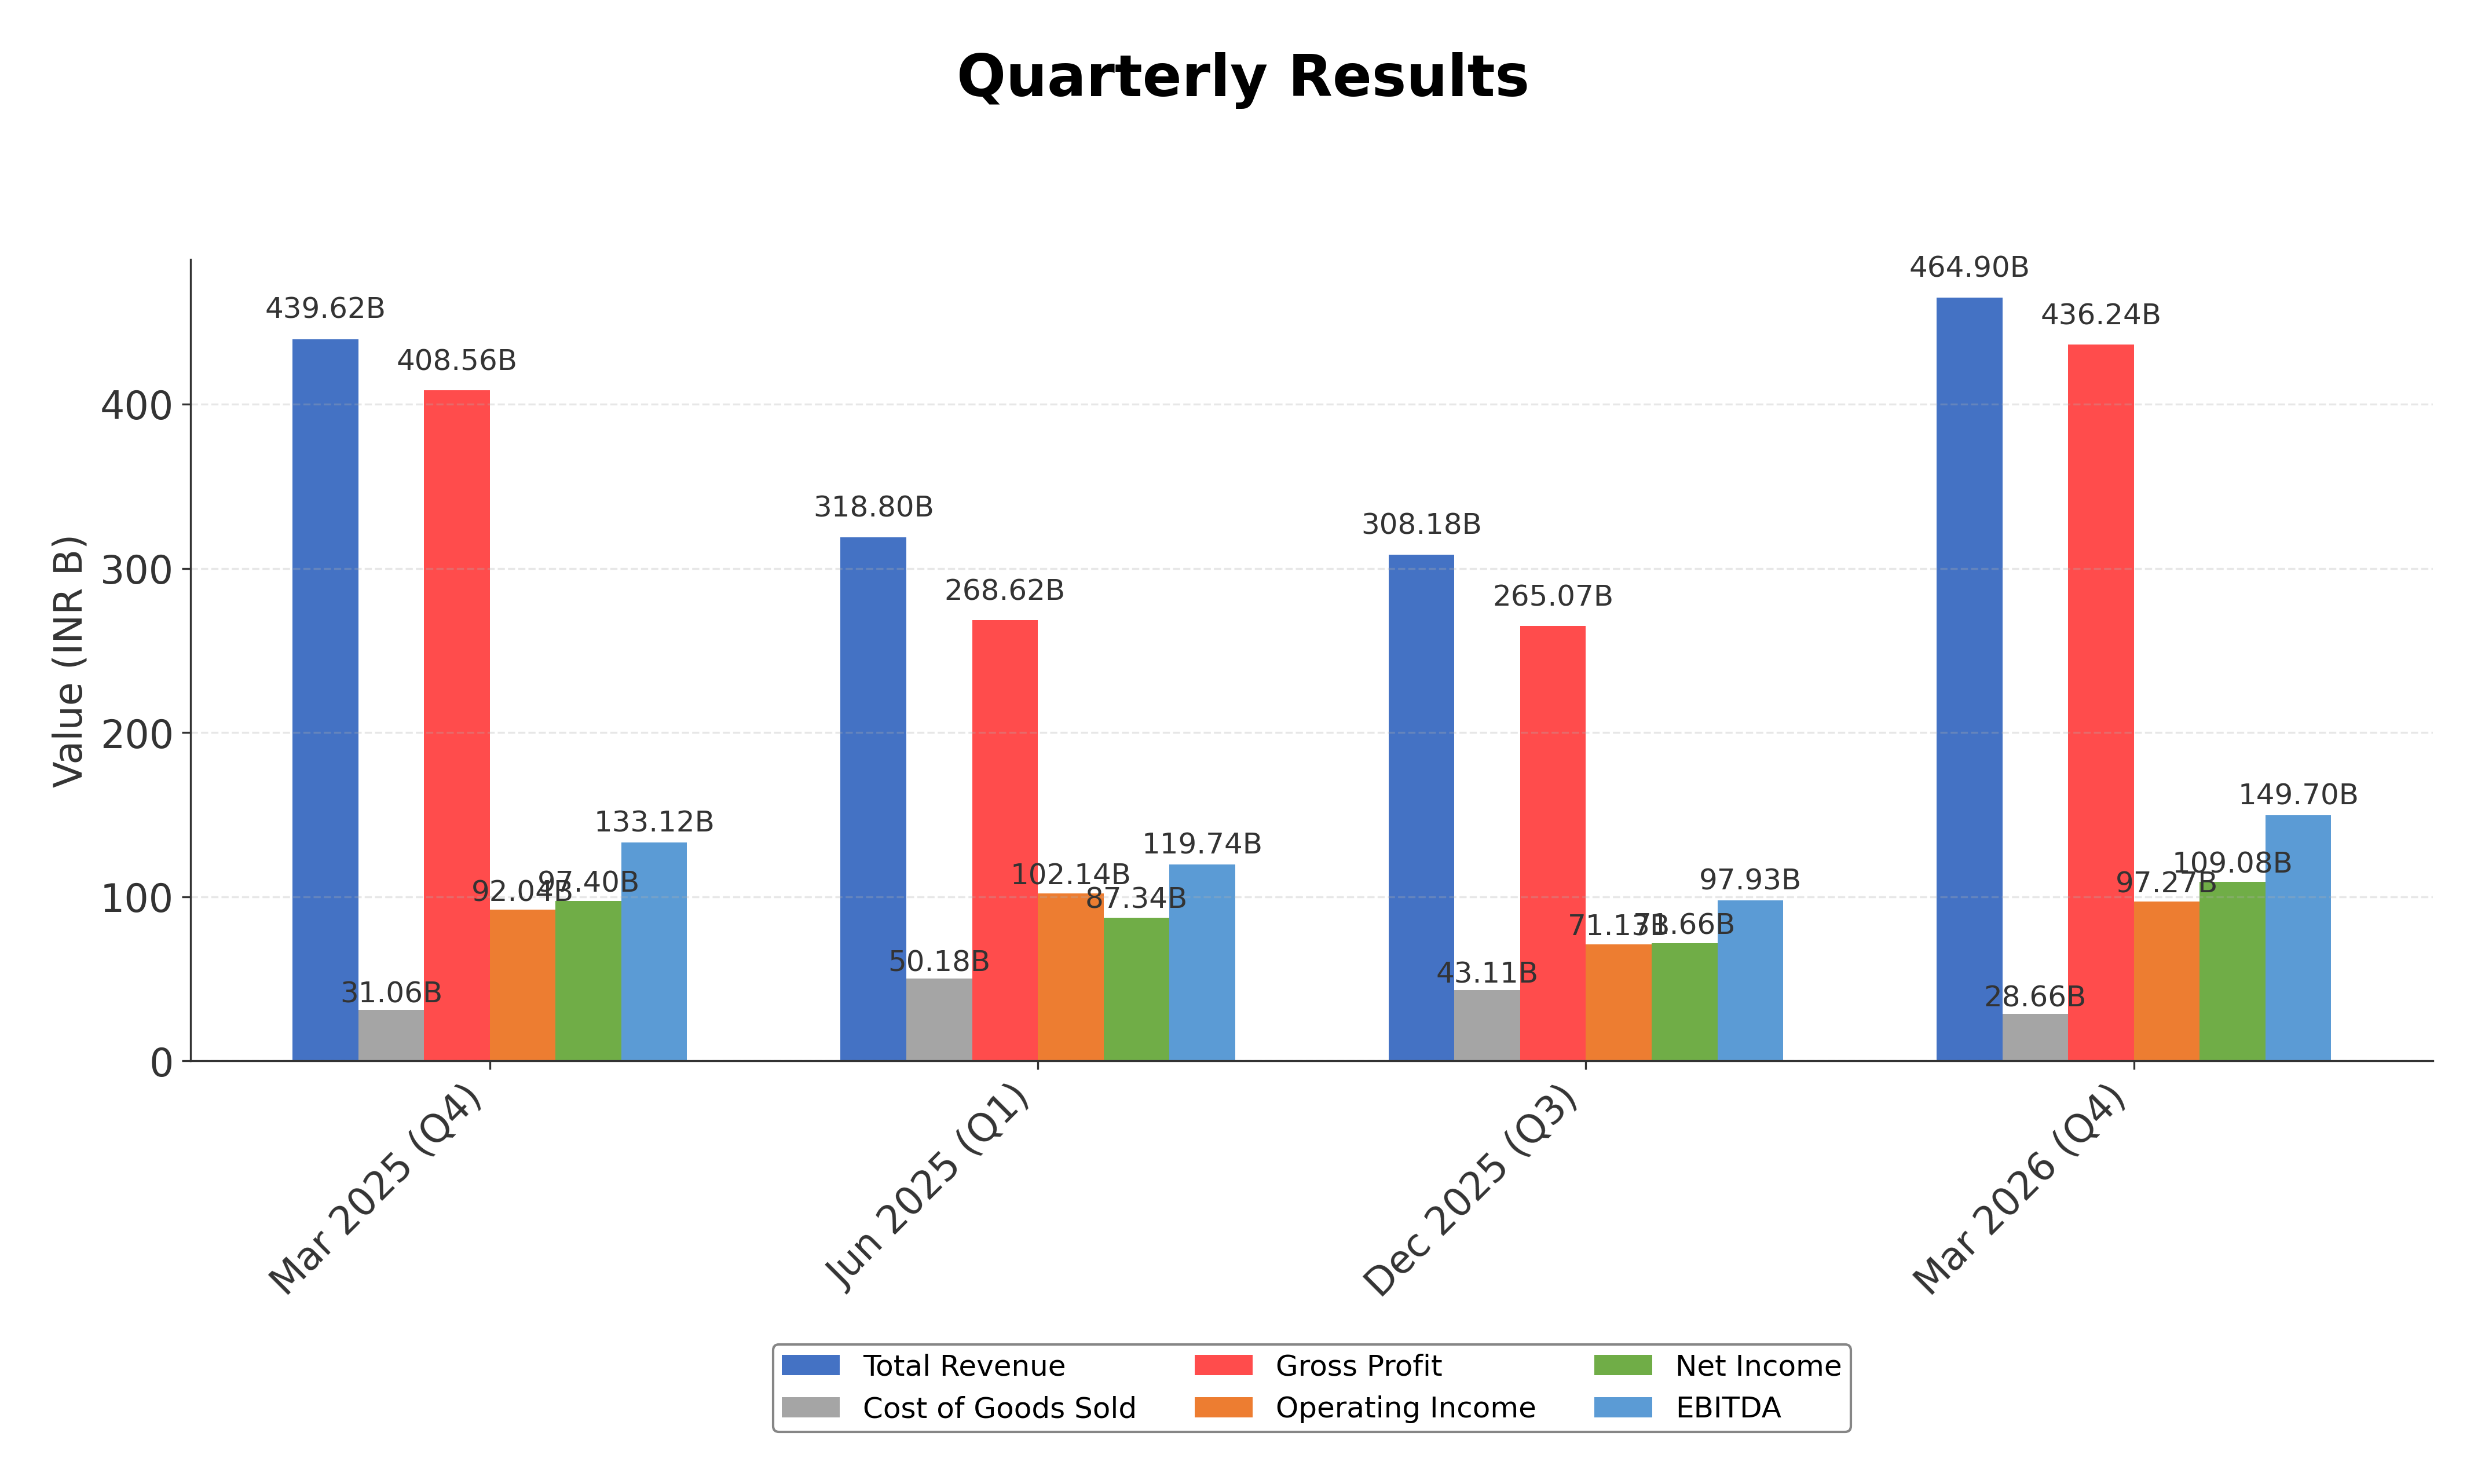
Financials
Peer Analysis
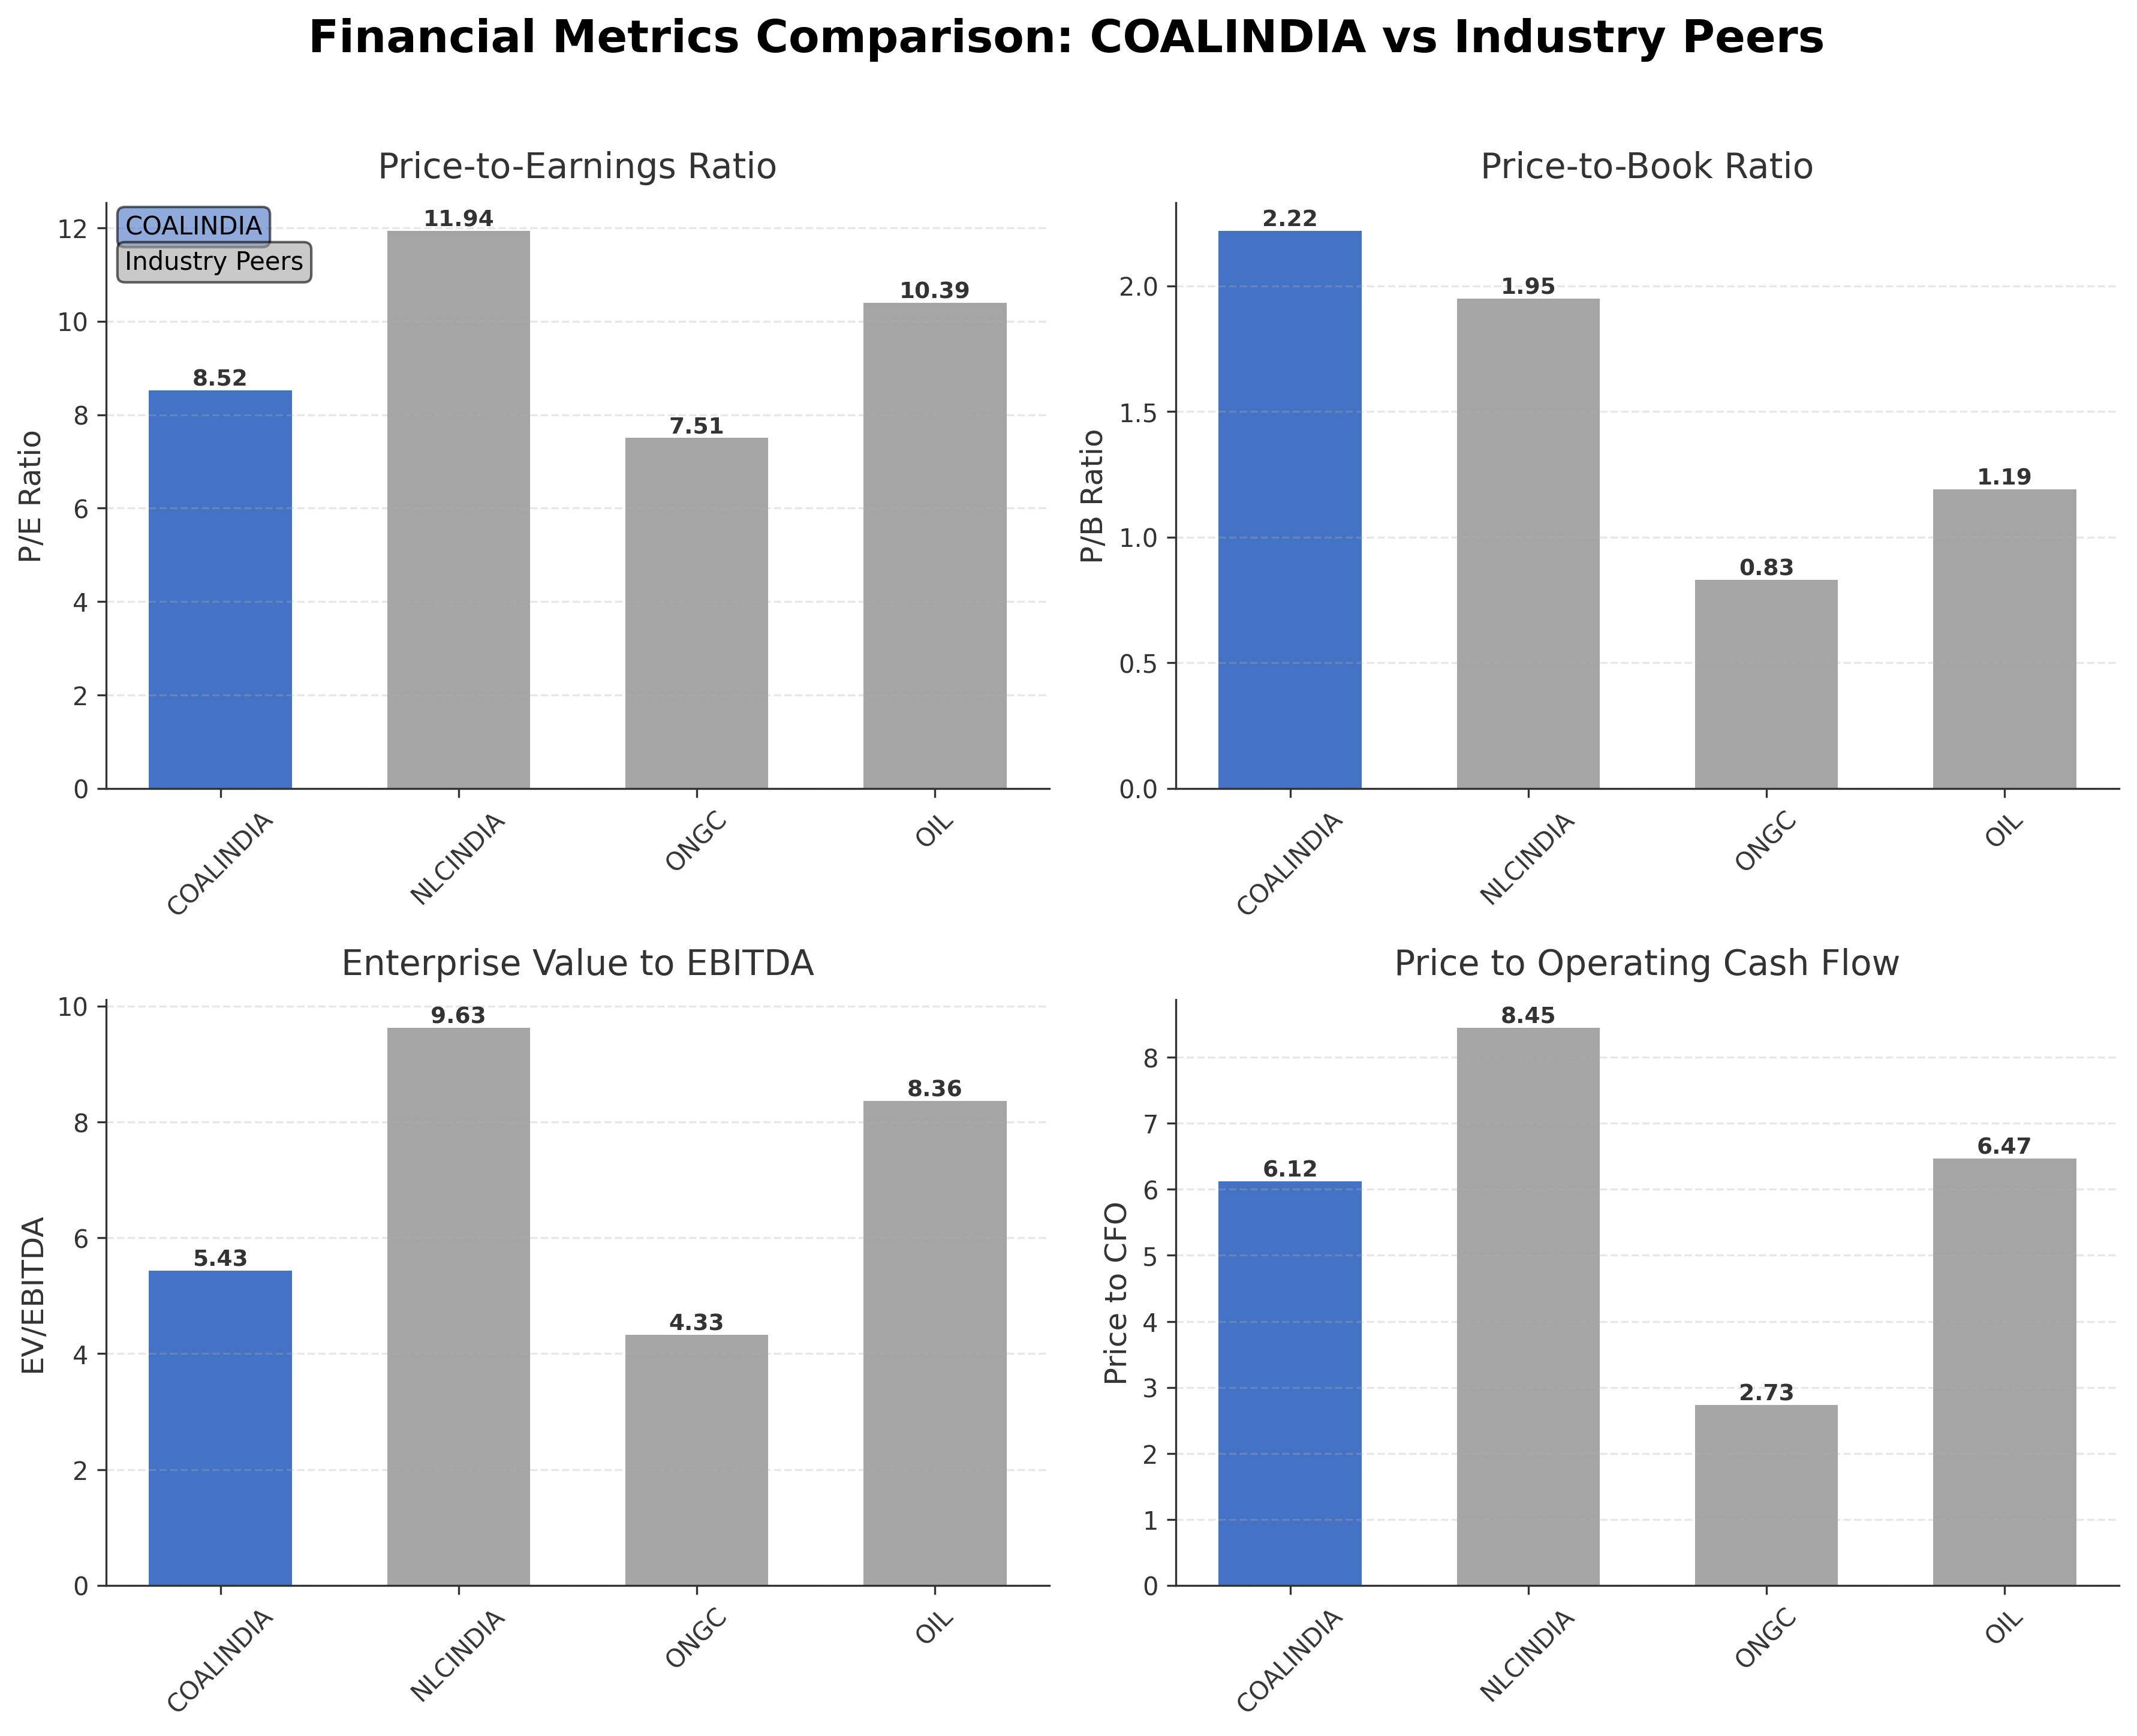
| Company Name | Market Cap | P/E Ratio | P/B Ratio | EV/EBITDA | Price to CFO |
|---|---|---|---|---|---|
| Coal India Ltd. | ₹2.65T | 8.52 | 2.22 | 5.43 | 6.12 |
| NLC India Ltd. | ₹436.65B | 11.94 | 1.95 | 9.63 | 8.45 |
| Oil & Natural Gas Corporation Ltd. | ₹3.08T | 7.51 | 0.83 | 4.33 | 2.73 |
| Oil India Limited | ₹691.23B | 10.39 | 1.19 | 8.36 | 6.47 |
Comparison Analysis: Coal India Ltd. demonstrates a strong market capitalization of ₹2.65 trillion, surpassing most peers except ONGC. Its P/E ratio of 8.52 is moderate, lower than NLC India and Oil India but higher than ONGC, indicating a balanced valuation relative to earnings. The P/B ratio of 2.22 is higher than peers, reflecting a premium on book value. Coal India’s EV/EBITDA ratio of 5.43 is more efficient than NLC India and Oil India, but slightly above ONGC’s 4.33, suggesting competitive operational leverage. Its return on equity at 28.12% significantly exceeds peers, highlighting superior profitability and capital efficiency. Overall, Coal India holds a leadership position with robust financial metrics compared to regional industry peers.
Financial Metrics Comparison with Peers
Financial Statements
Comprehensive financial data including income, balance sheet, and cash flow metrics
Income Statement
| fiscal_date | 2026-03-31 | 2025-03-31 | 2024-03-31 | 2023-03-31 | 2022-03-31 |
|---|---|---|---|---|---|
| Sales | 1684.00B | 1691.77B | 1298.30B | 1274.29B | 1005.63B |
| Cost Of Goods | 184.80B | 180.36B | 196.70B | 229.51B | 189.23B |
| Gross Profit | 1499.21B | 1511.42B | 1101.60B | 1044.78B | 816.40B |
| Operating Expense Other Operating Expenses | 764.61B | 722.85B | 166.70B | 136.18B | 262.62B |
| Operating Income | 311.05B | 381.13B | 413.41B | 376.76B | 240.57B |
| Non Operating Interest Expense | 12.16B | 8.84B | 5.80B | 5.46B | 5.41B |
| Pretax Income | 419.23B | 471.63B | 488.13B | 432.75B | 236.16B |
| Income Tax | 108.53B | 117.14B | 114.43B | 115.52B | 62.38B |
| Net Income | 310.71B | 354.50B | 373.69B | 317.23B | 173.78B |
| Eps Basic | 50.46 | 57.61 | 60.69 | 51.54 | 28.17 |
| Eps Diluted | 50.46 | 57.61 | 60.69 | 51.54 | 28.17 |
| Basic Shares Outstanding | 6.16B | 6.16B | 6.16B | 6.16B | 6.16B |
| Diluted Shares Outstanding | 6.16B | 6.16B | 6.16B | 6.16B | 6.16B |
| Ebit | 431.39B | 480.47B | 493.92B | 438.21B | 241.58B |
| Ebitda | 532.76B | 571.39B | 557.75B | 505.24B | 285.98B |
| Net Income Continuous Operations | 419.23B | 471.63B | 488.13B | 432.75B | 236.16B |
| Minority Interests | 237.10M | 560.60M | 331.60M | 402.50M | -203.20M |
| Preferred Stock Dividends | 0.00 | 0.00 | 0.00 | 0.00 | 0.00 |
| Operating Expense Research And Development | N/A | 2.21B | 86.70M | 1.32B | 318.20M |
| Operating Expense Selling General And Administrative | N/A | 7.47B | 4.23B | 3.28B | 2.49B |
| Non Operating Interest Income | N/A | 53.55B | 45.74B | 30.69B | 16.33B |
Data provided by Twelve Data
Balance Sheet
| fiscal_date | 2026-03-31 | 2025-03-31 | 2024-03-31 | 2023-03-31 | 2022-03-31 |
|---|---|---|---|---|---|
| Cash And Cash Equivalents | 86.20B | 111.61B | 60.09B | 56.27B | 70.63B |
| Accounts Receivable | 141.21B | 126.09B | 139.05B | 148.93B | 113.68B |
| Total Assets | 2856.60B | 2601.98B | 2376.72B | 2224.31B | 1934.85B |
| Total Liabilities | 1646.56B | 1602.48B | 1540.90B | 1608.17B | 1496.68B |
| Long Term Debt | 94.08B | 75.32B | 57.73B | 42.63B | 34.61B |
| Shareholders Equity | 1210.05B | 999.51B | 835.82B | 616.14B | 438.17B |
Data provided by Twelve Data
Cash Flow Statement
| fiscal_date | 2026-03-31 | 2025-03-31 | 2024-03-31 | 2023-03-31 | 2022-03-31 |
|---|---|---|---|---|---|
| Operating Activities Net Income | 419.23B | 471.63B | 488.13B | 432.75B | 236.16B |
| Operating Activities Other Non Cash Items | -99.12B | -91.12B | -103.56B | -78.28B | 16.91B |
| Operating Activities Accounts Receivable | -29.23B | 14.91B | -7.00B | -26.75B | 39.61B |
| Operating Activities Other Assets Liabilities | 92.03B | -51.51B | -64.39B | -26.29B | 126.29B |
| Operating Activities Operating Cash Flow | 382.92B | 343.92B | 313.18B | 301.42B | 418.97B |
| Investing Activities Capital Expenditures | -124.31B | -142.79B | -167.50B | -152.11B | -119.96B |
| Investing Activities Net Acquisitions | -8.64B | -966.70M | -3.47B | -6.67B | -7.68B |
| Investing Activities Investing Cash Flow | -132.95B | -143.75B | -170.97B | -158.78B | -127.64B |
| Financing Activities Short Term Debt Issuance | 30.91B | 15.11B | -51.30M | 6.80M | N/A |
| Financing Activities Common Dividends | -161.97B | -162.39B | -150.98B | -143.28B | -107.83B |
| Financing Activities Financing Cash Flow | -131.07B | -147.27B | -151.03B | -143.27B | -107.83B |
| End Cash Position | 86.20B | 111.60B | 53.45B | 56.27B | 70.63B |
| Free Cash Flow | 307.15B | 159.05B | 12.82B | 204.16B | 290.83B |
Data provided by Twelve Data
Technical Analysis
Key Insights
- The current trend shows a generally upward price movement with the stock trading above its 200-day moving average at ₹425.38 and near the 50-day moving average at ₹455.99, indicating medium-term strength.
- Key support levels are identified near ₹368.65 (52-week low) and ₹425, while resistance is observed around ₹491.25 (52-week high) and ₹456, marking critical price points for potential consolidation.
- The stock is positioned above the 200-day moving average and slightly below the 50-day moving average, suggesting a cautiously bullish stance with some short-term resistance.
- Momentum indicators such as RSI and MACD currently reflect moderate strength without overbought or oversold conditions, indicating balanced momentum.
- Analysis across daily, weekly, and monthly timeframes confirms a consistent upward trend with occasional pullbacks, supporting a stable technical setup.
- Potential market scenarios include continuation of the uptrend if resistance near ₹491.25 is breached, or a consolidation phase if the price fails to surpass this level, with support near ₹425 providing downside protection.
Trending News
Summary: Coal India Share Price: Find the latest news on Coal India Stock Price. Get all the information on Coal India with historic price charts for NSE / BSE. Experts & Broker view also get the Coal India Ltd. buy/sell tips detailed news, announcements, Forecasts, Analysts, Valuation, Earning forecasts, ...
Sentiment: neutral
2. Headline: Coal India Share Price Highlights: Coal India Ltd Stock Price History - The Economic Times
Summary: Stay up-to-date with the Coal India ... stock. Explore the latest details on Coal India, including: Last traded price 430.2, Market capitalization: 265120.57, Volume: 5650932, Price-to-earnings ratio 8.53, Earnings per share 50.46. Get a comprehensive understanding of Coal India with our coverage of both fundamental and technical indicators. Stay informed about breaking news that can have ...
Sentiment: neutral
3. Headline: Coal India's Q1 output falls 7.5% as supplies rise, stocks decline | Company News - Business Standard
Summary: Topics : Coal India Coal India Limited Coal India Ltd Coal production · Don't miss the most important news and views of the day. Get them on our Telegram channel ... Stock Market HighlightsStocks to Watch TodayMaharashtra Energy Drink BanAUtoimmune GastritisOTT Releases This WeekPB Fintech ...
Sentiment: negative
4. Headline: Coal India stock leans on scale and coal demand
Summary: Coal India stock centers on scale, supply, and India`s power-fuel demand as the state-run miner enters the second half of the year without a fresh company-specific catalyst in the available results. ... By Julia Smith, Sector & Peers desk. Reviewed on July 4, 2026 at 4:45 p.m. ET. Coal India Ltd ...
Sentiment: neutral
5. Headline: Coal India forms renewable energy joint venture with Uttar Pradesh utility - TipRanks.com
Summary: Discover top stock picks and new investment opportunities through TipRanks' Smart Investor Newsletter. An update from Coal India Ltd.
Sentiment: neutral
Powered by Brave
Recent Updates
News Summary
As of July 3, 2026. Coal India Ltd has strategically expanded into renewable energy by forming a joint venture with a Uttar Pradesh utility company, marking a significant diversification beyond its core coal mining operations. This aligns with India's broader energy transition goals and supports the company's long-term sustainability. Concurrently, Coal India increased coal supplies by 5.9% in June to 51.44 million tonnes, reflecting operational responsiveness to rising demand. These developments underscore the company's dual focus on maintaining coal supply strength while exploring cleaner energy avenues. No material leadership changes or regulatory challenges were reported in the recent period.
News Sentiment
The overall sentiment from recent updates is cautiously positive, driven by Coal India's proactive expansion into renewable energy and increased coal supply volumes. The joint venture in renewables signals strategic foresight, while supply growth supports the company's core business stability. However, the absence of new leadership announcements and the mixed production data temper the outlook. The balance of these factors suggests steady operational momentum with emerging diversification efforts shaping future prospects.
Source List
- https://www.tipranks.com/news/company-announcements/coal-india-forms-renewable-energy-joint-venture-with-uttar-pradesh-utility
- https://www.livemint.com/market/stock-market-news/stocks-to-watch-adani-enterprises-coal-india-pnb-sterlite-tech-bpcl-among-shares-in-focus-today-check-list-here-11783016507473.html
Analytical Overview
Analysis Summary
Coal India Ltd.’s valuation metrics, including a trailing P/E of 8.52 and forward P/E of 7.49, are below the industry average of 8.52, indicating the stock is reasonably priced relative to earnings. The PEG ratio of 0.31 further suggests undervaluation relative to growth prospects. The company’s revenue growth of 16.2% and positive cash flow trends, with operating cash flow of INR 432 billion and free cash flow of INR 72.4 billion, demonstrate a solid growth trajectory and healthy liquidity position. Financial health is robust, evidenced by a low total debt to equity ratio of 0.12 and a current ratio of 1.86, indicating strong balance sheet stability. Sector-specific challenges include regulatory shifts and competition from renewable energy, but opportunities arise from Coal India’s recent renewable energy joint venture and its dominant market position in India’s coal industry. Considering India’s regulatory environment and energy transition policies, Coal India’s diversification efforts align with evolving market dynamics.
Overall Business and Market Assessment
Supporting Factors: Coal India’s strong profitability metrics such as a 28.1% ROE and robust cash flow generation, alongside a reasonable valuation with a forward P/E under 8
Risk Factors: regulatory changes impacting coal demand and operational challenges reflected in recent production declines
SWOT Analysis
Strengths
- Market leadership as the world’s largest coal producer.
- Strong profitability with a 28.1% return on equity.
- Robust cash flow generation supporting operational stability.
- Low debt levels with a debt-to-equity ratio of 0.12.
Weaknesses
- High dependence on coal amid global energy transition.
- Recent decline in quarterly coal output by 7.5%.
- Moderate price-to-book ratio indicating limited asset revaluation.
- Limited diversification outside core coal mining until recent ventures.
Opportunities
- Expansion into renewable energy through joint ventures.
- Rising domestic coal demand driven by India’s industrial growth.
- Potential for operational efficiencies and cost optimization.
- Government support as a key public sector enterprise.
Threats
- Regulatory risks related to environmental policies and coal usage.
- Competition from alternative energy sources and imports.
- Volatility in coal prices impacting revenue stability.
- Macroeconomic factors affecting industrial coal consumption.
Company Description
Coal India Ltd. is a state-owned coal mining and energy company headquartered in Kolkata, India. The company is primarily engaged in the exploration, mining, and production of thermal and coking coal, supplying a broad range of coal grades to industrial and utility customers across the country. Through multiple subsidiaries operating in numerous mining areas and hundreds of underground and opencast mines, Coal India Ltd. plays a central role in India’s energy ecosystem by serving power generation companies, steel producers, cement manufacturers, and other core industries. It also runs coal washeries and associated facilities such as workshops and hospitals, supporting integrated mining operations and logistics. As the world’s largest coal producer by output, Coal India Ltd. is a key public sector enterprise under the Ministry of Coal, contributing significantly to India’s primary commercial energy supply and underpinning the functioning of critical infrastructure and industrial activity nationwide. Founded in 1975 and headquartered in Kolkata, it remains a pivotal player in the country’s mining and energy sectors.