

Clean Max Enviro Energy Solutions Limited (CLEANMAX)
Stock Analysis Report
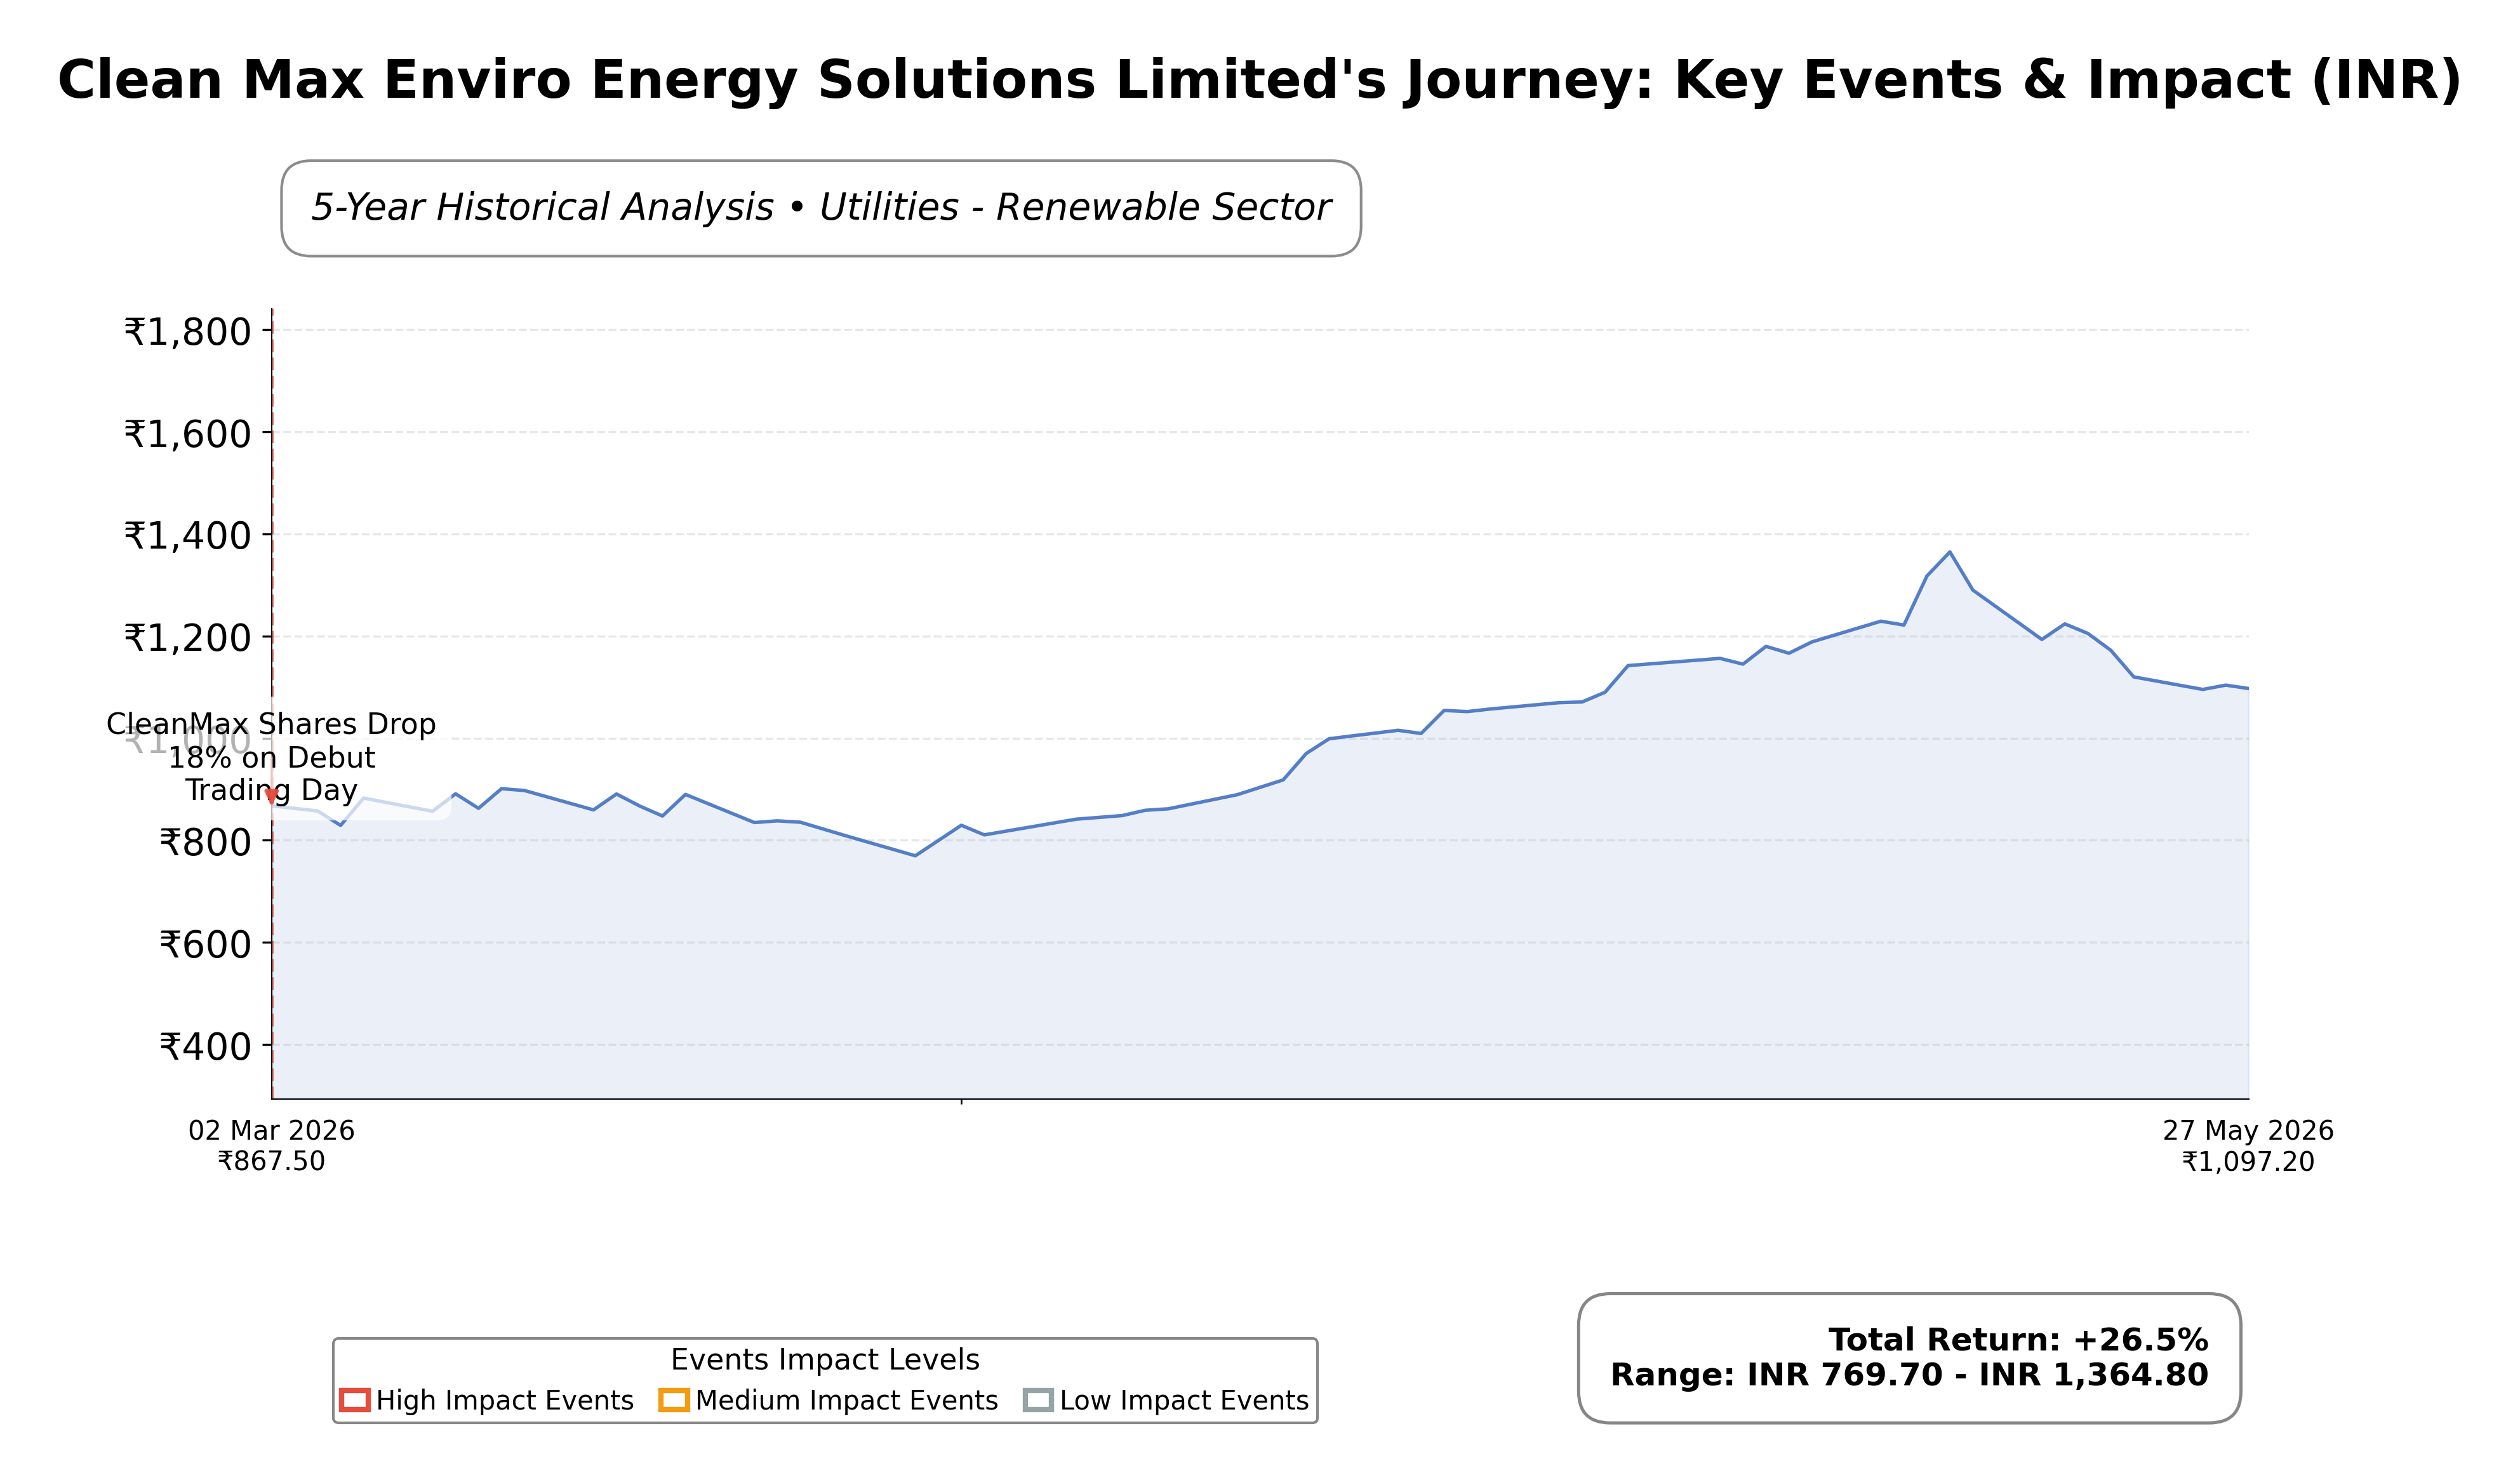
Stock Journey
Key Positives and Key Risks
Pros
- Operating margin of 36.02% demonstrates strong operational efficiency supporting profitability.
- Operating cash flow of INR 7.22 billion indicates solid cash generation capacity.
- Recent $575 million financing secures capital for nearly 1 GW renewable energy expansion.
Cons
- Debt-to-equity ratio of 303.24% reflects high leverage and potential financial risk.
- Trailing P/E ratio of 358.16 suggests the stock is valued at a significant premium.
- Current ratio of 0.68 indicates potential liquidity constraints in the short term.
Disclosure: This information is for general awareness and does not constitute investment advice
Report Summary
Clean Max Enviro Energy Solutions Limited operates as a prominent player in the renewable energy sector, specializing in commercial and industrial solar, wind, and hybrid power solutions. Listed on the NSE in India under the Utilities sector, the company develops and manages renewable energy projects including rooftop and ground-mounted solar installations, solar carports, and wind farms. Its operations span India and extend to the Middle East and Southeast Asia, serving diverse industries such as automotive, pharmaceuticals, IT, and FMCG. The company’s business model includes long-term power purchase agreements and turnkey engineering services, positioning it as a key contributor to sustainable energy adoption.
Financially, Clean Max reported trailing twelve months revenue of approximately INR 18.01 billion with a profit margin of 3.37%, indicating modest net profitability. Operating margin stands at a robust 36.02%, reflecting operational efficiency in project execution and management. Return on equity (ROE) and return on assets (ROA) are relatively low at 0.87% and 0.21%, respectively, suggesting limited returns on invested capital and assets. The company’s EBITDA is INR 9.35 billion, supporting a strong operating cash flow of INR 7.22 billion over the last twelve months, which underscores solid cash generation despite net income constraints.
Valuation metrics highlight a high trailing P/E ratio of 358.16 and a forward P/E of 127.80, which are significantly above the industry average, indicating a premium valuation possibly driven by growth expectations. The price-to-book ratio is 4.07, and the enterprise value to EBITDA ratio is 20.82, both suggesting the stock is priced at a premium relative to its book value and earnings. The market capitalization is approximately INR 127.62 billion, with the stock trading near INR 1,098.20, close to its 52-week high of INR 1,125.45, reflecting strong recent price appreciation.
Key strengths include a strong operating margin and substantial operating cash flow, supported by recent successful commissioning of a 351.4 MWp solar park and a significant $575 million financing round to expand its renewable energy portfolio. However, the company faces risks related to its high debt levels, with a debt-to-equity ratio exceeding 300%, and a current ratio below 1, indicating potential liquidity pressures. The renewable energy sector’s regulatory environment and competitive landscape also pose ongoing challenges. Recent strategic actions such as securing large-scale funding and project commissioning demonstrate active growth initiatives.
Technically, the stock is trading above its 50-day and 200-day moving averages, indicating a positive trend. Momentum indicators and multi-timeframe analysis suggest sustained upward price action, supported by strong volume. Recent news flow is predominantly positive, centered on expansion and financing activities. Overall, the data suggests a market environment that may favor continued accumulation, though the elevated valuation and leverage warrant careful monitoring.
Company and Industry Overview
Company Basics
Price Performance
Company Size
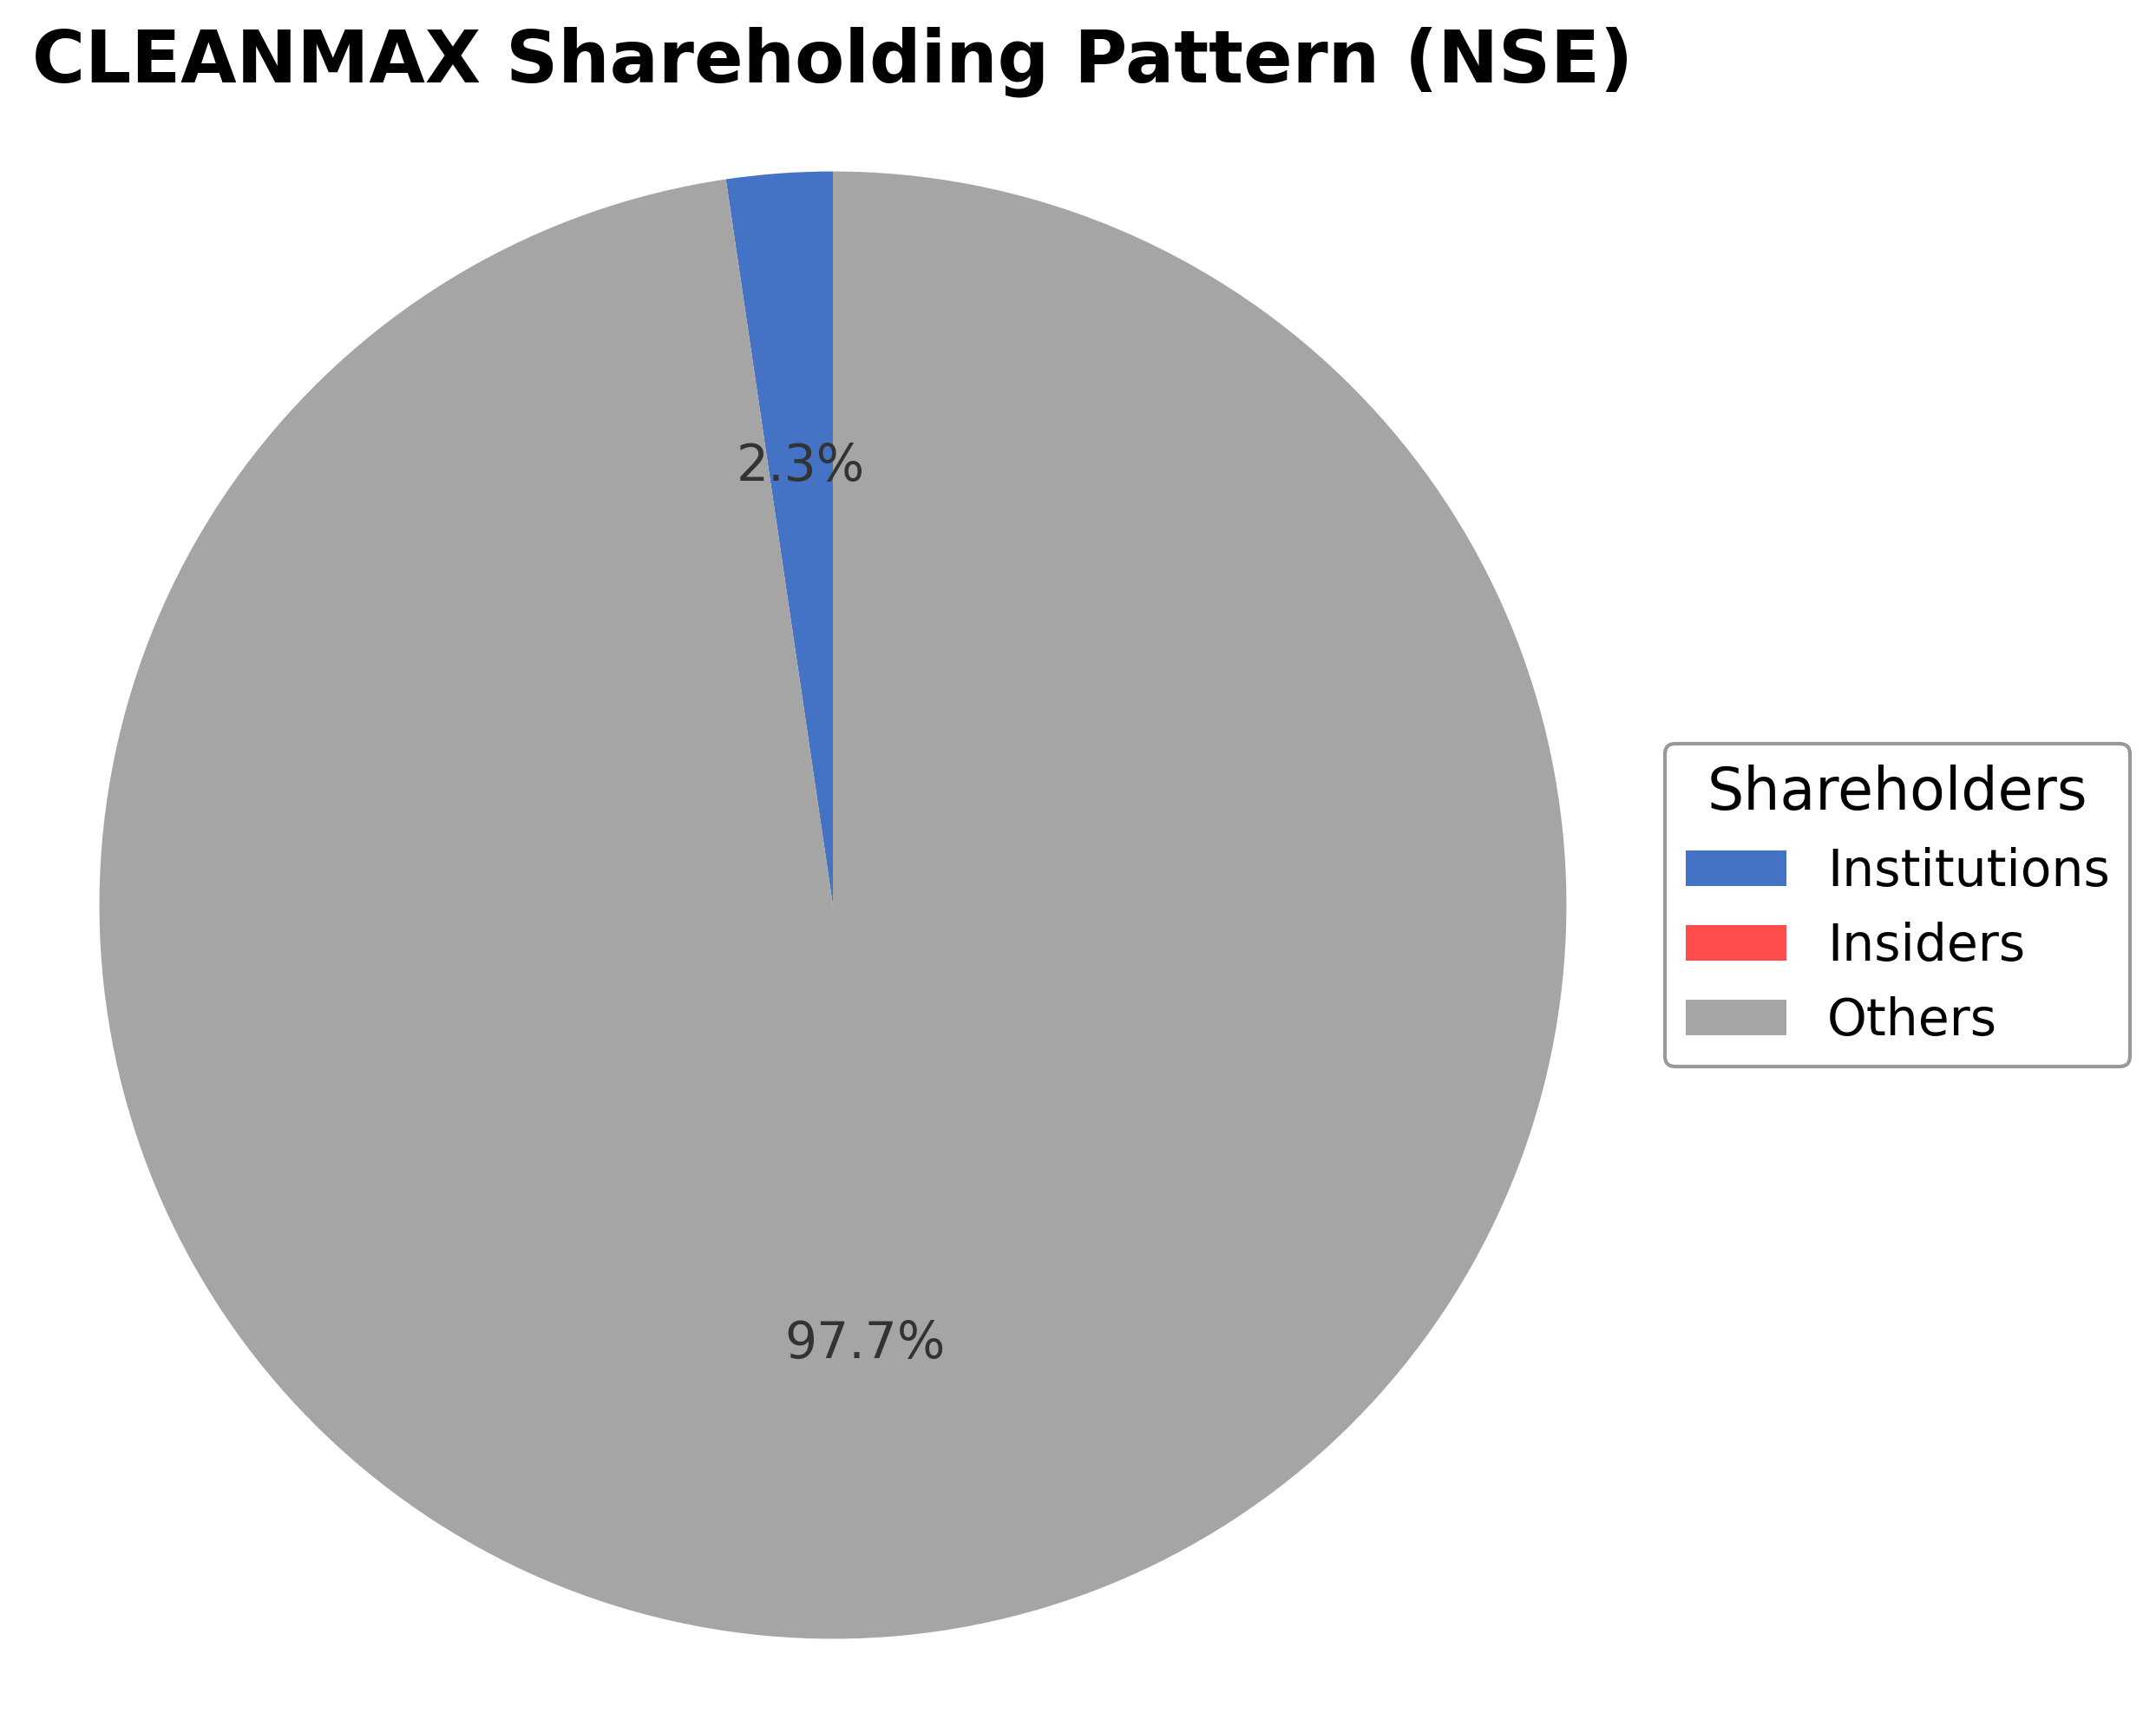
Shareholding Pattern
Sector and Industry Analysis
The renewable energy sector, particularly the commercial and industrial (C&I) segment, is experiencing robust growth driven by increasing demand for sustainable power solutions. Market size is expanding rapidly with capacity additions growing at double-digit rates annually, supported by corporate commitments to reduce carbon footprints. Key players in this space include Clean Max Enviro Energy Solutions, along with other established renewable energy developers focusing on solar and wind projects.
Industry trends highlight a shift towards larger-scale, grid-connected renewable installations with improved operating leverage as companies scale capacity. Competitive dynamics are shaped by technological advancements, cost reductions in solar PV and storage, and rising customer demand for green energy procurement. Barriers to entry remain moderate due to capital intensity and the need for regulatory approvals, positioning established firms with operational scale and strong balance sheets favorably.
The regulatory landscape is evolving with supportive government policies promoting renewable energy adoption, including incentives, renewable purchase obligations, and tariff regulations. However, the sector faces risks from policy changes, input cost volatility, and compliance requirements that can impact project economics. Ongoing regulatory clarity and stable frameworks are critical for sustaining investment momentum and sector growth in the medium term.
Note: Analysis synthesized from industry research, market reports, and regulatory filings. Information is subject to change based on market conditions.
Illustrative Scenario Analysis
DCF Assumptions:
Method: Two-Stage EPS-Priority Model
Peer Analysis
| Company Name | Market Cap | P/E Ratio | P/B Ratio | EV/EBITDA | Price to CFO |
|---|---|---|---|---|---|
| Clean Max Enviro Energy Solutions Limited | ₹127.62B | 358.16 | 4.07 | 20.82 | 17.66 |
| Adani Green Energy Limited | ₹2.24T | 140.31 | 12.00 | 31.43 | 22.14 |
| NHPC Ltd. | ₹787.13B | 28.29 | 1.90 | 26.16 | 23.90 |
| SJVN Ltd. | ₹287.23B | 44.84 | 1.98 | 16.51 | 15.45 |
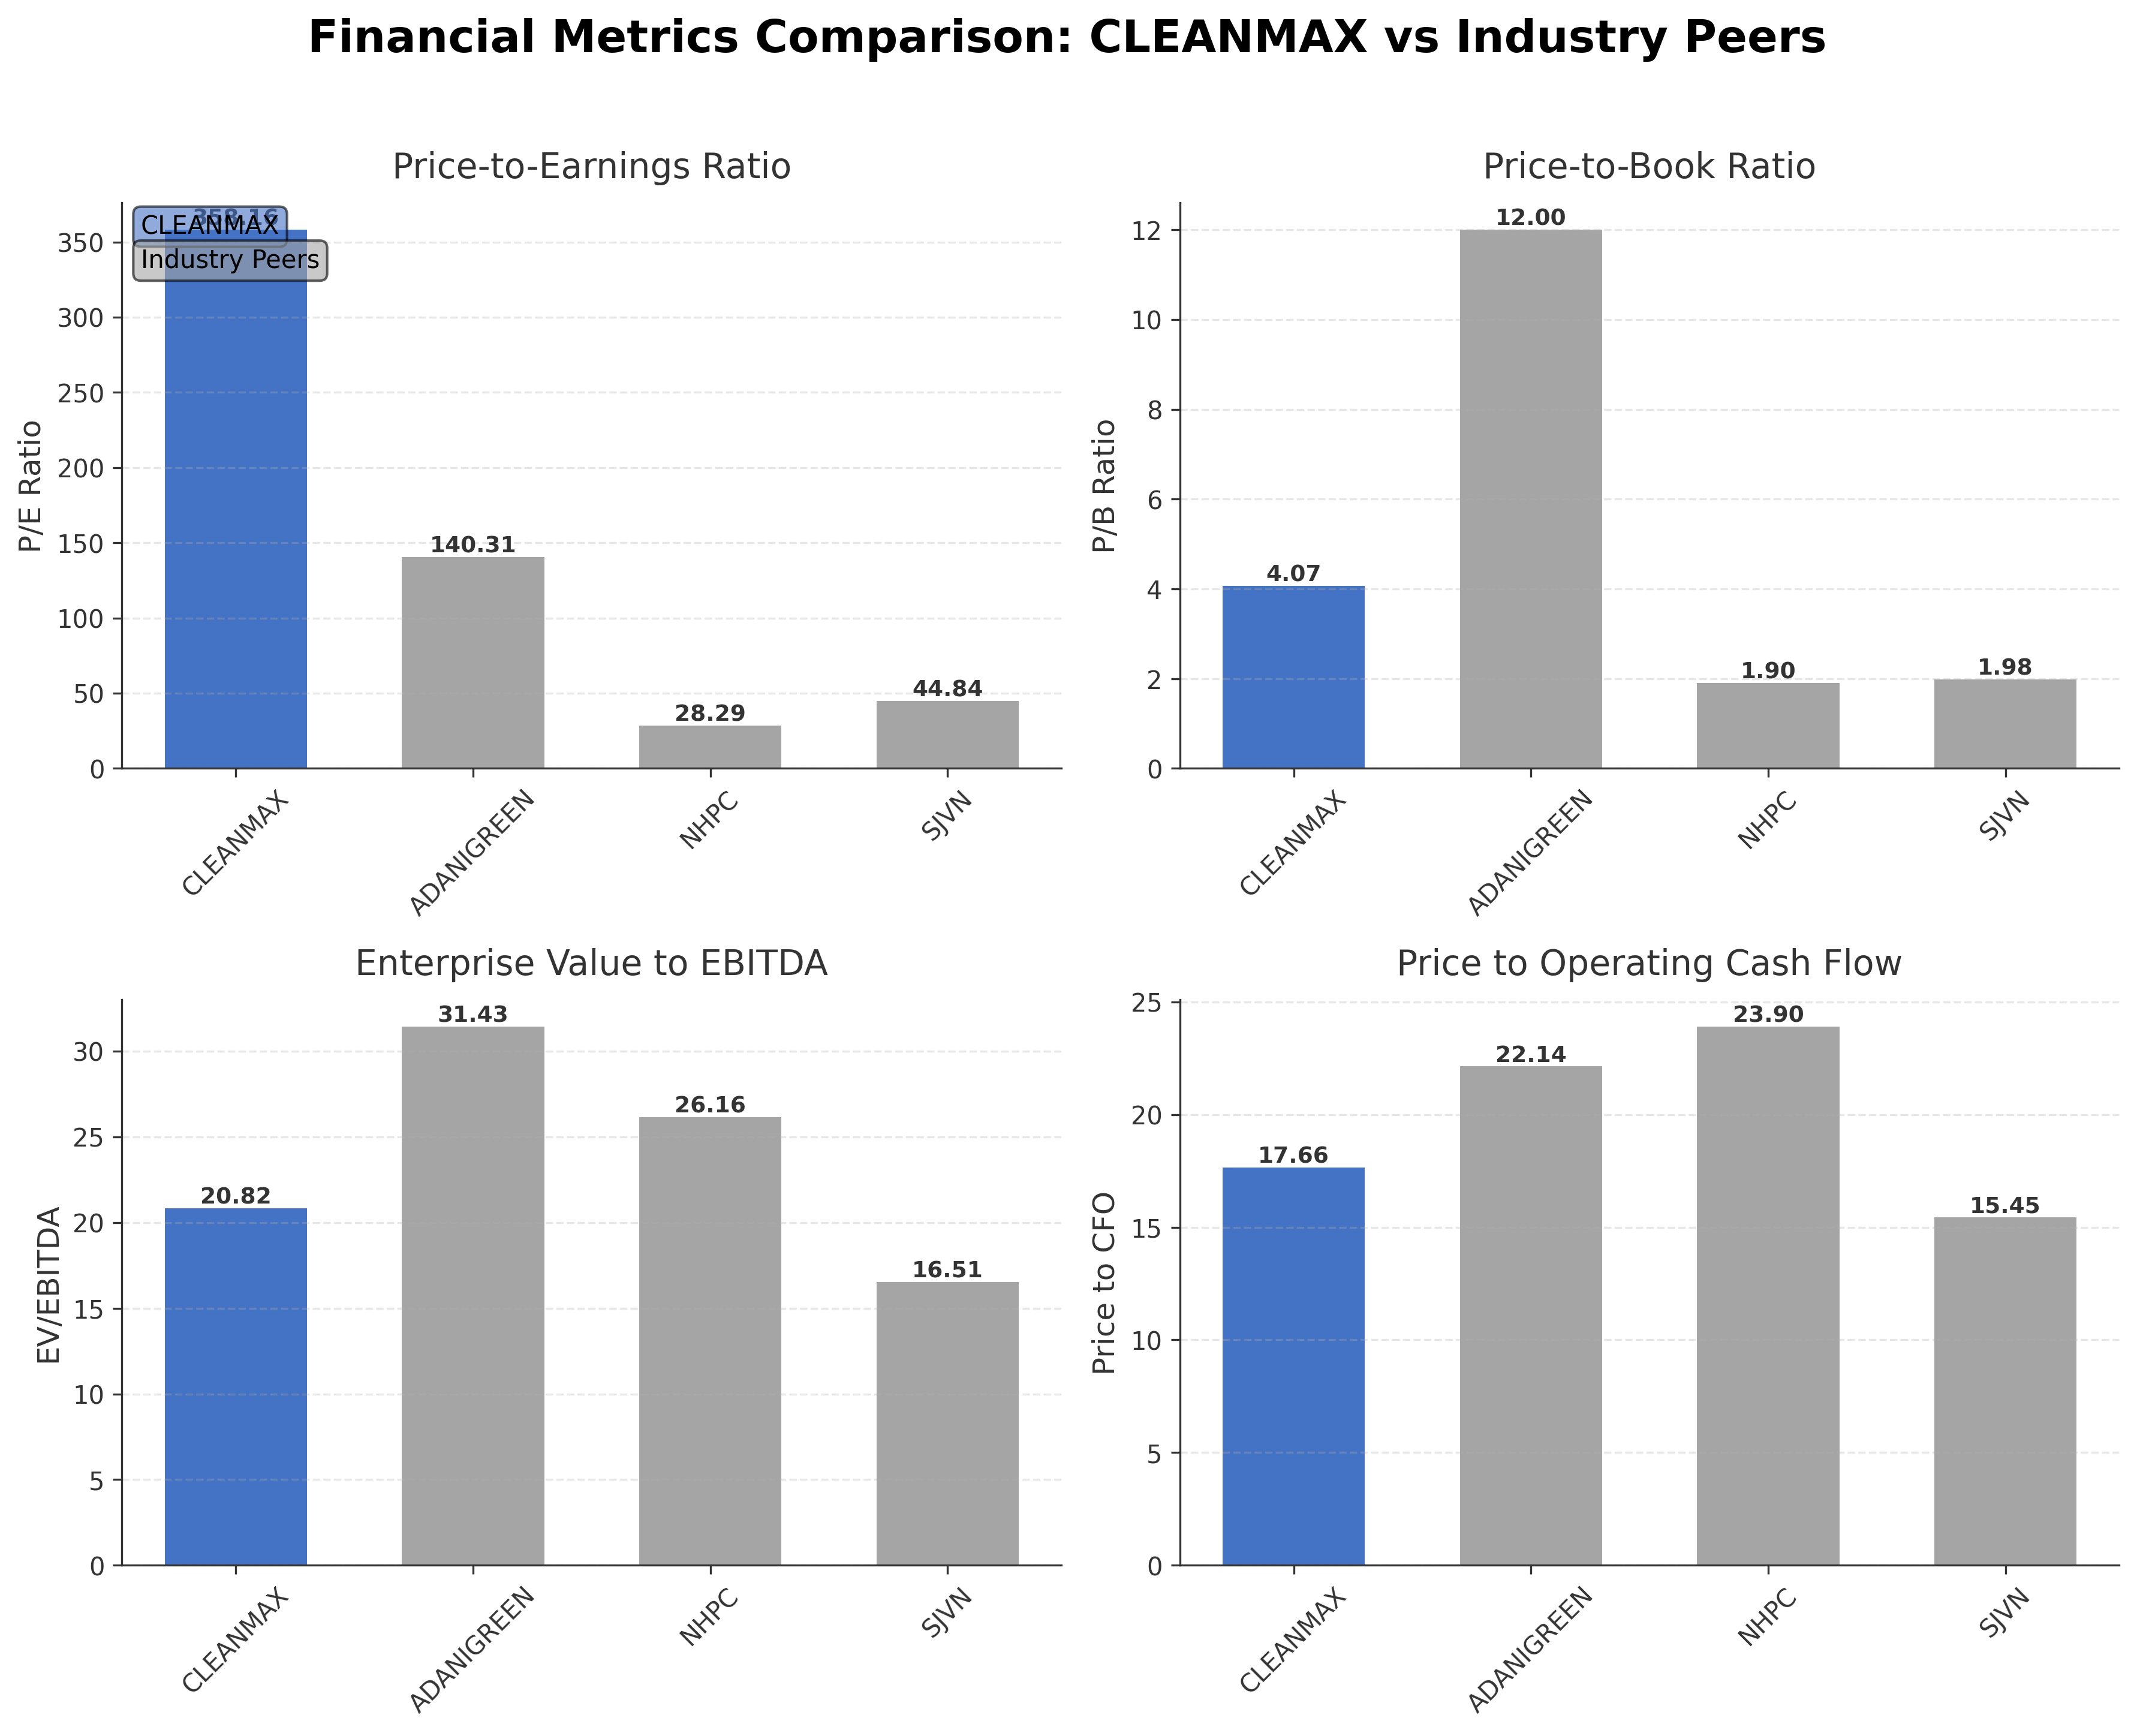
Comparison Analysis: Clean Max Enviro Energy Solutions Limited trades at a significantly higher P/E ratio of 358.16 compared to its peers such as Adani Green (140.31), NHPC (28.29), and SJVN (44.84), reflecting elevated growth expectations or valuation premium. Its price-to-book ratio of 4.07 is moderate relative to Adani Green’s 12.00 but higher than NHPC and SJVN near 1.90-1.98. The EV/EBITDA multiple at 20.82 is lower than Adani Green’s 31.43 but above SJVN’s 16.51 and NHPC’s 26.16, indicating a mid-range valuation on earnings basis. Return on equity is notably lower at 0.01% compared to peers, suggesting limited profitability. Price to CFO at 17.66 is below Adani Green and NHPC, indicating relatively better cash flow valuation. Overall, Clean Max shows premium valuation metrics with modest returns relative to larger, more established peers.
Financial Metrics Comparison with Peers
Financial Statements
Comprehensive financial data including income, balance sheet, and cash flow metrics
Income Statement
| fiscal_date | 2026-03-31 | 2025-03-31 | 2024-03-31 | 2023-03-31 |
|---|---|---|---|---|
| Sales | 18.97B | 14.84B | 13.90B | 9.29B |
| Cost Of Goods | 5.01B | 4.10B | 4.51B | 4.27B |
| Gross Profit | 13.95B | 10.74B | 9.38B | 5.01B |
| Operating Expense Other Operating Expenses | 1.76B | 806.31M | 361.42M | 273.61M |
| Operating Income | 7.52B | 6.00B | 4.86B | 2.65B |
| Non Operating Interest Expense | 7.86B | 6.63B | 4.84B | 2.08B |
| Pretax Income | 1.35B | 597.47M | 61.96M | -161.55M |
| Income Tax | 494.04M | 403.18M | 438.39M | 433.18M |
| Net Income | 855.77M | 194.29M | -376.43M | -594.73M |
| Ebit | 9.21B | 7.23B | 4.90B | 1.92B |
| Ebitda | 13.01B | 10.23B | 7.19B | 3.95B |
| Net Income Continuous Operations | 1.35B | 597.47M | 169.62M | 730.35M |
| Minority Interests | 85.55M | 84.14M | 66.55M | -57.96M |
| Preferred Stock Dividends | 0.00 | 0.00 | 0.00 | 0.00 |
| Operating Expense Selling General And Administrative | N/A | 354.76M | 311.49M | 232.59M |
| Non Operating Interest Income | N/A | 401.24M | 300.70M | 215.49M |
| Eps Basic | N/A | 2.38 | -2.65 | -5.57 |
| Eps Diluted | N/A | 2.38 | -2.65 | -5.57 |
| Basic Shares Outstanding | N/A | 117.08M | 117.08M | 117.08M |
| Diluted Shares Outstanding | N/A | 117.08M | 117.08M | 117.08M |
Data provided by Twelve Data
Balance Sheet
| fiscal_date | 2026-03-31 | 2025-03-31 | 2024-03-31 | 2023-03-31 |
|---|---|---|---|---|
| Cash And Cash Equivalents | 12.02B | 3.29B | 496.17M | 1.13B |
| Accounts Receivable | 2.78B | 1.88B | 2.52B | 1.69B |
| Total Assets | 230.98B | 132.79B | 90.77B | 70.00B |
| Total Liabilities | 175.75B | 100.74B | 68.43B | 55.31B |
| Long Term Debt | 115.62B | 72.25B | 52.46B | 36.47B |
| Shareholders Equity | 55.24B | 32.05B | 22.34B | 14.69B |
Data provided by Twelve Data
Cash Flow Statement
| fiscal_date | 2026-03-31 | 2025-03-31 | 2024-03-31 | 2023-03-31 |
|---|---|---|---|---|
| Operating Activities Net Income | 1.35B | 597.47M | 169.62M | 730.35M |
| Operating Activities Stock Based Compensation | 259.43M | 445.54M | 273.55M | 157.47M |
| Operating Activities Other Non Cash Items | 7.11B | 5.98B | 4.74B | 1.95B |
| Operating Activities Accounts Receivable | -814.25M | 685.79M | -872.95M | -756.04M |
| Operating Activities Other Assets Liabilities | -2.08B | -487.64M | -1.40B | 323.64M |
| Operating Activities Operating Cash Flow | 5.83B | 7.22B | 2.91B | 2.41B |
| Investing Activities Capital Expenditures | 197.50M | 39.11M | 6.39M | 71.71M |
| Investing Activities Net Acquisitions | -415.93M | -545.46M | -515.59M | -532.31M |
| Investing Activities Purchase Of Investments | -414.75M | -2.44B | -2.29B | -550.00K |
| Investing Activities Sale Of Investments | 737.32M | 22.20M | 38.04M | 675.12M |
| Investing Activities Other Investing Activity | -2.17B | -4.44B | 1.75B | -2.24B |
| Investing Activities Investing Cash Flow | -2.07B | -7.36B | -1.02B | -2.03B |
| Financing Activities Long Term Debt Issuance | 58.15B | 27.08B | 31.07B | 28.33B |
| Financing Activities Long Term Debt Payments | -11.99B | -4.17B | -14.36B | -5.99B |
| Financing Activities Short Term Debt Issuance | -540.60M | 489.19M | 7.36M | 500.00M |
| Financing Activities Common Stock Issuance | 14.41B | 5.79B | 5.40B | 110.00K |
| Financing Activities Other Financing Charges | 443.42M | 2.36B | 1.09B | 688.97M |
| Financing Activities Financing Cash Flow | 60.47B | 31.54B | 23.21B | 23.54B |
| End Cash Position | 12.02B | 3.29B | 496.17M | 1.13B |
| Free Cash Flow | -40.23B | -15.06B | -17.80B | -19.18B |
Data provided by Twelve Data
Technical Analysis
Key Insights
- Stock price is in an uptrend, trading above both the 50-day and 200-day moving averages near ₹887.56, indicating bullish momentum.
- Key support levels are identified near ₹900 and ₹850, while resistance is close to the 52-week high at ₹1125.45.
- Price is currently above the 10-day, 50-day, and 200-day moving averages, suggesting sustained upward price action.
- Momentum indicators show RSI in a moderately overbought zone, MACD indicates positive crossover, and Stochastic oscillator confirms upward momentum.
- Daily and weekly timeframes confirm a strong bullish trend, while monthly charts show steady accumulation over the medium term.
- Current technical setup suggests potential continuation of the upward trend, with caution advised near resistance levels around ₹1125.
Trending News
1. Headline: CleanMax Commissions 351.4 MWp Solar Park Project At Bikaner, Rajasthan
Summary: Clean Max Celestial Private Limited, a subsidiary of Clean Max Enviro Energy Solutions Limited, completed the commissioning of 351.4 MWp at Bikaner Solar Park
Sentiment: neutral
2. Headline: India's Clean Max secures $575mn for renewable energy portfolio | MarketScreener
Summary: India’s Clean Max Enviro Energy Solutions Limited has secured around $575mn through a mix of domestic and international financing facilities to support nearly 1 GW of renewable energy projects...
Sentiment: positive
3. Headline: CleanMax secures $575 million for 1 GW India portfolio
Summary: India based CleanMax Enviro Energy Solutions Limited secured around $575 million through domestic and international financing facilities. The funding will support nearly 1 GW of solar and wind projects in Rajasthan and Karnataka. The projects are connected through the central transmission utility network and will supply corporate and industrial customers. Clean Max ...
Sentiment: positive
4. Headline: CleanMax secures $575 million to expand solar and wind projects across India - BioEnergy Times
Summary: Clean Max Enviro Energy Solutions Limited has raised nearly $575 million through a combination of domestic and international financing to strengthen its
Sentiment: positive
5. Headline: Clean Max Enviro: Can Its $575 Mil Fundraise Accelerate 1 GW Renewable Energy Expansion?
Summary: The shares of this small cap company majorly engaged in offering solar, rooftop,and PPA solutions providing renewable energy for both commercial & industrial entities were in focus after the company raised funds for its future expansion plans, to be on track to meet its end goals.
Sentiment: positive
Powered by Brave
Recent Updates
News Summary
As of 2026-05-29. Clean Max Enviro Energy Solutions Limited, through its subsidiary Clean Max Celestial Private Limited, successfully commissioned a 351.4 MWp solar park project at Bikaner, Rajasthan, marking a significant capacity addition to its renewable portfolio. Additionally, the company secured approximately $575 million in combined domestic and international financing to support nearly 1 GW of solar and wind projects in Rajasthan and Karnataka. These projects are connected to the central transmission utility network and primarily serve corporate and industrial customers, underscoring Clean Max’s strategic focus on expanding its footprint in India’s renewable energy market.
News Sentiment
The overall sentiment from recent updates is predominantly positive, driven by the successful commissioning of a large-scale solar project and a substantial $575 million financing round. These developments highlight the company’s growth momentum and ability to secure capital for expansion. The neutral tone in some reports reflects a balanced view on execution risks and market conditions, but the predominant positive news flow supports confidence in Clean Max’s strategic direction and operational capabilities.
Source List
- https://www.saurenergy.com/solar-energy-news/cleanmax-commissions-3514-mwp-solar-park-project-at-bikaner-rajasthan-11882292
- https://solarbytes.info/india-bytes/cleanmax-enviro-energy-solutions-limited-secures-usd-575-million-for-1-gw-india-solar-wind-projects-11881030
Analytical Overview
Analysis Summary
Clean Max Enviro Energy Solutions Limited’s valuation metrics, including a trailing P/E of 358.16 and forward P/E of 127.80, are significantly higher than industry averages, reflecting elevated market expectations for growth. The company’s revenue growth of 13% quarter-over-quarter and positive cash flow trends demonstrate a solid growth trajectory, supported by recent project commissioning and financing. However, the high debt-to-equity ratio of over 300% and a current ratio below 1 indicate financial leverage and liquidity challenges that require monitoring. Sector-specific opportunities include increasing demand for renewable energy in India, driven by regulatory support and corporate sustainability goals, while challenges involve capital intensity and regulatory risks. The company’s positioning within India’s renewable energy market benefits from favorable government policies and growing corporate demand for green energy solutions.
Overall Business and Market Assessment
Supporting Factors: strong operating margins and cash flow generation, successful project execution, and substantial capital raised to fund growth
Risk Factors: high leverage, limited profitability reflected in low ROE, and liquidity constraints indicated by a current ratio below 1
SWOT Analysis
Strengths
- Strong operating margin of 36.02% indicating efficient operations.
- Robust operating cash flow of INR 7.22 billion supporting business activities.
- Successful commissioning of large-scale solar projects expanding capacity.
- Significant recent financing of $575 million to fund growth initiatives.
Weaknesses
- High debt-to-equity ratio exceeding 300% indicating elevated leverage.
- Low return on equity at 0.87% reflecting limited profitability.
- Current ratio below 1 suggesting potential liquidity challenges.
- Trailing P/E ratio of 358.16 indicating expensive valuation.
Opportunities
- Growing demand for renewable energy in India driven by regulatory support.
- Expansion into new geographic markets including Middle East and Southeast Asia.
- Increasing corporate adoption of green energy and sustainability goals.
- Technological advancements in solar and wind power solutions.
Threats
- Regulatory changes impacting renewable energy tariffs and incentives.
- Intense competition in the renewable energy sector affecting margins.
- Macroeconomic factors influencing financing costs and project viability.
- Potential delays or cost overruns in project execution.
Company Description
Clean Max Enviro Energy Solutions Limited is a leading commercial and industrial renewable energy provider specializing in solar, wind, and hybrid power solutions. The company develops, engineers, procures, constructs, operates, and maintains renewable energy projects, including rooftop and ground-mounted solar installations, solar carports, wind farms, and large-scale hybrid farms. It operates through two main segments: Renewable Energy Power Sales, delivering green energy via long-term power purchase agreements, open access projects, and group captive models; and Renewable Energy Services, offering turnkey engineering, procurement, construction, and ongoing maintenance. Clean Max Enviro Energy Solutions Limited supplies renewable energy certificates, supports carbon reduction initiatives, and provides advanced technologies like solar trackers, robotic cleaning systems, and remote monitoring with real-time analytics. Serving diverse sectors such as automotive, pharmaceuticals, information technology, data centers, textiles, and fast-moving consumer goods, it caters to corporate clients across India, the Middle East, Southeast Asia, Thailand, UAE, and Bahrain. Founded in 2010 and headquartered in Mumbai, India, the company enables businesses to achieve sustainability and net-zero goals through flexible financing options including OPEX, CAPEX, and VPPA models.