
Cipla Ltd (CIPLA)
Stock Analysis Report
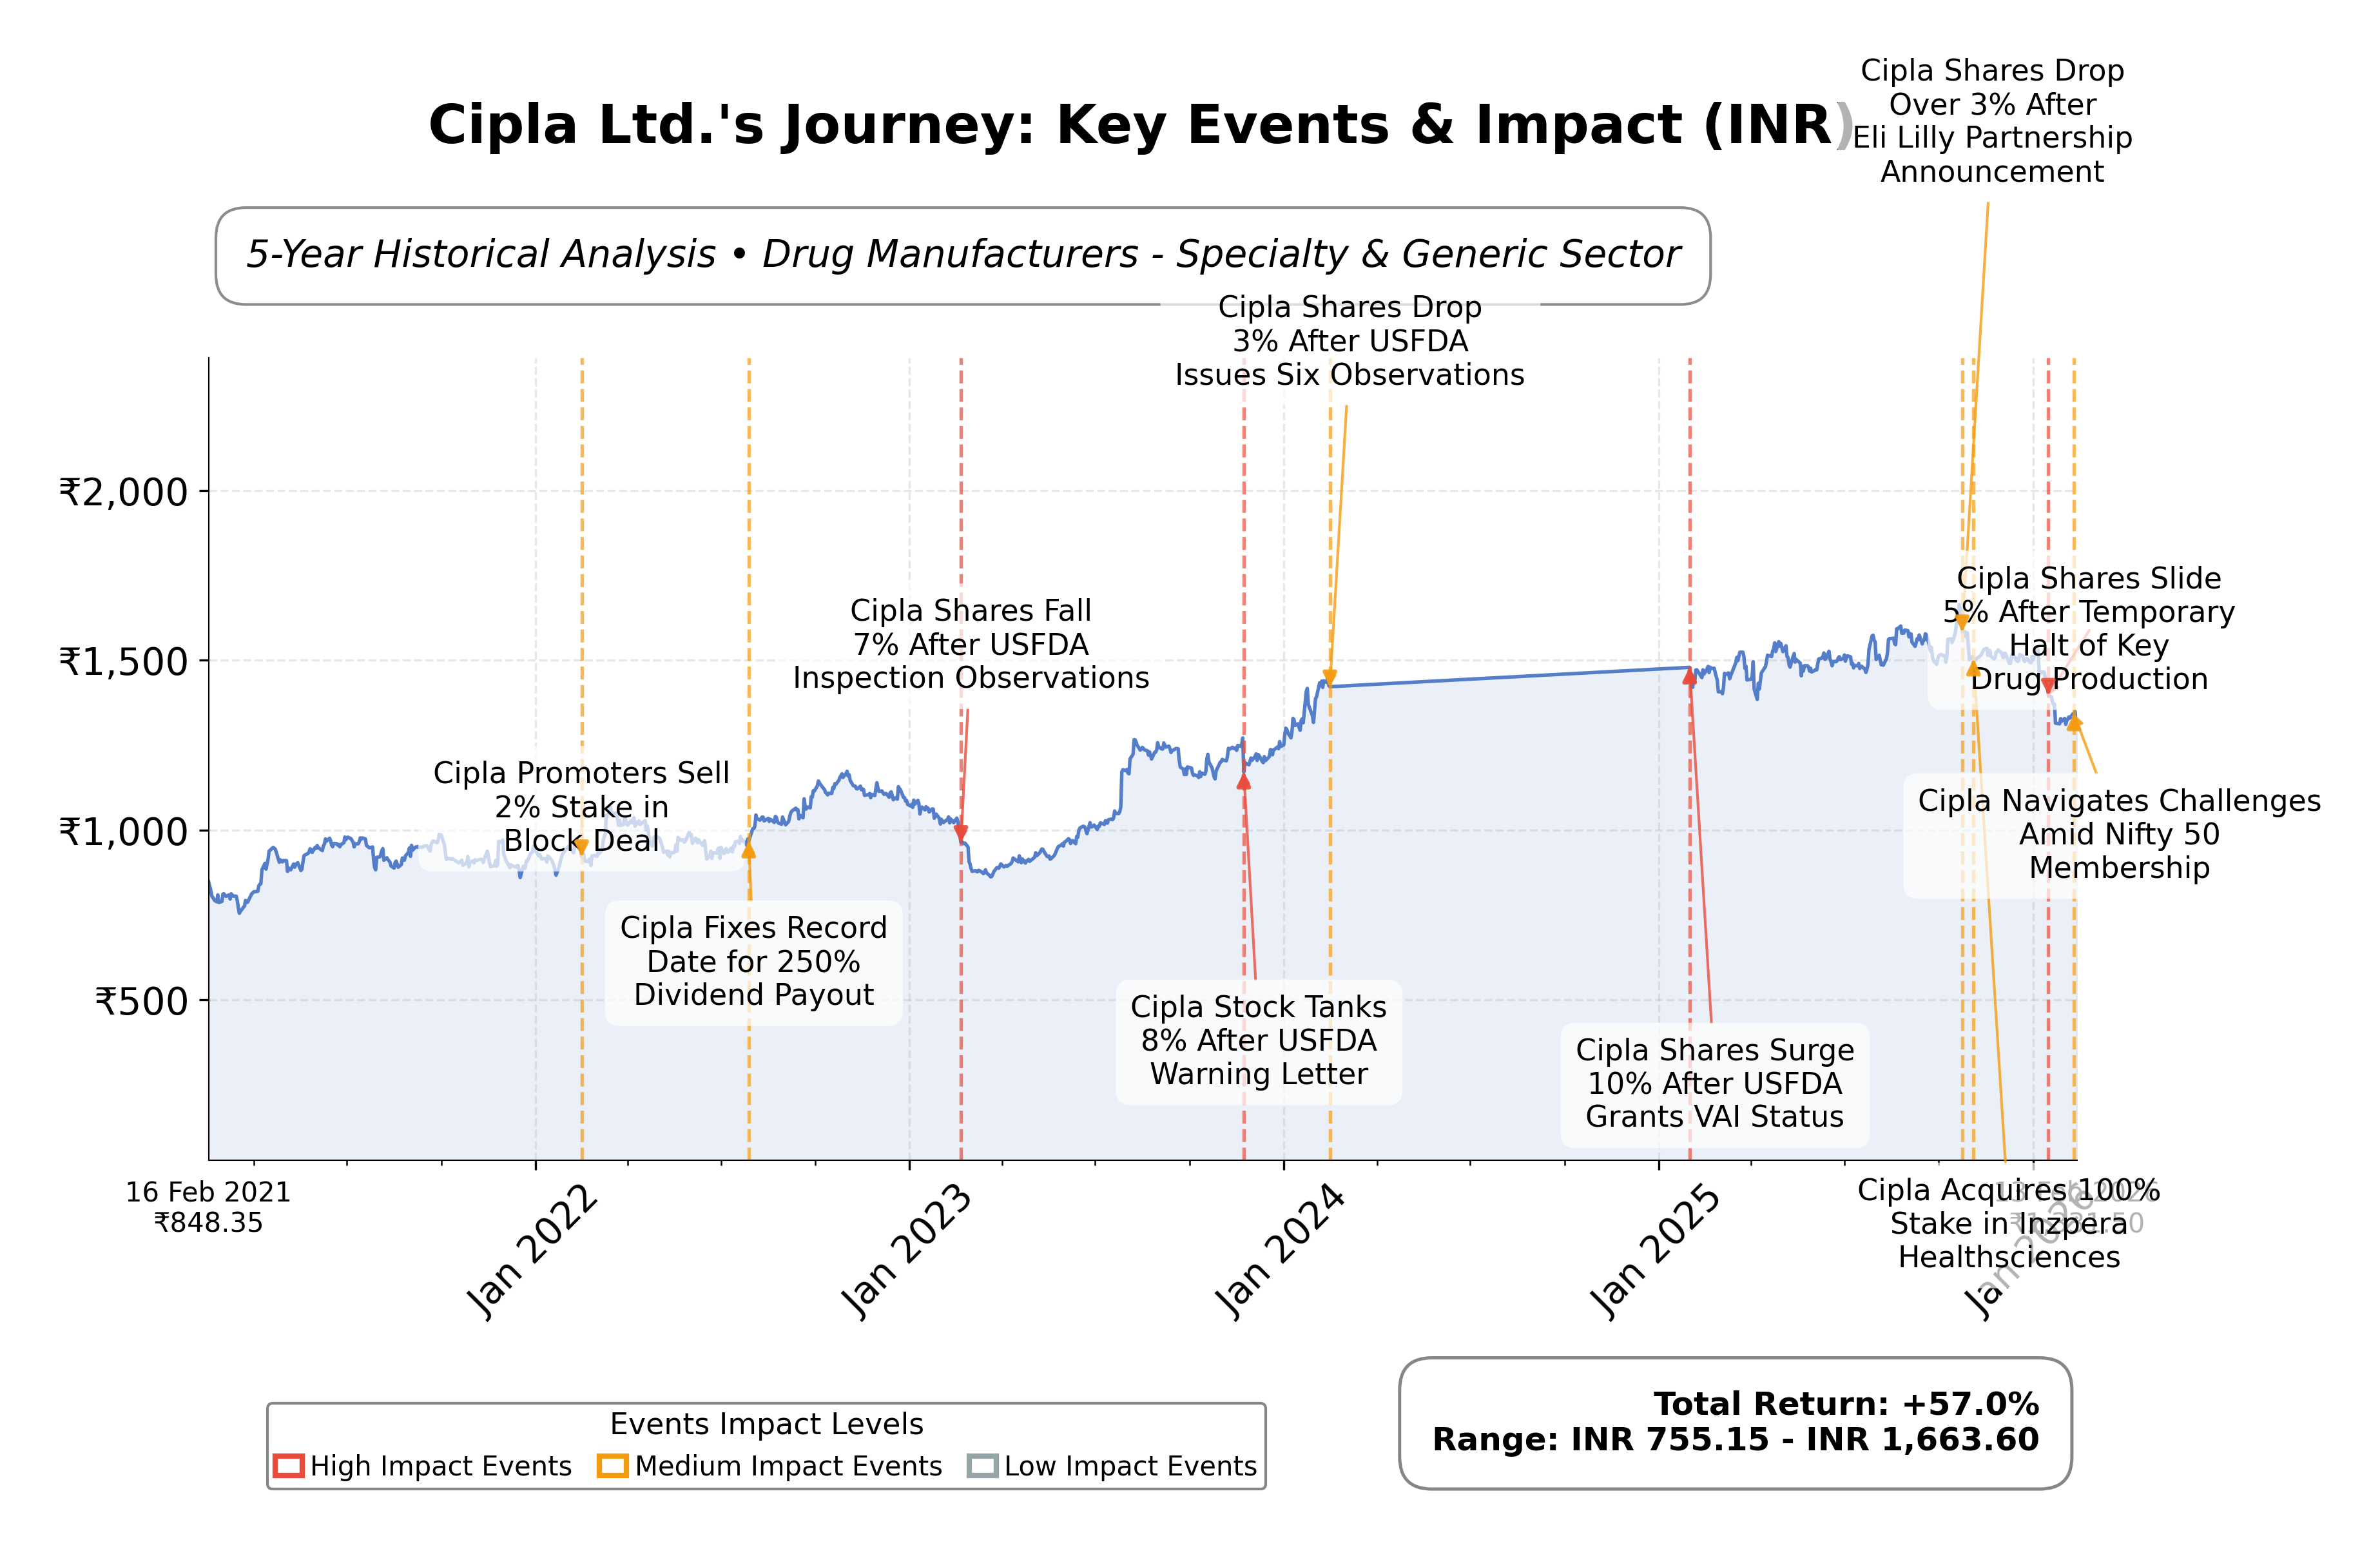
Stock Journey
Key Positives and Key Risks
Pros
- Strong liquidity position with a current ratio of 4.25, indicating solid short-term financial health.
- Market capitalization of ₹1.08 trillion INR places Cipla among the leading pharmaceutical firms in India.
- Trailing P/E ratio of 23.7 aligns closely with the industry average, suggesting fair valuation relative to peers.
Cons
- Quarterly earnings growth declined by 57%, reflecting operational challenges impacting profitability.
- Stock price is trading below the 200-day moving average, signaling bearish technical momentum.
- Regulatory observations at the US subsidiary and supply chain disruptions pose ongoing risks.
Disclosure: This information is for general awareness and does not constitute investment advice
Report Summary
Cipla Ltd. is a leading pharmaceutical company based in India, specializing in the development and manufacturing of generic and branded medicines across various therapeutic areas including respiratory, anti-retroviral, urology, and cardiovascular diseases. Positioned prominently within the healthcare sector, Cipla emphasizes affordable healthcare solutions, serving both domestic and international markets with a strong commitment to innovation and social responsibility.
Financially, Cipla demonstrates solid metrics with a market capitalization exceeding â¹1.07 trillion INR and a trailing P/E ratio of approximately 23.7, closely aligned with the industry average. The company reports a gross margin of about 62%, a profit margin near 16%, and maintains a robust current ratio above 4, indicating strong liquidity. Despite a modest quarterly revenue growth of 1.8%, the company faced a year-over-year decline in earnings growth by 57%, reflecting some operational challenges.
Technically, Ciplaâs stock exhibits bearish momentum shifts as indicated by MACD and RSI readings, with the current price below its 200-day moving average, signaling potential resistance. Recent strategic initiatives include partnerships to enhance manufacturing efficiency, such as the collaboration with Siemens for continuous manufacturing. Notable risks include regulatory inspections and supply chain constraints, while strengths lie in its diversified product portfolio and strong cash flow generation.
In comparison with regional peers like Abbott India, Sun Pharma, and Divi's Laboratories, Cipla maintains a competitive valuation with a lower P/E and EV/EBITDA ratio, suggesting relatively more conservative pricing. However, peers exhibit higher growth multiples, reflecting varying market expectations. Ciplaâs market cap ranks it among the larger pharmaceutical firms in India, though some peers demonstrate stronger momentum and valuation premiums.
Navigating a complex pharmaceutical landscape marked by regulatory scrutiny and competitive pressures, Cipla stands at a pivotal juncture balancing innovation and operational efficiency. Recent achievements in manufacturing modernization contrast with challenges such as profit margin pressures and market volatility. The companyâs strategic choices and market conditions will significantly influence its trajectory, with potential implications for its valuation and market positioning. Observers may find it prudent to monitor developments closely, considering the balance of strengths and challenges presented.
Company and Industry Overview
Company Basics
Price Performance
Company Size
Shareholding Pattern
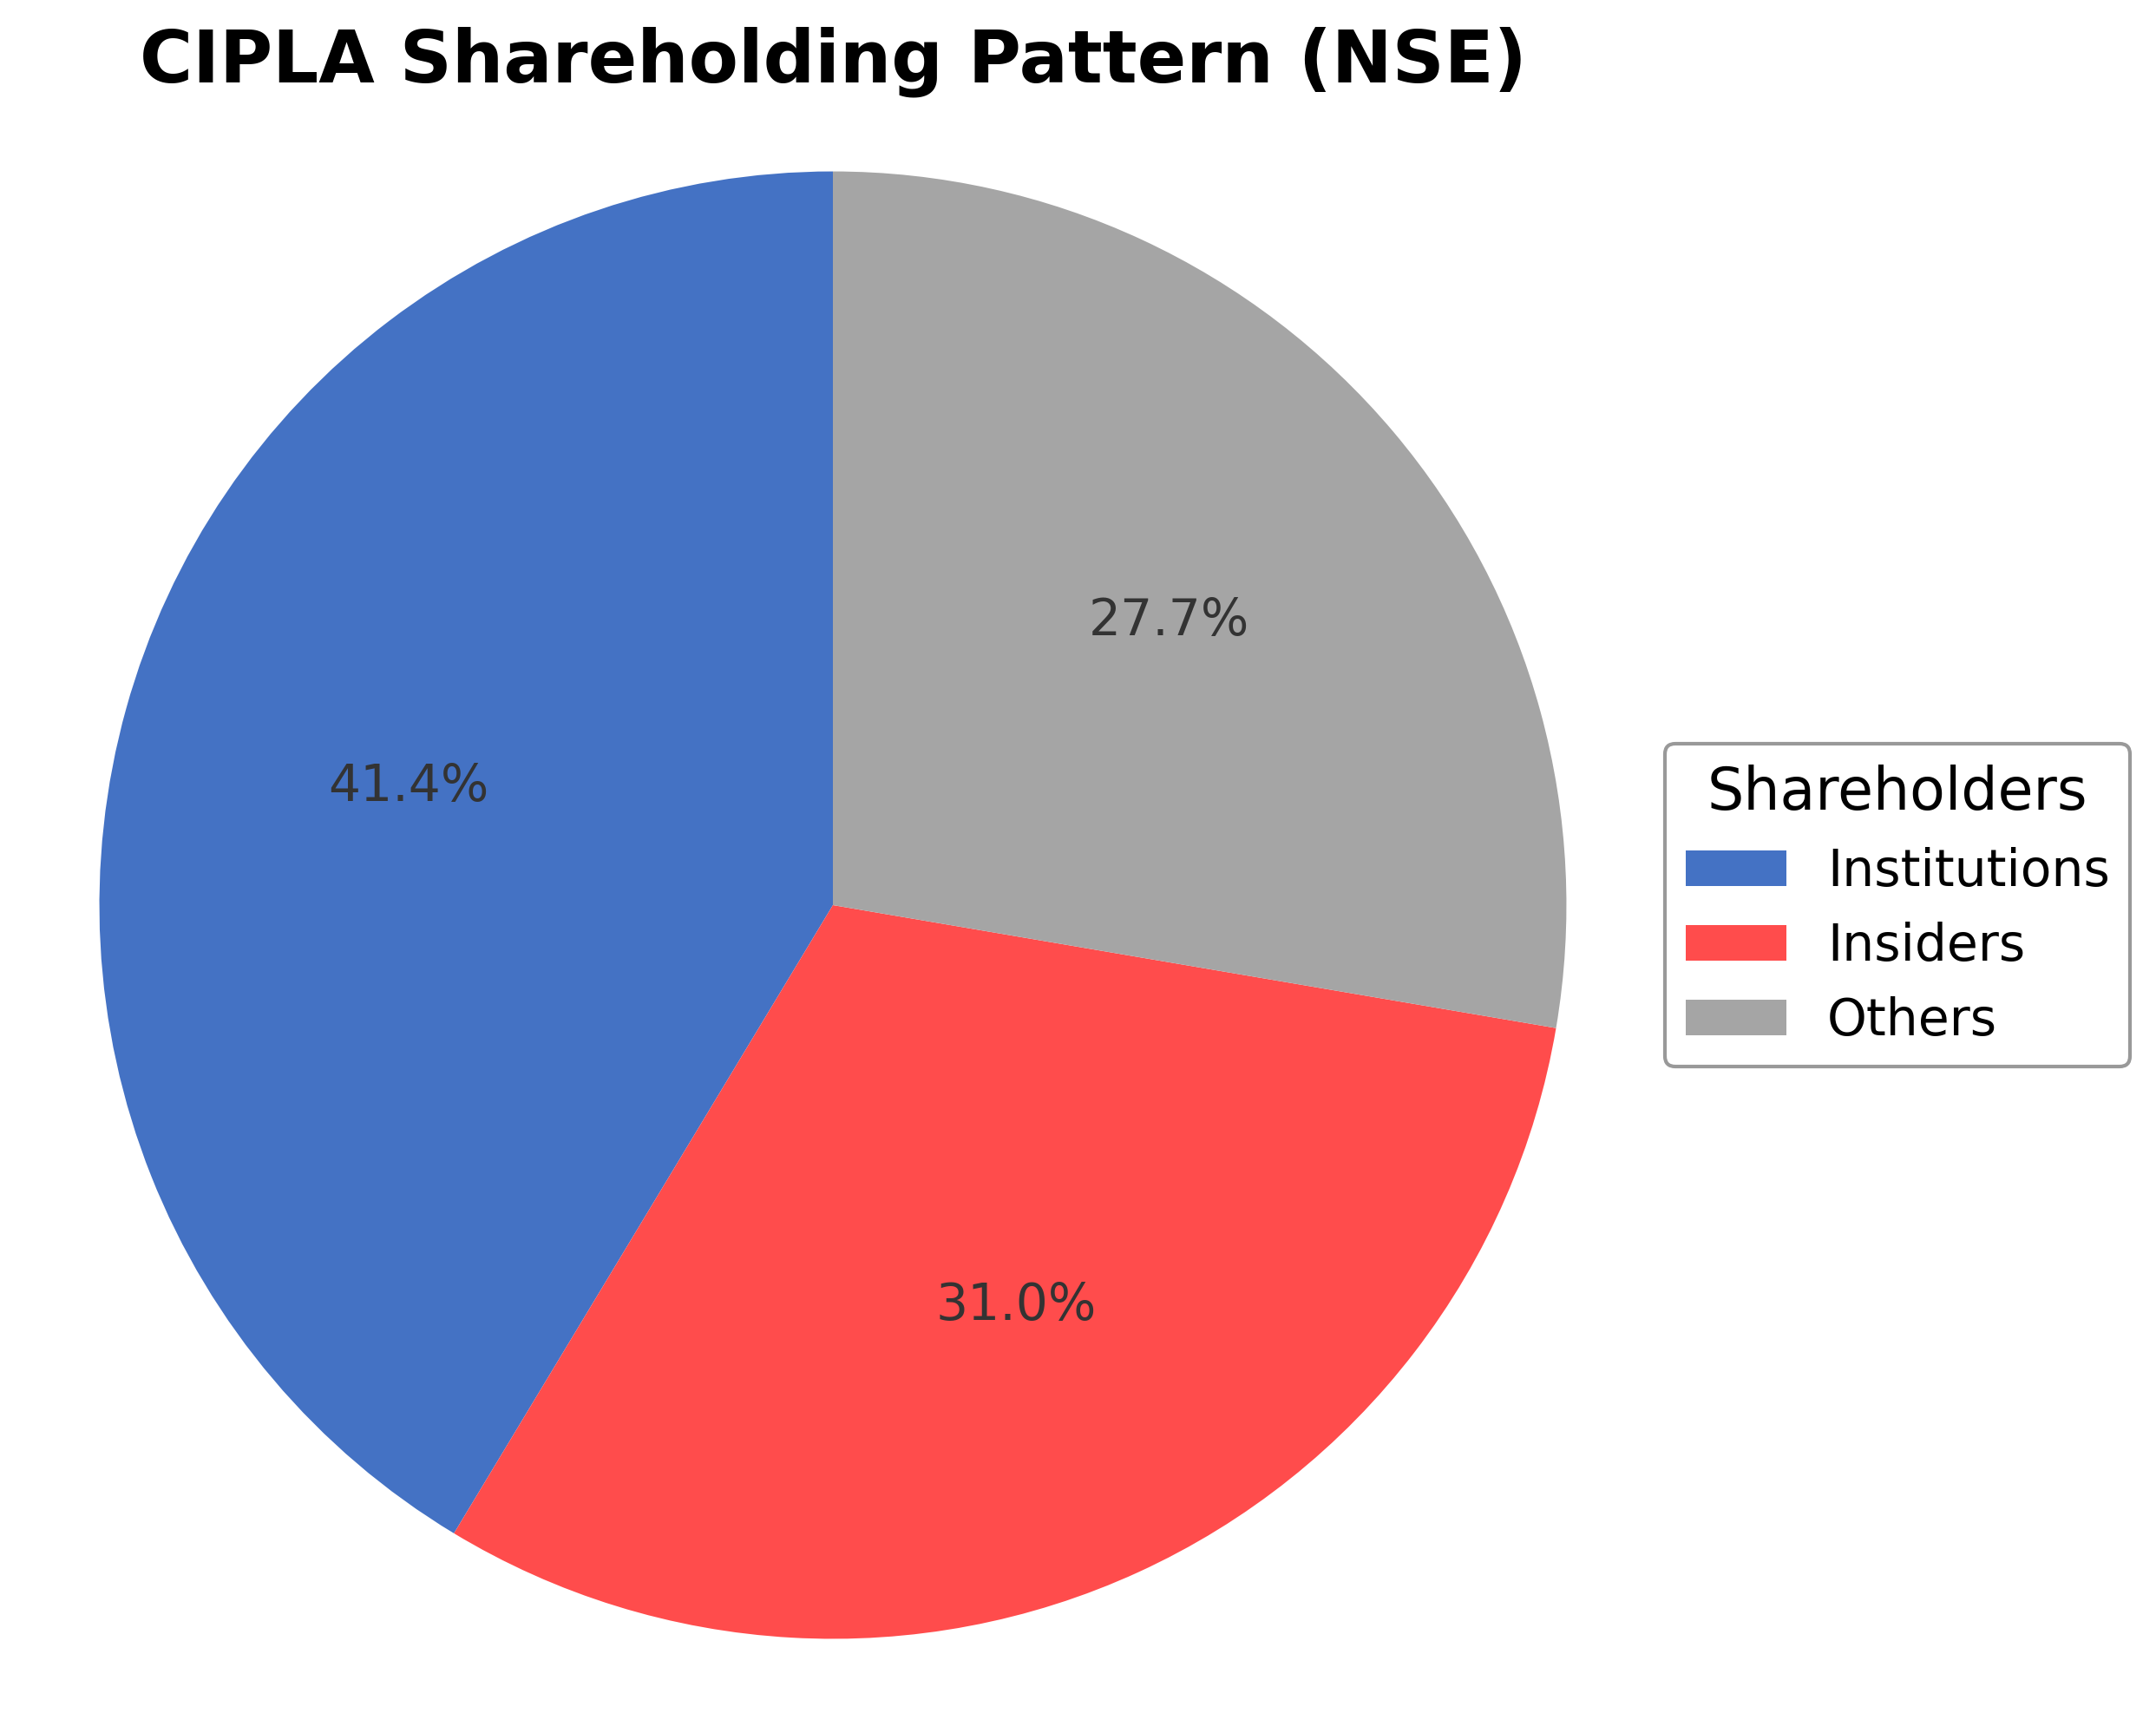
Cipla Ltd.'s ownership structure comprises approximately 30.96% held by insiders including executives and board members, 41.36% by institutional investors such as mutual funds and pension funds, and the remaining 27.68% by public and other shareholders. Over the past 12-24 months, institutional holdings have shown moderate accumulation, reflecting sustained interest from major asset managers. Prominent institutional investors have adjusted positions in line with market conditions, indicating a balanced sentiment. This shareholding pattern suggests stable governance with significant institutional oversight, potentially influencing strategic decisions and corporate actions. The company's position within the Indian pharmaceutical industry remains strong, supported by its diversified portfolio and expanding global footprint.
Sector and Industry Analysis
The pharmaceutical sector, within which Cipla Ltd. operates, is a substantial and rapidly evolving global industry characterized by significant market size and steady growth. Globally, the pharmaceutical market is valued at over $1.5 trillion, with emerging markets like India playing an increasingly pivotal role due to their expanding healthcare infrastructure and growing middle-class populations. India’s pharmaceutical sector is among the largest worldwide by volume and is projected to grow at a CAGR of approximately 10-12% over the next five years, driven by rising demand for generic medicines, increased healthcare spending, and government initiatives to improve access to affordable drugs. Key players in this sector include multinational corporations such as Pfizer, Novartis, and Roche, alongside Indian giants like Sun Pharmaceutical Industries, Dr. Reddy’s Laboratories, and Cipla itself, which is a leading entity with a market capitalization exceeding ₹1 trillion.
Industry trends reflect a dynamic shift towards biotechnology, biosimilars, and personalized medicine, alongside traditional generic drug manufacturing. Advances in digital health technologies, including AI-driven drug discovery and telemedicine, are transforming R&D and patient engagement paradigms. Consumer behavior is increasingly influenced by demand for cost-effective, high-quality generics and specialty drugs, particularly in chronic disease management. Emerging opportunities lie in biosimilars, vaccine development, and expanding into underserved therapeutic areas such as oncology and rare diseases. Additionally, the rise of e-pharmacies and digital distribution channels is reshaping pharmaceutical supply chains and market access strategies.
The regulatory landscape in the pharmaceutical industry is complex and stringent, governed by agencies such as India’s Central Drugs Standard Control Organization (CDSCO), the U.S. FDA, and the European Medicines Agency (EMA). Compliance with Good Manufacturing Practices (GMP), patent laws, and pricing controls under India’s Drug Price Control Order (DPCO) significantly impact operational and strategic decisions. Recent regulatory emphasis on drug safety, clinical trial transparency, and faster approval pathways for generics and biosimilars has created both challenges and opportunities. Policy initiatives like the Indian government’s push for “Make in India” and increased healthcare insurance coverage are also influencing market dynamics and investment flows.
Competitive dynamics in the pharmaceutical industry are characterized by high fragmentation with numerous domestic and international players competing on innovation, cost efficiency, and market reach. Barriers to entry include substantial capital requirements for R&D, regulatory approvals, and establishing robust manufacturing and distribution networks. Cipla’s competitive positioning benefits from its diversified product portfolio, strong presence in respiratory, oncology, and antiretroviral segments, and strategic international footprint. The company operates in a moderately consolidated market where scale, regulatory compliance, and intellectual property management are critical for sustaining competitive advantage. Price competition, patent expiries, and evolving healthcare policies continue to shape the competitive landscape, compelling firms to innovate and optimize operational efficiencies.
Note: Analysis synthesized from industry research, market reports, and regulatory filings. Information is subject to change based on market conditions.
Illustrative Scenario Analysis
DCF Assumptions:
Method: Two-Stage EPS-Priority Model
Financials
Peer Analysis
| Company Name | Market Cap | P/E Ratio | P/B Ratio | EV/EBITDA | Price to CFO |
|---|---|---|---|---|---|
| Cipla Ltd. | ₹1.08T | 23.7 | 3.27 | 15.31 | 19.5 |
| Abbott India Ltd. | ₹562.26B | 37.26 | 13.26 | 30.73 | 53.46 |
| Laurus Labs Ltd. | ₹545.68B | 64.95 | 11.36 | 34.23 | 132.22 |
| Sun Pharmaceutical Industries Ltd. | ₹4.07T | 37.32 | 5.23 | 24.09 | 36.74 |
| Divi's Laboratories Ltd. | ₹1.64T | 66.23 | 10.65 | 47.84 | 83.25 |
| Mankind Pharma Ltd. | ₹850.58B | 47.65 | 5.56 | 27.89 | 32.1 |
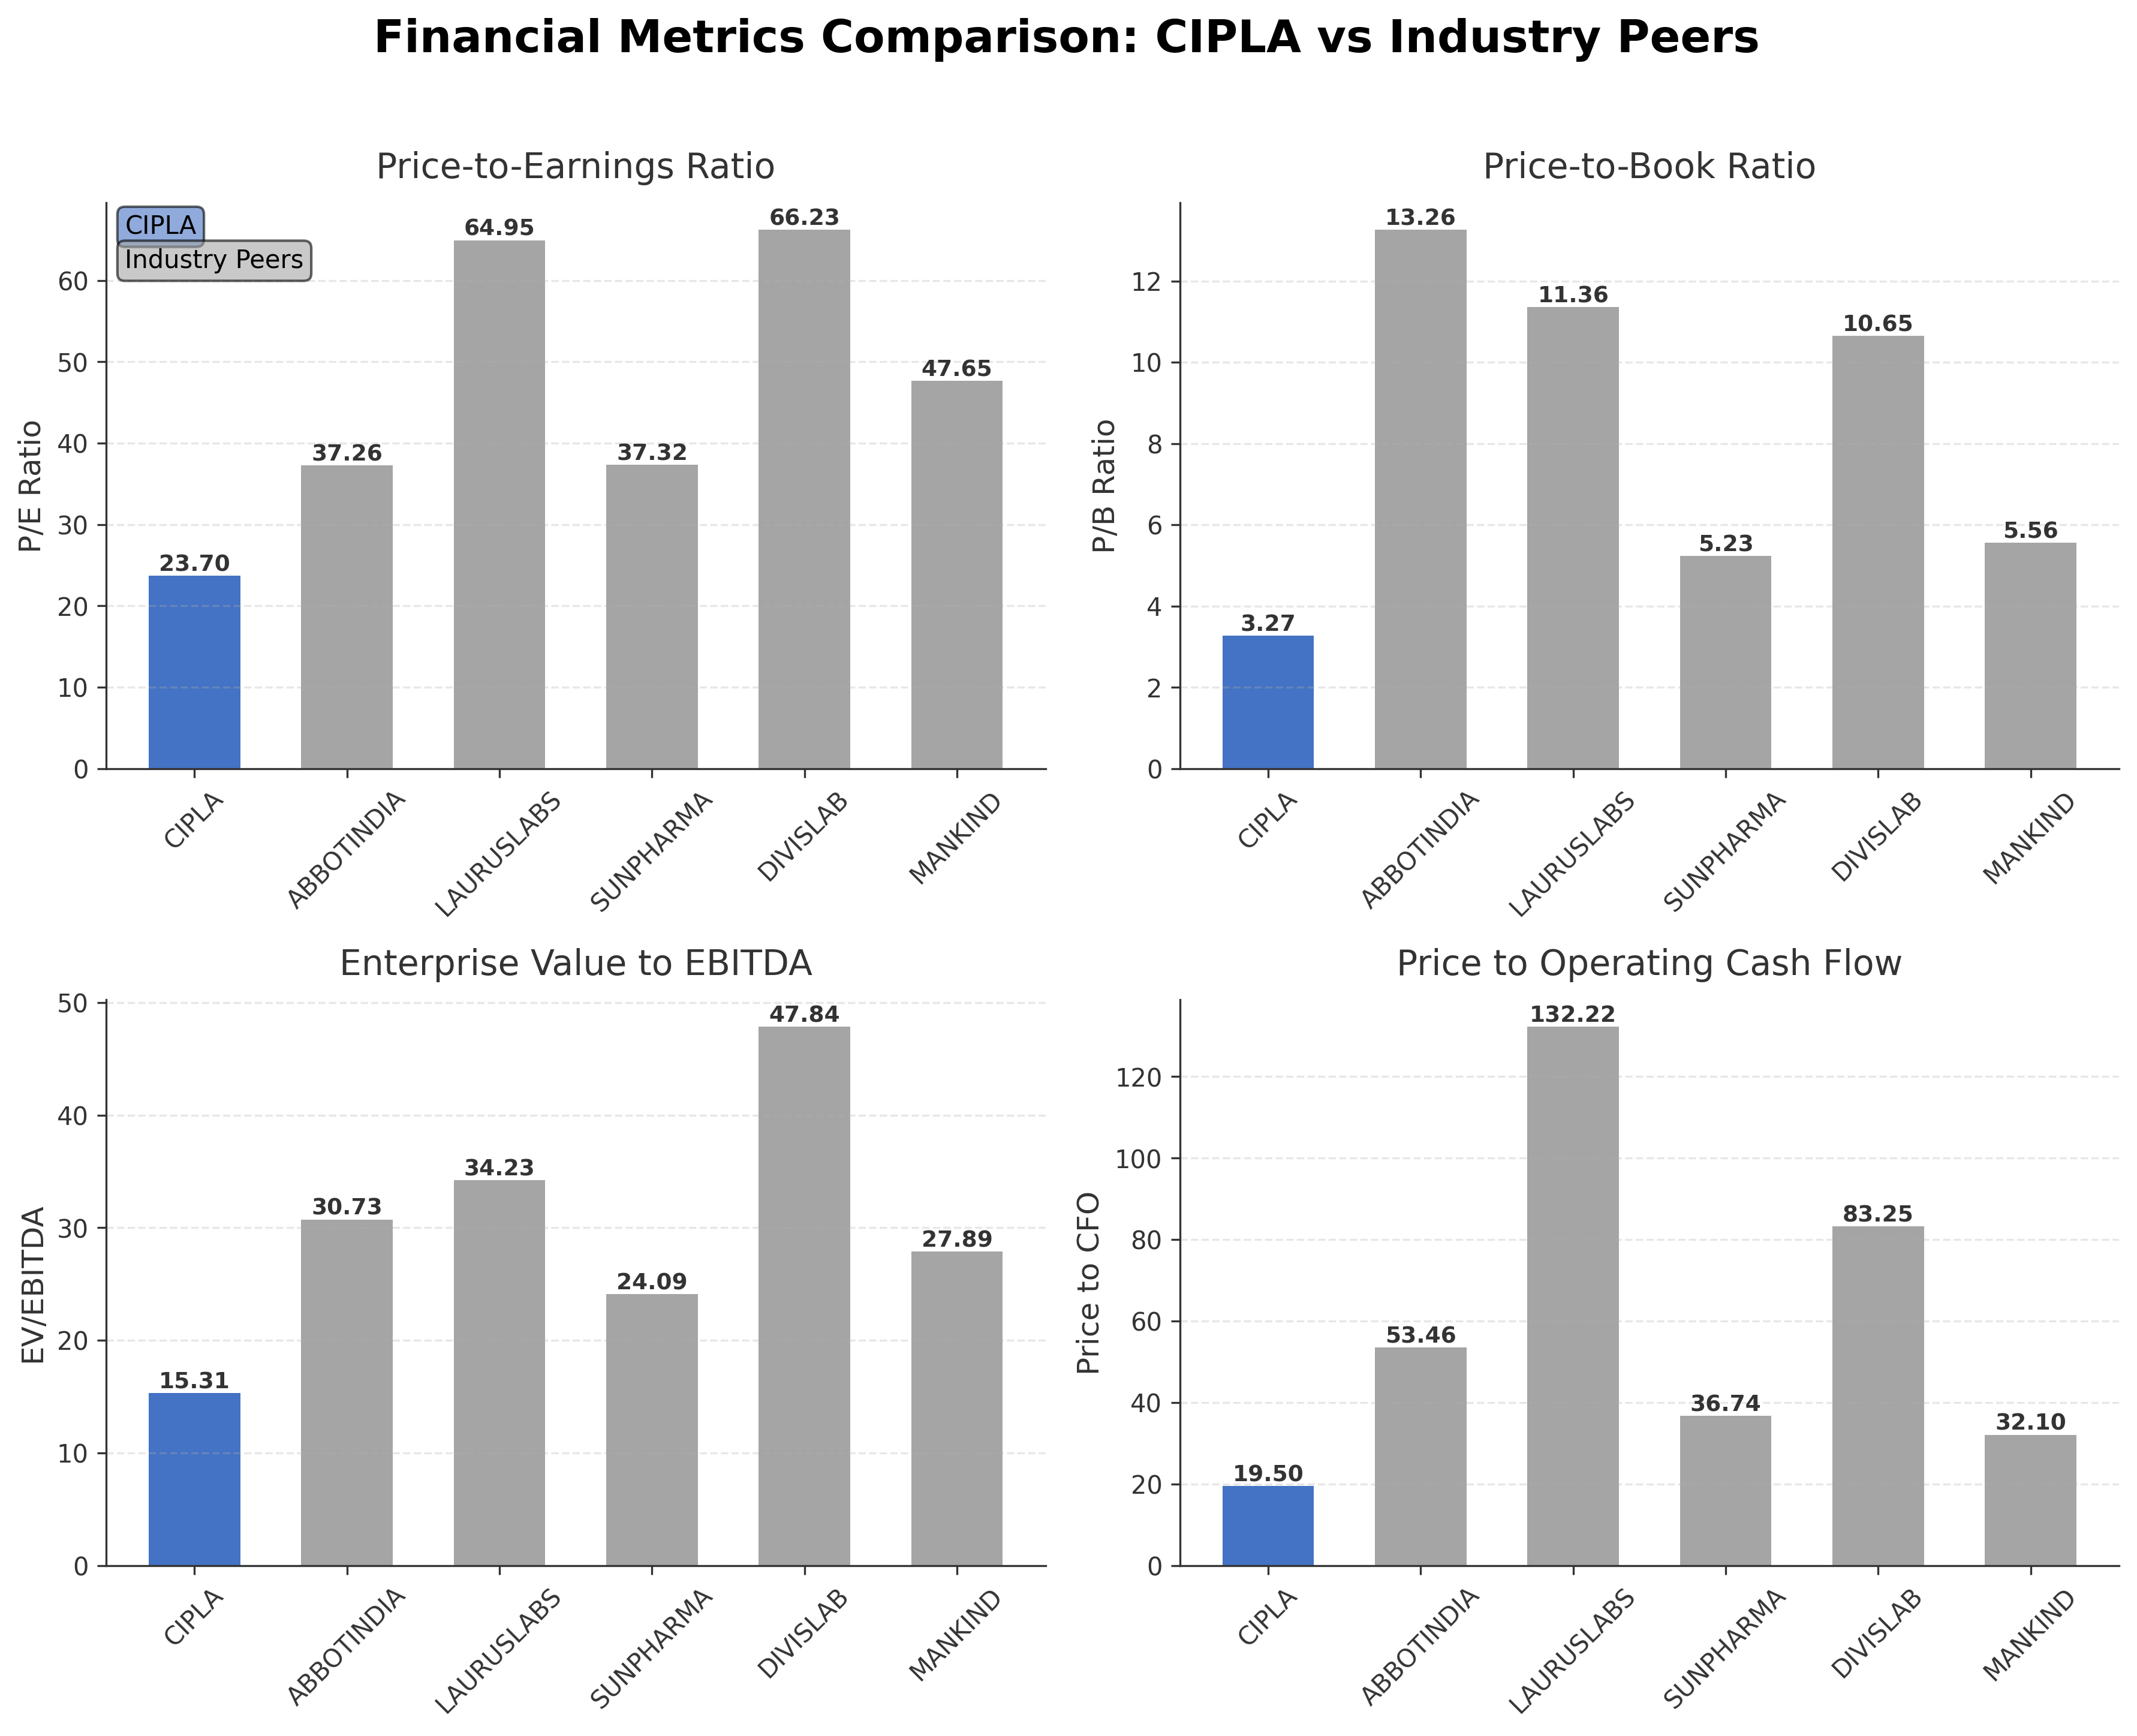
Comparison Analysis: Cipla Ltd. presents a more moderate valuation profile compared to its Indian pharmaceutical peers, with a P/E ratio of 23.70 and EV/EBITDA of 15.31, both lower than those of Abbott India, Sun Pharma, and Divi's Laboratories, which exhibit higher multiples reflecting growth expectations. Cipla's price-to-book ratio at 3.27 is also more conservative relative to peers with ratios exceeding 5. The price to CFO ratio of 19.50 suggests relatively stronger cash flow valuation compared to several peers with significantly higher figures. Market capitalization places Cipla among the larger firms, though Sun Pharma leads substantially. Overall, Cipla's valuation metrics indicate a more measured market stance amid a competitive industry landscape.
Financial Metrics Comparison with Peers
Financial Statements
Comprehensive financial data including income, balance sheet, and cash flow metrics
Income Statement
| fiscal_date | 2025-03-31 | 2024-03-31 | 2023-03-31 | 2022-03-31 | 2021-03-31 |
|---|---|---|---|---|---|
| Sales | 271.45B | 254.47B | 224.73B | 216.23B | 189.89B |
| Cost Of Goods | 97.63B | 95.92B | 89.61B | 92.30B | 80.20B |
| Gross Profit | 173.83B | 158.54B | 135.13B | 123.94B | 109.68B |
| Operating Expense Research And Development | 3.76B | 4.30B | 3.85B | 2.66B | 1.33B |
| Operating Expense Selling General And Administrative | 29.55B | 27.84B | 26.22B | 24.82B | 20.04B |
| Operating Expense Other Operating Expenses | 23.51B | 22.41B | 18.19B | 16.06B | 14.12B |
| Operating Income | 61.44B | 53.69B | 40.18B | 35.70B | 32.51B |
| Non Operating Interest Income | 2.64B | 2.20B | 1.62B | 796.20M | 472.60M |
| Non Operating Interest Expense | 440.20M | 711.30M | 945.60M | 1.05B | 1.53B |
| Pretax Income | 68.21B | 57.02B | 40.38B | 34.93B | 32.90B |
| Income Tax | 15.30B | 15.47B | 12.03B | 9.34B | 8.89B |
| Net Income | 52.69B | 41.54B | 28.33B | 25.47B | 23.89B |
| Eps Basic | 65.29 | 51.05 | 34.72 | 31.20 | 29.82 |
| Eps Diluted | 65.24 | 51.01 | 34.69 | 31.17 | 29.79 |
| Basic Shares Outstanding | 807.55M | 807.29M | 807.01M | 806.67M | 806.36M |
| Diluted Shares Outstanding | 807.55M | 807.29M | 807.01M | 806.67M | 806.36M |
| Ebit | 68.65B | 57.73B | 41.33B | 35.98B | 34.43B |
| Ebitda | 74.32B | 66.93B | 51.15B | 47.14B | 43.78B |
| Net Income Continuous Operations | 68.21B | 58.97B | 42.21B | 36.75B | 32.90B |
| Minority Interests | 33.20M | -321.70M | -309.80M | -299.00M | 163.60M |
| Preferred Stock Dividends | 0.00 | 0.00 | 0.00 | 0.00 | 0.00 |
Data provided by Twelve Data
Balance Sheet
| fiscal_date | 2025-03-31 | 2024-09-30 | 2024-03-31 | 2023-09-30 | 2023-03-31 |
|---|---|---|---|---|---|
| Cash And Cash Equivalents | 5.89B | 7.98B | 6.40B | 8.00B | 6.28B |
| Accounts Receivable | 55.06B | 55.88B | 47.71B | 48.50B | 40.57B |
| Total Assets | 373.87B | 346.55B | 327.18B | 313.77B | 294.63B |
| Total Liabilities | 60.98B | 61.99B | 59.15B | 62.82B | 57.50B |
| Long Term Debt | 2.52B | 2.18B | 2.25B | 2.16B | 2.09B |
| Shareholders Equity | 312.89B | 284.56B | 268.02B | 250.95B | 237.14B |
Data provided by Twelve Data
Cash Flow Statement
| fiscal_date | 2025-03-31 | 2024-03-31 | 2023-03-31 | 2022-03-31 | 2021-03-31 |
|---|---|---|---|---|---|
| Operating Activities Net Income | 68.21B | 58.97B | 42.21B | 36.75B | 32.90B |
| Operating Activities Stock Based Compensation | 473.40M | 461.60M | 390.40M | 241.20M | 195.40M |
| Operating Activities Other Non Cash Items | -2.28B | -1.62B | -696.60M | 153.70M | 986.10M |
| Operating Activities Accounts Receivable | -8.02B | -9.07B | -6.52B | 813.60M | 4.23B |
| Operating Activities Other Assets Liabilities | -3.23B | -618.60M | 1.11B | -6.21B | -2.54B |
| Operating Activities Operating Cash Flow | 55.16B | 48.13B | 36.49B | 31.75B | 35.77B |
| Investing Activities Capital Expenditures | -11.37B | -10.64B | -8.12B | -5.28B | -6.08B |
| Investing Activities Net Intangibles | -3.77B | -2.51B | -3.23B | -1.53B | -1.84B |
| Investing Activities Net Acquisitions | -2.36B | -2.22B | -251.30M | -180.20M | -110.50M |
| Investing Activities Purchase Of Investments | -22.00B | -16.97B | -13.51B | -14.17B | -16.62B |
| Investing Activities Sale Of Investments | 0.00 | 6.00M | 0.00 | 1.71B | N/A |
| Investing Activities Other Investing Activity | 256.30M | 466.00M | 89.40M | 263.40M | 147.70M |
| Investing Activities Investing Cash Flow | -35.47B | -29.36B | -21.79B | -17.66B | -22.66B |
| Financing Activities Long Term Debt Issuance | 119.60M | N/A | N/A | 0.00 | 704.90M |
| Financing Activities Long Term Debt Payments | -980.10M | -3.00B | -3.52B | -10.41B | -10.22B |
| Financing Activities Short Term Debt Issuance | -980.10M | -3.00B | -3.08B | 349.80M | -418.70M |
| Financing Activities Common Stock Issuance | 500.00K | 400.00K | 700.00K | -27.00M | -359.50M |
| Financing Activities Common Dividends | -10.50B | -6.86B | -4.04B | -4.03B | N/A |
| Financing Activities Other Financing Charges | -403.50M | -719.90M | -42.70M | -197.50M | -53.60M |
| Financing Activities Financing Cash Flow | -12.74B | -13.59B | -10.68B | -14.32B | -10.34B |
| End Cash Position | 5.43B | 5.12B | 5.61B | 6.58B | 7.90B |
| Free Cash Flow | 34.57B | 27.85B | 20.55B | 26.25B | 29.36B |
Data provided by Twelve Data
Technical Analysis
Key Insights
- The current trend direction for Cipla Ltd. shows bearish momentum with price action below the 200-day moving average, indicating potential downward pressure.
- Key support levels are identified near ₹1280, close to the 52-week low, while resistance is observed around ₹1425 and ₹1500, corresponding to the 50-day and 200-day moving averages respectively.
- The stock price is trading below the 50-day and 200-day moving averages but slightly above the 10-day moving average, suggesting short-term consolidation within a longer-term downtrend.
- Momentum indicators such as RSI are signaling bearish conditions with values below neutral thresholds, while MACD reflects a negative crossover, reinforcing the downward trend.
- Multi-timeframe analysis across daily, weekly, and monthly charts consistently shows weakening momentum and lower highs, supporting a cautious technical outlook.
- Potential market scenarios include continued consolidation near support levels or further declines if resistance levels hold, with volatility likely influenced by broader sector and market dynamics.
Trending News
1. Headline: Cipla Ltd. Technical Momentum Shifts Signal Bearish Outlook Amid Market Underperformance
Summary: Cipla Ltd., a key player in the Pharmaceuticals & Biotechnology sector, has experienced a notable shift in its technical momentum, moving from a mildly bearish stance to a more pronounced bearish trend. This change is underscored by a combination of technical indicators including MACD and RSI, reflecting market underperformance and increased selling pressure.
Sentiment: Neutral
2. Headline: Cipla Share Price Highlights: Cipla Stock Price History - The Economic Times
Summary: Stay informed with the Cipla Stock Liveblog, your comprehensive resource for real-time updates and in-depth analysis of a leading stock. Get the latest details on Cipla, including last traded price, market capitalization, volume, price-to-earnings ratio, and earnings performance.
Sentiment: Neutral
3. Headline: Cipla Ltd. is Rated Sell by MarketsMOJO
Summary: Cipla Ltd. is rated 'Sell' by MarketsMOJO as of early 2026, reflecting current financial metrics and market positioning. The analysis provides an updated view on the company's performance and outlook, highlighting challenges and valuation considerations.
Sentiment: Neutral
4. Headline: Cipla Ltd: Navigating Challenges Amidst Nifty 50 Membership and Institutional Shifts
Summary: Cipla Ltd., a prominent constituent of the Nifty 50 index, has experienced a downgrade in its mojo grade from Hold to Sell. Despite short-term share price gains, longer-term challenges persist, including shifts in institutional holdings and market sentiment.
Sentiment: Negative
5. Headline: Cipla's US Subsidiary Gets 2 Observations in FDA Inspection
Summary: Cipla Limited's US subsidiary, InvaGen Pharmaceuticals, received two observations during a USFDA Pre-Approval Inspection. The company has committed to addressing the findings promptly to maintain compliance and support ongoing operations in the US market.
Sentiment: Neutral
Powered by Brave
Recent Updates
News Summary
Recent news highlights Cipla's strategic partnership with Siemens to implement continuous manufacturing, enhancing production quality and efficiency in active pharmaceutical ingredients. The company reported a steeper-than-expected 57% quarterly profit decline, attributed to supply chain disruptions and acquisition costs. Technical momentum has shifted towards a bearish outlook amid market underperformance, while regulatory inspections such as the Maharashtra GST review concluded without material impact. These developments underscore a period of operational challenges balanced by efforts to modernize manufacturing and maintain compliance, affecting revenue growth and market sentiment.
News Sentiment
The overall sentiment from recent updates is mixed, with neutral to slightly negative tones predominating due to profit declines and regulatory observations. Positive aspects include technological advancements and stable regulatory outcomes, while negative sentiment arises from earnings pressure and technical momentum shifts. Sentiment trends suggest cautious market reactions, reflecting both ongoing challenges and proactive management responses.
Analytical Overview
Analysis Summary
Cipla’s valuation metrics, including a trailing P/E of 23.7 and forward P/E of 23.5, align closely with the industry average of 23.7, indicating a valuation consistent with sector norms. The PEG ratio is negative, reflecting recent earnings declines relative to growth expectations.
Revenue growth is modest at approximately 1.8% quarterly, while cash flow remains strong with operating cash flow of ₹55.16 billion and free cash flow of ₹52.73 billion, supporting operational stability.
Financial health is robust with a low total debt to equity ratio of 0.014 and a high current ratio above 4, indicating strong liquidity and manageable leverage.
Sector-specific challenges include regulatory scrutiny and supply chain disruptions, while opportunities arise from manufacturing modernization and expanding global presence.
Considering India-specific factors, Cipla benefits from a growing pharmaceutical market and regulatory environment supportive of generic drug production, though competitive pressures and pricing regulations remain relevant.
Investment Conclusion
Supporting Factors: Primary supporting factors include Cipla’s strong liquidity position, consistent cash flow generation, and valuation metrics in line with industry averages.
Risk Factors: Main risk factors to monitor are the recent profit margin pressures, regulatory inspection outcomes, and the impact of supply chain constraints on earnings.
SWOT Analysis
Strengths
- Strong market position in generic and specialty pharmaceuticals.
- Robust liquidity with a current ratio above 4.
- Consistent cash flow generation supporting operations.
- Diverse product portfolio across multiple therapeutic areas.
Weaknesses
- Recent decline in quarterly earnings growth by 57%.
- Negative PEG ratio indicating earnings challenges relative to growth.
- Profit margin pressures amid supply chain disruptions.
- Stock trading below key moving averages signaling technical weakness.
Opportunities
- Implementation of continuous manufacturing to enhance efficiency.
- Expansion in international markets leveraging affordable healthcare solutions.
- Growing demand in Indian pharmaceutical sector supported by regulatory environment.
- Potential for strategic partnerships and acquisitions to drive growth.
Threats
- Regulatory inspections and compliance risks in key markets.
- Intense competition from domestic and global pharmaceutical companies.
- Supply chain constraints impacting production and profitability.
- Market volatility affecting stock price momentum and investor sentiment.
Company Description
Cipla Ltd., a renowned name in the pharmaceutical industry, primarily focuses on the development and manufacturing of a wide array of medicines essential for treating diseases across various therapeutic fields. Known for its generic and branded formulations, Cipla delivers healthcare solutions in areas such as respiratory ailments, anti-retrovirals, urology, and cardiovascular diseases, among others. With a core emphasis on affordable medication, Cipla significantly contributes to improving global health standards, particularly in developing regions where access to expensive treatments is limited. Established in India and expanding its reach across multiple international markets, Cipla plays a pivotal role in the pharmaceutical landscape, exemplifying quality, innovation, and social responsibility. By leveraging cutting-edge research and development, Cipla not only enhances its competitive edge but also fosters advancements in drug manufacturing processes, making it a key player in the healthcare sector's ongoing evolution.