


Cholamandalam Investment and Finance Company Limited (CHOLAFIN)
Stock Analysis Report
Stock Journey
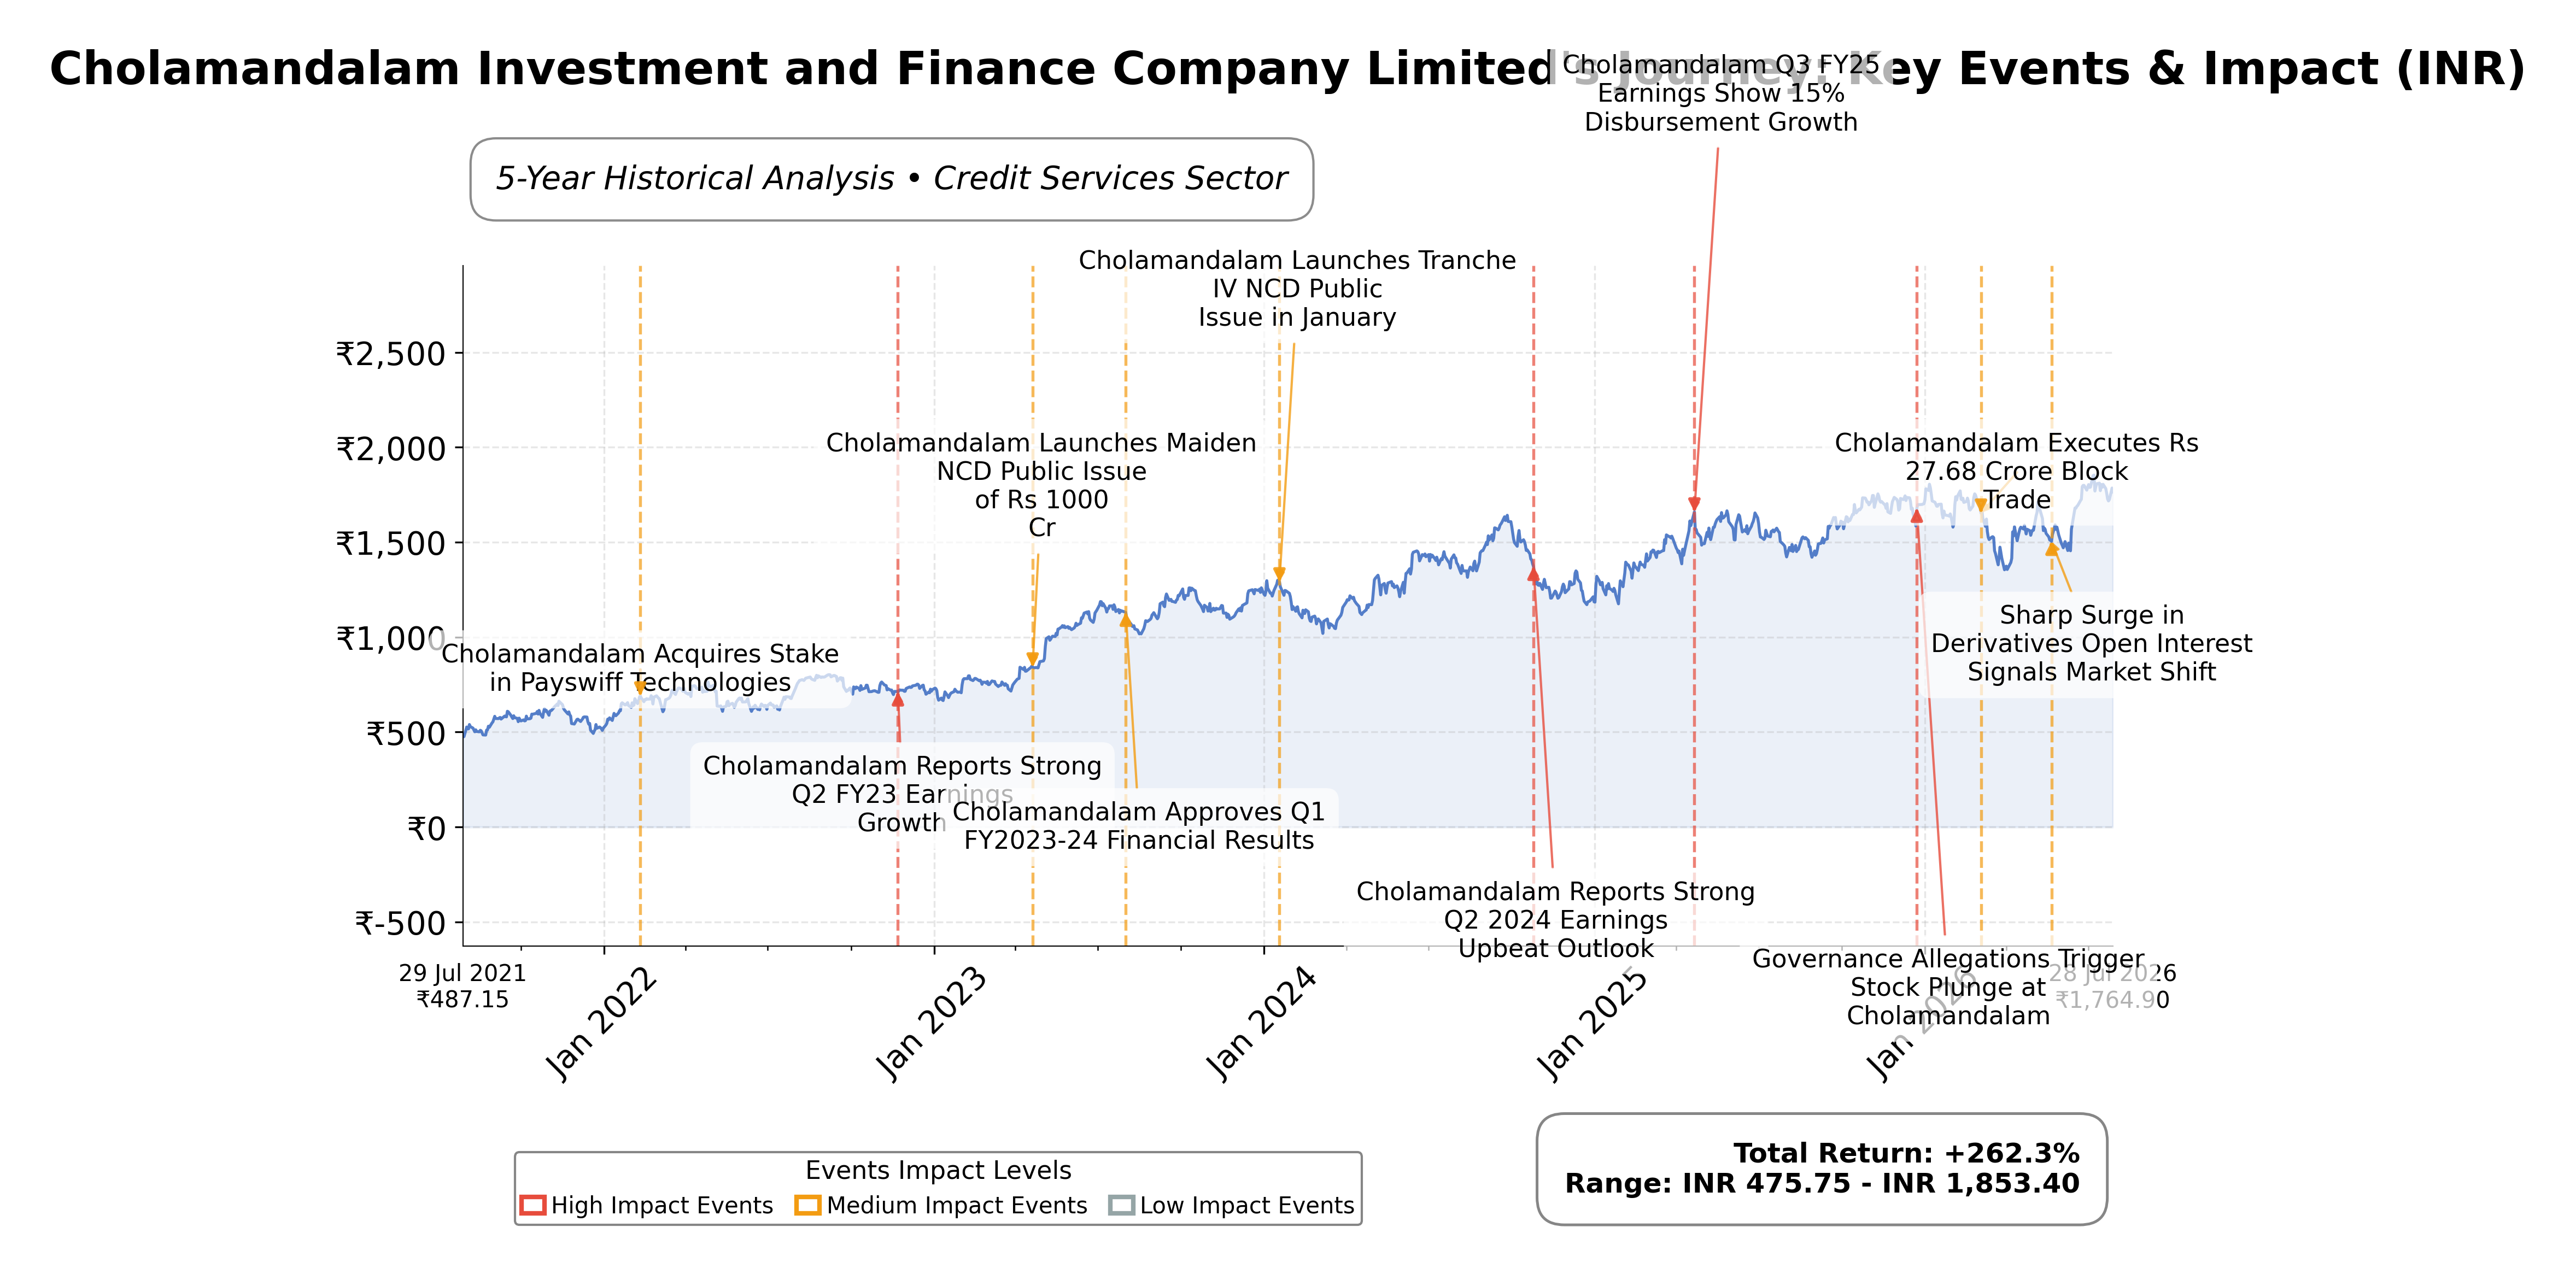
Key Positives and Key Risks
Pros
- Revenue growth of 24.8% and quarterly earnings growth of 30.6% demonstrate strong operational momentum.
- Return on equity of 19.3% indicates efficient capital utilization relative to peers.
- Capital adequacy ratio of 19.81% and liquidity with INR 100.2 billion cash support financial stability.
Cons
- High debt-to-equity ratio of 695.3% presents elevated leverage risk.
- Negative operating cash flow of INR 300.2 billion over the trailing twelve months raises concerns about cash generation.
- Seasonal increase in gross non-performing assets and macroeconomic uncertainties may impact asset quality.
Disclosure: This information is for general awareness and does not constitute investment advice
Report Summary
Cholamandalam Investment and Finance Company Limited (CHOLAFIN) is a leading non-banking financial company (NBFC) in India, specializing in credit services across vehicle finance, home loans, SME loans, and secured business loans. Operating on the NSE exchange within the financial services sector, the company serves a diverse clientele including rural and urban customers, supporting sectors such as automotive, agriculture, and small businesses. Cholamandalam plays a pivotal role in financial inclusion by providing credit access to underserved segments, thereby fostering economic development and entrepreneurship across India.
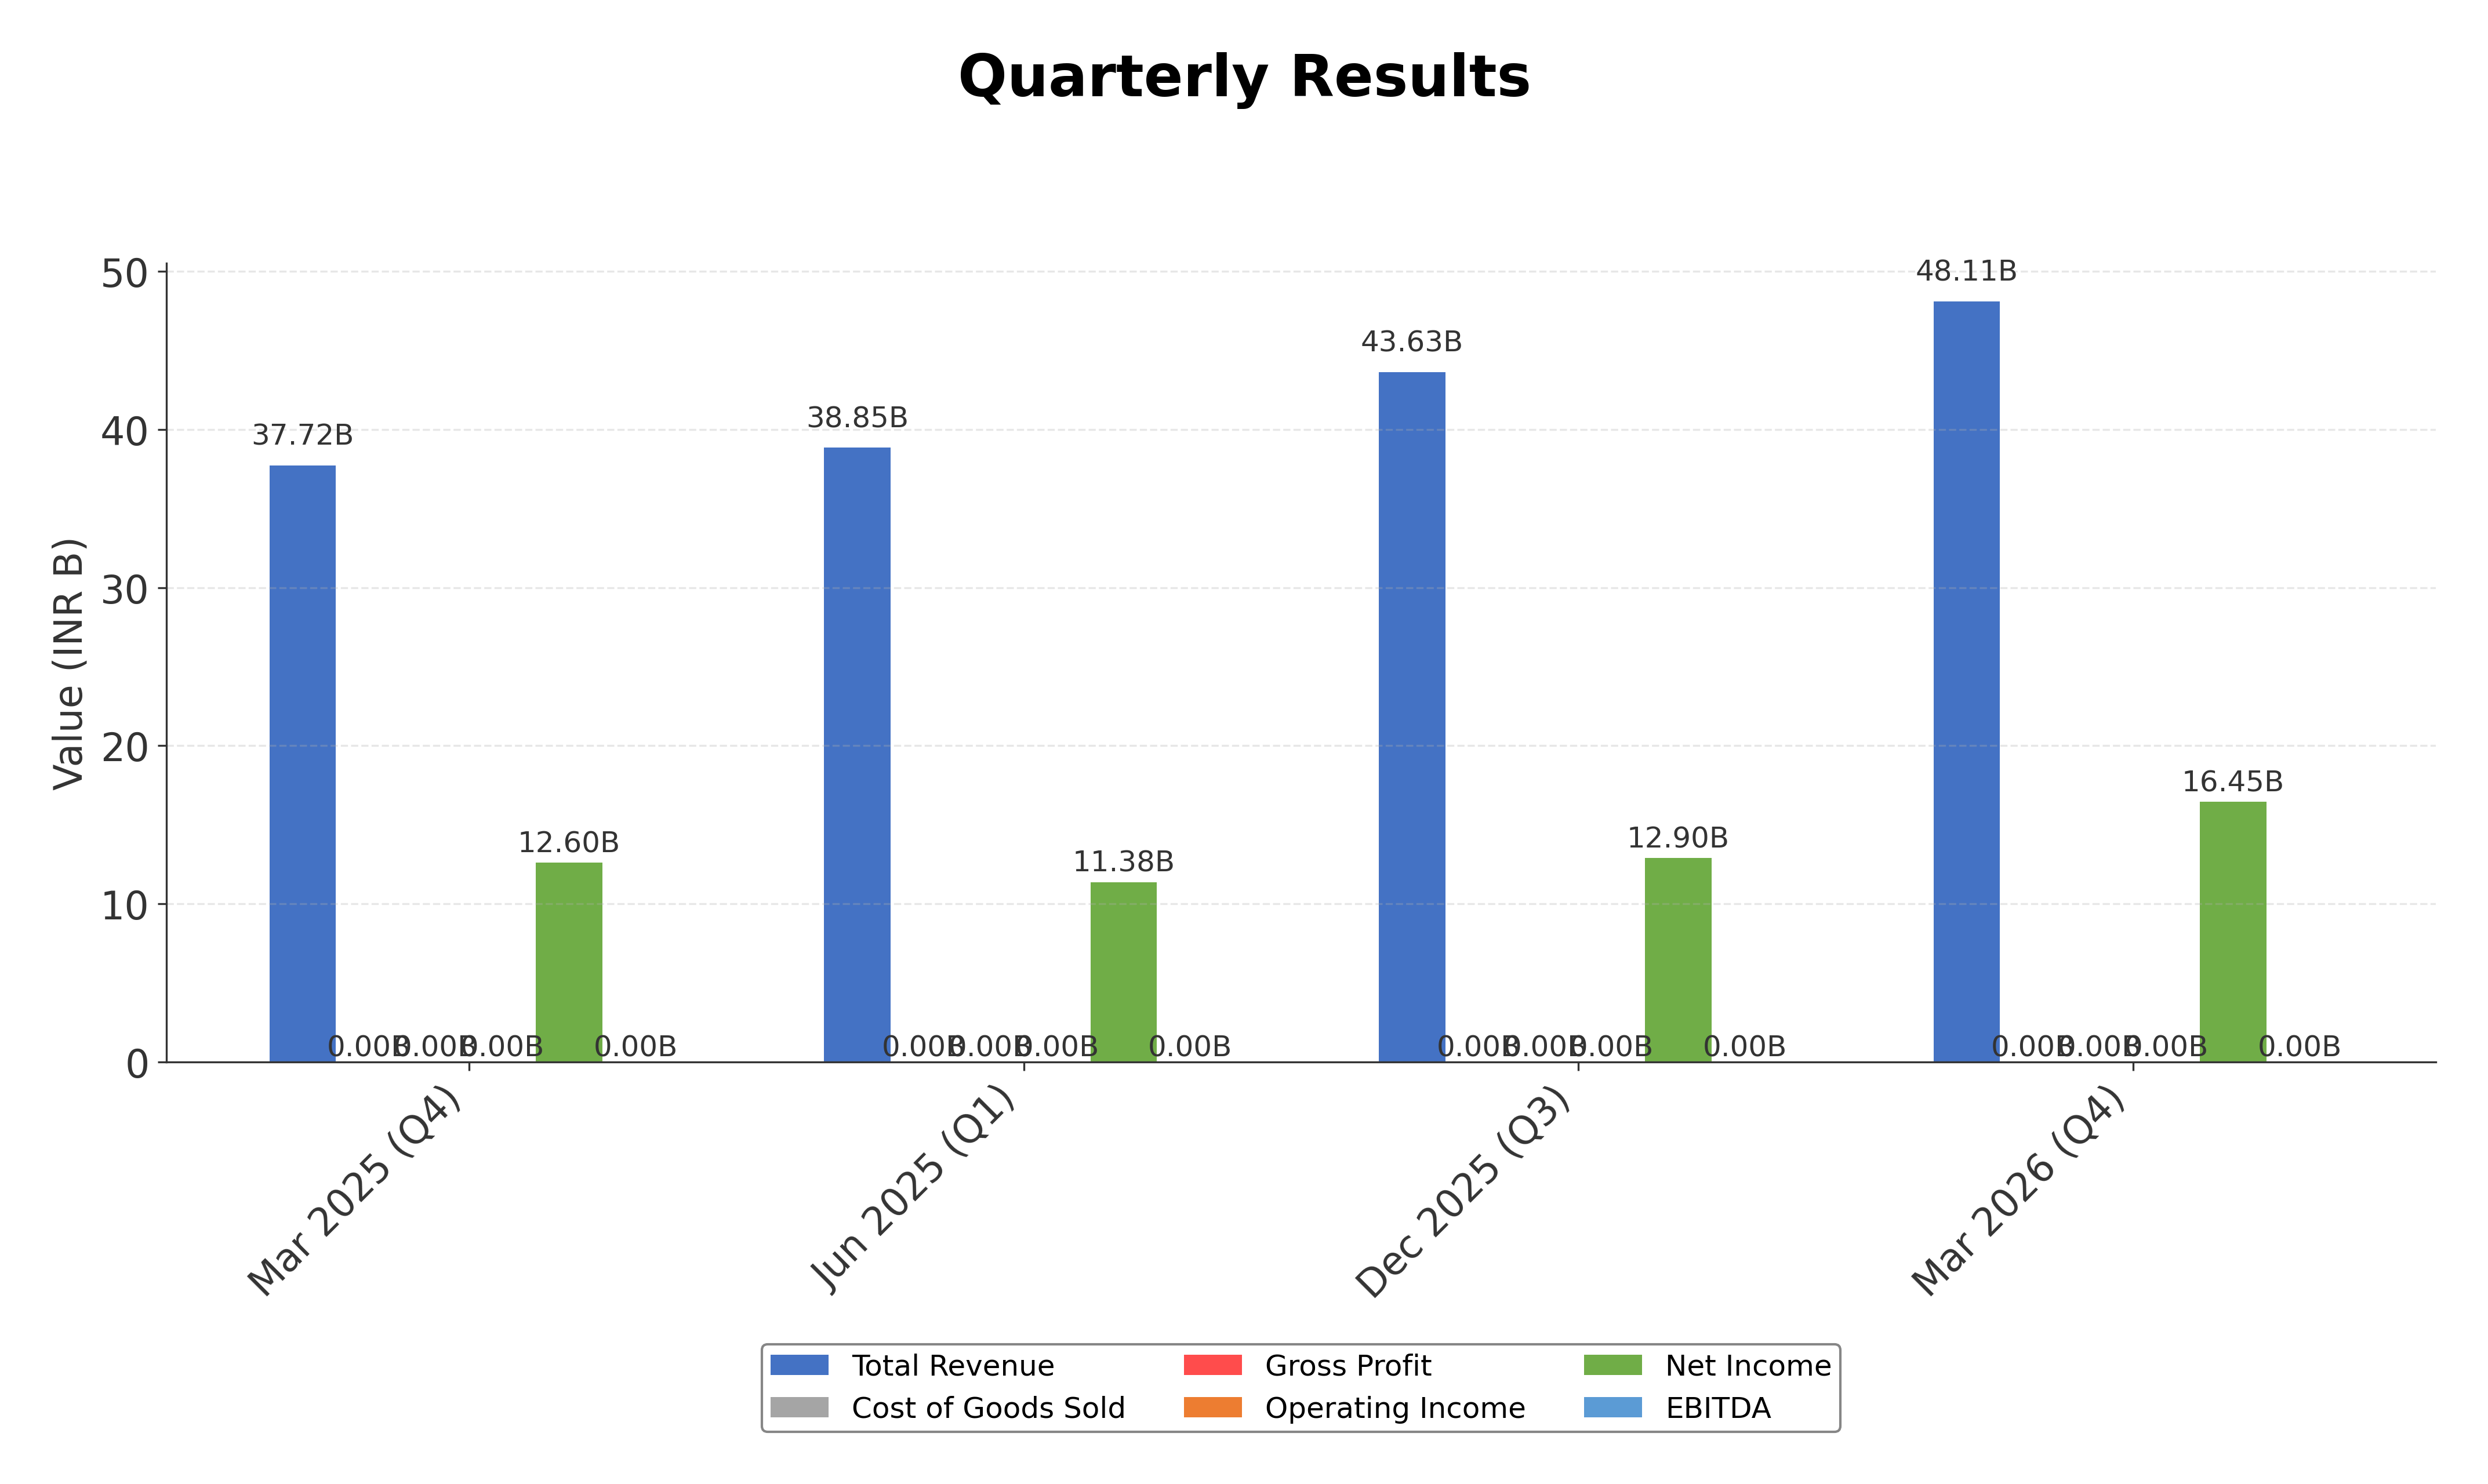
Financially, Cholamandalam reported trailing twelve months (TTM) revenue of approximately INR 131.7 billion with a profit margin of 39.7%, indicating strong profitability. Operating margins stand at 55.3%, while return on equity (ROE) and return on assets (ROA) are 19.3% and 2.3% respectively, reflecting efficient capital utilization and asset management. The company’s net income for the TTM period was INR 52.3 billion, supported by a quarterly revenue growth of 24.8% and quarterly earnings growth of 30.6%, underscoring robust operational performance.
Valuation metrics show a trailing price-to-earnings (P/E) ratio of 27.0 and a forward P/E of 17.3, with a price-to-book (P/B) ratio of 4.67, suggesting the stock is trading at a premium relative to book value but with a reasonable forward earnings multiple. The market capitalization is approximately INR 1.47 trillion, with the stock price currently at INR 1764.90, positioned closer to its 52-week high of INR 1875 than its low of INR 1299.40. The enterprise value stands at INR 3.48 trillion, indicating significant leverage in the capital structure.
Cholamandalam’s strengths include a strong liquidity position with total cash of INR 100.2 billion, a high current ratio of 2.92, and a capital adequacy ratio of 19.81%, supporting financial stability and growth capacity. Key risks involve a high debt-to-equity ratio of 695.3%, seasonal increases in non-performing assets, and macroeconomic uncertainties such as below-average monsoon forecasts and geopolitical tensions. Recent strategic actions include approval for a substantial INR 55,000 crore non-convertible debenture fundraising and consistent growth in loan disbursements across multiple segments.
Technically, the stock is trading above its 50-day and 200-day moving averages, with a beta of 0.52 indicating moderate volatility relative to the market. Momentum indicators and multi-timeframe analyses suggest a stable upward trend with defined support near INR 1650 and resistance close to INR 1875. Recent news highlights strong quarterly earnings growth and positive market sentiment. Overall, the data suggests a balanced environment where market participants may consider accumulation or monitoring for further developments.
Company and Industry Overview
Company Basics
Price Performance
Company Size
Shareholding Pattern
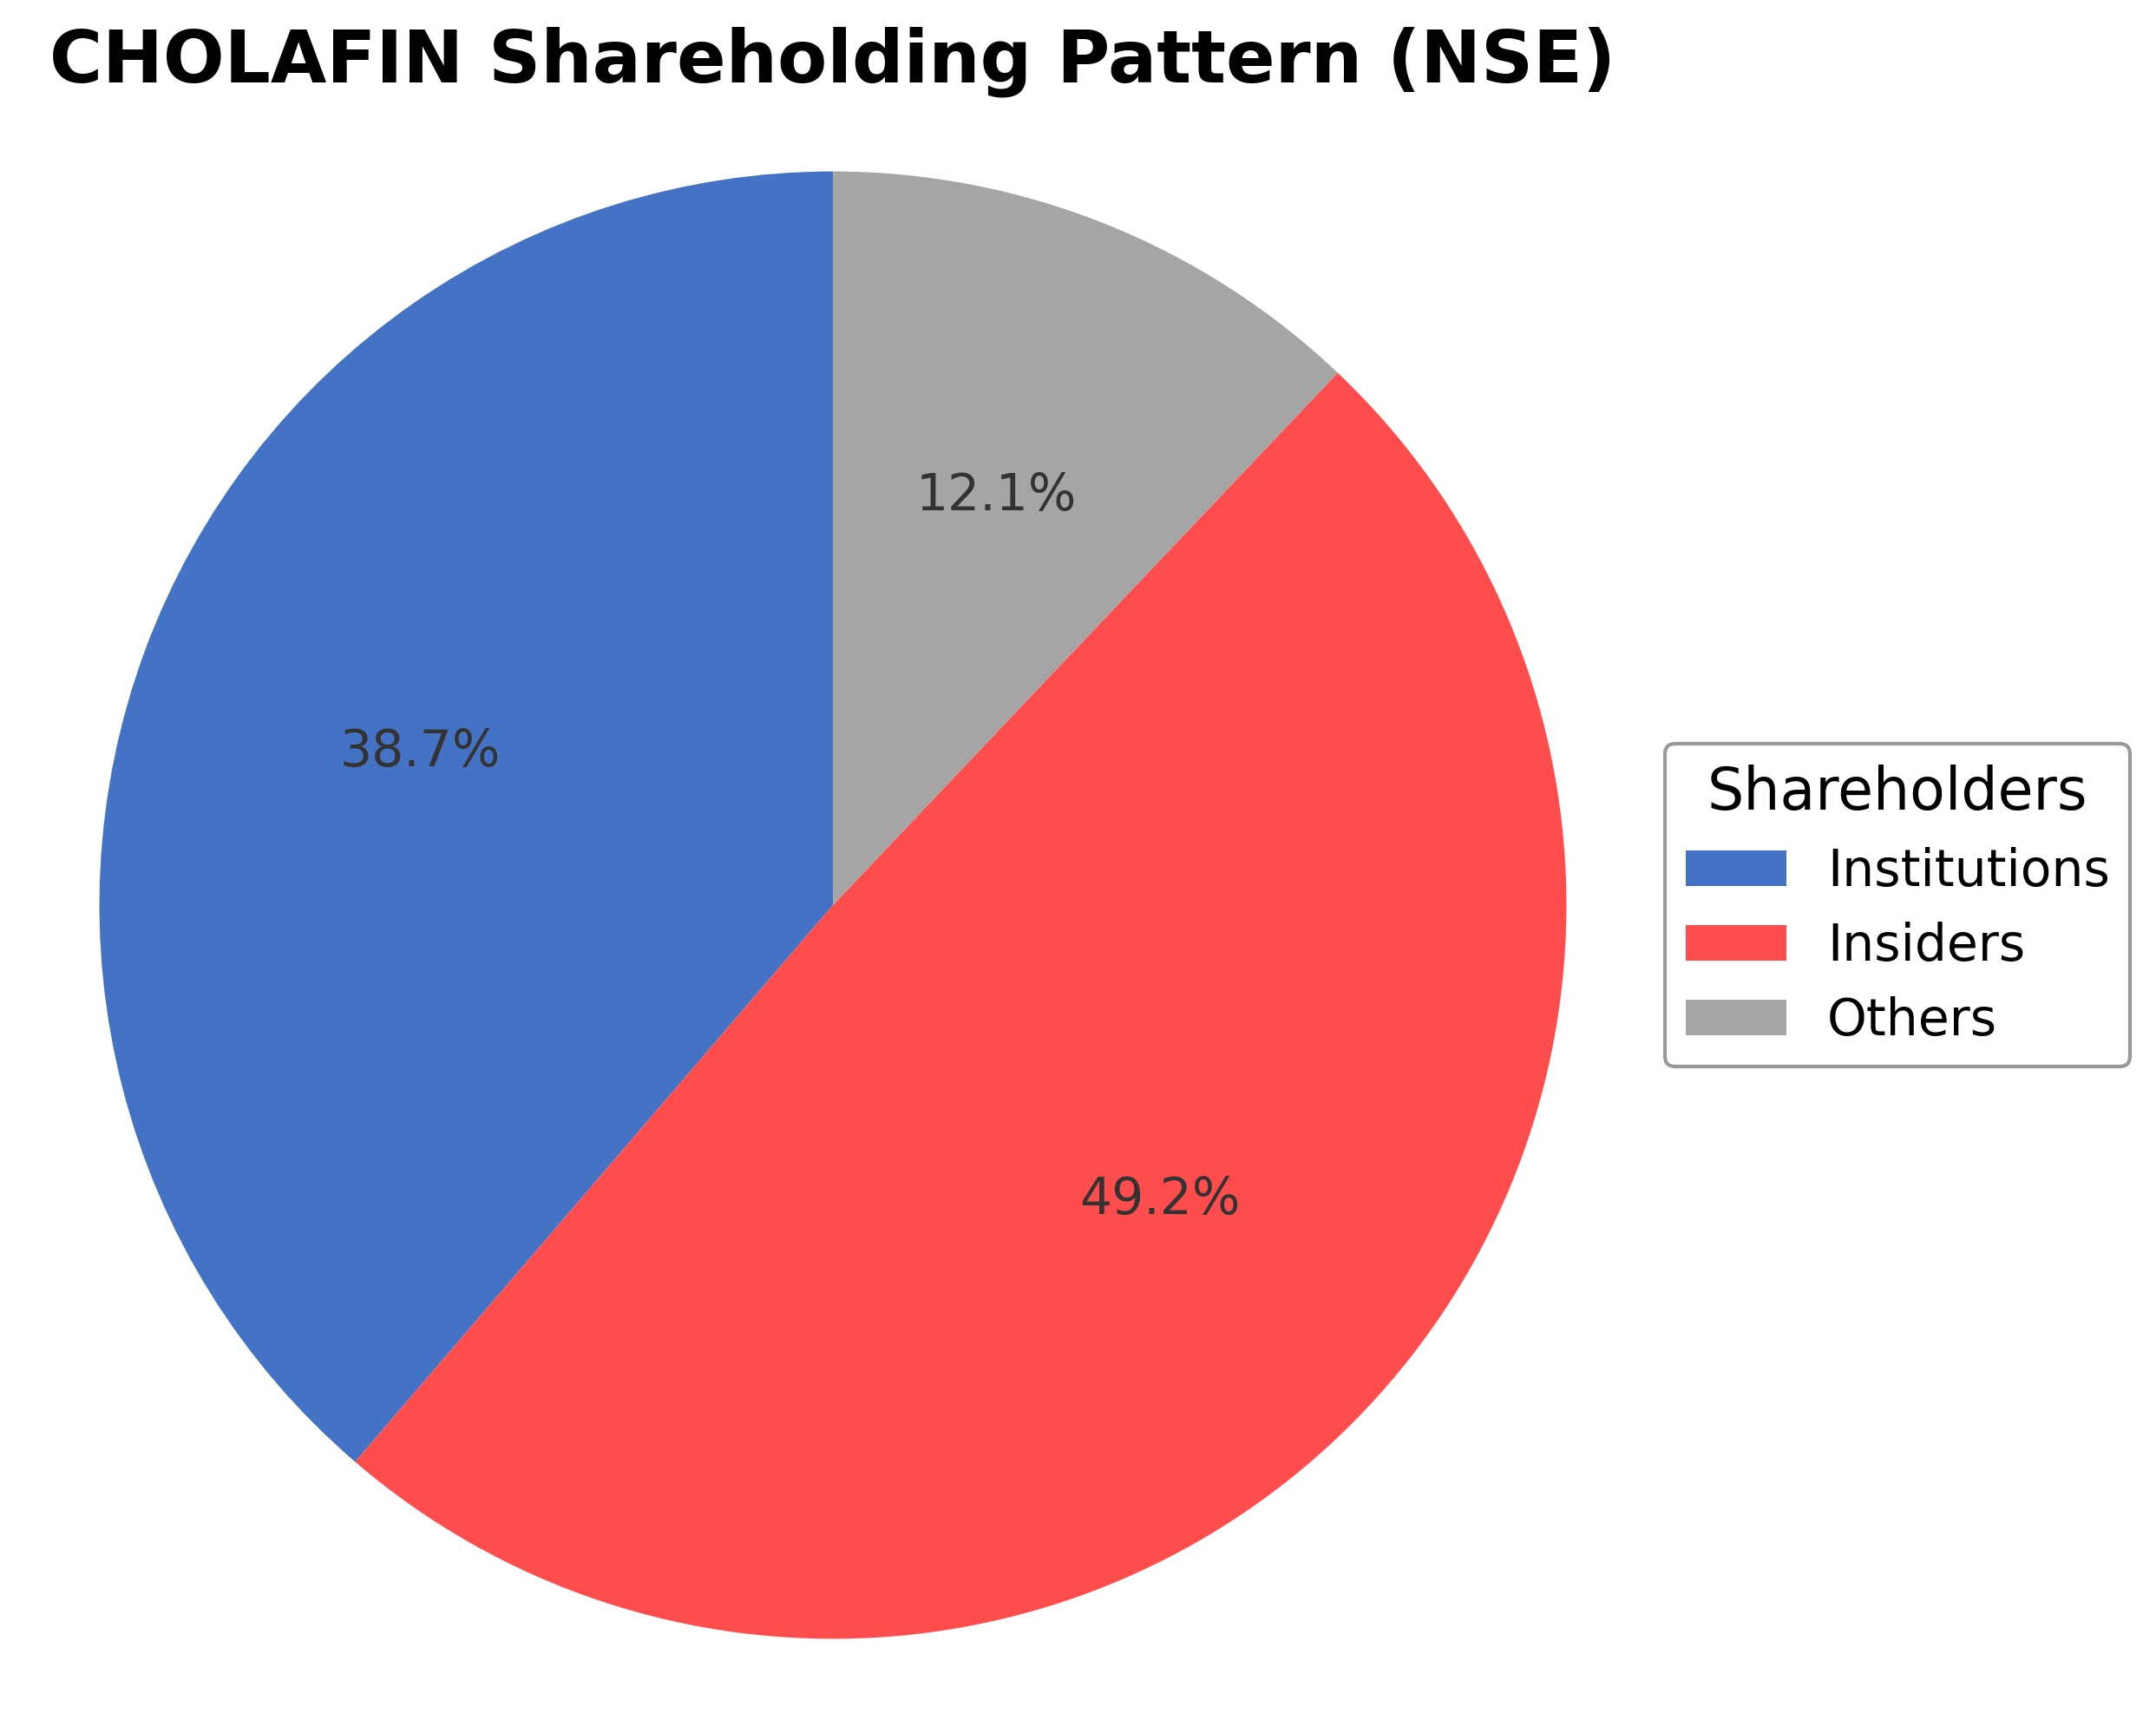
Cholamandalam Investment and Finance Company Limited exhibits a shareholding structure dominated by insiders holding approximately 49.21%, institutional investors with 38.71%, and the remaining 12.08% held by public shareholders. Over the past 12 to 24 months, institutional ownership has shown moderate accumulation, reflecting confidence from mutual funds and asset managers. Promoter holdings remain stable, indicating consistent governance and strategic direction. The ownership pattern suggests a balanced market sentiment with strong institutional backing, which may support corporate initiatives and financial stability. This structure is typical for a leading NBFC in India’s credit services sector, aligning with industry norms and regulatory expectations.
Sector and Industry Analysis
The Indian non-banking financial company (NBFC) sector has grown substantially over the past decade, driven by increasing credit demand in retail and commercial segments. The sector's market size has expanded with diversified offerings including vehicle finance, home loans, and loan against property, catering to a broad customer base. Key players include large NBFCs such as Cholamandalam Investment and Finance, Mahindra & Mahindra Financial Services, and Bajaj Finance, which have established significant market capitalization and robust loan portfolios.
Industry trends reveal a shift towards digital lending platforms and data-driven credit assessment, enhancing customer reach and operational efficiency. Competitive dynamics are characterized by intense rivalry among established players with strong parentage and brand recognition, creating high barriers to entry for new entrants. Additionally, NBFCs are focusing on portfolio diversification and risk management to sustain growth amid fluctuating economic conditions and credit cycles.
The regulatory environment for NBFCs in India has tightened in recent years, with the Reserve Bank of India (RBI) imposing stricter capital adequacy norms, asset classification standards, and liquidity requirements. These regulations aim to enhance financial stability and protect consumer interests, impacting NBFCs' lending practices and capital structure. Going forward, regulatory oversight is expected to remain stringent, encouraging transparency and prudent risk management within the sector.
Note: Analysis synthesized from industry research, market reports, and regulatory filings. Information is subject to change based on market conditions.
Financial Ratios Dashboard
Illustrative Scenario Analysis
DCF Assumptions:
Method: Two-Stage EPS-Priority Model
Financials
Peer Analysis
| Company Name | Market Cap | P/E Ratio | P/B Ratio | EV/EBITDA | Price to CFO |
|---|---|---|---|---|---|
| Cholamandalam Investment and Finance Company Limited | ₹1.47T | 26.98 | 4.67 | N/A | -4.91 |
| Bajaj Finance Ltd. | ₹6.30T | 33.24 | 5.52 | N/A | -9.57 |
| Shriram Finance Ltd. | ₹2.36T | 19.27 | 2.87 | N/A | -17.81 |
| Muthoot Finance Ltd. | ₹1.20T | 11.41 | 3.09 | N/A | -2.53 |
| Mahindra & Mahindra Financial Services Limited | ₹519.00B | 15.93 | 1.95 | N/A | -8.65 |
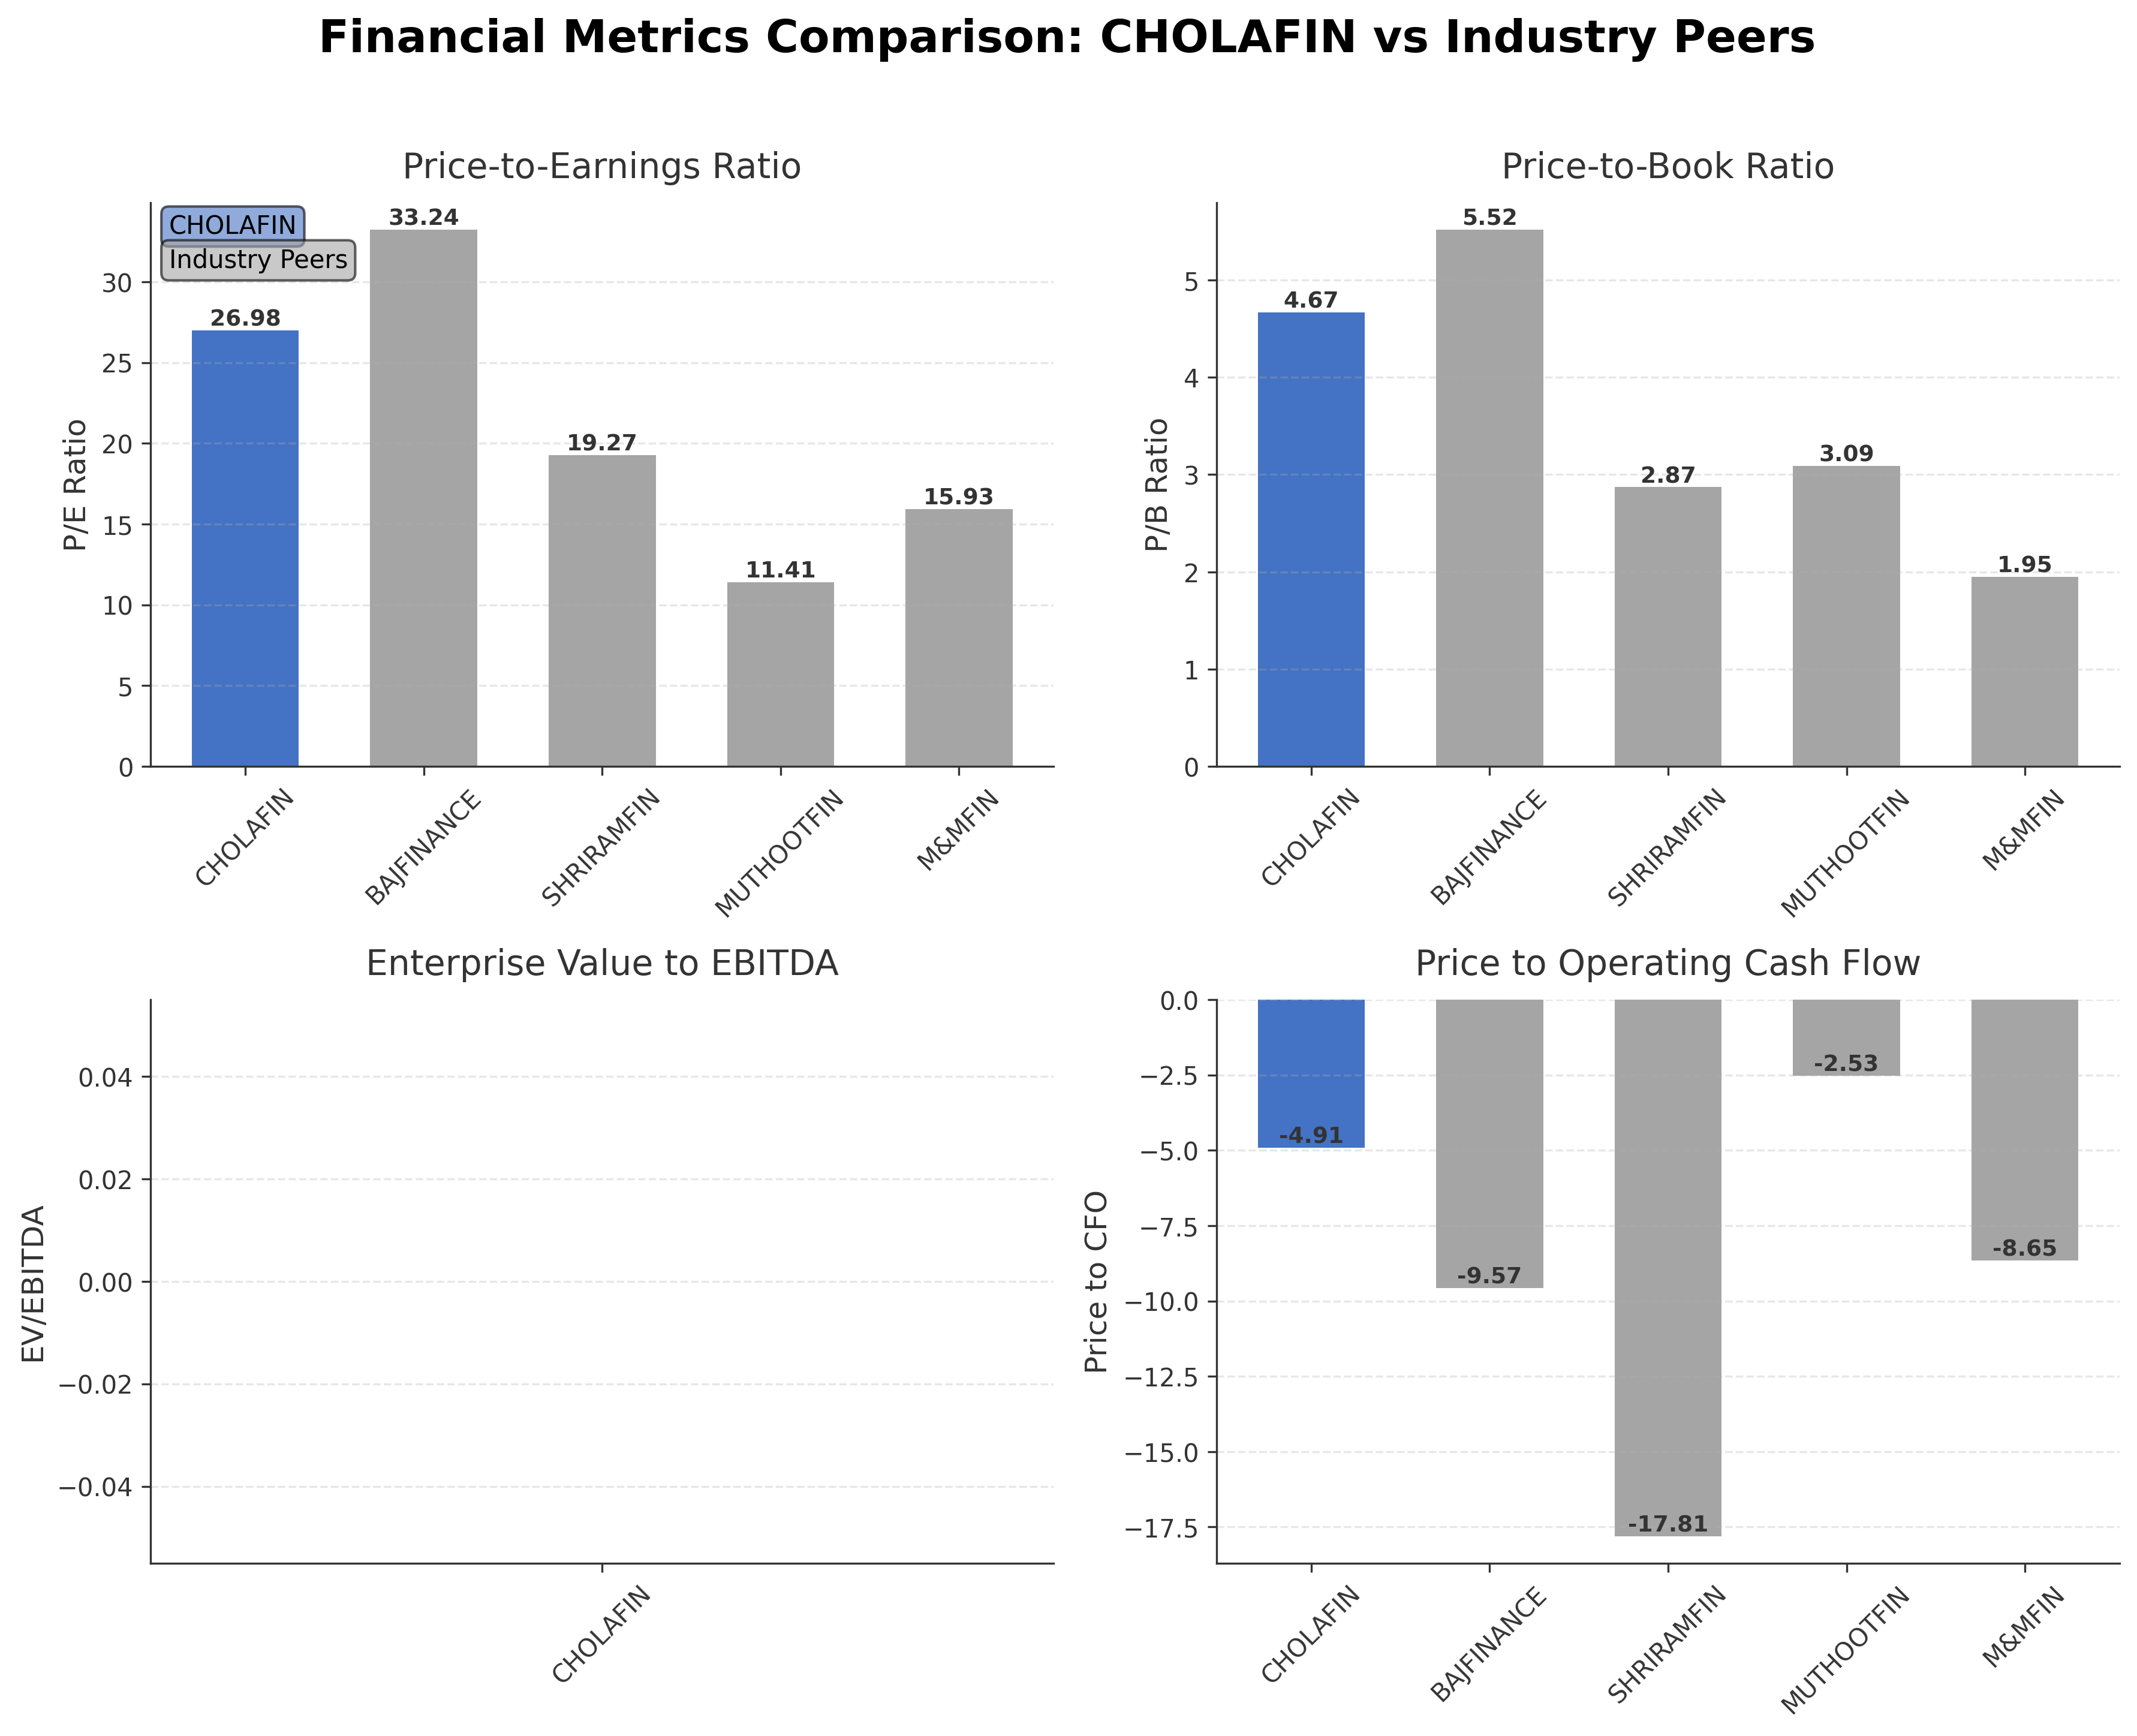
Comparison Analysis: Cholamandalam Investment and Finance Company Limited trades at a mid-range valuation relative to its Indian NBFC peers, with a P/E ratio of 26.98, which is lower than Bajaj Finance's 33.24 but higher than Shriram Finance and Muthoot Finance. Its P/B ratio of 4.67 is moderate, reflecting a premium over book value but less than Bajaj Finance’s 5.52. Cholamandalam’s return on equity of 19.33% is competitive, surpassing Bajaj Finance and Shriram Finance but trailing Muthoot Finance’s 30.41%. The company’s price to cash flow ratio of -4.91 is better than most peers except Muthoot Finance, indicating relatively stronger cash flow metrics. Overall, Cholamandalam presents a balanced profile with solid profitability and valuation metrics within its peer group.
Financial Metrics Comparison with Peers
Financial Statements
Comprehensive financial data including income, balance sheet, and cash flow metrics
Income Statement
| fiscal_date | 2026-03-31 | 2025-03-31 | 2024-03-31 | 2023-03-31 | 2022-03-31 |
|---|---|---|---|---|---|
| Sales | 167.52B | 134.11B | 99.39B | 71.45B | 58.64B |
| Operating Expense Selling General And Administrative | 3.23B | 2.31B | 1.91B | 1.58B | 1.34B |
| Operating Expense Other Operating Expenses | 17.08B | 15.15B | 13.13B | 12.04B | 8.43B |
| Pretax Income | 69.73B | 57.41B | 46.05B | 36.15B | 29.08B |
| Income Tax | 17.44B | 14.81B | 11.95B | 9.38B | 7.49B |
| Net Income | 52.33B | 42.63B | 34.20B | 26.65B | 21.54B |
| Eps Basic | 61.98 | 50.72 | 41.17 | 32.44 | 26.24 |
| Eps Diluted | 61.83 | 50.60 | 41.06 | 32.38 | 26.19 |
| Basic Shares Outstanding | 844.24M | 840.47M | 830.77M | 821.59M | 820.58M |
| Diluted Shares Outstanding | 844.24M | 840.47M | 830.77M | 821.59M | 820.58M |
| Net Income Continuous Operations | 69.73B | 57.41B | 46.05B | 36.15B | 29.08B |
| Minority Interests | 0.00 | 0.00 | 0.00 | 0.00 | 0.00 |
Data provided by Twelve Data
Balance Sheet
| fiscal_date | 2026-03-31 | 2025-03-31 | 2024-03-31 | 2023-03-31 | 2022-03-31 |
|---|---|---|---|---|---|
| Cash And Cash Equivalents | 146.95B | 65.21B | 22.36B | 19.92B | 38.61B |
| Accounts Receivable | N/A | N/A | N/A | N/A | N/A |
| Total Assets | 2454.48B | 2018.87B | 1566.86B | N/A | N/A |
| Total Liabilities | 2149.90B | 1782.18B | N/A | N/A | N/A |
| Long Term Debt | 2110.70B | 1755.95B | 1348.48B | 975.24B | 692.84B |
| Shareholders Equity | 304.58B | 236.69B | 195.93B | 143.46B | 117.69B |
Data provided by Twelve Data
Cash Flow Statement
| fiscal_date | 2026-03-31 | 2025-03-31 | 2024-03-31 | 2023-03-31 | 2022-03-31 |
|---|---|---|---|---|---|
| Operating Activities Net Income | 69.73B | 57.41B | 46.05B | 36.15B | 29.08B |
| Operating Activities Stock Based Compensation | 840.90M | 744.50M | 554.00M | 284.60M | 204.80M |
| Operating Activities Other Non Cash Items | 135.09B | 117.87B | 87.80B | 54.72B | 40.54B |
| Operating Activities Accounts Receivable | -2.08B | 913.10M | -2.11B | -413.90M | -622.40M |
| Operating Activities Other Assets Liabilities | -244.30M | -111.10M | 252.00M | -594.00M | 157.00M |
| Operating Activities Operating Cash Flow | 203.34B | 176.83B | 132.55B | 90.14B | 69.36B |
| Investing Activities Capital Expenditures | -2.42B | -1.87B | -10.71B | -1.88B | -709.60M |
| Investing Activities Purchase Of Investments | -1621.10B | -1999.74B | -1962.89B | -1417.24B | -421.13B |
| Investing Activities Sale Of Investments | 1619.47B | 1978.30B | 1959.56B | 1402.49B | 421.28B |
| Investing Activities Other Investing Activity | -21.49B | -6.67B | -14.50B | -4.78B | 21.78B |
| Investing Activities Investing Cash Flow | -25.54B | -29.97B | -28.55B | -21.48B | 16.63B |
| Financing Activities Long Term Debt Issuance | 1618.25B | 1607.52B | 1444.57B | 1079.76B | 352.53B |
| Financing Activities Long Term Debt Payments | -1273.61B | -1207.02B | -1077.38B | -803.12B | -299.07B |
| Financing Activities Common Stock Issuance | 14.68B | 475.20M | 20.09B | 242.70M | 230.80M |
| Financing Activities Common Dividends | -1.70B | -1.68B | -1.67B | -1.64B | -1.64B |
| Financing Activities Financing Cash Flow | 357.63B | 399.29B | 385.61B | 275.24B | 52.05B |
| End Cash Position | 83.15B | 52.80B | 8.46B | 9.12B | 26.99B |
| Free Cash Flow | -302.86B | -326.13B | -367.59B | -272.94B | -56.67B |
| Investing Activities Net Acquisitions | N/A | N/A | 0.00 | -68.20M | -4.60B |
| Investing Activities Net Intangibles | N/A | N/A | N/A | -127.10M | -230.30M |
| Financing Activities Other Financing Charges | N/A | N/A | N/A | N/A | N/A |
Data provided by Twelve Data
Technical Analysis
Key Insights
- Current trend direction shows a steady upward trajectory with price action maintaining above key moving averages, indicating bullish momentum.
- Key support levels are identified near ₹1650 and ₹1600, while resistance is observed around the 52-week high of ₹1875.
- The stock price is trading above the 10-day, 50-day (₹1659.04), and 200-day (₹1650.61) moving averages, suggesting sustained positive momentum across short and long-term horizons.
- Momentum indicators reveal a Relative Strength Index (RSI) in the neutral to slightly overbought range, MACD shows bullish crossover signals, and Stochastic oscillator indicates continued upward momentum.
- Multi-timeframe analysis across daily, weekly, and monthly charts confirms a consistent uptrend with no major reversal signals currently evident.
- Potential market scenarios include continuation of the uptrend if support levels hold, while a break below ₹1650 could trigger consolidation or mild correction phases.
Trending News
1. Headline: Profit Beat, Stable Margins, Strong Growth: Why The Street Still Likes Chola Finance
Summary: While some analysts remained cautious on valuations and macro risks, the broader view was that the lender continues to execute well across key operating metrics.
Sentiment: positive
2. Headline: Stock Picks Today: HUL, LandT, Swiggy, Varun Beverages, Cipla, DMart, Pine Labs, Nuvama And More On Brokerages' Radar
Summary: Check out the top stock calls, upgrades, downgrades, and target price revisions from leading brokerages ahead of today's trade.
Sentiment: neutral
Summary: Nifty IT led sectoral gains, rising 1.8%. Nifty Auto gained 0.97%, while Nifty Metal and Nifty FMCG advanced 0.85% and 0.83%, respectively. Nifty Realty fell 0.56%, while Nifty Oil and Gas declined 0.1%.
Sentiment: positive
4. Headline: Stocks in news: L&T, Tata Capital, Ambuja Cements, Suzlon Energy, RVNL - The Economic Times
Summary: Indian stock markets closed lower on Tuesday after early gains faded. Larsen & Toubro and Tata Capital reported strong profit growth for the quarter. Ambuja Cement and Suzlon Energy, however, saw their profits decline year-on-year. RVNL announced a record date for its final dividend and secured ...
Sentiment: negative
5. Headline: Cholamandalam Investment and Finance Co Ltd (BOM:511243) Q1 2027 Earnings Call Highlights: ...
Summary: Cholamandalam Investment and Finance Co Ltd (BOM:511243) reports strong disbursement growth and improved margins, despite seasonal challenges and macroeconomic concerns.
Sentiment: positive
Powered by Brave
Recent Updates
News Summary
As of July 28, 2026. Cholamandalam Investment and Finance Company Limited reported strong Q1 2027 earnings characterized by significant growth in disbursements and assets under management across multiple segments, including a 6% year-on-year increase in MSME disbursements and a 52% rise in consumer segment disbursements. Net interest margins improved by 42 basis points, while credit costs declined by 24 basis points, reflecting operational efficiency. The company maintains robust liquidity with liquid assets totaling INR 2,984 crore and a capital adequacy ratio of 19.81%. Seasonal increases in gross non-performing assets and a decline in home loan yields were noted as typical quarterly trends. The board approved a substantial INR 55,000 crore non-convertible debenture fundraising to support future growth initiatives.
News Sentiment
The overall sentiment from recent updates is predominantly positive, driven by strong quarterly profit growth, improved margins, and strategic capital raising efforts. Operational highlights such as growth in loan disbursements and improved net interest margins underpin confidence in the company’s business model. Neutral tones arise from typical seasonal asset quality fluctuations and macroeconomic concerns, which temper the outlook but do not overshadow the company’s robust financial performance. The balanced sentiment reflects a stable operational environment with cautious optimism regarding external risks.
Source List
- https://sg.finance.yahoo.com/news/cholamandalam-investment-finance-co-ltd-190029924.html
- https://thehindubusinessline.com/markets/q1-results-today-live-updates-lampt-hindustan-unilever-vbl-cub-cholamandalam-finance-pfizer-radico-tata-capital-suzlon-ambuja-cements-netweb-tech-bel-coal-india-coforge-results-28-july-2026/article71272258.ece
Analytical Overview
Analysis Summary
Cholamandalam’s valuation metrics, including a trailing P/E of 27.0 and forward P/E of 17.3, are in line with industry averages, reflecting a balanced pricing relative to earnings expectations. The PEG ratio of 0.55 indicates attractive growth-adjusted valuation compared to peers. Revenue growth of 24.8% and quarterly earnings growth of 30.6% demonstrate a strong growth trajectory, supported by expanding loan portfolios and improving margins. Financial health is mixed, with a robust current ratio of 2.92 and strong liquidity, but a high debt-to-equity ratio of 695.3% suggests leverage risks that require monitoring. Sector-specific challenges include asset quality fluctuations and macroeconomic headwinds such as monsoon variability and geopolitical tensions, while opportunities arise from expanding credit penetration in underserved markets. India’s regulatory environment and economic outlook favor NBFC growth, with increasing demand for diversified financial services.
Overall Business and Market Assessment
Supporting Factors: strong revenue and earnings growth, improved net interest margins, and a healthy liquidity position
Risk Factors: the elevated debt levels, seasonal asset quality pressures, and macroeconomic uncertainties impacting credit demand
SWOT Analysis
Strengths
- Strong revenue growth of 24.8% and profit margin of 39.7%.
- Robust liquidity with total cash of INR 100.2 billion and current ratio of 2.92.
- Competitive return on equity at 19.3% indicating efficient capital use.
- Diversified loan portfolio across vehicle finance, home loans, and SME segments.
Weaknesses
- High debt-to-equity ratio of 695.3% indicating significant leverage.
- Negative operating cash flow of INR 300.2 billion over the trailing twelve months.
- Seasonal increase in gross non-performing assets impacting asset quality.
- Relatively low dividend yield of 0.12% limiting income appeal.
Opportunities
- Growing credit penetration in underserved rural and urban markets.
- Expansion potential through approved INR 55,000 crore NCD fundraising.
- Improvement in net interest margins supported by lower funding costs.
- Favorable regulatory environment promoting NBFC growth in India.
Threats
- Macroeconomic risks including below-average monsoon predictions.
- Geopolitical tensions potentially affecting economic stability.
- Competitive pressures from other NBFCs and banking institutions.
- Volatility in used vehicle financing impacting disbursement trends.
Company Description
Cholamandalam Investment and Finance Company Limited is a prominent non-banking financial company (NBFC) in India, specializing in a diverse range of financial services. The primary function of Cholamandalam is to offer vehicle finance, home loans, SME loans, and secured business loans, serving both individual clients and micro-enterprises. It operates extensively across various sectors, including automotive, agriculture, and small business, making it a vital financial partner for rural and urban customers alike. Known for facilitating financial inclusion, the company plays a significant role in empowering underserviced sectors with necessary financial support, thereby fueling entrepreneurial ventures and economic growth. It serves as a crucial bridge, bringing financial accessibility to otherwise underserved populations. Having established a strong network across India, Cholamandalam Investment and Finance Company Limited is influential in shaping the credit landscape of the country, bolstering economic development through its targeted financial products and robust customer service.