
Chambal Fertilisers and Chemicals Ltd (CHAMBLFERT)
Stock Analysis Report
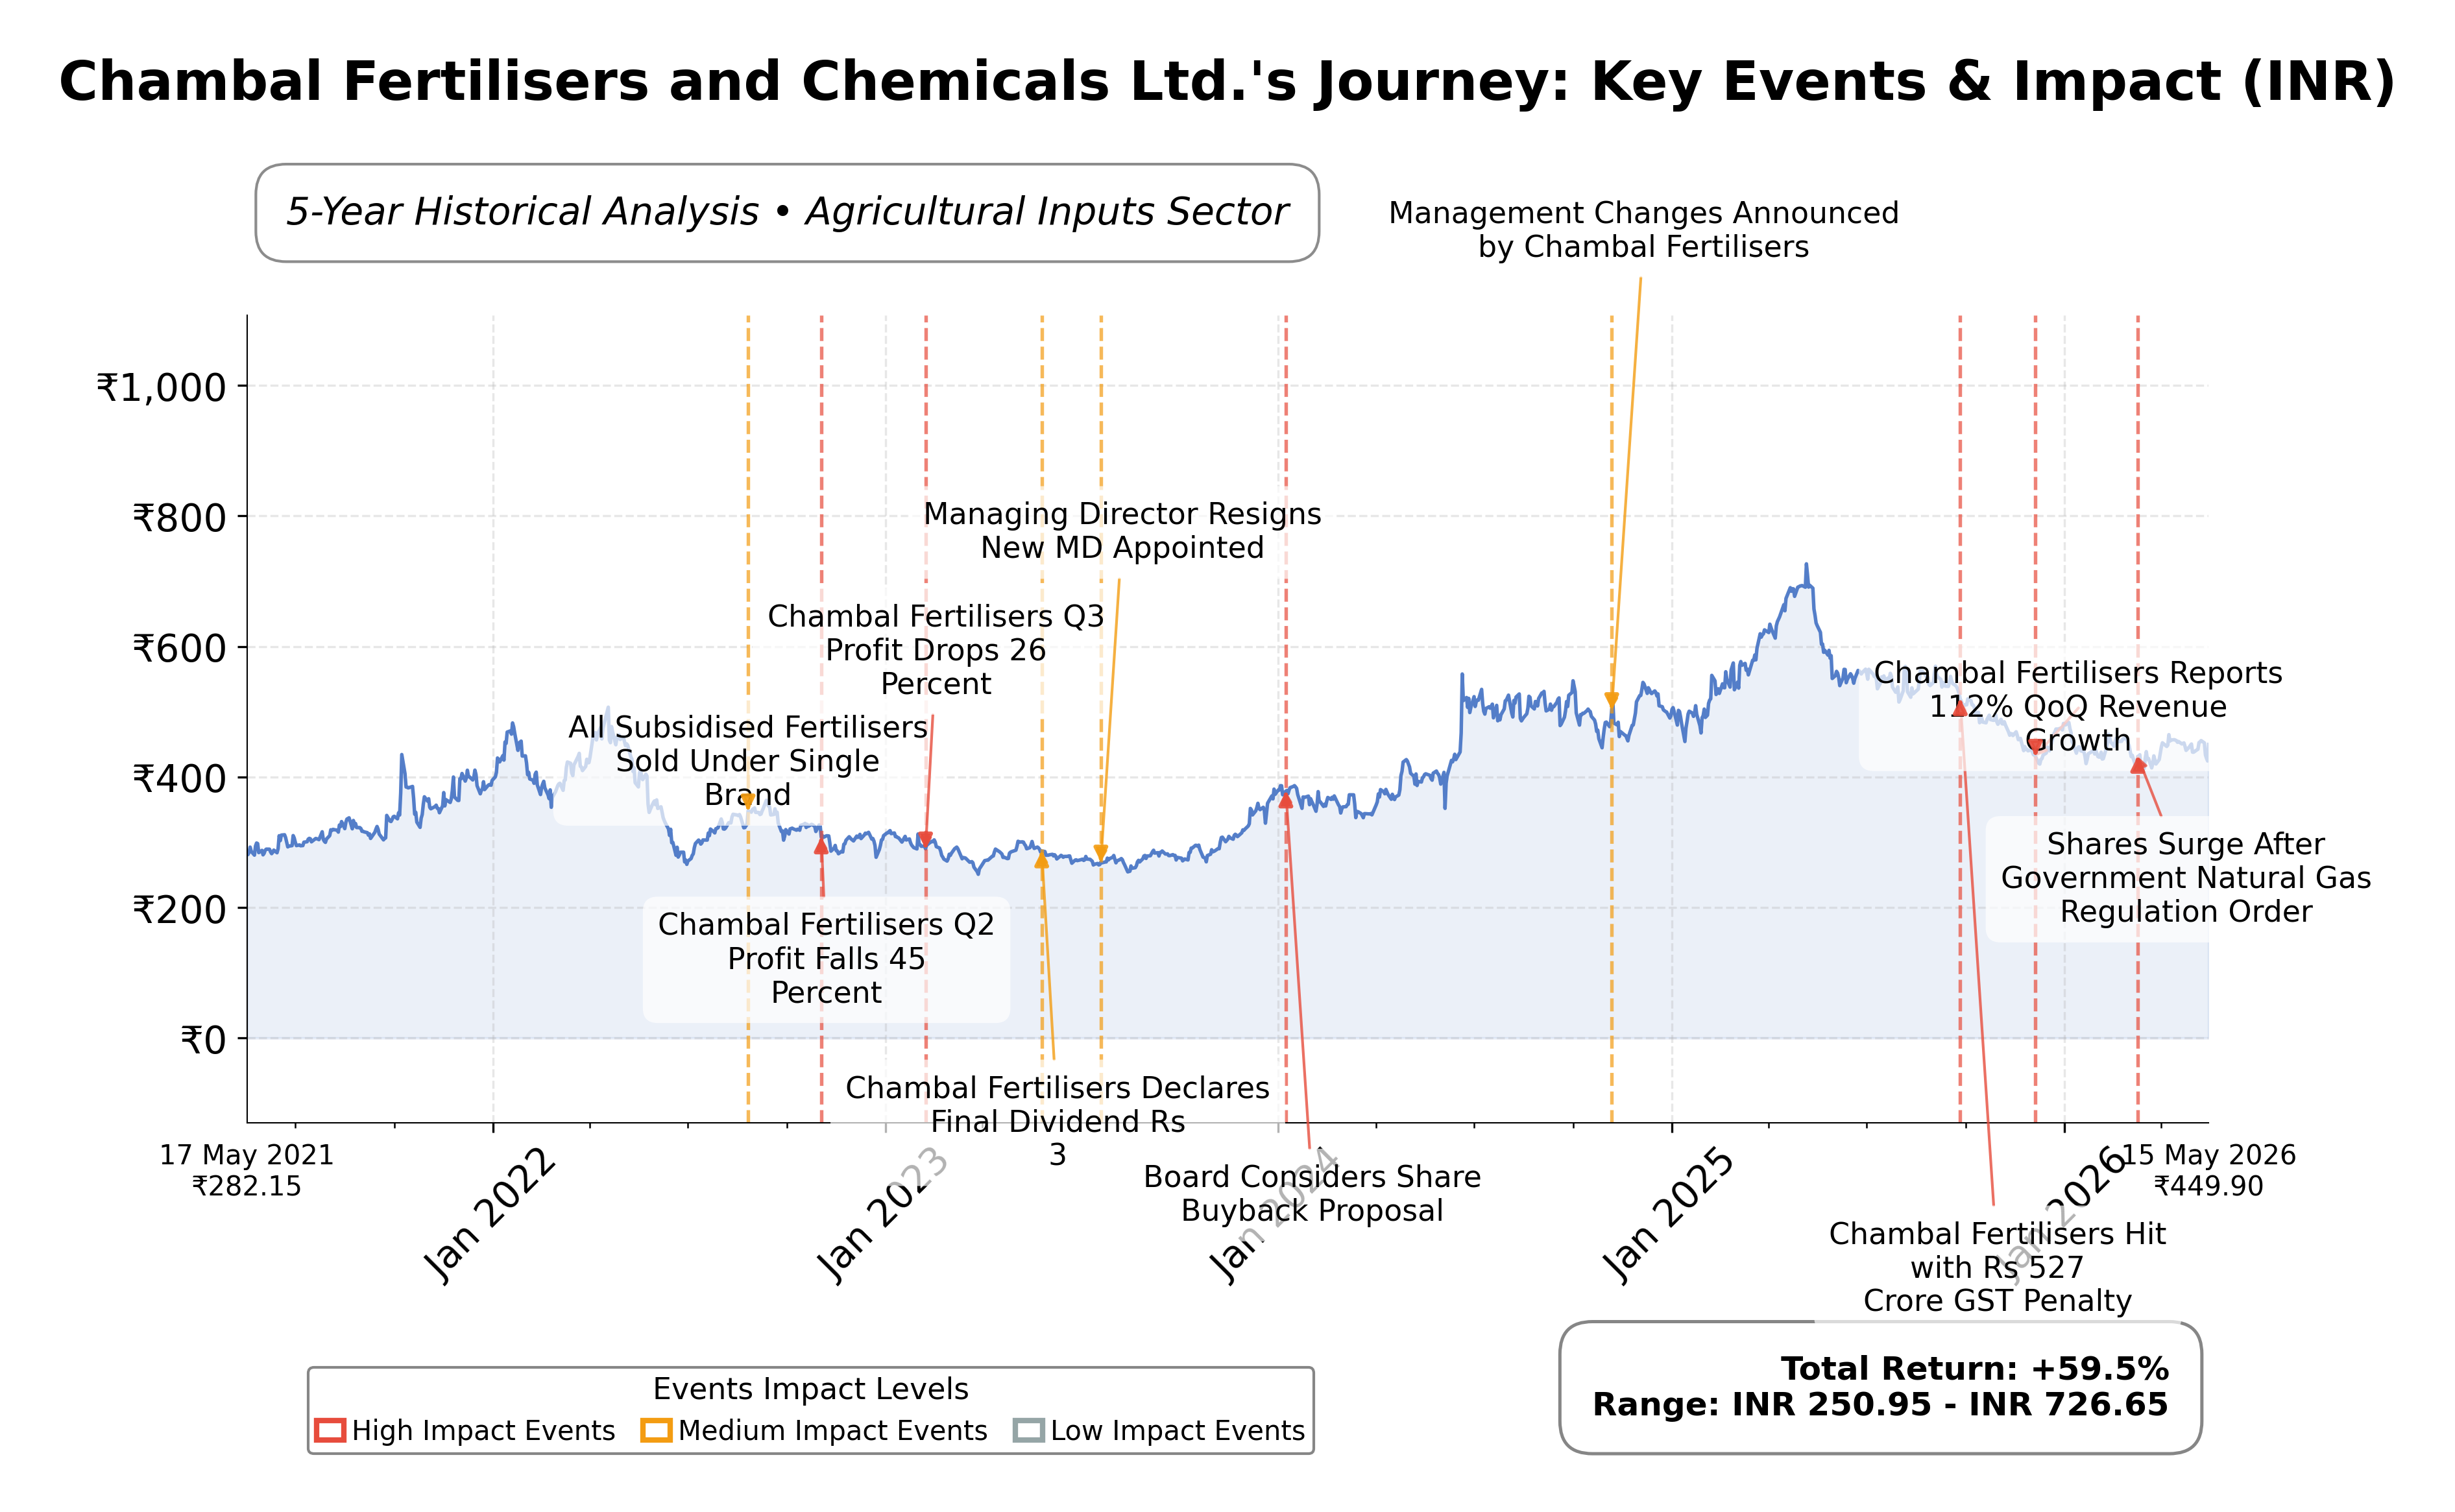
Stock Journey
Key Positives and Key Risks
Pros
- Attractive valuation with a trailing P/E of 9.42, below industry peers, indicating potential value.
- Strong profitability evidenced by an 18.93% return on equity and a net profit margin of 9.36%.
- Robust cash flow generation with operating cash flow of ₹1,730 crore and free cash flow of ₹1,649 crore supporting financial flexibility.
Cons
- Stock price is currently 29.5% below its 52-week high, reflecting recent market weakness.
- Exposure to regulatory risks related to fertilizer subsidies could impact margins and earnings.
- Input cost volatility and competitive pressures present ongoing challenges to profitability.
Disclosure: This information is for general awareness and does not constitute investment advice
Report Summary
Chambal Fertilisers and Chemicals Ltd. operates primarily in the agricultural inputs sector, focusing on the manufacturing and distribution of fertilizers, including urea, di-ammonium phosphate, and muriate of potash. Listed on the NSE in India under the symbol CHAMBLFERT, the company holds a significant position within the Basic Materials sector. It operates two technologically advanced plants in Rajasthan, serving a broad customer base from individual farmers to agricultural cooperatives, thereby playing a vital role in India's food security and rural development.
Financially, Chambal Fertilisers reported a trailing twelve-month revenue of approximately ₹20,457 crore with a gross margin of 35.5%, an operating margin of 12.4%, and a net profit margin of 9.36%. The company’s return on equity (ROE) stands at 18.93%, and return on assets (ROA) is 14.46%, indicating efficient capital utilization and profitability. Its return on invested capital (ROIC) is reflected in an enterprise value to EBITDA ratio of 6.17, underscoring operational efficiency and value creation.
Valuation metrics show a trailing price-to-earnings (P/E) ratio of 9.42 and a forward P/E of 11.03, with a price-to-book (P/B) ratio of 1.83. The market capitalization is approximately ₹180.25 billion. The stock currently trades at ₹449.90, positioned between its 52-week low of ₹399.75 and high of ₹632.55, reflecting a downside risk of about 29.5% from the 52-week high. These valuation figures suggest the stock is reasonably priced relative to its fundamentals and industry peers.
Chambal Fertilisers demonstrates notable strengths including strong cash flow generation with operating cash flow of ₹1,730 crore and free cash flow of ₹1,649 crore, a low debt level with a debt-to-equity ratio near 1.02, and a robust current ratio of 3.08 indicating liquidity. Key risks include exposure to regulatory changes in fertilizer subsidies, competitive pressures in the agrochemical industry, and macroeconomic factors affecting input costs. Recent strategic developments include the commissioning of a new TAN plant and expansion into complex fertilizers, which have driven recent revenue and profit growth.
Technically, the stock shows a moderate beta of 0.31, indicating lower volatility relative to the market. It trades above the 50-day moving average but below the 200-day moving average, suggesting mixed momentum. Recent news highlights strong quarterly earnings growth and dividend declarations, supporting a positive operational trajectory. Overall, current data suggest a balanced stance with attention warranted on market dynamics and sector developments.
Company and Industry Overview
Company Basics
Price Performance
Company Size
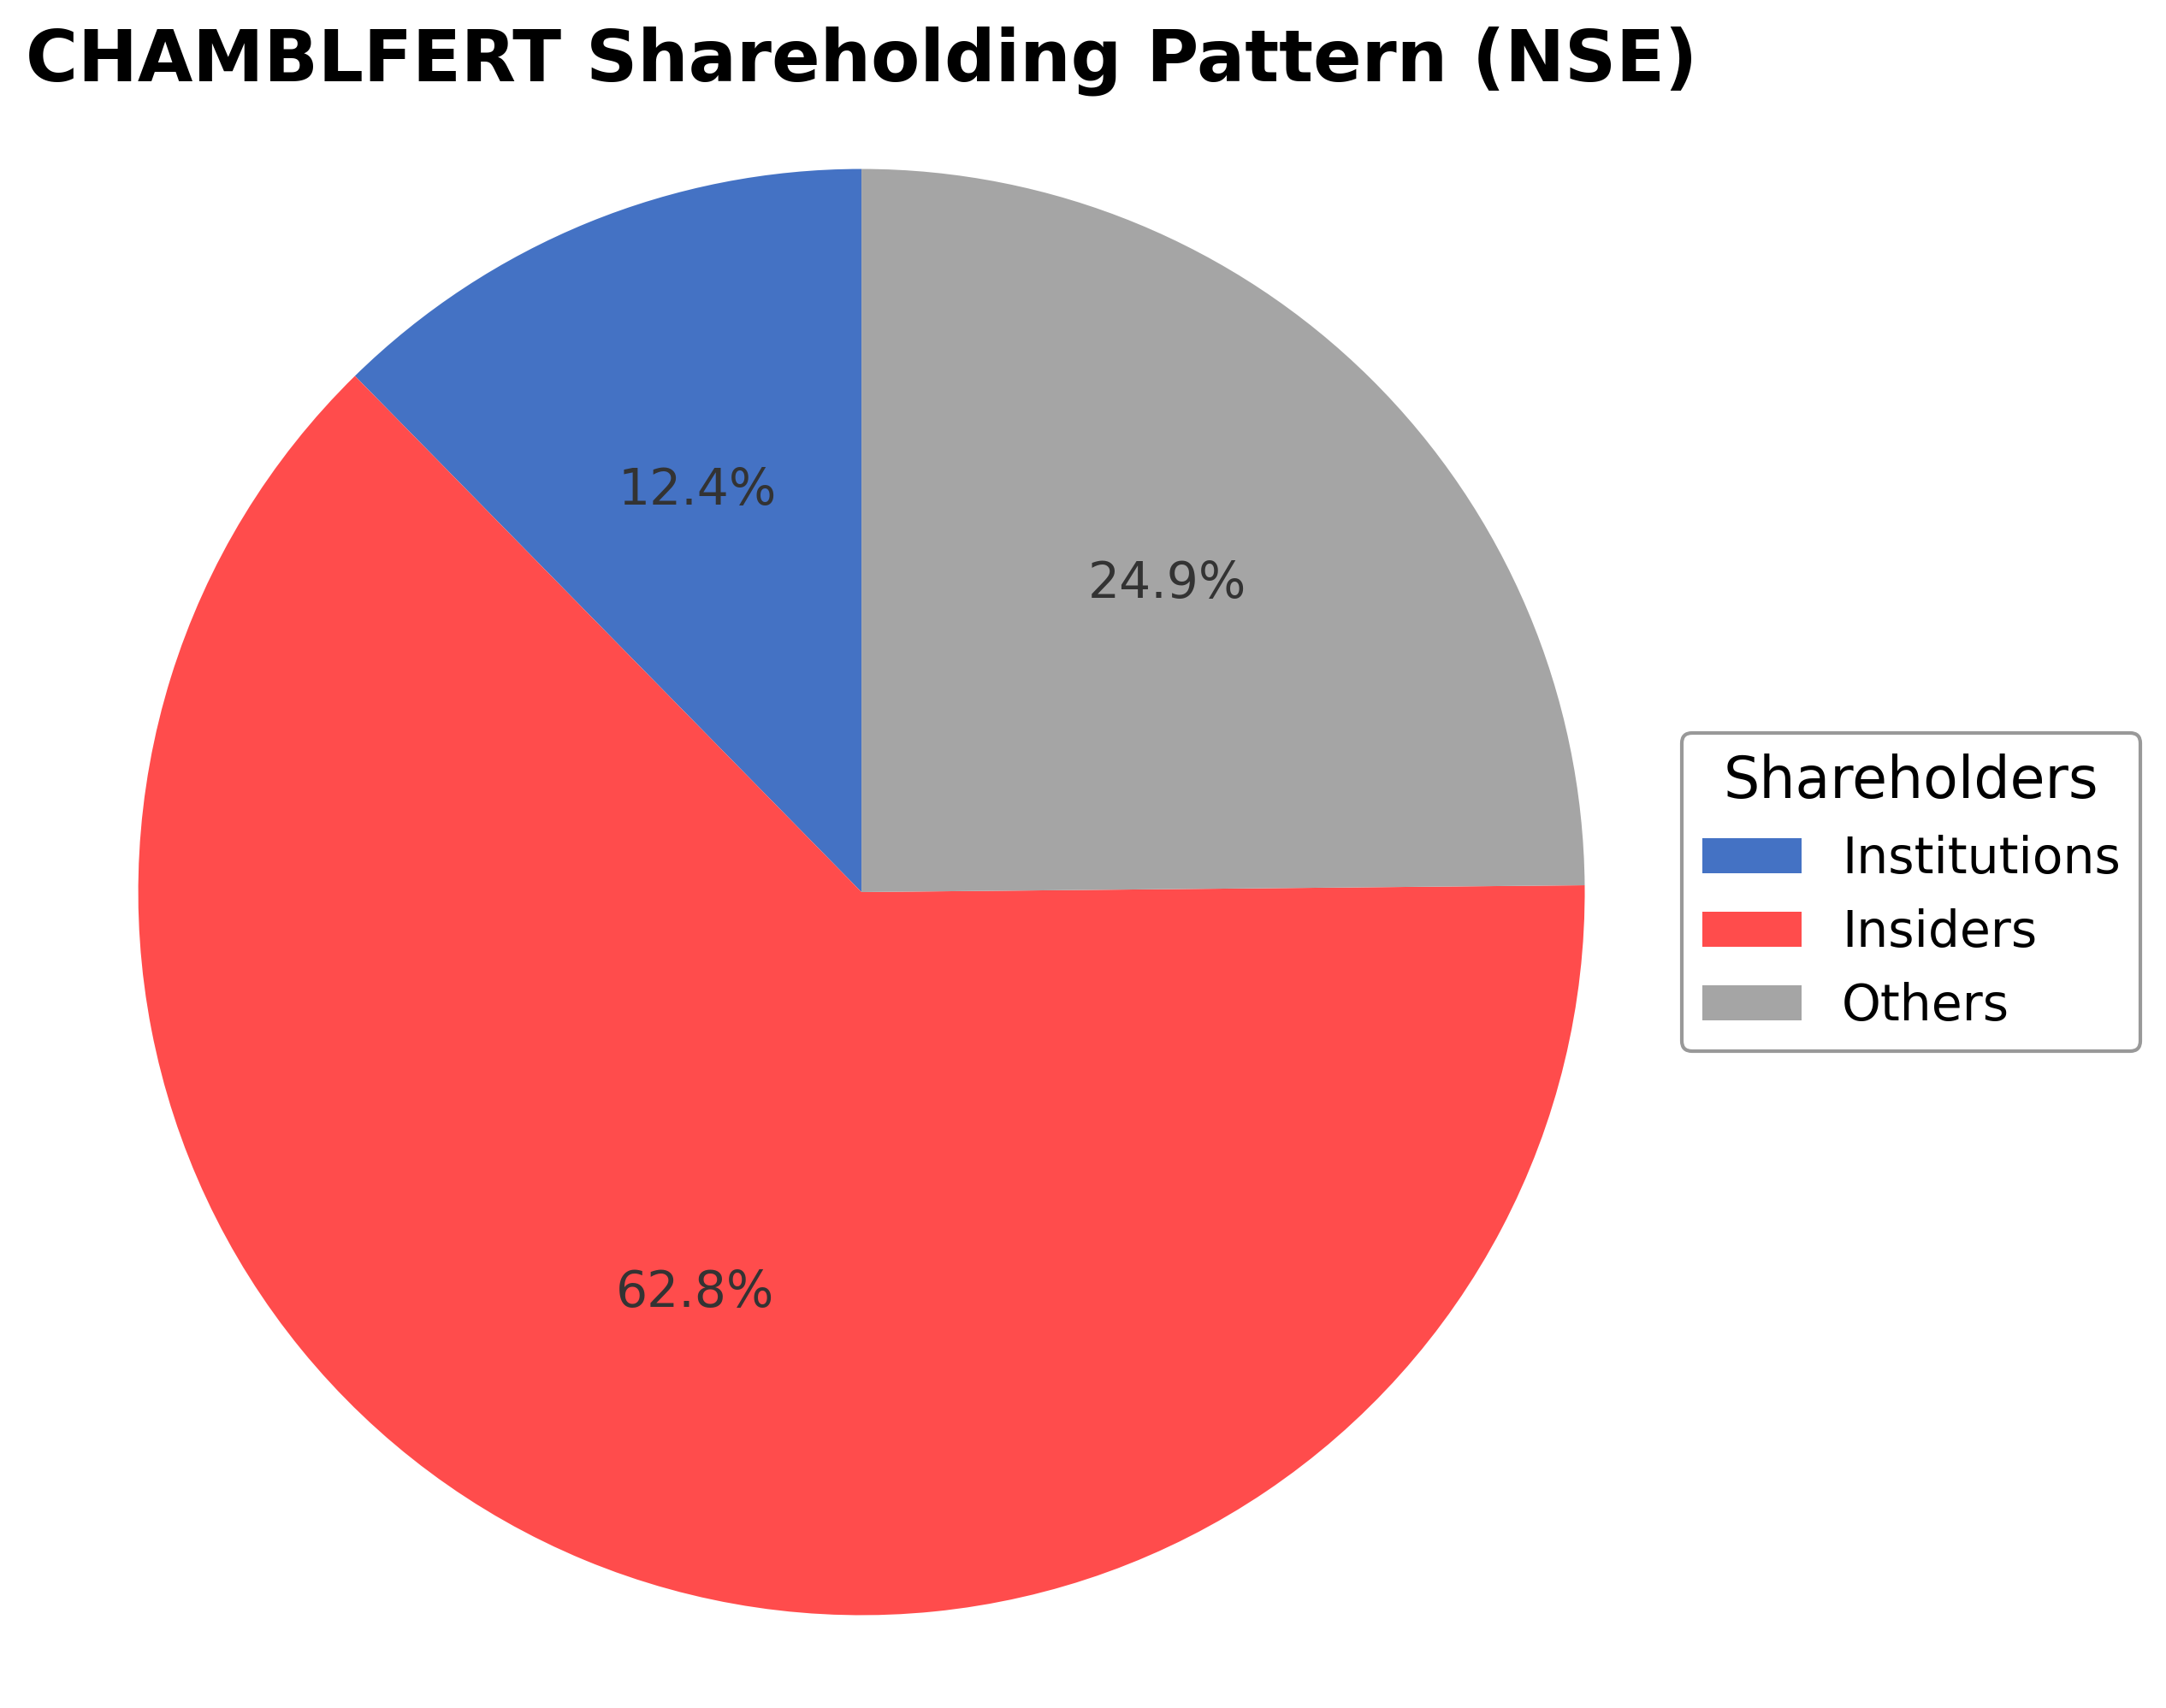
Shareholding Pattern
Sector and Industry Analysis
The Indian fertiliser sector is a significant component of the country's agricultural economy, with a market size driven by extensive farming activities and government subsidies. It comprises various segments including nitrogenous, phosphatic, and potassic fertilisers, with complex fertilisers and specialty nutrients gaining traction. Major players include Rashtriya Chemicals and Fertilizers Ltd, Paradeep Phosphates Ltd, and Coromandel International Ltd, alongside Chambal Fertilisers and Chemicals Ltd, which operates primarily in northern and central India.
Industry trends indicate a growing emphasis on specialty fertilisers and crop protection chemicals, reflecting farmers' increasing demand for higher crop yields and sustainable practices. Competitive dynamics are shaped by established distribution networks, product diversification, and technological innovation in nutrient formulations. Barriers to entry remain high due to capital-intensive manufacturing, regulatory compliance, and the need for extensive dealer networks, positioning incumbents with strong regional presence advantageously.
The regulatory landscape is characterized by government policies on fertiliser subsidies, pricing controls, and environmental norms affecting production and distribution. Recent reforms aim to rationalize subsidy mechanisms and promote balanced nutrient use, impacting industry profitability and operational strategies. Compliance with environmental regulations and quality standards continues to influence manufacturing practices and product offerings within the sector.
Note: Analysis synthesized from industry research, market reports, and regulatory filings. Information is subject to change based on market conditions.
Financial Ratios Dashboard
Illustrative Scenario Analysis
DCF Assumptions:
Method: Two-Stage EPS-Priority Model
Financials
Peer Analysis
| Company Name | Market Cap | P/E Ratio | P/B Ratio | EV/EBITDA | Price to CFO |
|---|---|---|---|---|---|
| Chambal Fertilisers and Chemicals Ltd. | ₹180.25B | 9.42 | 1.83 | 6.17 | 10.42 |
| Bayer CropScience Ltd. | ₹195.49B | 30.12 | 6.40 | 24.64 | -85.85 |
| Fertilisers & Chemicals Travancore Ltd. | ₹571.17B | 1999.09 | 41.39 | 133.08 | 546.98 |
| UPL Ltd. | ₹534.43B | 28.33 | 1.54 | 8.01 | 6.80 |
| Gujarat State Fertilizers & Chemicals Ltd. | ₹67.74B | 9.78 | 0.54 | 7.04 | 16.27 |
| Coromandel International Ltd. | ₹549.89B | 28.07 | 4.36 | 16.96 | 35.30 |
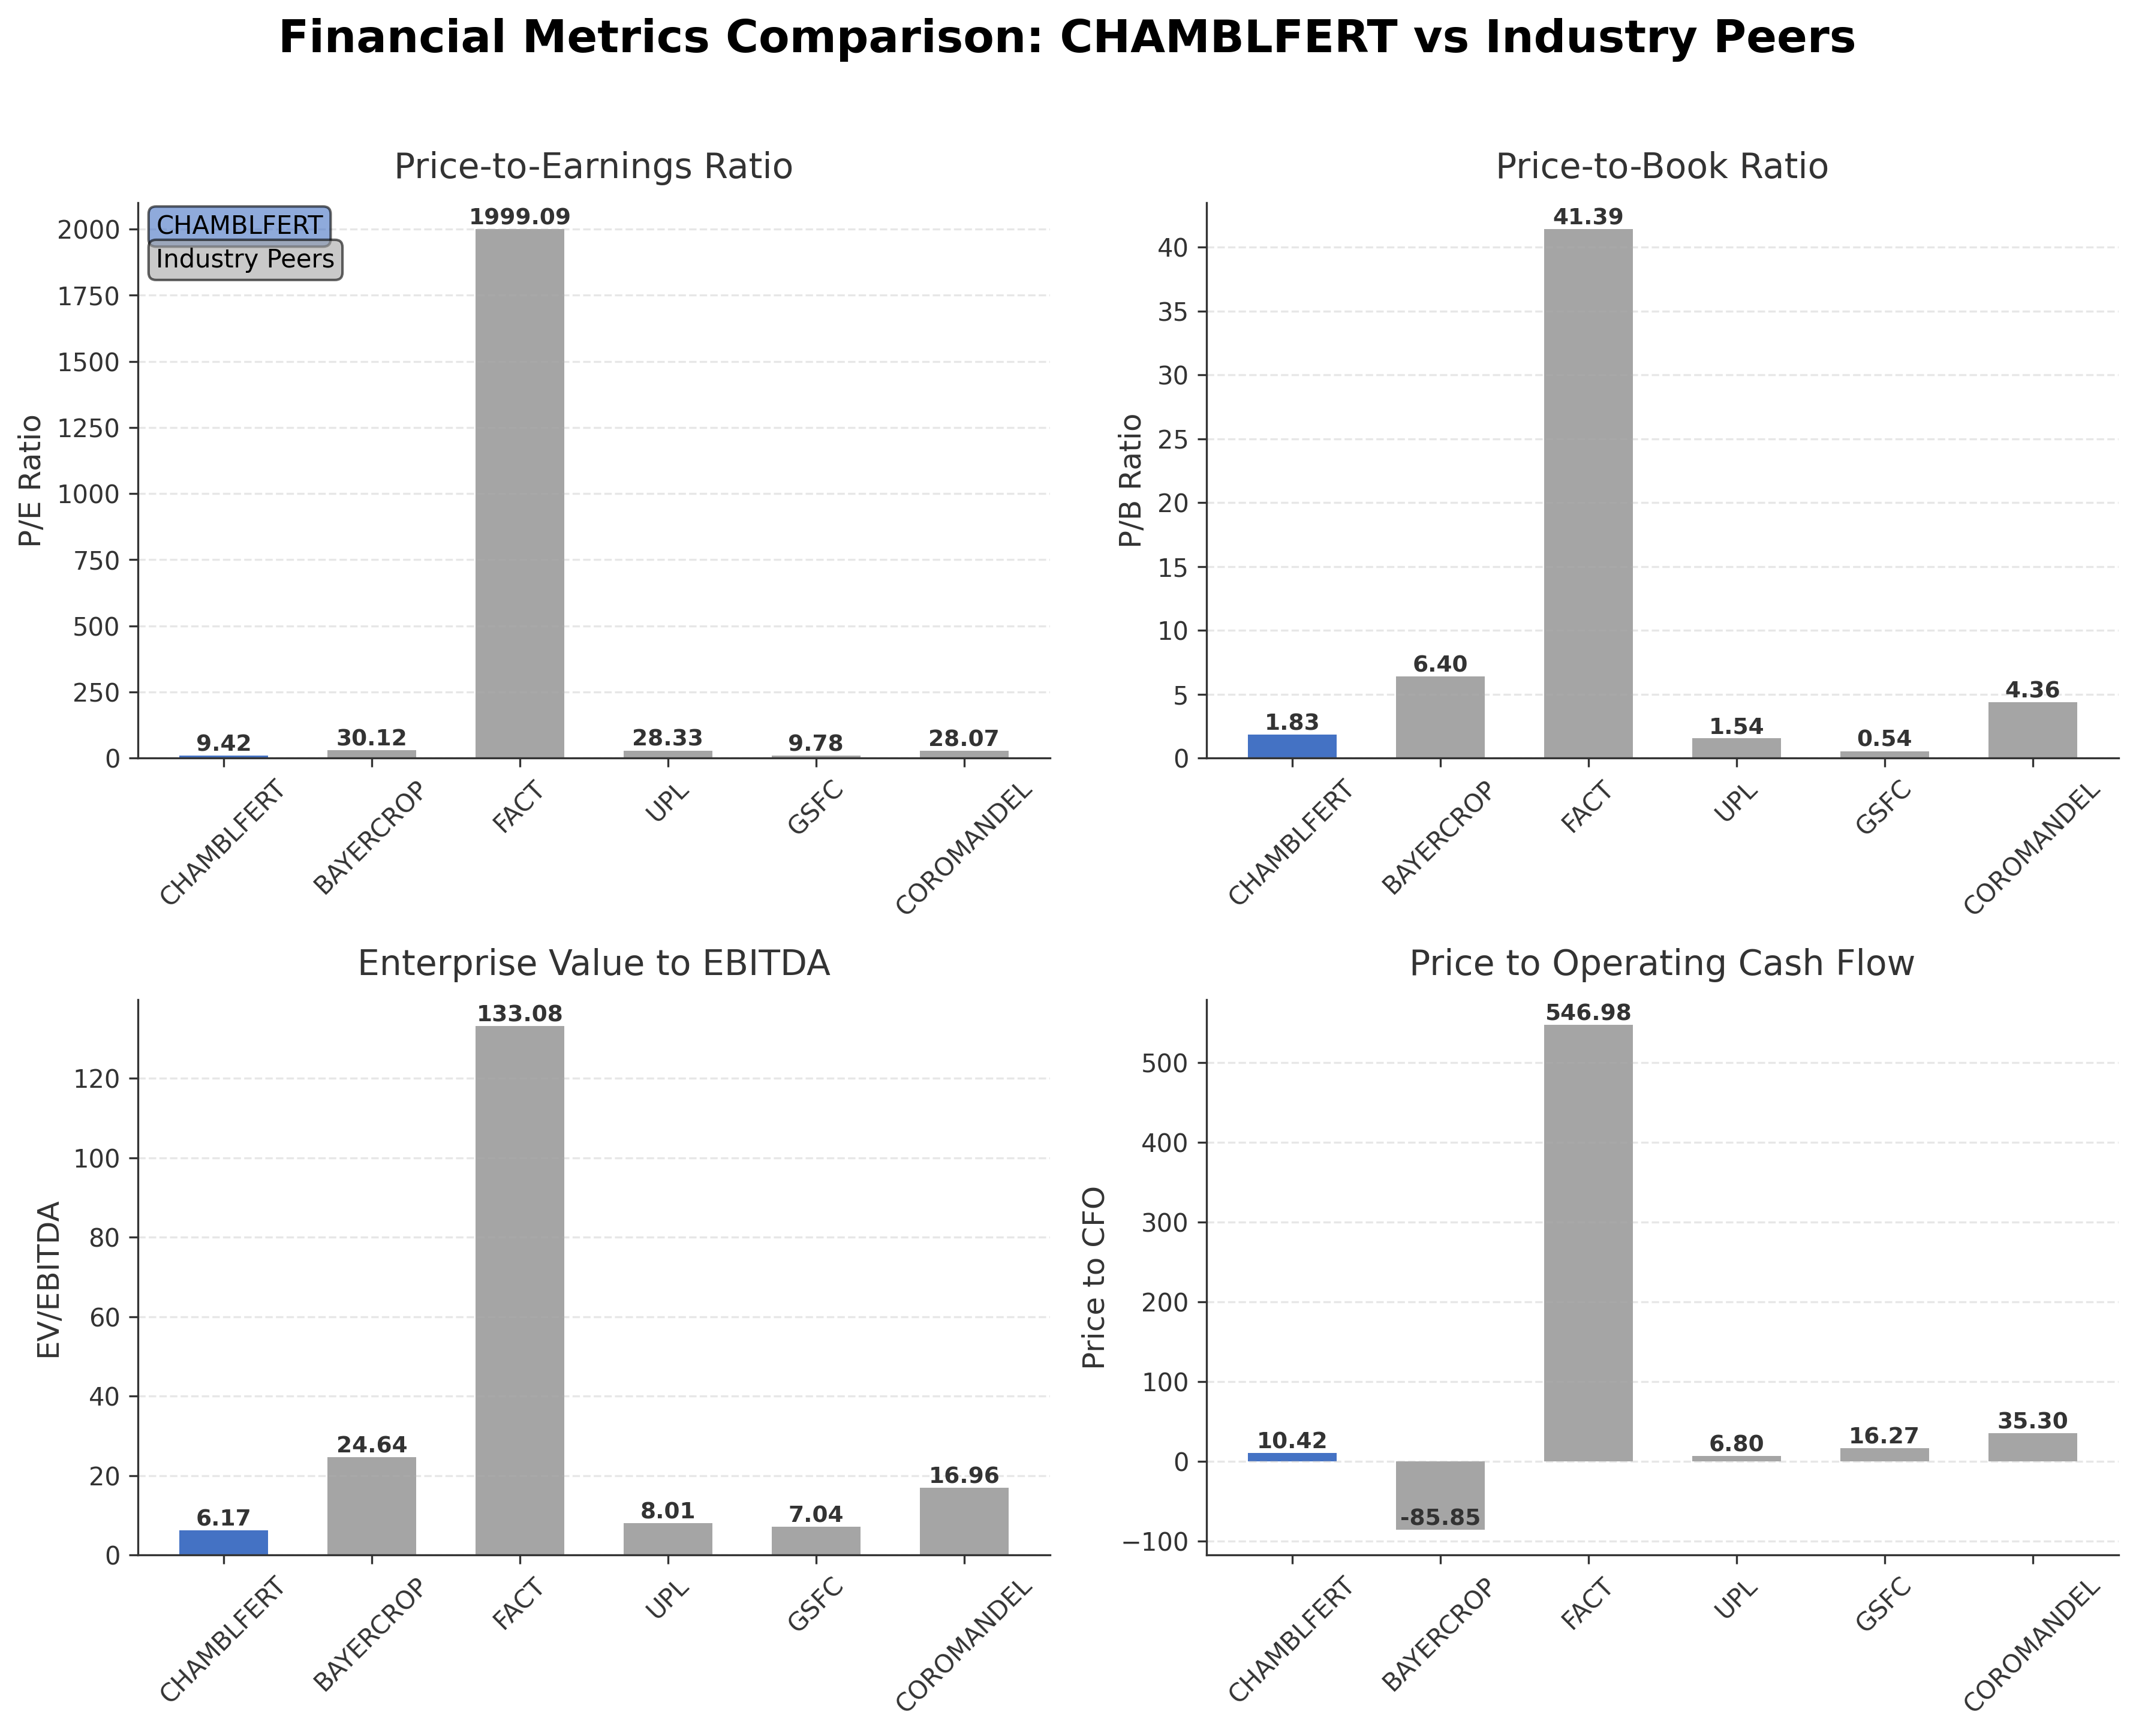
Comparison Analysis: Chambal Fertilisers and Chemicals Ltd. stands out among its Indian agricultural inputs peers with a comparatively low P/E ratio of 9.42 and a moderate P/B ratio of 1.83, indicating more attractive valuation metrics relative to companies like Bayer CropScience and Coromandel International, which trade at significantly higher multiples. Its EV/EBITDA ratio of 6.17 is among the lowest, suggesting efficient operational profitability. The company also exhibits a strong return on equity of 18.93%, surpassing most peers except Bayer CropScience. Price to CFO is moderate at 10.42, reflecting solid cash flow generation. Overall, Chambal Fertilisers offers a blend of reasonable valuation and robust profitability compared to its larger and more expensive industry peers.
Financial Metrics Comparison with Peers
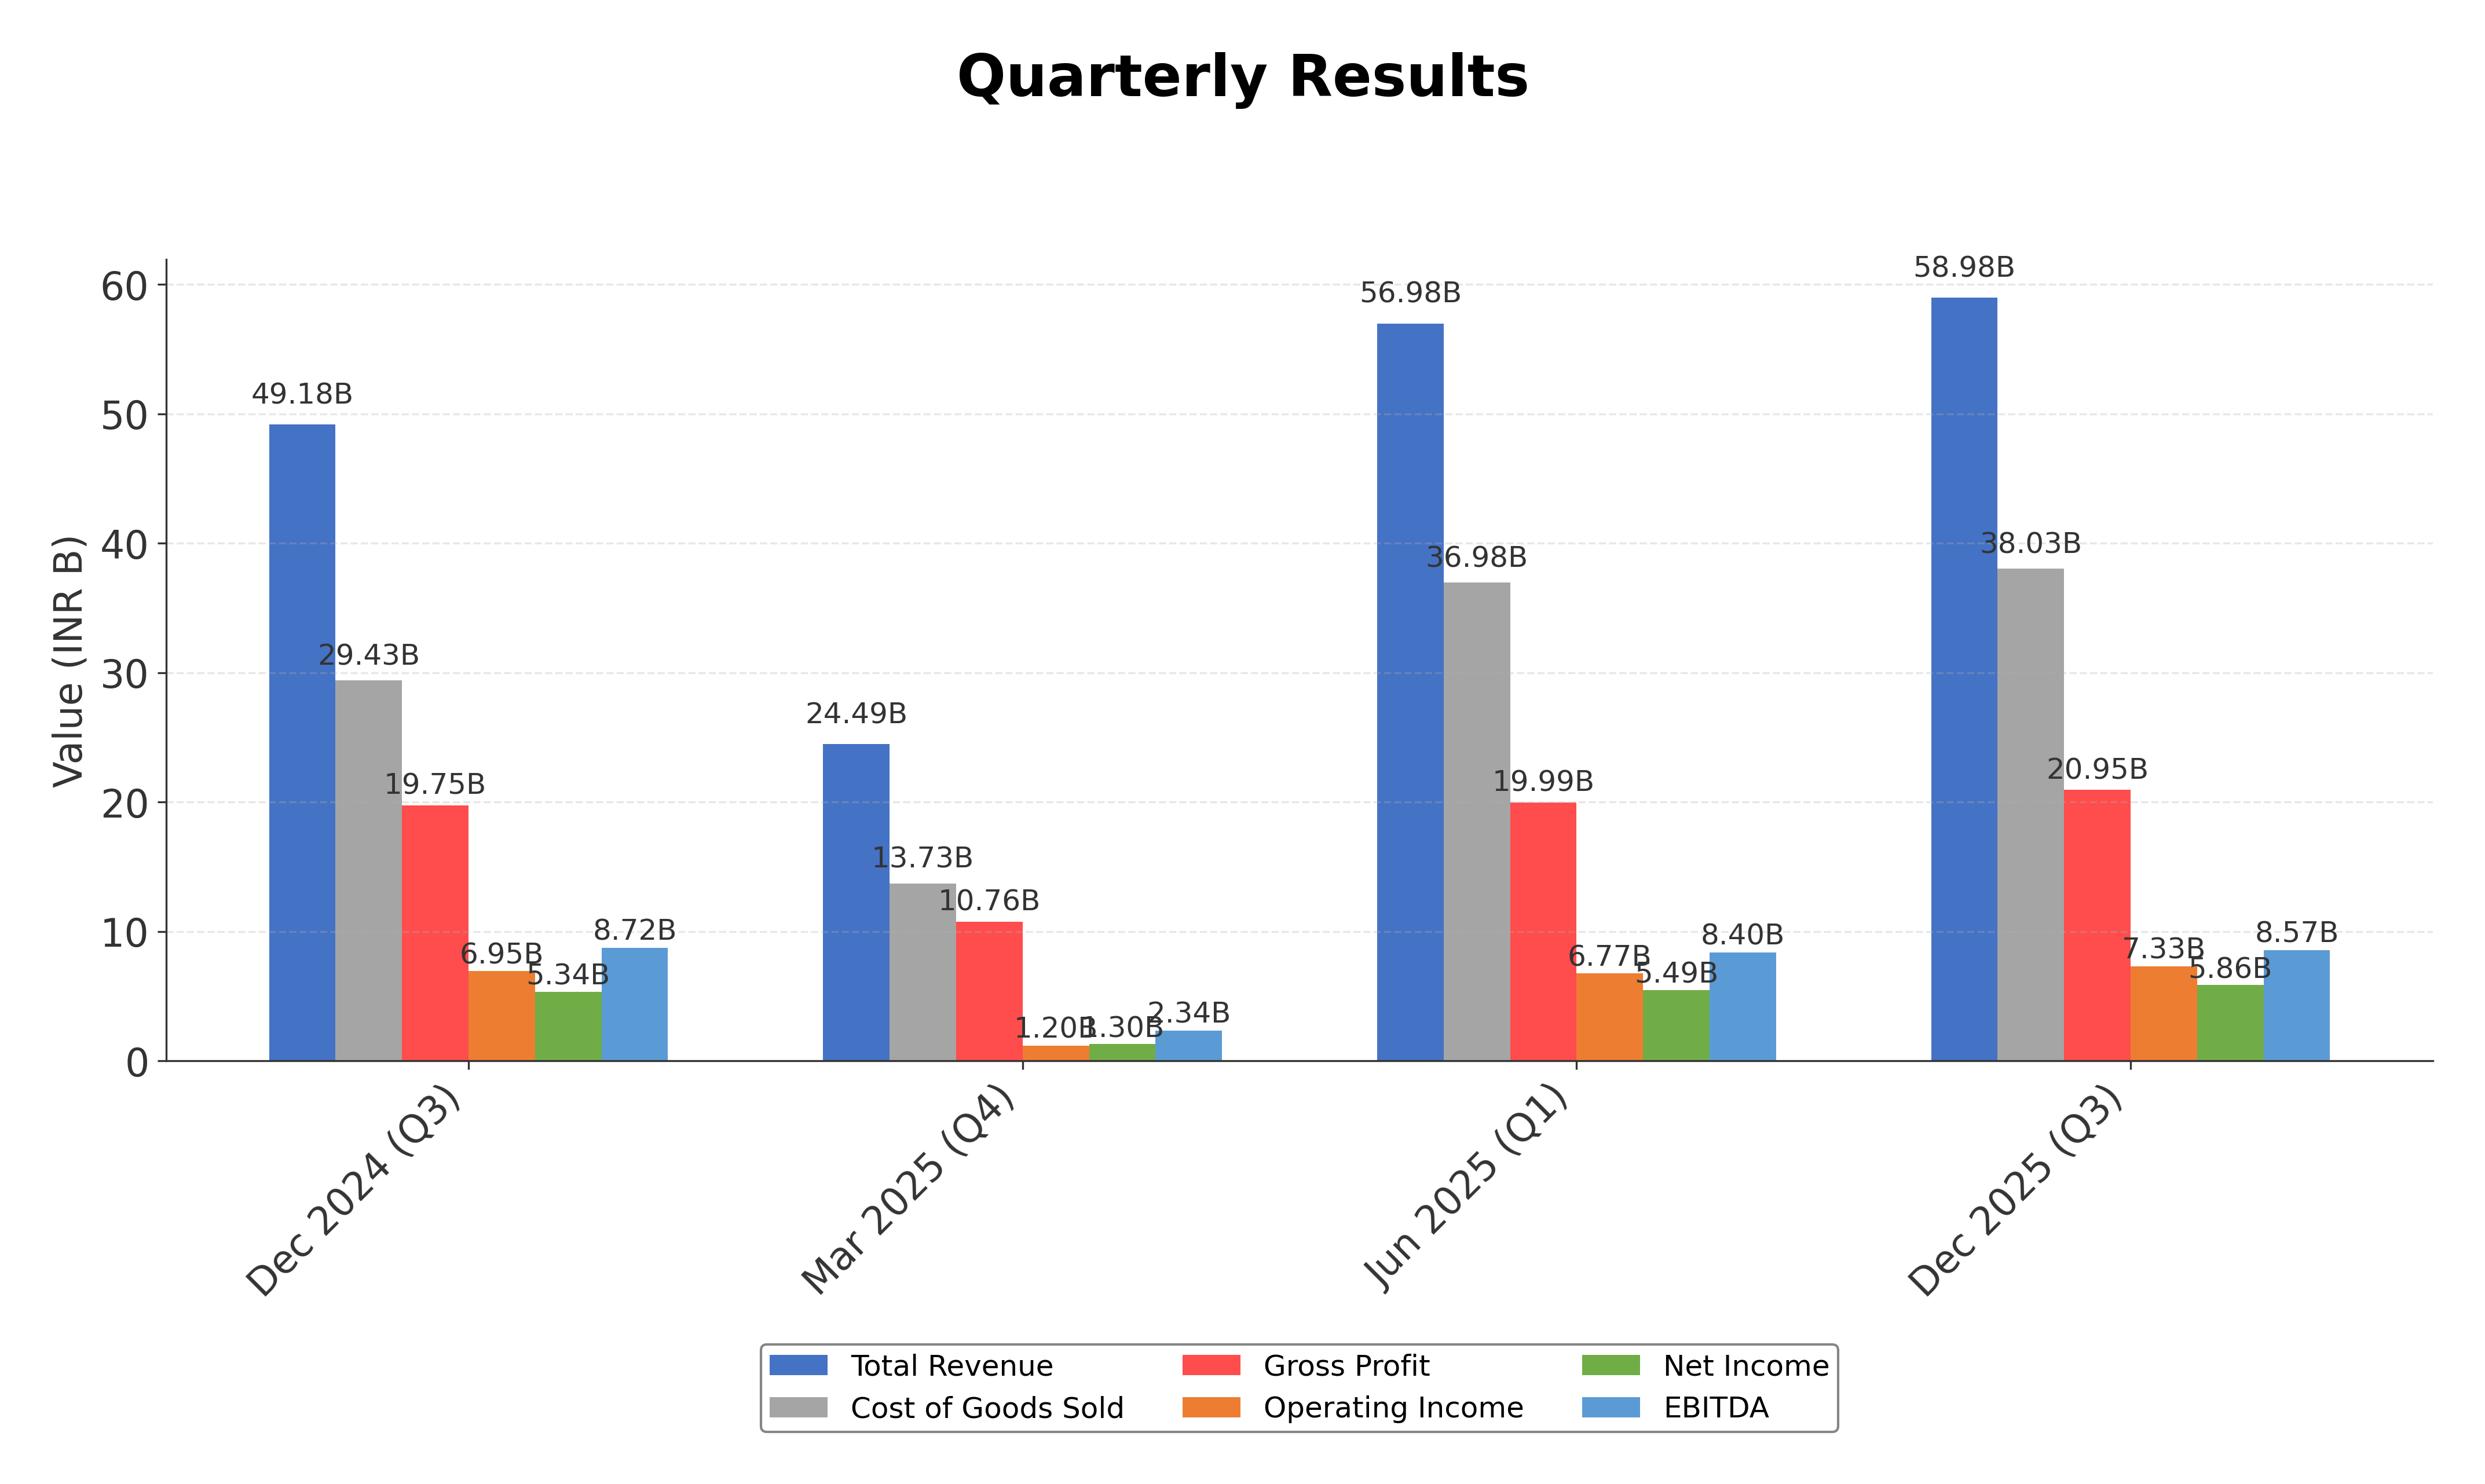
Financial Statements
Comprehensive financial data including income, balance sheet, and cash flow metrics
Income Statement
| fiscal_date | 2025-03-31 | 2024-03-31 | 2023-03-31 | 2022-03-31 | 2021-03-31 |
|---|---|---|---|---|---|
| Sales | 166.46B | 179.48B | 277.71B | 160.68B | 127.18B |
| Cost Of Goods | 94.93B | 110.72B | 198.83B | 97.64B | 74.73B |
| Gross Profit | 71.53B | 68.76B | 78.89B | 63.03B | 52.44B |
| Operating Expense Research And Development | 34.00M | 33.30M | 34.40M | 33.60M | 31.70M |
| Operating Expense Selling General And Administrative | 535.80M | 612.90M | 549.70M | 453.00M | 433.50M |
| Operating Expense Other Operating Expenses | 43.36B | 45.38B | 57.37B | 37.89B | 25.34B |
| Operating Income | 21.91B | 17.53B | 15.92B | 19.83B | 21.90B |
| Non Operating Interest Income | 210.30M | 262.90M | 272.20M | 93.00M | 137.40M |
| Non Operating Interest Expense | 329.90M | 1.61B | 2.91B | 1.04B | 2.61B |
| Pretax Income | 24.52B | 18.87B | 14.16B | 22.31B | 23.60B |
| Income Tax | 8.02B | 6.11B | 3.83B | 6.65B | 6.12B |
| Net Income | 16.49B | 12.76B | 10.34B | 15.66B | 17.48B |
| Eps Basic | 41.17 | 30.84 | 24.85 | 37.62 | 39.76 |
| Eps Diluted | 41.17 | 30.84 | 24.85 | 37.62 | 39.76 |
| Basic Shares Outstanding | 400.65M | 413.66M | 416.21M | 416.21M | 416.21M |
| Diluted Shares Outstanding | 400.65M | 413.66M | 416.21M | 416.21M | 416.21M |
| Ebit | 24.85B | 20.48B | 17.07B | 23.35B | 26.21B |
| Ebitda | 26.63B | 21.52B | 19.45B | 25.99B | 25.95B |
| Net Income Continuous Operations | 24.52B | 18.87B | 14.16B | 22.31B | 23.60B |
| Minority Interests | 1.20M | 500.00K | 4.30M | -9.80M | -928.30M |
| Preferred Stock Dividends | 0.00 | 0.00 | 0.00 | 0.00 | 0.00 |
Source: Financial statements and regulatory filings
Balance Sheet
| fiscal_date | 2025-03-31 | 2024-03-31 | 2023-03-31 | 2022-03-31 | 2021-03-31 |
|---|---|---|---|---|---|
| Cash And Cash Equivalents | 1.08B | 1.10B | 369.30M | 5.32B | 8.88B |
| Accounts Receivable | 3.68B | 1.92B | 17.60B | 21.51B | 11.75B |
| Total Assets | 114.07B | 115.09B | 127.70B | 132.89B | 102.47B |
| Total Liabilities | 26.95B | 42.51B | 57.17B | 69.03B | 50.11B |
| Long Term Debt | 938.10M | 11.60B | 18.39B | 24.80B | 31.59B |
| Shareholders Equity | 87.12B | 72.58B | 70.53B | 63.86B | 52.36B |
Source: Financial statements and regulatory filings
Cash Flow Statement
| fiscal_date | 2025-03-31 | 2024-03-31 | 2023-03-31 | 2022-03-31 | 2021-03-31 |
|---|---|---|---|---|---|
| Operating Activities Net Income | 24.52B | 18.87B | 14.16B | 22.31B | 23.60B |
| Operating Activities Other Non Cash Items | 125.70M | 1.40B | 2.93B | 898.00M | -914.90M |
| Operating Activities Accounts Receivable | -1.77B | 15.66B | 3.91B | -9.77B | 43.89B |
| Operating Activities Other Assets Liabilities | -5.57B | 2.25B | 13.74B | -22.10B | 5.29B |
| Operating Activities Operating Cash Flow | 17.30B | 38.19B | 34.74B | -8.66B | 71.85B |
| Investing Activities Capital Expenditures | -5.69B | -6.07B | -1.93B | -1.62B | -2.34B |
| Investing Activities Net Intangibles | -11.60M | -15.40M | -11.90M | -14.90M | -10.00M |
| Investing Activities Purchase Of Investments | -156.85B | -138.45B | -169.26B | -2.60M | -5.40M |
| Investing Activities Sale Of Investments | 168.35B | 139.10B | 151.30B | 81.10M | 11.30M |
| Investing Activities Investing Cash Flow | 5.81B | -5.41B | -19.89B | -1.54B | -2.34B |
| Financing Activities Long Term Debt Payments | -17.84B | -15.25B | -40.39B | -9.85B | -90.26B |
| Financing Activities Short Term Debt Issuance | 0.00 | -6.50B | -3.76B | 10.49B | -49.34B |
| Financing Activities Common Stock Repurchase | 0.00 | -8.65B | 0.00 | N/A | N/A |
| Financing Activities Common Dividends | -3.21B | -3.12B | -3.12B | -3.74B | -1.25B |
| Financing Activities Other Financing Charges | -200.00K | N/A | 6.50M | 18.90M | 24.80M |
| Financing Activities Financing Cash Flow | -21.04B | -33.52B | -47.26B | -3.07B | -140.80B |
| End Cash Position | 1.08B | 1.10B | 369.30M | 5.32B | 8.88B |
| Free Cash Flow | 8.21B | 27.14B | 30.42B | -2.03B | 67.08B |
| Investing Activities Other Investing Activity | N/A | 9.20M | -5.90M | -2.60M | -5.40M |
| Financing Activities Common Stock Issuance | N/A | N/A | N/A | 18.90M | 24.80M |
| Operating Activities Stock Based Compensation | N/A | N/A | N/A | N/A | 0.00 |
| Investing Activities Net Acquisitions | N/A | N/A | N/A | N/A | 0.00 |
| Financing Activities Long Term Debt Issuance | N/A | N/A | N/A | N/A | 0.00 |
Source: Financial statements and regulatory filings
Technical Analysis
Key Insights
- Current trend shows mixed price action with the stock trading above its 50-day moving average (₹440.24) but below the 200-day moving average (₹470.43), indicating potential short-term strength amid longer-term resistance.
- Key support levels are identified near ₹400, close to the 52-week low, while resistance is observed around ₹470 and ₹630, corresponding to the 200-day moving average and 52-week high respectively.
- The stock is positioned above the 10-day and 50-day moving averages, suggesting short-term momentum, but remains below the 200-day moving average, indicating a neutral to slightly bearish longer-term trend.
- Momentum indicators show the RSI in a neutral range, MACD near the signal line indicating limited momentum, and stochastic oscillators reflecting consolidation without clear directional bias.
- Multi-timeframe analysis reveals daily charts showing consolidation, weekly charts indicating sideways movement, and monthly charts suggesting a longer-term downtrend from the 52-week high.
- Potential market scenarios include a breakout above the 200-day moving average for renewed bullish momentum or a retest of support near ₹400 if selling pressure intensifies.
Trending News
1. Headline: Chambal Fertilisers Shares Soar on Strong Q4 Results, Record DAP Imports | Whalesbook
Summary: Chambal Fertilisers stock jumped 6% after robust Q4 earnings and record Indian DAP imports, highlighting company strength amid global supply issues.
Sentiment: positive
Summary: FY 2026 delivered strong revenue and profit growth, driven by robust performance in complex fertilizers and specialty segments, despite global volatility. The TAN project commissioning and strategic inventory management position the company for continued growth.Based on Chambal Fertilisers & ...
Sentiment: positive
3. Headline: Chambal Fertilisers rallies 6% as Q4 net profit climbs to Rs 169 crore- Moneycontrol.com
Summary: The stock was trading at Rs 451.15, up Rs 26.55, or 6.25 percent, in afternoon trade on May 15.
Sentiment: positive
Summary: FY26 saw 25% revenue growth and 18% higher net profit, driven by strong performance in crop protection, speciality nutrients, and new industrial chemicals. The company maintained a robust balance sheet, expanded its product portfolio, and commissioned a major TAN plant.Original document: Chambal ...
Sentiment: positive
5. Headline: Chambal Fertilisers Reports 30% Q4 Profit Jump, Shares Cautious | Whalesbook
Summary: Chambal Fertilisers' Q4 net profit jumped 30% with strong margin gains, but its shares dipped slightly. Investors remain cautious due to sector headwinds and volatile input costs.
Sentiment: positive
Recent Updates
News Summary
As of May 14, 2026. Chambal Fertilisers reported a 30% surge in Q4 net profit driven by a 56.1% increase in EBITDA to ₹255.1 crore and expansion of EBITDA margin to 9.2% from 6.7% year-over-year. Quarterly revenue rose 13.7% to ₹2,785 crore. The company’s board recommended a final dividend of ₹6 per equity share, reflecting strong shareholder returns. Additionally, the firm achieved a 46% year-on-year increase in Q4 net profit to ₹145 crore and an 18% rise in full-year profit for FY26, with revenue climbing to ₹20,794 crore. The strong quarterly performance was supported by record DAP imports and operational efficiencies, underscoring the company’s robust market position amid global supply challenges.
News Sentiment
The overall sentiment across recent updates is positive, driven by strong quarterly earnings growth, margin expansion, and strategic initiatives such as the commissioning of the TAN plant and product portfolio expansion. Dividend declarations further enhance shareholder value perception. However, cautious investor behavior is noted due to sector headwinds and input cost volatility, tempering enthusiasm. The balance of strong financial results and operational momentum against external risks results in a generally constructive but measured outlook.
Source List
Analytical Overview
Analysis Summary
Chambal Fertilisers’ valuation metrics, including a trailing P/E of 9.42 and forward P/E of 11.03, are below the industry average, suggesting the stock is attractively valued relative to peers. The PEG ratio near 1.01 indicates valuation is aligned with growth expectations. Revenue growth of 19.9% quarterly and positive cash flow trends, with operating cash flow of ₹1,730 crore and free cash flow of ₹1,649 crore, demonstrate a solid growth trajectory. The company maintains financial health with a low total debt of ₹100 crore against cash reserves of ₹915 crore, and a strong current ratio of 3.08, indicating liquidity and manageable leverage. Sector-specific opportunities include increasing demand for complex fertilizers and specialty nutrients, while challenges involve regulatory subsidy frameworks and input cost volatility. Considering India-specific factors, the company benefits from government focus on agricultural productivity and rural development, but must navigate subsidy policy changes and commodity price fluctuations.
Overall Business and Market Assessment
Supporting Factors: strong profitability with an 18.93% ROE, robust cash flow generation, and recent strategic expansions such as the TAN plant commissioning
Risk Factors: regulatory changes impacting fertilizer subsidies, competitive pressures, and input cost volatility
SWOT Analysis
Strengths
- Strong market position as a leading fertilizer producer in India.
- Robust profitability with a return on equity of 18.93%.
- Healthy liquidity with a current ratio above 3.0 and low debt levels.
- Technologically advanced production facilities ensuring operational efficiency.
Weaknesses
- Moderate dependence on government subsidy policies affecting margins.
- Relatively low institutional ownership which may limit broader market support.
- Stock trading below 52-week high indicating recent price weakness.
- Limited diversification outside core fertilizer products.
Opportunities
- Expansion into complex fertilizers and specialty nutrients segments.
- Growing demand for agricultural inputs driven by government initiatives.
- Commissioning of new TAN plant enhancing production capacity.
- Potential to capitalize on favorable import trends and supply chain efficiencies.
Threats
- Volatility in input raw material prices impacting cost structure.
- Regulatory risks related to fertilizer subsidy reforms.
- Competitive pressures from domestic and international agrochemical firms.
- Macroeconomic uncertainties affecting agricultural sector demand.
Company Description
Chambal Fertilisers and Chemicals Ltd. is a prominent player in the agrochemicals industry, primarily focused on manufacturing and distributing fertilizers. Established as one of India’s leading fertilizer producers, Chambal Fertilisers plays a critical role in enhancing agricultural productivity in the nation. The company’s flagship product is urea, a widely used nitrogen-based fertilizer essential for increasing crop yield. Chambal Fertilisers operates two state-of-the-art plants located in Rajasthan, which boast advanced technology aimed at ensuring efficient production and minimal environmental impact. Beyond urea, the company offers an array of other agricultural inputs, including di-ammonium phosphate and muriate of potash, to support balanced crop nutrition. Serving a diverse client base, including individual farmers and agricultural cooperatives, Chambal Fertilisers impacts sectors such as food production, crop management, and sustainable farming practices. In the broader financial market, the company holds significance due to its contribution to food security and rural development in India. As an essential component of the agricultural supply chain, Chambal Fertilisers is instrumental in addressing the nutritional needs of a growing population, thereby securing its place as a vital entity within the agrochemical industry.