


Central Depository Services (India) Ltd (CDSL)
Stock Analysis Report
Stock Journey
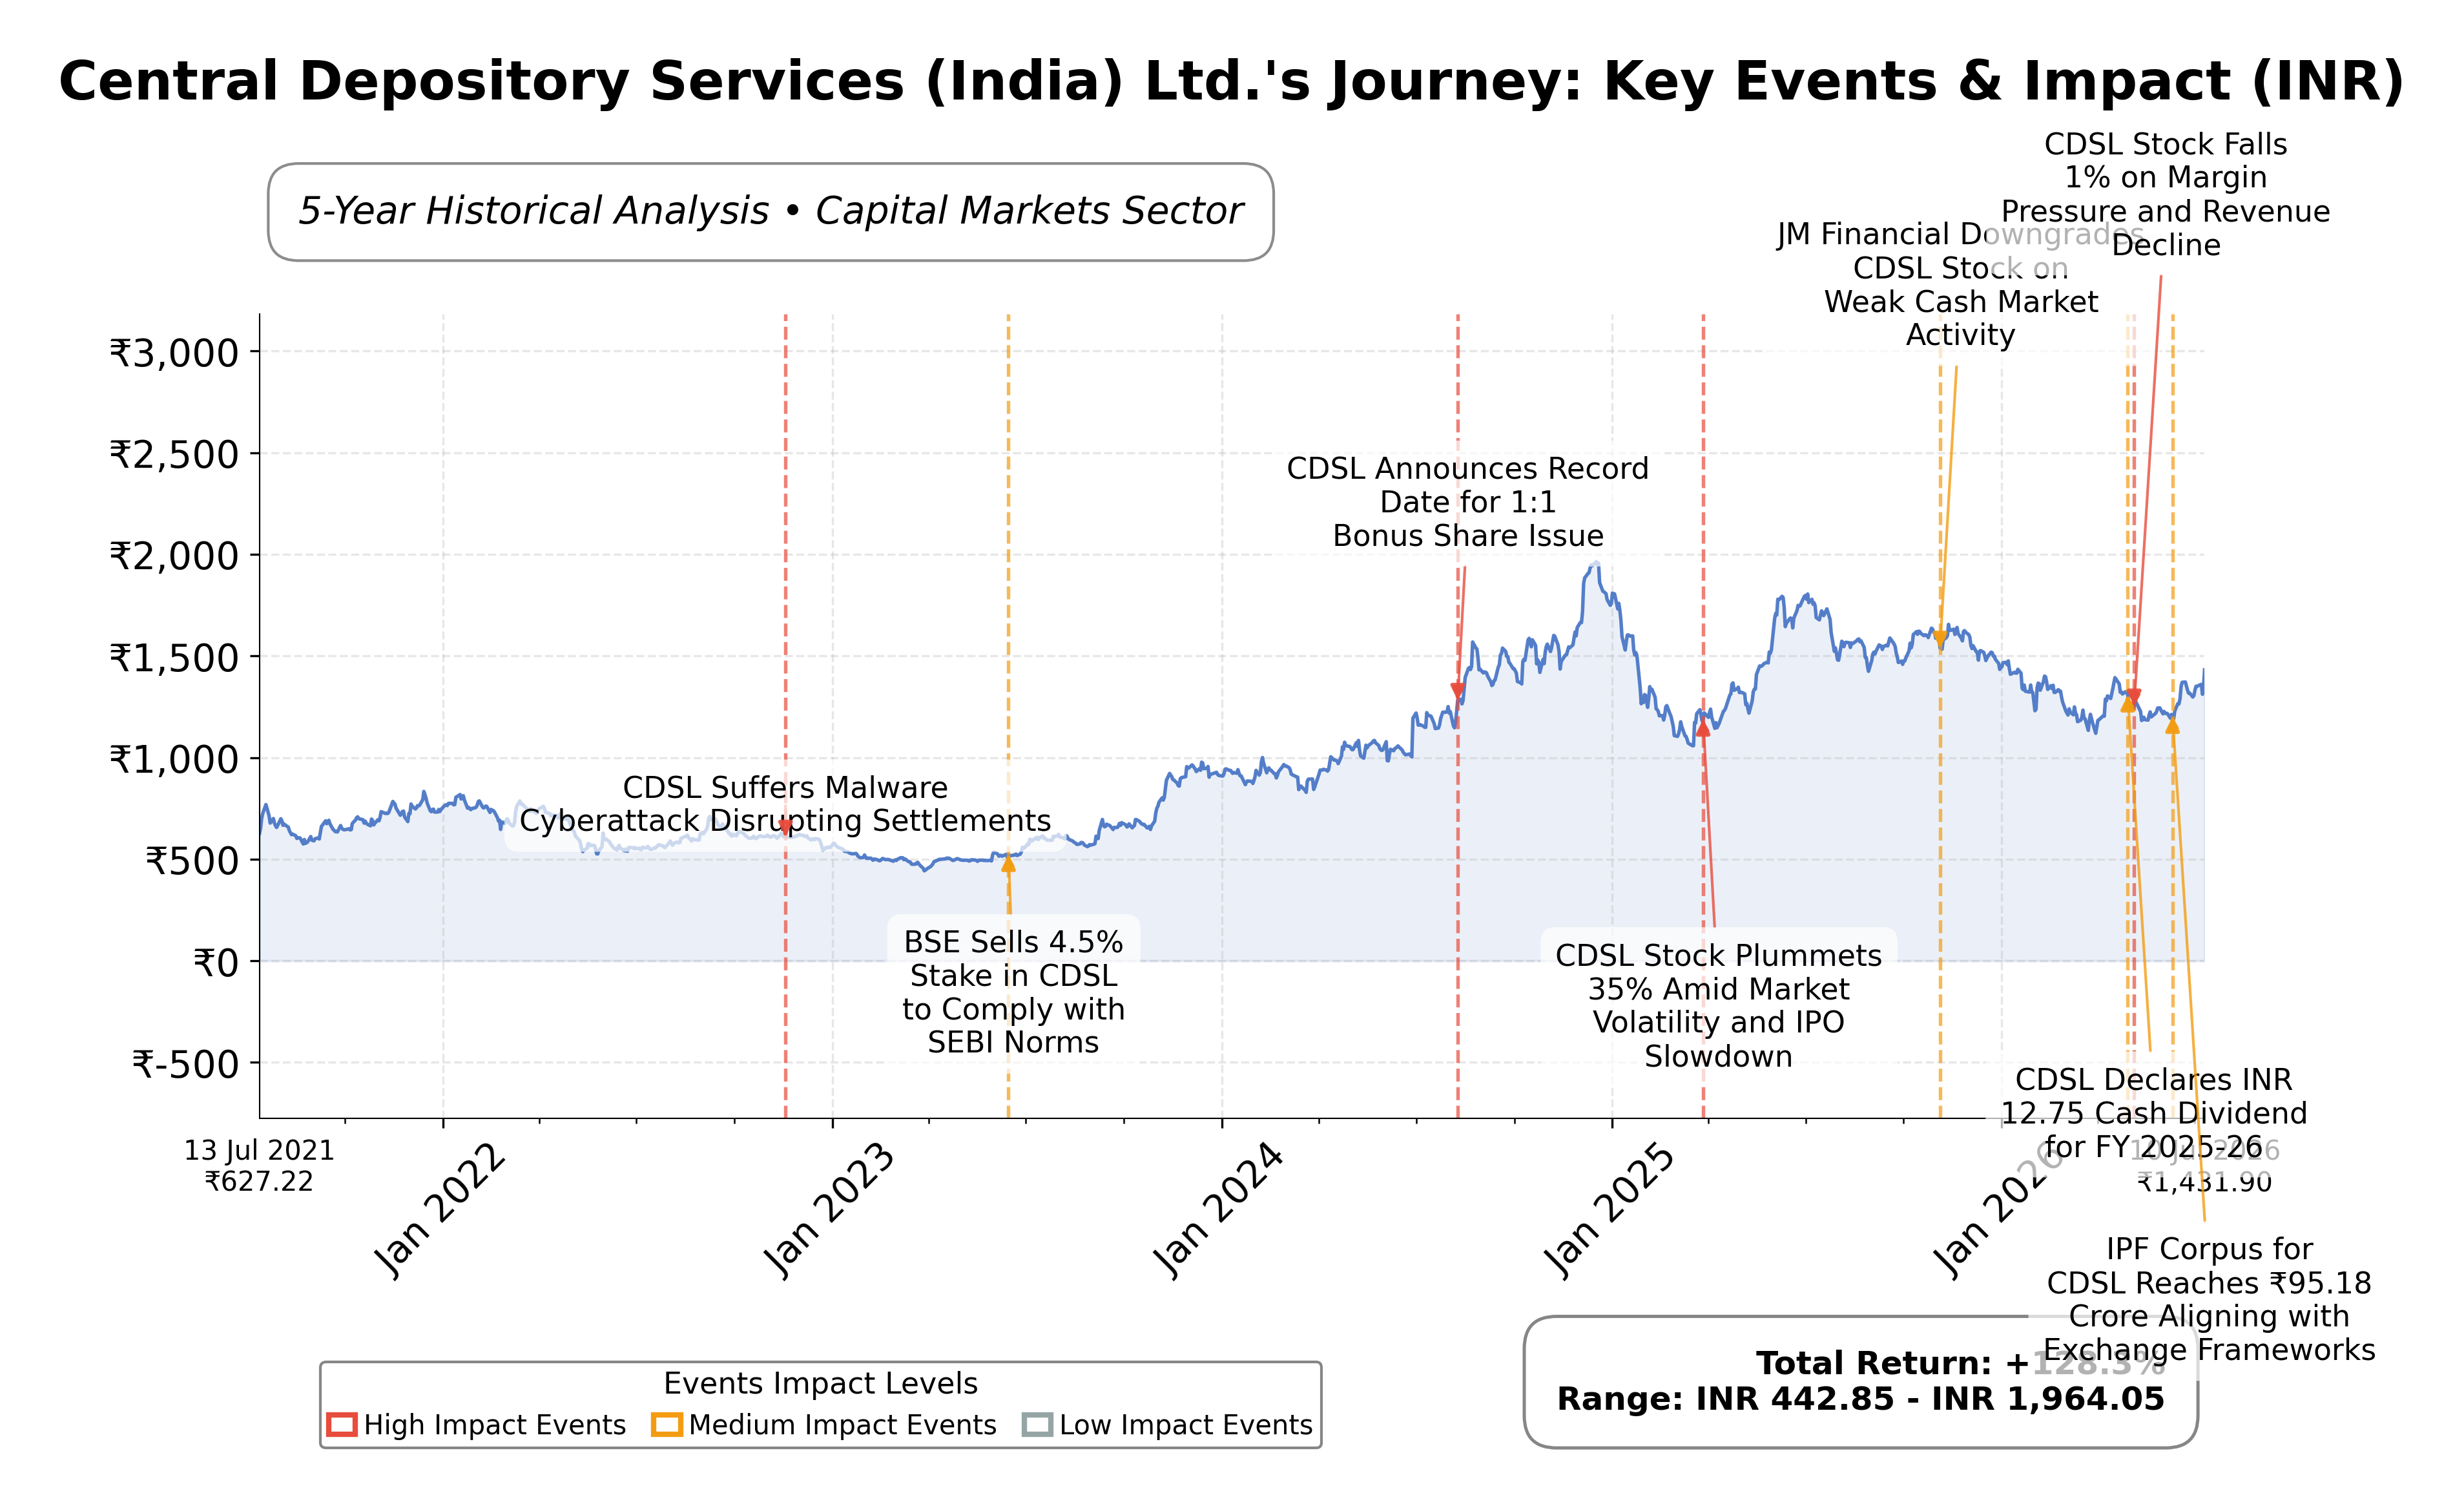
Key Positives and Key Risks
Pros
- Market leadership with over 80% share in demat accounts and 18.01 crore accounts as of March 2026, indicating strong competitive positioning.
- Strong profitability metrics including a net profit margin of 36.9% and return on equity of 23.9%, reflecting efficient operations.
- Robust financial health with a low debt-to-equity ratio of 0.11 and substantial cash reserves of INR 809 crore, supporting liquidity and stability.
Cons
- High valuation multiples with a trailing P/E of 61.7 and price-to-book ratio of 15.3, suggesting premium pricing relative to earnings and book value.
- Declining consolidated net profit after tax from ₹52,632.64 lakh in FY 2024-25 to ₹45,507.66 lakh in FY 2025-26, indicating margin pressures.
- Significant increase in technology-related expenses impacting operating margins and subsidiary profitability.
Disclosure: This information is for general awareness and does not constitute investment advice
Report Summary
Central Depository Services (India) Ltd. (CDSL) operates as a principal securities depository in India, providing critical infrastructure for the financial services sector. Listed on the NSE under the financial services sector, CDSL facilitates the electronic holding and transfer of securities such as stocks, bonds, and mutual funds. The company plays a pivotal role in the Indian capital markets by ensuring secure, transparent, and efficient settlement of securities transactions, serving a broad client base including brokers, asset management companies, and retail investors. Its business segments include depository services, KYC record-keeping, e-voting, and digital innovations that support market participants.
Financially, CDSL reported trailing twelve months (TTM) revenue of approximately INR 1,235 crore with a gross margin of 68.3%, operating margin of 38.1%, and net profit margin of 36.9%. The company’s return on equity (ROE) stands at 23.9%, and return on assets (ROA) at 16.6%, reflecting strong profitability and efficient asset utilization. Operating cash flow for the TTM period was INR 466.6 crore, with free cash flow of INR 260.2 crore, underscoring solid cash generation capabilities. The company maintains a low debt-to-equity ratio of 0.11, indicating a conservative capital structure.
Valuation metrics show a trailing P/E ratio of 61.7 and a forward P/E of 47.0, with a price-to-book ratio of 15.3 and an enterprise value to EBITDA multiple of 44.8. The market capitalization is approximately INR 29,927 crore. The stock price currently trades at INR 1,444, within a 52-week range of INR 1,116 to INR 1,754, representing a downside risk of about 17.1% from the high. These valuation multiples suggest a premium pricing relative to earnings and book value, consistent with its market leadership and growth prospects.
CDSL’s key strengths include its dominant market share with over 80% of demat accounts, strong cash flow generation, and minimal debt. The company has recently enhanced its technology platform with digital innovations such as a unified investor app and direct payout of securities, reinforcing its competitive positioning. Risks include regulatory changes impacting fee structures, competitive pressures from other depositories, and margin pressures due to increased technology investments. Recent strategic actions focus on expanding digital services and maintaining operational resilience amid global volatility.
Technically, the stock is trading below its 200-day moving average of INR 1,376 and above the 50-day moving average of INR 1,266, indicating mixed momentum. Momentum indicators show moderate readings, with the stock experiencing recent consolidation within its trading range. Recent news highlights positive foreign portfolio investor inflows into Indian equities, which may support market sentiment. Overall, the data suggests a cautious stance with attention to valuation and market dynamics.
Company and Industry Overview
Company Basics
Price Performance
Company Size
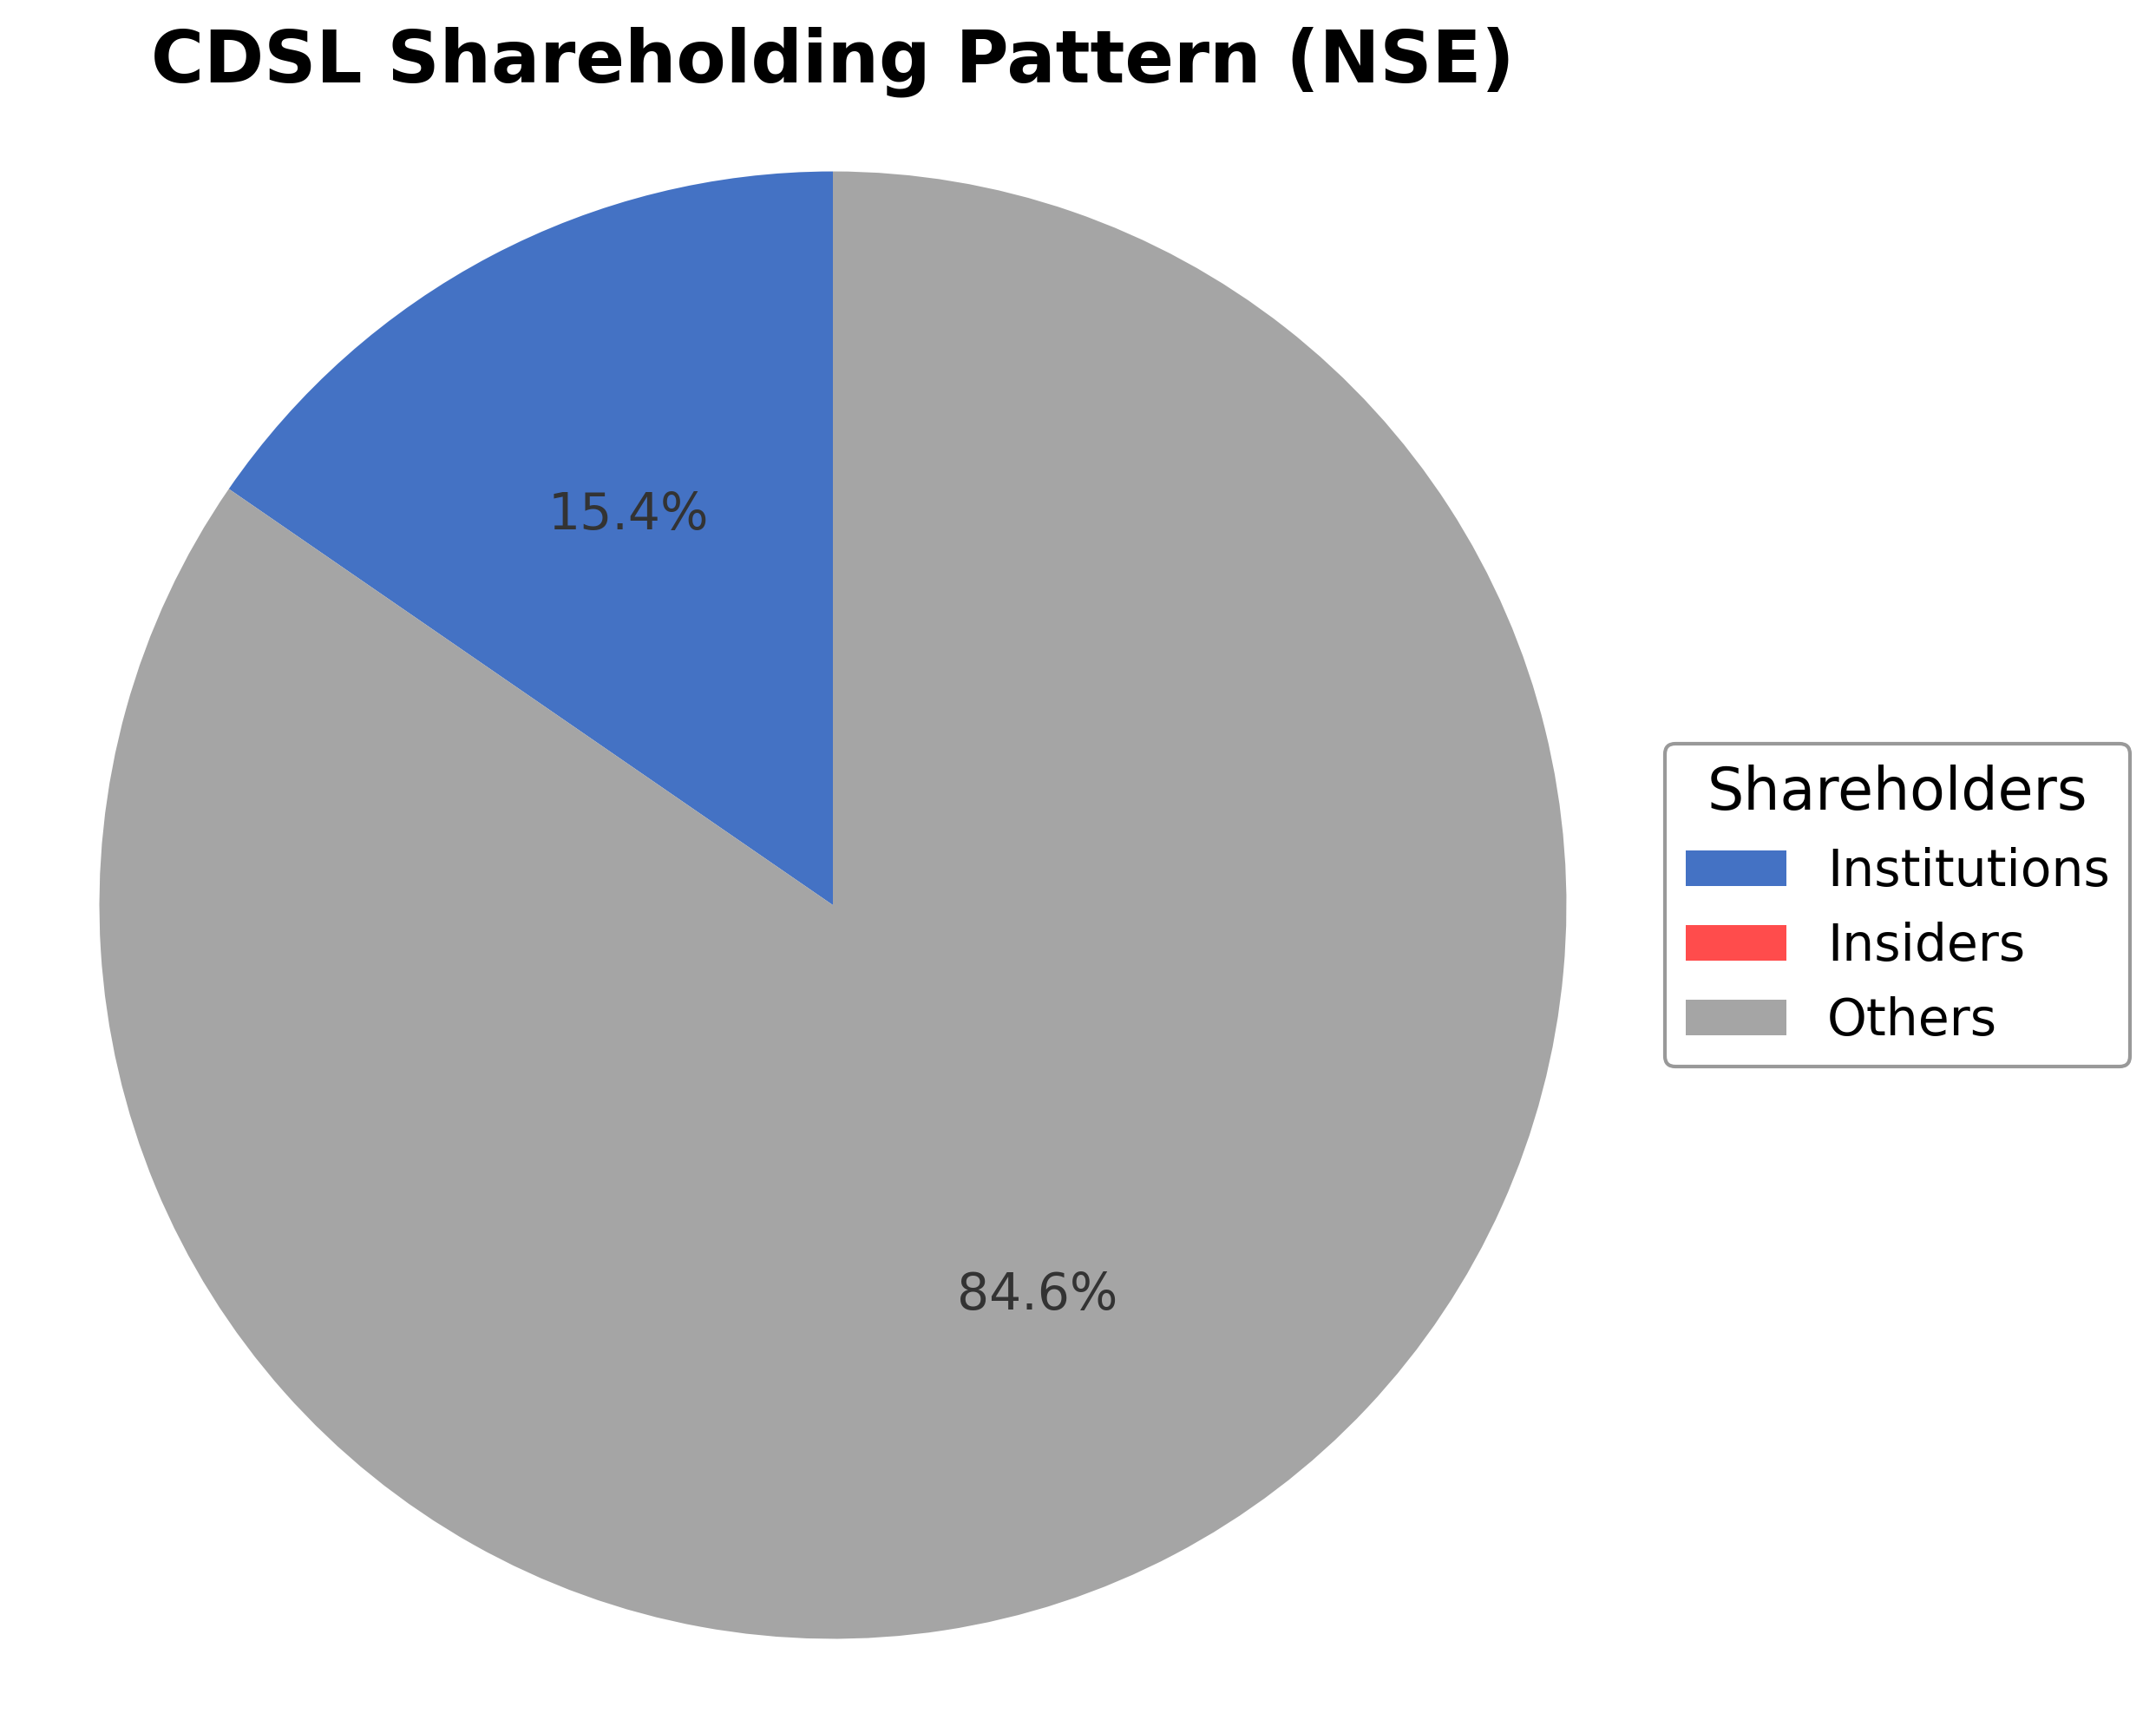
Shareholding Pattern
Sector and Industry Analysis
India's capital markets infrastructure sector is witnessing robust growth driven by increasing digital adoption, regulatory reforms, and rising retail participation. The depository services segment, crucial for post-trade settlement and custody, is primarily dominated by two players: NSDL and CDSL. Together, they form a duopoly that underpins the expanding securities market ecosystem, benefiting from India's structural shift towards financialization.
Key industry trends include a surge in retail participation, expansion of mutual funds, and growth in corporate bond issuances, supported by technology upgrades enabling new revenue streams. High barriers to entry exist due to stringent regulatory requirements, significant technology infrastructure investments, and established network effects. While NSDL leads in institutional segments, CDSL holds a dominant position in the retail demat and mutual fund spaces, reflecting differentiated competitive positioning within the duopoly.
The regulatory environment plays a pivotal role in shaping the sector, with ongoing reforms promoting financial inclusion and market transparency. Regulatory price controls on transaction charges and cybersecurity mandates present operational challenges, necessitating continuous technology investments. Additionally, initiatives like international connectivity through GIFT City aim to broaden market access, supporting a positive long-term outlook for capital market infrastructure providers.
Note: Analysis synthesized from industry research, market reports, and regulatory filings. Information is subject to change based on market conditions.
Financial Ratios Dashboard
Illustrative Scenario Analysis
DCF Assumptions:
Method: Two-Stage EPS-Priority Model
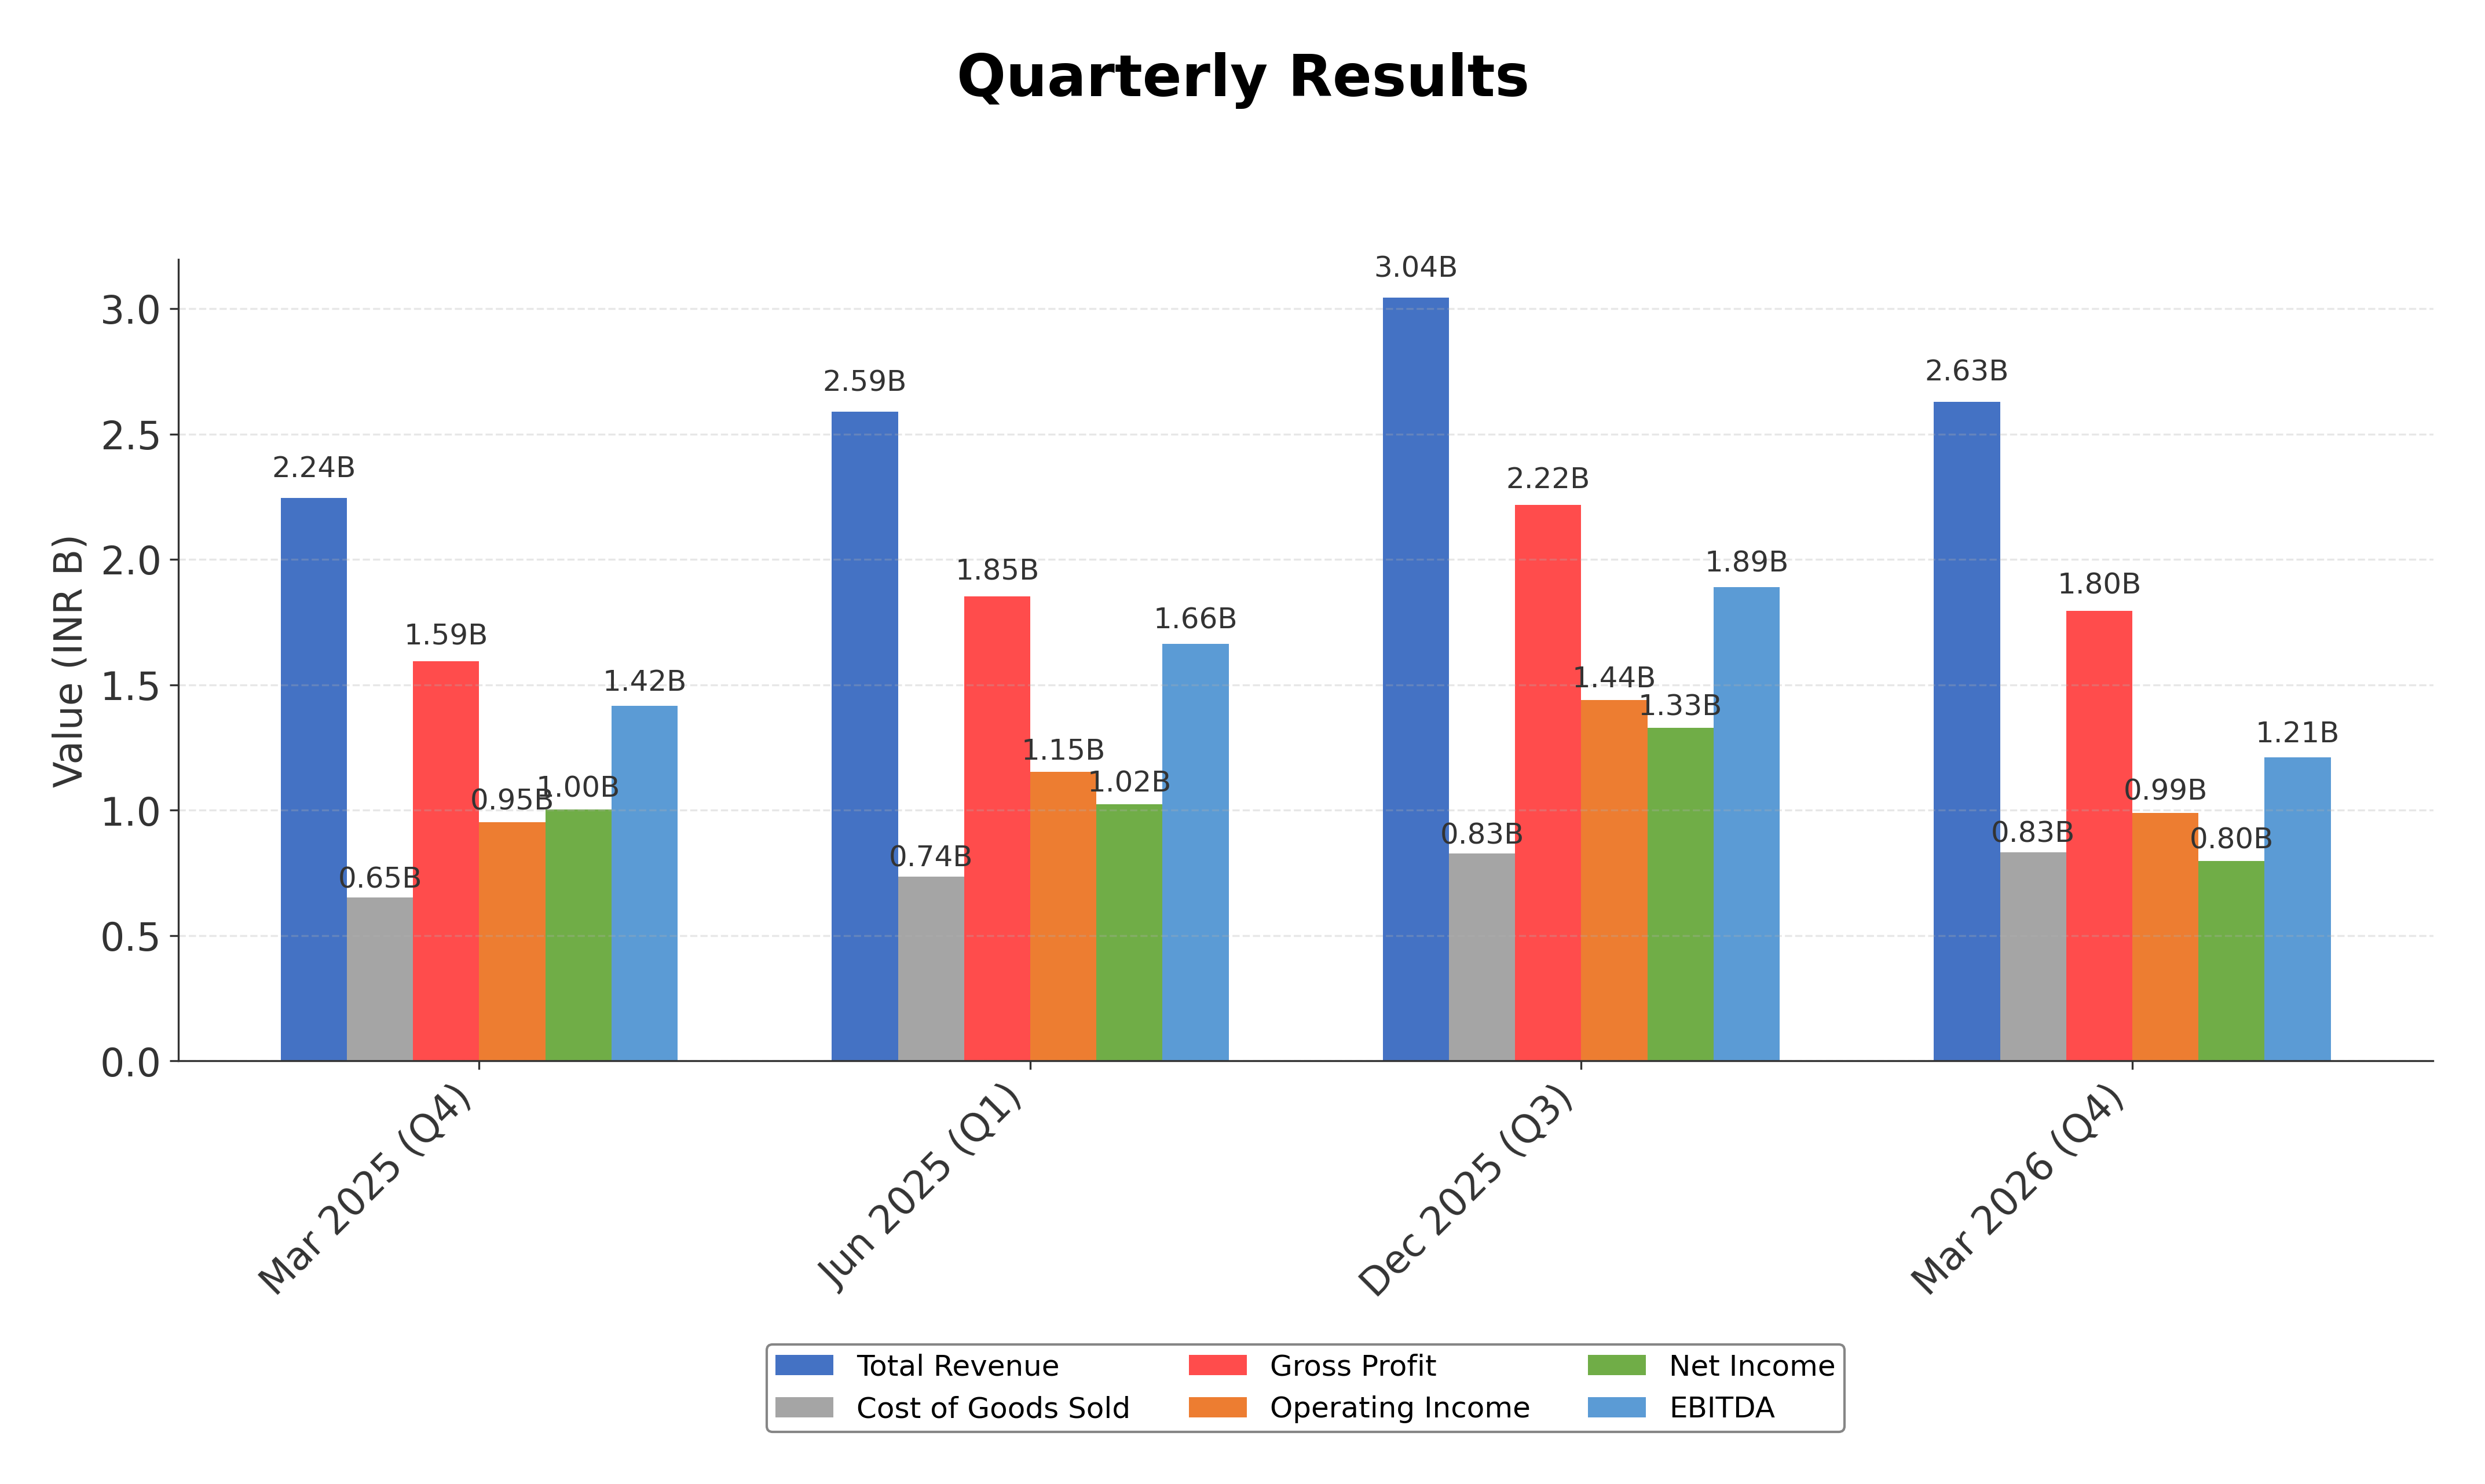
Financials
Peer Analysis
| Company Name | Market Cap | P/E Ratio | P/B Ratio | EV/EBITDA | Price to CFO |
|---|---|---|---|---|---|
| Central Depository Services (India) Ltd. | ₹299.27B | 61.72 | 15.27 | 44.84 | 64.13 |
| Angel One Ltd. | ₹316.12B | 33.67 | 5.08 | 21.75 | -7.63 |
| JM Financial Ltd. | ₹119.25B | 9.99 | 1.12 | N/A | 20.53 |
| Motilal Oswal Financial Services Ltd. | ₹589.71B | 30.96 | 4.57 | 22.77 | -9.71 |
| Icici Securities Ltd. | N/A | N/A | N/A | N/A | N/A |
| Indian Energy Exchange Ltd. | ₹106.40B | 21.45 | 7.87 | 13.44 | 24.58 |
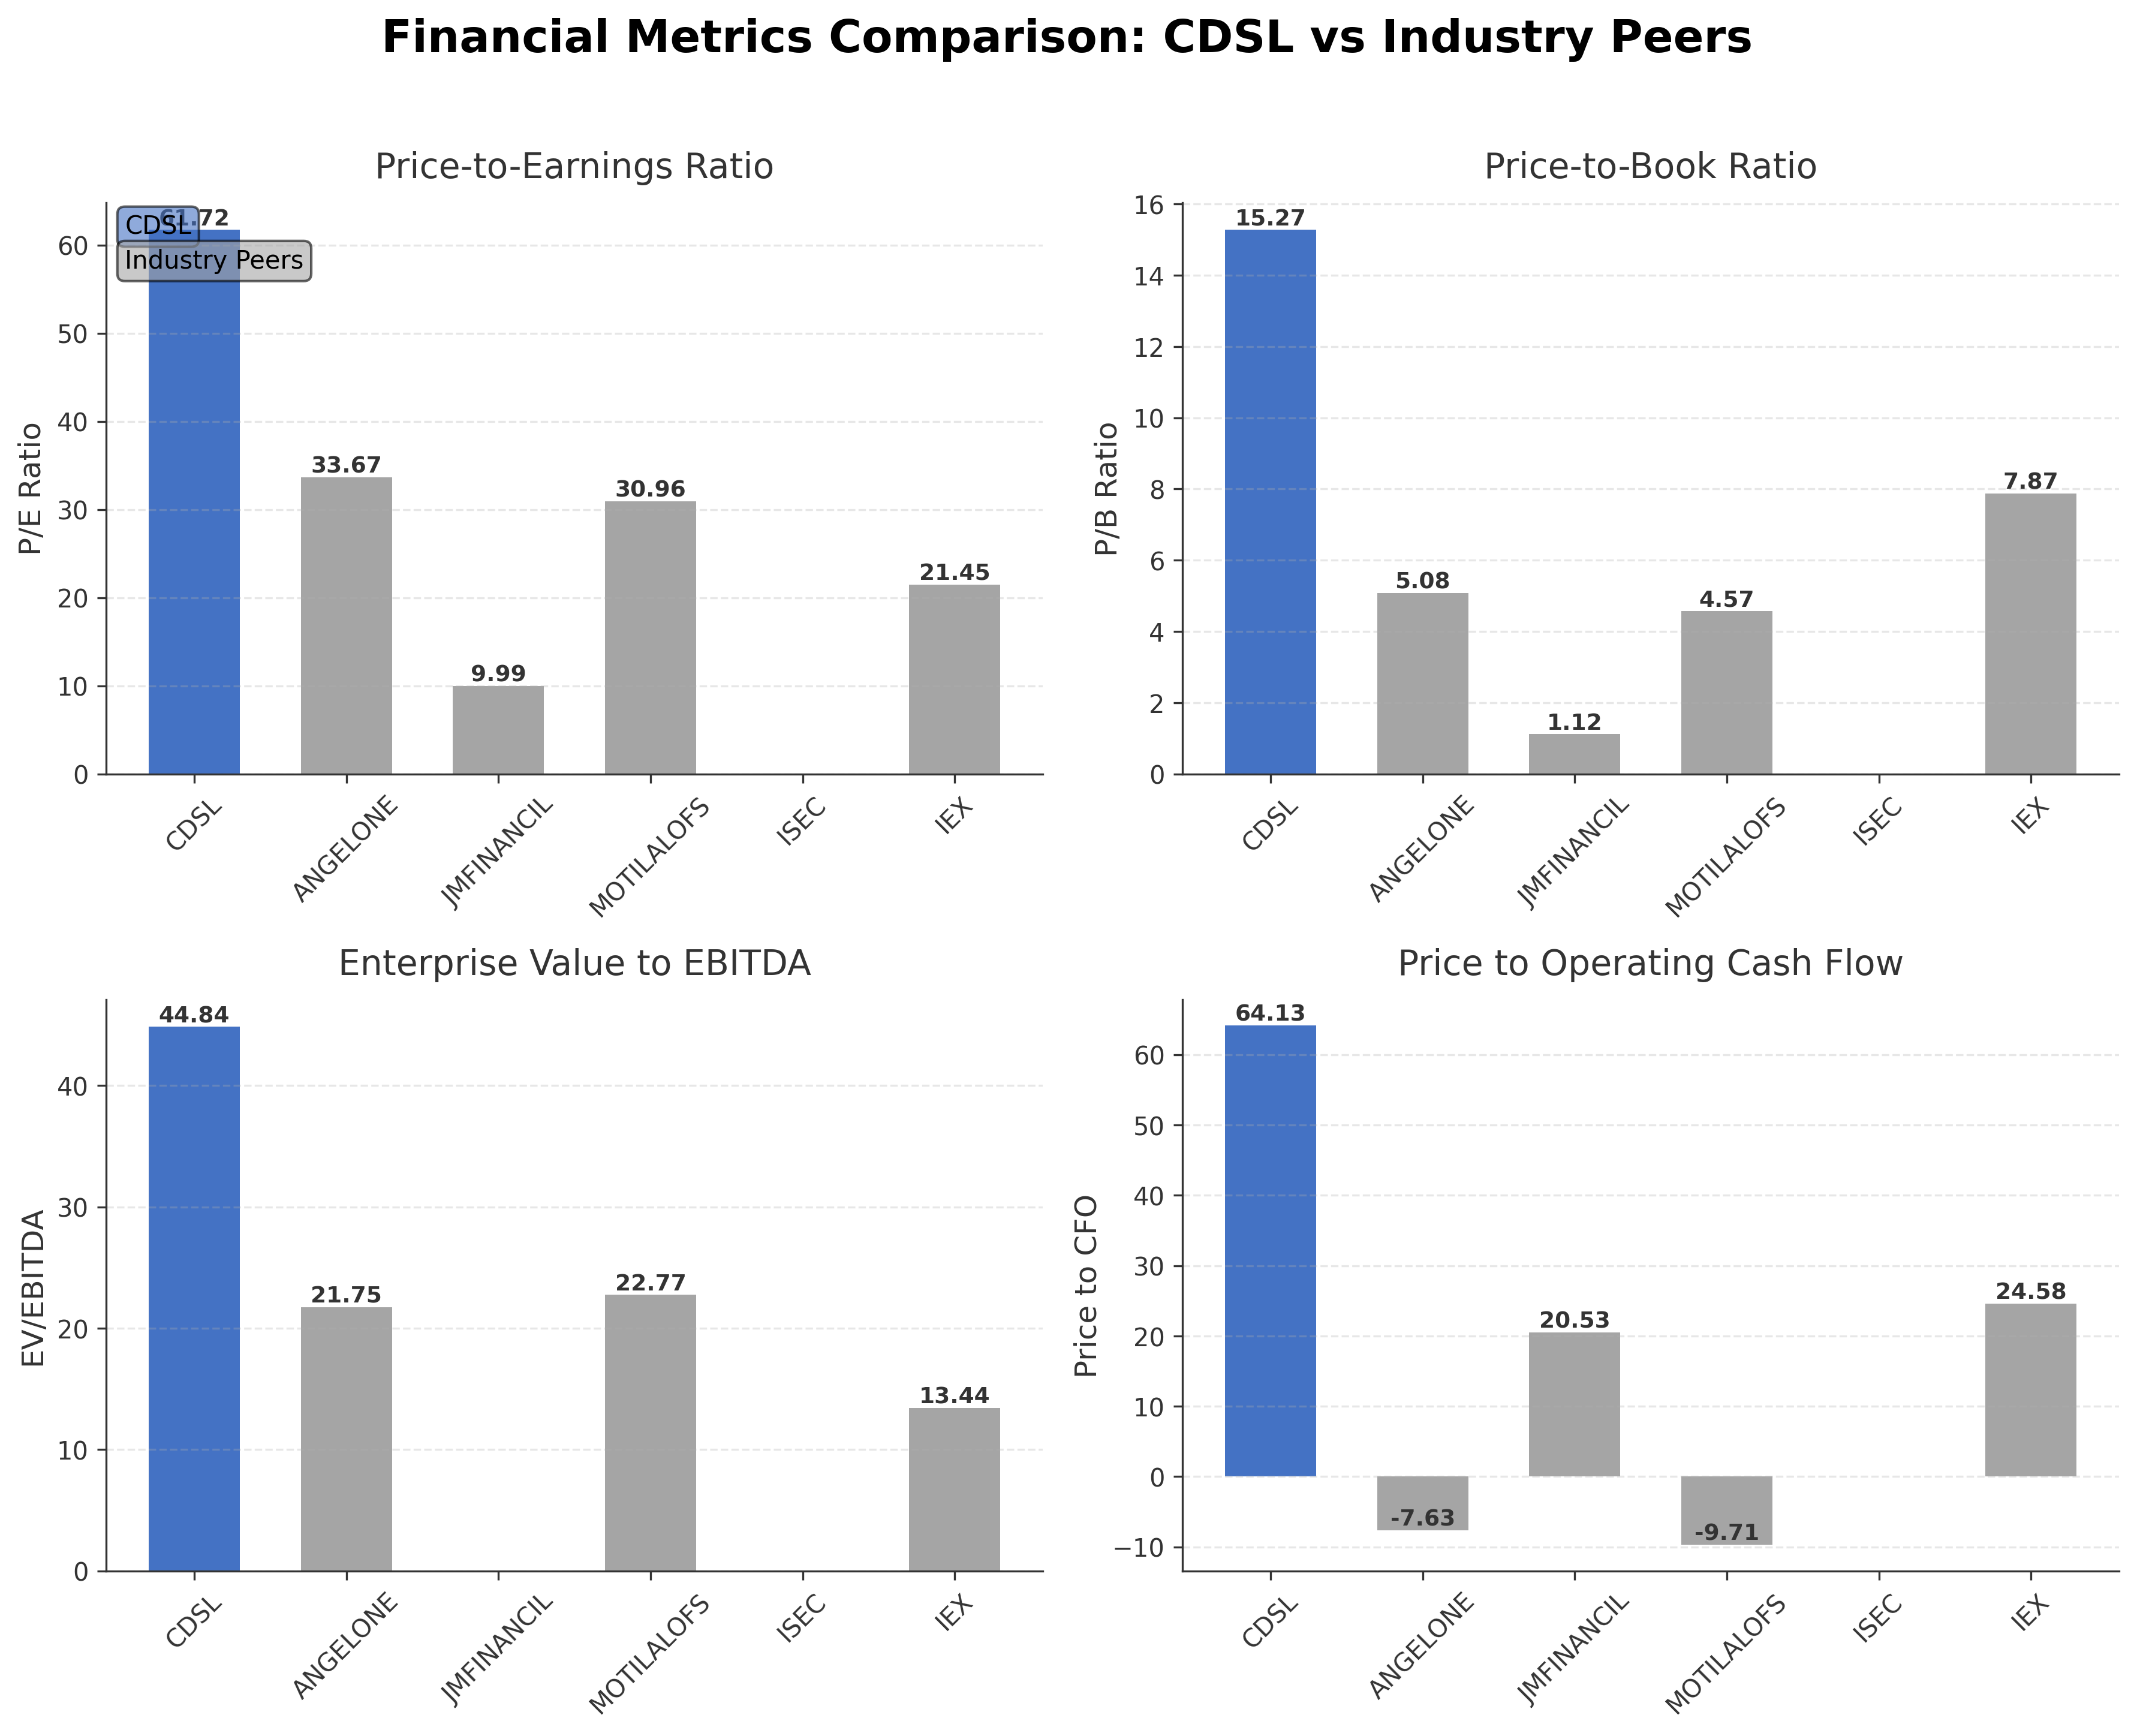
Comparison Analysis: Central Depository Services (India) Ltd. trades at significantly higher valuation multiples compared to its regional peers, with a P/E ratio of 61.72 and a price-to-book ratio of 15.27, reflecting a premium valuation. Its EV/EBITDA multiple of 44.84 is also elevated relative to peers like Angel One and Motilal Oswal Financial Services, which trade around 21-23 EV/EBITDA. CDSL demonstrates a strong return on equity of 23.91%, outperforming most peers except Indian Energy Exchange, which reports a higher ROE of 39.42%. Price to CFO is notably high at 64.13, indicating expectations of robust cash flow growth. Overall, CDSL’s valuation reflects its market leadership and growth profile but stands as an outlier in terms of premium multiples within the capital markets sector.
Financial Metrics Comparison with Peers
Financial Statements
Comprehensive financial data including income, balance sheet, and cash flow metrics
Income Statement
| fiscal_date | 2026-03-31 | 2025-03-31 | 2024-03-31 | 2023-03-31 | 2022-03-31 |
|---|---|---|---|---|---|
| Sales | 11.45B | 10.82B | 8.12B | 5.55B | 5.51B |
| Cost Of Goods | 3.19B | 2.35B | 1.85B | 1.33B | 1.02B |
| Gross Profit | 8.26B | 8.47B | 6.27B | 4.22B | 4.50B |
| Operating Expense Other Operating Expenses | 2.40B | 2.23B | 926.40M | 642.65M | 511.28M |
| Operating Income | 5.20B | 5.75B | 4.69B | 3.09B | 3.65B |
| Non Operating Interest Expense | 1.74M | 1.00M | 1.10M | 1.33M | 99.00K |
| Pretax Income | 6.09B | 6.95B | 5.56B | 3.65B | 4.09B |
| Income Tax | 1.54B | 1.69B | 1.36B | 891.94M | 967.39M |
| Net Income | 4.55B | 5.26B | 4.20B | 2.76B | 3.12B |
| Ebit | 6.09B | 6.95B | 5.56B | 3.65B | 4.09B |
| Ebitda | 6.75B | 7.44B | 5.34B | 3.54B | 3.94B |
| Net Income Continuous Operations | 6.09B | 6.95B | 5.56B | 3.65B | 4.09B |
| Minority Interests | 10.55M | 3.15M | -4.48M | -211.00K | -6.27M |
| Preferred Stock Dividends | 0.00 | 0.00 | 0.00 | 0.00 | 0.00 |
| Operating Expense Selling General And Administrative | N/A | 386.61M | 225.46M | 168.27M | 122.95M |
| Non Operating Interest Income | N/A | 424.97M | 380.28M | 252.62M | 154.10M |
| Eps Basic | N/A | 25.20 | 20.05 | 13.21 | 14.89 |
| Eps Diluted | N/A | 25.20 | 20.05 | 13.21 | 14.89 |
| Basic Shares Outstanding | N/A | 208.98M | 209.00M | 209.00M | 209.00M |
| Diluted Shares Outstanding | N/A | 208.98M | 209.00M | 209.00M | 209.00M |
Data provided by Twelve Data
Balance Sheet
| fiscal_date | 2026-03-31 | 2025-03-31 | 2024-03-31 | 2023-03-31 | 2022-03-31 |
|---|---|---|---|---|---|
| Cash And Cash Equivalents | 514.02M | 226.10M | 119.90M | 52.72M | 425.40M |
| Accounts Receivable | 646.12M | 230.67M | 285.95M | 173.92M | 152.57M |
| Total Assets | 24.19B | 21.62B | 17.82B | 14.57B | 13.26B |
| Total Liabilities | 4.17B | 3.58B | 2.74B | 2.00B | 1.89B |
| Long Term Debt | 10.37M | 19.54M | 8.23M | 11.61M | 1.47M |
| Shareholders Equity | 20.02B | 18.04B | 15.07B | 12.57B | 11.36B |
Data provided by Twelve Data
Cash Flow Statement
| fiscal_date | 2026-03-31 | 2025-03-31 | 2024-03-31 | 2023-03-31 | 2022-03-31 |
|---|---|---|---|---|---|
| Operating Activities Net Income | 6.09B | 6.95B | 5.56B | 3.65B | 4.09B |
| Operating Activities Other Non Cash Items | -474.96M | -413.44M | -357.68M | -240.53M | -147.66M |
| Operating Activities Accounts Receivable | -303.91M | 42.98M | -371.55M | 10.37M | -157.93M |
| Operating Activities Other Assets Liabilities | 144.54M | 322.28M | 244.12M | -67.23M | 122.62M |
| Operating Activities Operating Cash Flow | 5.46B | 6.90B | 5.08B | 3.35B | 3.90B |
| Investing Activities Capital Expenditures | -992.14M | -1.24B | -537.73M | -1.94B | -136.28M |
| Investing Activities Net Intangibles | -210.01M | -313.47M | -196.09M | -112.75M | -113.94M |
| Investing Activities Net Acquisitions | 0.00 | -200.00M | 0.00 | -100.00M | -200.00M |
| Investing Activities Purchase Of Investments | -10.33B | -4.83B | -5.31B | -6.95B | -5.78B |
| Investing Activities Sale Of Investments | 9.44B | 3.40B | 3.40B | 7.70B | 4.58B |
| Investing Activities Investing Cash Flow | -1.88B | -2.87B | -2.45B | -1.28B | -1.53B |
| Financing Activities Common Dividends | -2.61B | -2.30B | -1.67B | -1.57B | -940.50M |
| Financing Activities Other Financing Charges | -12.23M | -6.85M | -13.76M | -10.26M | N/A |
| Financing Activities Financing Cash Flow | -2.62B | -2.31B | -1.69B | -1.58B | -940.50M |
| End Cash Position | 514.02M | 322.56M | 184.84M | 503.63M | 855.90M |
| Free Cash Flow | 3.46B | 3.88B | 3.12B | 432.36M | 2.58B |
Data provided by Twelve Data
Technical Analysis
Key Insights
- CDSL is currently in a consolidation phase with price trading below the 200-day moving average (INR 1376.03) but above the 50-day moving average (INR 1265.57), indicating mixed short- to medium-term momentum.
- Key support levels are identified near INR 1116.3 (52-week low) and around INR 1260, while resistance is observed near INR 1444 (current price) and INR 1753.9 (52-week high).
- The stock is positioned above the 10-day moving average but below the 200-day moving average, suggesting short-term strength but longer-term caution.
- Momentum indicators such as RSI and MACD show moderate readings without extreme overbought or oversold conditions, indicating balanced momentum.
- Multi-timeframe analysis reveals that daily charts show sideways movement, weekly charts indicate a slight downtrend from recent highs, and monthly charts reflect overall upward trend over the past year.
- Potential market scenarios include a breakout above resistance levels leading to renewed upward momentum or a breakdown below support levels triggering further consolidation or correction.
Trending News
1. Headline: Global risk appetite fuels FPI return to markets
Summary: The latest inflow follows net outflows of Rs 49,340 crore in June, Rs 32,963 crore in May, Rs 60,847 crore in April and Rs 1.17 lakh crore in March, accord-ing to data from the Central Depository Services (India) Ltd (CDSL).
Sentiment: positive
2. Headline: Market trading guide: CDSL among 2 stock recommendations for Monday - The Economic Times
Summary: Markets rebounded sharply on Friday, supported by positive global cues and encouraging IT earnings. Analysts recommend CDSL and Sumitomo Chemical India as technical buy ideas, citing bullish breakouts, strong volumes and improving momentum indicators.
Sentiment: positive
Summary: So far this month, overseas investors ... domestic stock market, supported by stronger economic indicators, a stable rupee, and improving global investor sentiment. The latest buying marks a significant shift from recent months, when FPIs had remained persistent sellers. According to data from the Central Depository Services (India) Ltd (CDSL), foreign ...
Sentiment: positive
4. Headline: Foreign Investors Make a Comeback: ₹15,157 Cr Inflows in July 2026, ETGovernment
Summary: New Delhi, After four straight ... ₹60,847 crore in April and a massive ₹1.17 lakh crore in March, according to data from the Central Depository Services (India) Ltd (CDSL)....
Sentiment: positive
5. Headline: FPIs reverse 4-month selling trend with ₹15,157 crore inflow in July | Markets News - Business Standard
Summary: The latest inflow follows net outflows of ₹49,340 crore in June, ₹32,963 crore in May, ₹60,847 crore in April and a massive ₹1.17 trillion in March, according to data from the Central Depository Services (India) Ltd (CDSL).
Sentiment: negative
Powered by Brave
Recent Updates
News Summary
As of July 13, 2026. Central Depository Services (India) Ltd. reported steady growth in its demat accounts, reaching 18.01 crore as of March 31, 2026, maintaining over 80% market share. The company completed 25 years of operations and continues to lead India's depository sector. Financially, standalone total income for FY 2025-26 rose to INR 1,096 crore from INR 985 crore the previous year, while standalone net profit marginally increased to INR 468 crore. Consolidated revenue from operations also grew year-over-year to ₹1,14,491.87 lakh, though consolidated net profit after tax declined to ₹45,507.66 lakh from ₹52,632.64 lakh. Segment-wise, CDSL Ventures saw revenue and profit declines, while core depository activities showed growth in custody value and issuer numbers. The company has invested significantly in technology, launching digital innovations such as a unified investor app and enhanced e-voting features, supporting scalability and operational resilience amid market volatility.
News Sentiment
The overall sentiment from recent updates is mixed to positive. Growth in demat accounts and steady revenue increases reflect operational strength and market leadership. However, a decline in consolidated net profit and reduced profitability in certain subsidiaries temper the outlook. The company's focus on technology-driven innovation and maintaining market share contributes positively to sentiment, while margin pressures and segmental profit declines introduce caution. This balanced view underscores resilience with areas requiring monitoring.
Source List
- https://nsearchives.nseindia.com/corporate/CDSL_02052026151904_NSE_Intimation_Press_Release_sd.pdf
- https://www.screener.in/company/CDSL/consolidated/
- https://www.alphaspread.com/security/nse/cdsl/investor-relations
Analytical Overview
Analysis Summary
Central Depository Services (India) Ltd. exhibits valuation metrics that are elevated relative to industry averages, with a trailing P/E of 61.7 compared to peers in the capital markets sector, reflecting premium pricing. Forward P/E of 47.0 suggests expectations of earnings growth, though the PEG ratio is negative, indicating complexities in growth valuation. The company’s revenue growth rate of 4.2% and positive operating cash flow trends demonstrate a stable growth trajectory supported by strong cash generation. Financial health is robust, with a low debt-to-equity ratio of 0.11 and substantial cash reserves exceeding INR 809 crore, indicating strong liquidity and limited leverage. Sector-specific challenges include regulatory fee pressures and competitive dynamics in the depository space, while opportunities arise from increasing demat account penetration and digital service expansion. India-specific factors such as evolving regulatory frameworks, rising retail investor participation, and macroeconomic stability influence the company’s market positioning and growth potential.
Overall Business and Market Assessment
Supporting Factors: CDSL’s dominant market share exceeding 80% in demat accounts, strong profitability with a net margin near 37%, and a conservative capital structure with minimal debt
Risk Factors: No data
SWOT Analysis
Strengths
- Dominant market share with over 80% of demat accounts in India.
- Strong profitability with net profit margin of approximately 37%.
- Robust financial health characterized by low debt-to-equity ratio of 0.11.
- Consistent cash flow generation supporting operational resilience.
Weaknesses
- High valuation multiples with P/E ratio above 60 and price-to-book ratio over 15.
- Declining profitability in certain subsidiaries impacting consolidated earnings.
- Limited insider shareholding which may affect governance dynamics.
- Margin pressure due to increased technology-related expenses.
Opportunities
- Expansion of digital services including unified investor app and e-voting enhancements.
- Growing retail investor participation driving demat account growth.
- Increasing regulatory emphasis on electronic securities custody.
- Potential for new revenue streams from ancillary capital market services.
Threats
- Regulatory changes that could reduce fee income or impose additional compliance costs.
- Competitive pressures from other securities depositories and fintech entrants.
- Global market volatility affecting investor sentiment and transaction volumes.
- Legal challenges impacting subsidiary operations and revenue streams.
Company Description
Central Depository Services (India) Ltd. is a key player in India's financial infrastructure, operating as one of the primary securities depositories in the country. Its central role involves maintaining and safeguarding the ownership records of various securities like stocks, bonds, and mutual funds in electronic form, thereby eliminating the risks and hassles associated with physical certificates. Notably, CDSL enables the efficient settlement of securities transactions by ensuring the digital transfer of ownership promptly, thus enhancing transparency and security in the market. It predominantly impacts sectors like finance and banking, along with the broader investment community, including brokers, asset management companies, and retail investors. Established as a pivotal part of the Indian capital market, CDSL provides a crucial link between the regulatory framework and market participants, ensuring compliance, risk management, and facilitating seamless market operations. As a central repository, CDSL supports various capital market services such as KYC record-keeping, e-voting services for listed companies, and providing online access to beneficial ownership information, making it an indispensable component of India's evolving financial market landscape.