
Cemindia Projects Limited (CEMPRO)
Stock Analysis Report
Stock Journey
Key Positives and Key Risks
Pros
- Robust order book of ₹24,545 crore provides strong revenue visibility and backlog.
- Return on equity of 20.3% indicates efficient use of shareholder capital.
- Backing by the Adani Group enhances operational synergies and market access.
Cons
- Negative operating cash flow of ₹-3.1 billion over the trailing twelve months raises liquidity concerns.
- Elevated debt-to-equity ratio of 47.86% increases financial risk and leverage.
- High price-to-book ratio of 6.84 suggests the stock is trading at a premium relative to book value.
Disclosure: This information is for general awareness and does not constitute investment advice
Report Summary
Cemindia Projects Limited operates as a prominent Indian construction and civil engineering company listed on the NSE under the Industrials sector. The company specializes in urban infrastructure development, including mass rapid transit systems, airports, highways, bridges, and maritime structures. It also offers services in hydroelectric and irrigation projects, tunnels, dams, and specialist engineering. Following its 2025 acquisition by an Adani Group entity, Cemindia benefits from enhanced operational synergies across ports, energy, transport, and logistics sectors, reinforcing its market positioning in India’s infrastructure space.
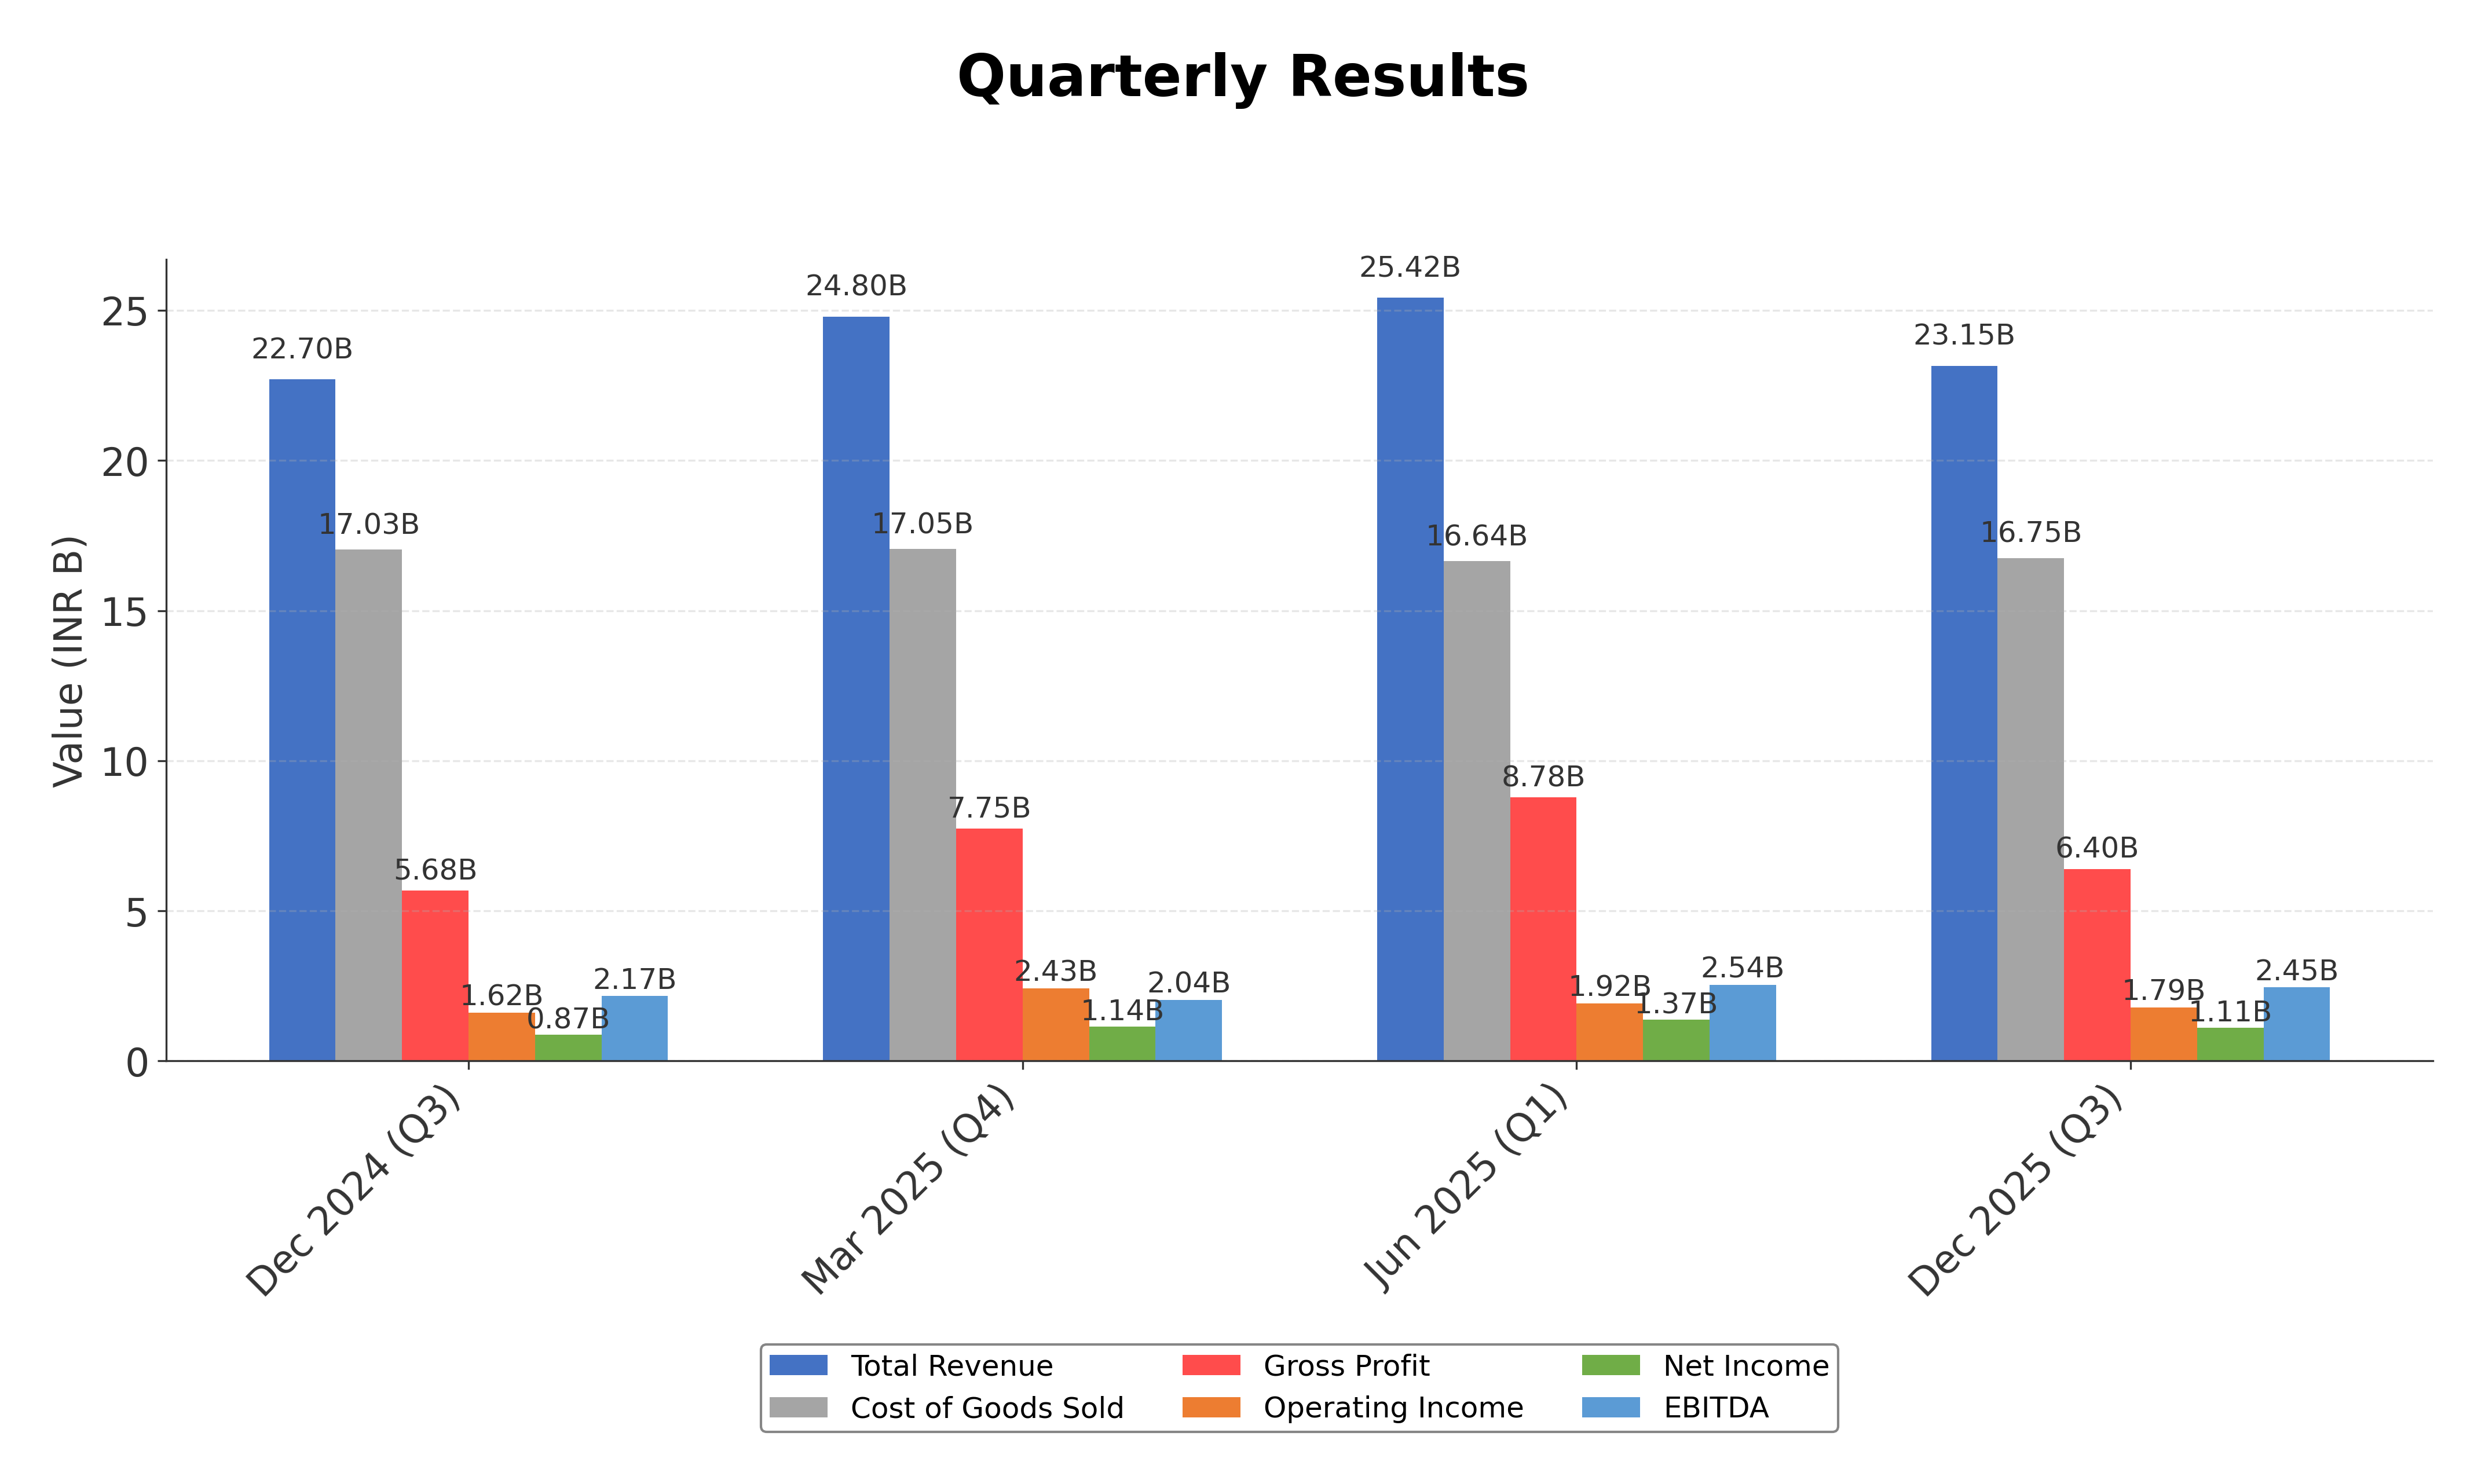
Financially, Cemindia reported trailing twelve months (TTM) revenue of approximately ₹94.7 billion with a gross margin of 27.6%, operating margin of 7.7%, and net profit margin of 4.95%. The company’s return on equity (ROE) stands at 20.3%, return on assets (ROA) at 5.7%, and return on invested capital (ROIC) is reflected through an EV/EBITDA multiple of 15.36. These figures indicate moderate profitability and efficient capital utilization relative to its industry peers, supported by a quarterly earnings growth rate of 27.4%.
Valuation metrics show a trailing P/E ratio of 29.85 and a forward P/E of 21.57, with a price-to-book ratio of 6.84. The market capitalization is approximately ₹140 billion. The stock is currently priced at ₹815.25, trading closer to its 52-week high of ₹891 and well above its 52-week low of ₹503.3. The PEG ratio of 0.55 suggests potential undervaluation relative to growth expectations, while the price-to-cash-flow ratio is negative, reflecting recent operating cash flow challenges.
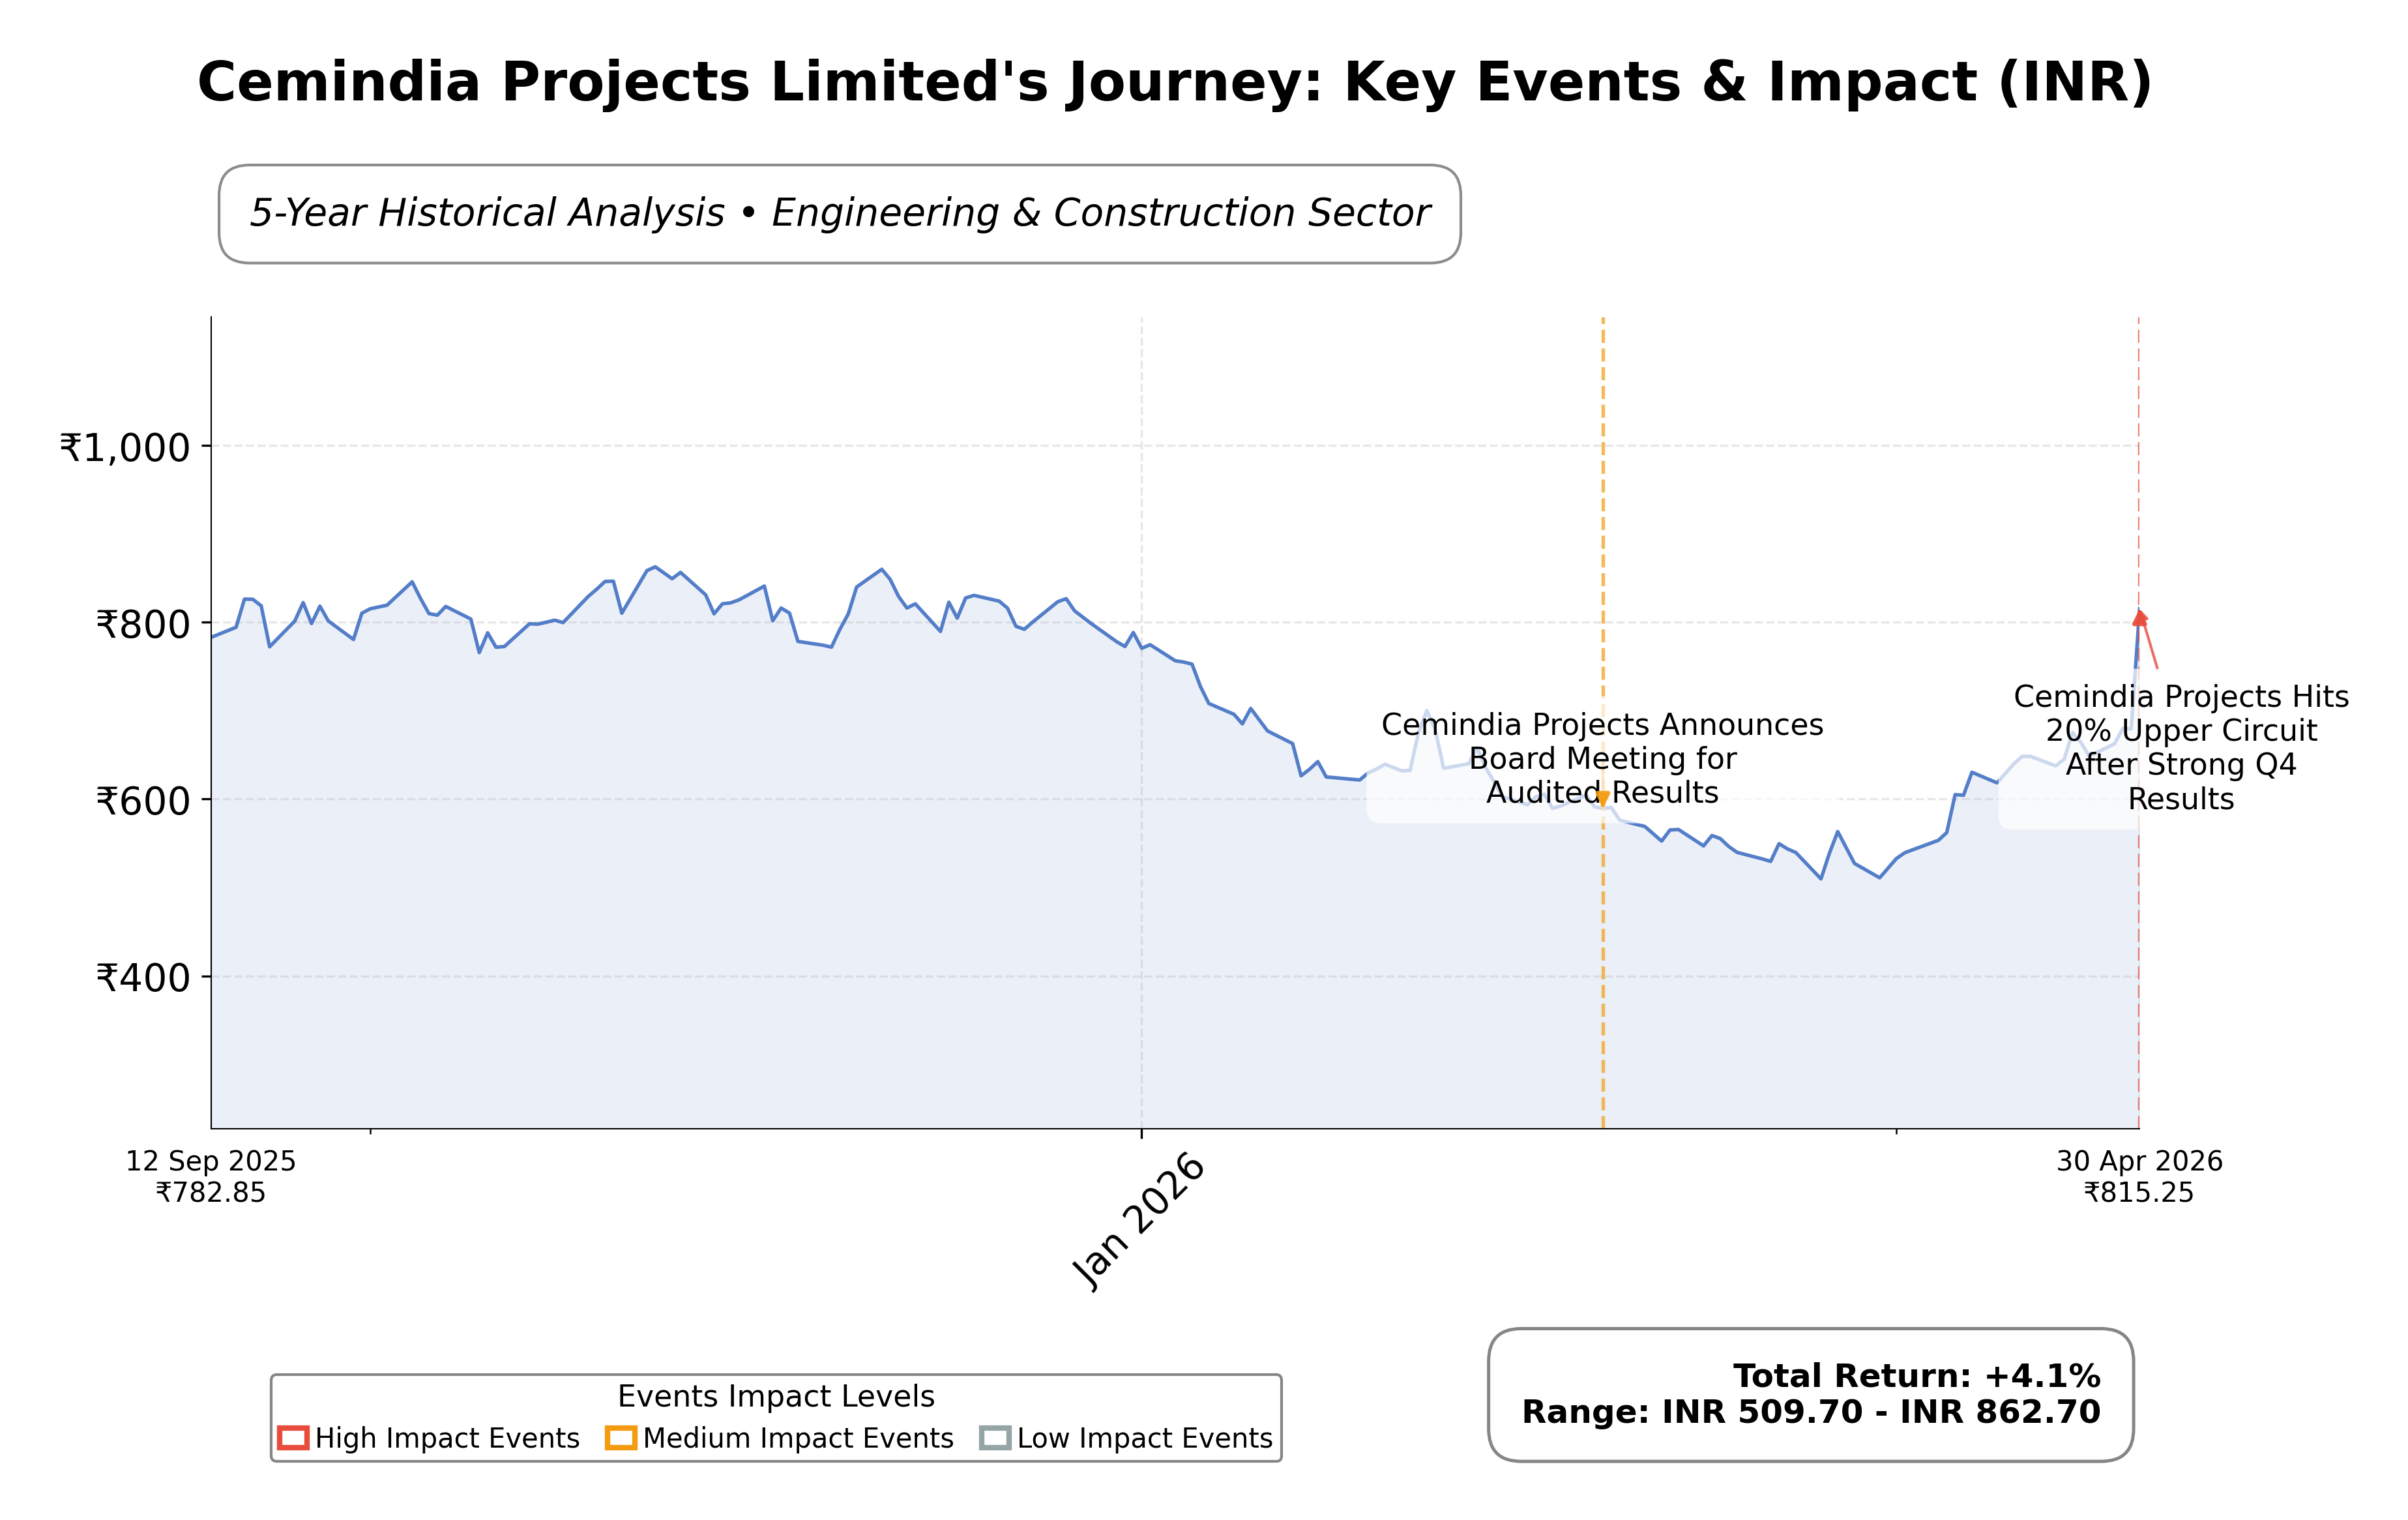
Cemindia’s strengths include a robust order book valued at ₹24,545 crore, strong backing from the Adani Group, and a diversified project portfolio across multiple infrastructure segments. Key risks involve its elevated debt levels with a debt-to-equity ratio near 48%, and operating cash flow deficits. Recent strategic actions include securing significant contracts and a decision to reinvest earnings rather than pay dividends, signaling a focus on growth and operational scaling. The company also experienced a 20% stock price surge following strong quarterly results.
Technically, the stock is in an upward trend, trading above its 50-day moving average but below the 200-day average, with momentum indicators showing strength across multiple timeframes. Recent news highlights strong market enthusiasm and positive sentiment, although some caution remains due to cash flow and debt metrics. Overall, the data suggests a dynamic phase for Cemindia with conditions favoring close monitoring for potential accumulation or portfolio adjustment.
Company and Industry Overview
Company Basics
Price Performance
Company Size
Shareholding Pattern
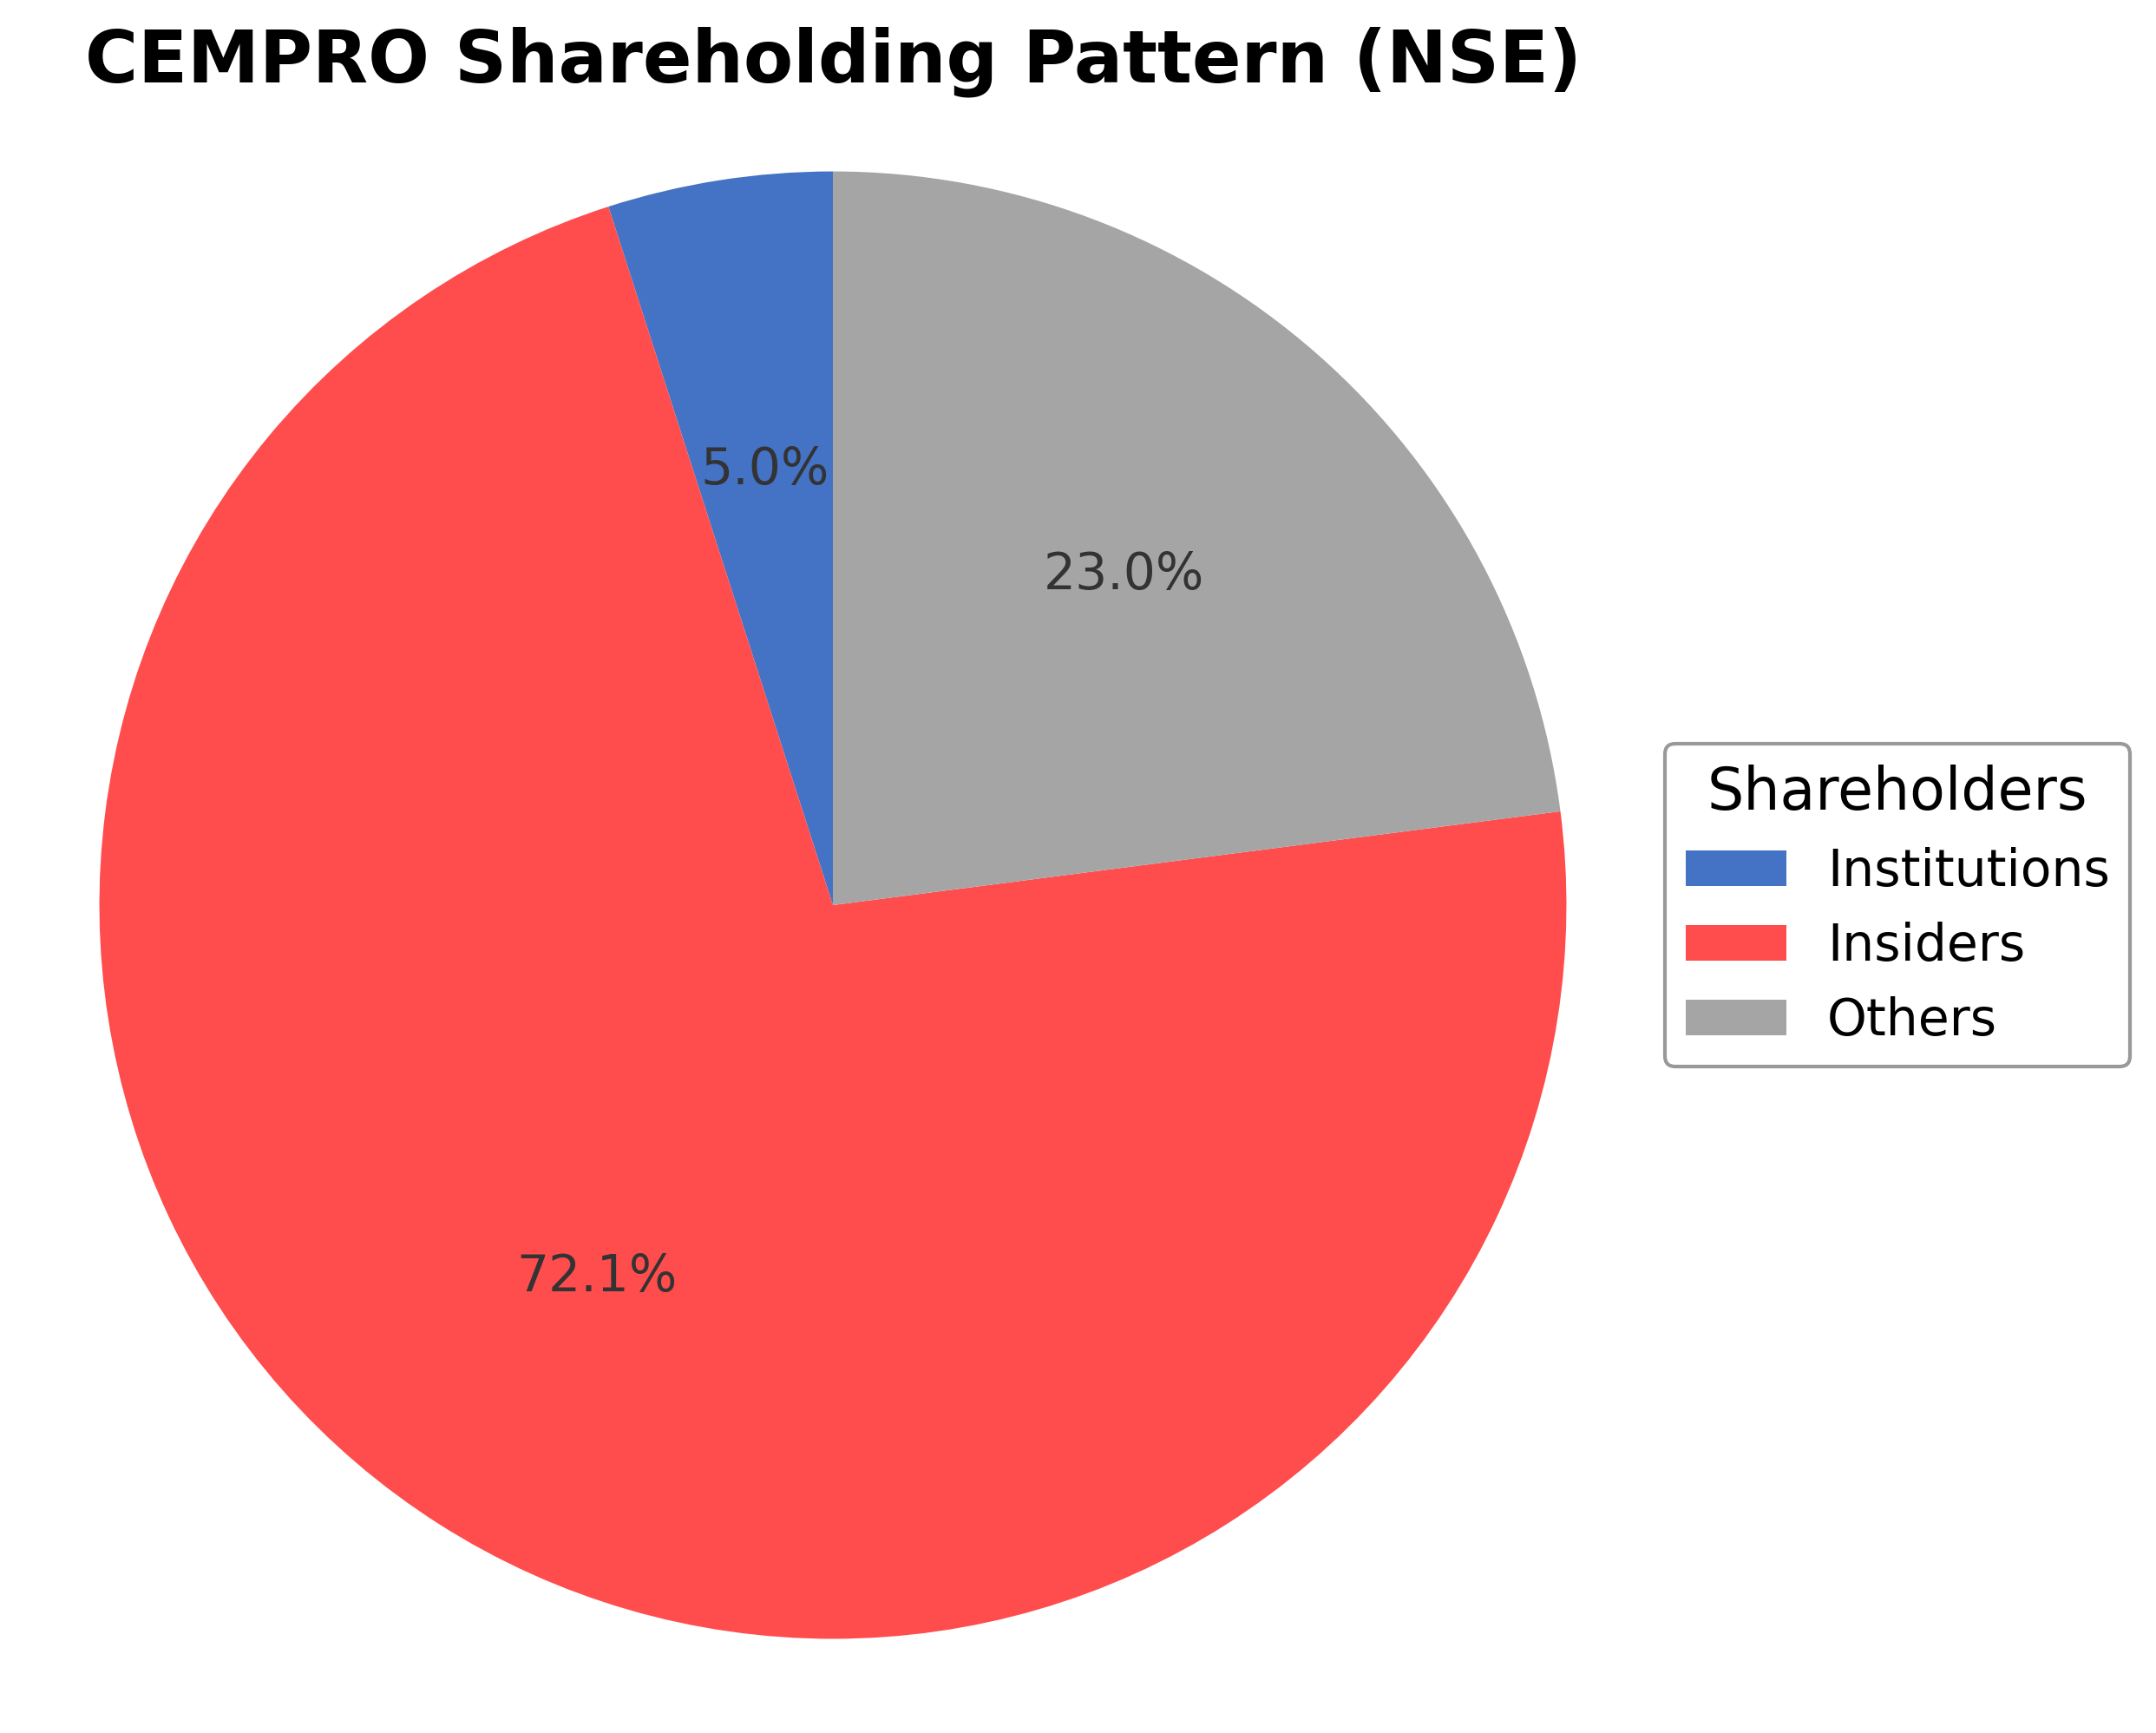
Cemindia Projects Limited’s ownership structure is dominated by insiders, including executives and board members, holding approximately 72.09% of shares, reflecting strong promoter control. Institutional investors own around 4.95%, indicating limited but stable institutional participation. The remaining 22.96% is held by public shareholders, including retail investors and employee stock plans. Over the past 12-24 months, insider ownership has remained relatively stable, while institutional holdings have shown minor fluctuations without significant accumulation or distribution trends. This ownership pattern suggests a governance framework strongly influenced by promoters, with moderate external oversight, which may impact strategic decisions and corporate actions. The company operates within the Indian Engineering & Construction industry, characterized by competitive bidding, regulatory oversight, and infrastructure development opportunities driven by government initiatives.
Sector and Industry Analysis
The construction and infrastructure sector in India has witnessed robust growth driven by urbanization, government spending on public infrastructure, and private investments. The market size is substantial, with annual revenues crossing several trillion rupees, supported by projects in roads, railways, ports, and urban infrastructure. Key players include large engineering and construction firms such as ITD Cementation, Larsen & Toubro, and Gammon India, which dominate due to their scale and technical expertise.
Industry trends highlight increasing adoption of advanced construction technologies and a shift towards sustainable and smart infrastructure projects. Competitive dynamics are shaped by high capital requirements, technical know-how, and the ability to secure large government contracts, which act as significant barriers to entry. Companies like Cemindia Projects leverage their project execution capabilities and diversified portfolio to maintain competitive positioning amid rising competition and evolving client demands.
The regulatory environment is characterized by stringent compliance requirements related to environmental clearances, labor laws, and safety standards, which influence project timelines and costs. Government initiatives such as the National Infrastructure Pipeline and reforms in public-private partnership frameworks aim to boost sector growth and transparency. These regulations and policies collectively impact operational efficiency and investment attractiveness within the sector.
Note: Analysis synthesized from industry research, market reports, and regulatory filings. Information is subject to change based on market conditions.
Financial Ratios Dashboard
Illustrative Scenario Analysis
DCF Assumptions:
Method: Two-Stage EPS-Priority Model
Financials
Peer Analysis
| Company Name | Market Cap | P/E Ratio | P/B Ratio | EV/EBITDA | Price to CFO |
|---|---|---|---|---|---|
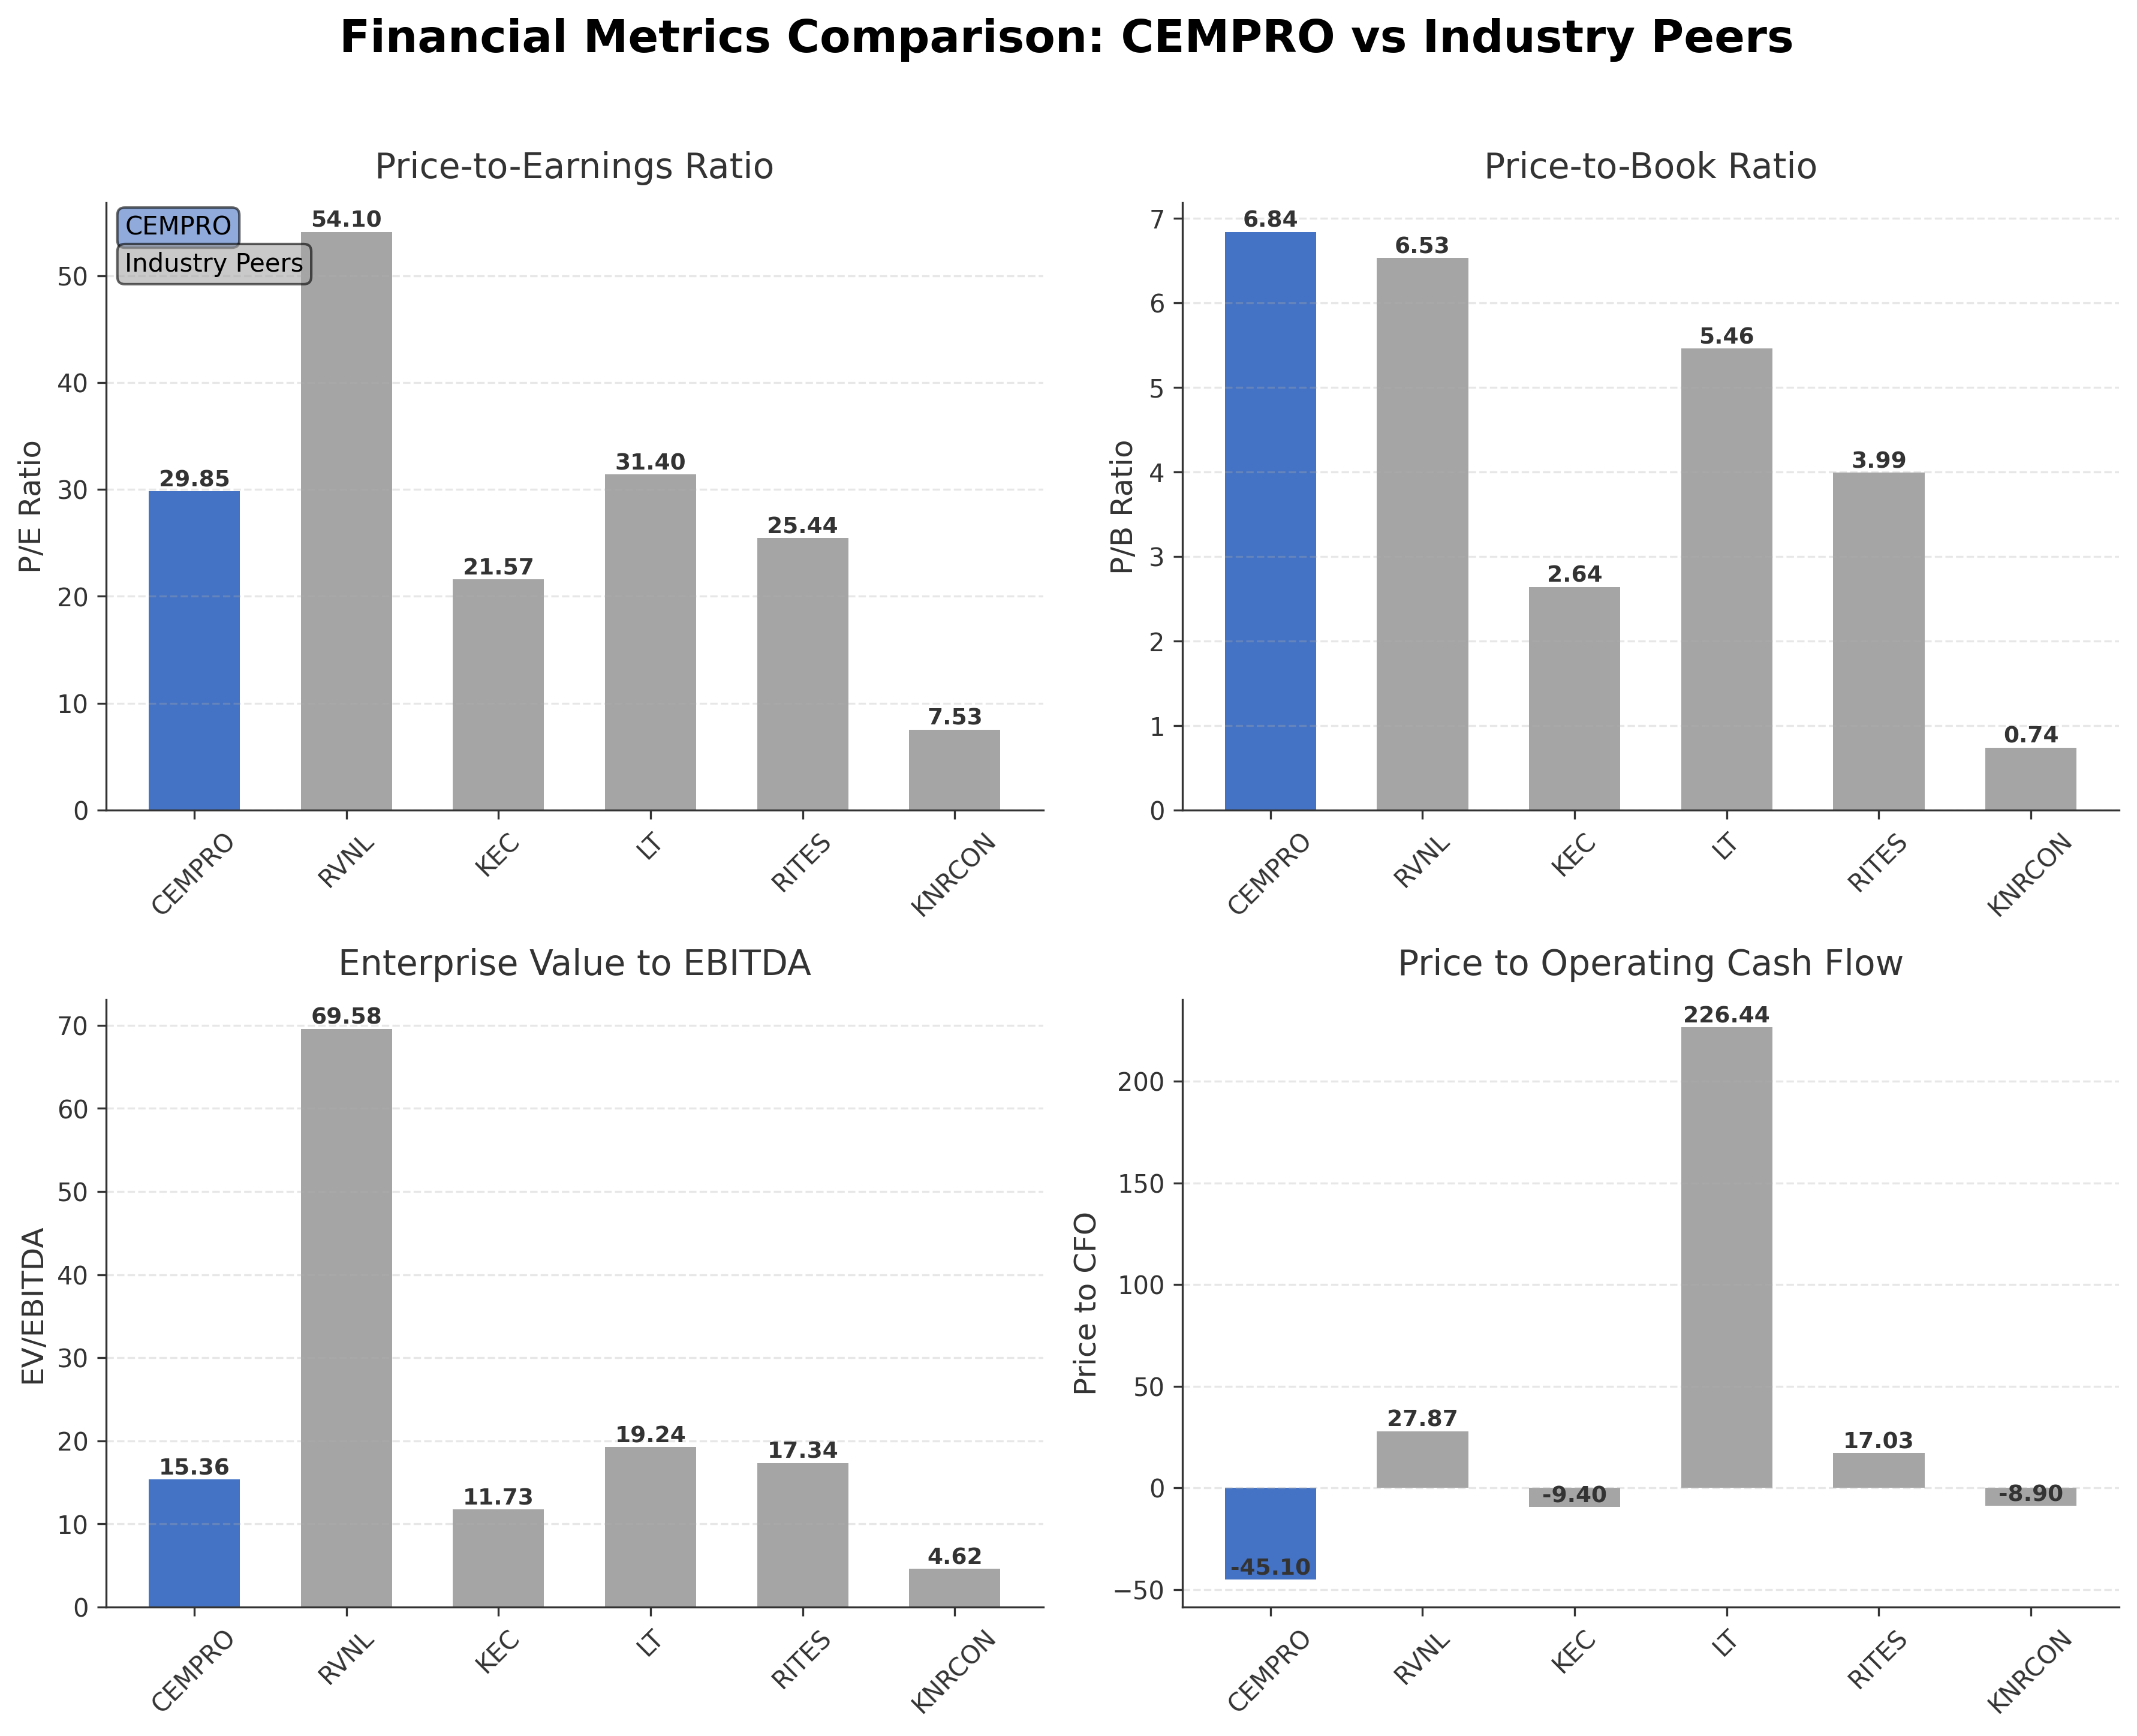
| Cemindia Projects Limited | ₹140.05B | 29.85 | 6.84 | 15.36 | -45.10 |
| Rail Vikas Nigam Ltd. | ₹620.61B | 54.10 | 6.53 | 69.58 | 27.87 |
| Kec International Ltd. | ₹149.26B | 21.57 | 2.64 | 11.73 | -9.40 |
| Larsen & Toubro Ltd. | ₹5.52T | 31.40 | 5.46 | 19.24 | 226.44 |
| Rites Ltd. | ₹105.21B | 25.44 | 3.99 | 17.34 | 17.03 |
| KNR Constructions Ltd. | ₹35.19B | 7.53 | 0.74 | 4.62 | -8.90 |
Comparison Analysis: Cemindia Projects Limited exhibits a moderate valuation with a trailing P/E of 29.85, which is lower than Rail Vikas Nigam Ltd. (54.10) but higher than KEC International Ltd. (21.57) and KNR Constructions Ltd. (7.53). Its price-to-book ratio of 6.84 is among the highest, indicating a premium valuation relative to book value. The EV/EBITDA multiple of 15.36 is moderate compared to peers like RVNL (69.58) and LT (19.24), suggesting balanced operational efficiency. Cemindia's return on equity at 20.28% is strong, surpassing most peers except KNR Constructions Ltd. The negative price-to-cash-flow ratio contrasts with positive figures for most peers, highlighting recent cash flow challenges. Overall, Cemindia stands as a mid-sized player with solid profitability but faces valuation premiums and cash flow considerations relative to its industry peers.
Financial Metrics Comparison with Peers
Financial Statements
Comprehensive financial data including income, balance sheet, and cash flow metrics
Income Statement
| fiscal_date | 2025-03-31 |
|---|---|
| Sales | 90.97B |
| Cost Of Goods | 60.03B |
| Gross Profit | 30.93B |
| Operating Expense Selling General And Administrative | 1.66B |
| Operating Expense Other Operating Expenses | 7.18B |
| Operating Income | 7.11B |
| Non Operating Interest Income | 303.82M |
| Non Operating Interest Expense | 1.50B |
| Pretax Income | 5.03B |
| Income Tax | 1.30B |
| Net Income | 3.73B |
| Eps Basic | 21.70 |
| Eps Diluted | 21.70 |
| Basic Shares Outstanding | 171.79M |
| Diluted Shares Outstanding | 171.79M |
| Ebit | 6.53B |
| Ebitda | 8.59B |
| Net Income Continuous Operations | 5.03B |
| Minority Interests | -5.29M |
| Preferred Stock Dividends | 0.00 |
Source: Financial statements and regulatory filings
Balance Sheet
| fiscal_date | 2025-03-31 |
|---|---|
| Cash And Cash Equivalents | 3.58B |
| Accounts Receivable | 16.07B |
| Total Assets | 65.05B |
| Total Liabilities | 46.66B |
| Long Term Debt | 1.35B |
| Shareholders Equity | 18.38B |
Source: Financial statements and regulatory filings
Cash Flow Statement
| fiscal_date | 2025-03-31 |
|---|---|
| Operating Activities Net Income | 5.03B |
| Operating Activities Other Non Cash Items | 1.98B |
| Operating Activities Accounts Receivable | -7.91B |
| Operating Activities Other Assets Liabilities | -2.21B |
| Operating Activities Operating Cash Flow | -3.11B |
| Investing Activities Capital Expenditures | -1.73B |
| Investing Activities Purchase Of Investments | -897.88M |
| Investing Activities Investing Cash Flow | -2.62B |
| Financing Activities Long Term Debt Issuance | 691.80M |
| Financing Activities Long Term Debt Payments | -1.47B |
| Financing Activities Short Term Debt Issuance | 1.48B |
| Financing Activities Common Dividends | -291.64M |
| Financing Activities Financing Cash Flow | 416.34M |
| End Cash Position | 3.58B |
| Free Cash Flow | -251.56M |
Source: Financial statements and regulatory filings
Technical Analysis
Key Insights
- The stock is currently in an upward trend, showing strong price momentum following a 20% surge, with price action breaking recent resistance levels near ₹800.
- Key support levels are identified around ₹590 (50-day moving average) and ₹715 (200-day moving average), while resistance is near the 52-week high of ₹891.
- The price is trading above the 50-day moving average but remains below the 200-day moving average, indicating a medium-term bullish trend with some longer-term resistance.
- Momentum indicators show a Relative Strength Index (RSI) in the upper range, MACD is positive with bullish crossover signals, and Stochastic oscillators indicate overbought conditions.
- Daily and weekly timeframes confirm strong bullish momentum, while the monthly timeframe suggests consolidation near resistance levels.
- Potential market scenarios include continuation of the upward trend if the price sustains above the 50-day moving average or a pullback towards support levels if momentum wanes.
Trending News
1. Headline: A 20% Single-Day Surge Takes Cemindia Projects Ltd to Its Upper Circuit Limit of Rs 815.25
Summary: The exchange ceiling stopped the rally, not the buyers, indicating that the stock’s momentum was constrained only by regulatory limits rather than a lack of enthusiasm. what does the full demand picture look like for Cemindia Projects Ltd once the circuit unlocks and normal trading resumes?
Sentiment: positive
2. Headline: Cemindia Projects Ltd Reports Strong Quarterly Financial Turnaround
Summary: Cemindia Projects Ltd has delivered a standout quarterly performance in March 2026, marking a significant turnaround in its financial trajectory. The construction company’s latest results reveal record-breaking revenue and profit metrics, prompting an upgrade in its Mojo Grade from Sell to Hold.
Sentiment: positive
3. Headline: Cemindia Projects shares hit 20% upper circuit, touch 4-month high after Q4 results | Stock Market News
Summary: Cemindia Projects shares surged 20% to ₹815 after a strong Q4 performance, with net profit up 114% to ₹242 crore. The company secured contracts worth ₹14,821 crore, boosting its total order book to ₹24,545 crore as of March 31, 2026.
Sentiment: positive
4. Headline: Cemindia Projects Q4 Results: Breaking Down Its ₹24,545 Cr Order Book and 118% Net Profit Growth
Summary: The shares of an Adani Group company specialising in heavy civil, infrastructure, and Engineering, Procurement, and Construction (EPC) projects, are in focus as they have surged 20 percent following their Q4 results.
Sentiment: positive
5. Headline: Adani Group stock hits upper circuit: Why this share rise 20% today despite market selloff - BusinessToday
Summary: Compared to its previous close at Rs 678 on Wednesday, shares of CemIndia Projects surged 20 per cent, hitting its upper circuit to Rs 814.55 on Thursday, commanding a total market capitalization of more than Rs 14,000 crore. The stock has zoomed more than 60 per cent in the April 2026.
Sentiment: positive
Recent Updates
News Summary
As of 2026-04-30. Cemindia Projects Limited has demonstrated a strong financial turnaround in FY26, reporting a profit of ₹597.73 crore on revenues of ₹10,237.54 crore, supported by a record order book of ₹24,545 crore. The company’s consolidated net profit for Q4 surged 114% year-on-year to ₹242 crore, with EBITDA increasing by 66%. The diversified order book includes significant contracts in maritime structures, urban infrastructure, and highways. Despite the strong earnings, the board decided not to propose a dividend for FY26, indicating a strategic focus on reinvestment for growth and operational scaling. The stock price responded positively, hitting a 20% upper circuit and reaching a four-month high, reflecting robust market enthusiasm.
News Sentiment
The overall sentiment from recent updates is strongly positive, driven by substantial earnings growth, record order inflows, and strategic reinvestment decisions by management. The stock’s sharp price appreciation and upper circuit hits underscore investor confidence. However, the absence of dividends and elevated debt levels temper the outlook slightly, suggesting cautious optimism. Institutional and retail investors appear encouraged by the company’s operational momentum and backing by the Adani Group, which supports future growth prospects.
Source List
- https://www.livemint.com/market/stock-market-news/multibagger-small-cap-cemindia-projects-stock-hits-20-upper-circuit-touches-4-month-high-after-q4-results-11777540727911.html
- https://whalesbook.com/corporate-news/English/industrial-goodsservices/Cemindia-FY26-Profit-Hits-indian-rupee59773-Cr-on-Record-indian-rupee24545-Cr-Order-Book/69f2410808235f0c2a1bfbcc
- https://www.whalesbook.com/news/English/industrial-goodsservices/Cemindia-Projects-Stock-Soars-to-indian-rupee80840-After-Strong-FY26-Results/69f2f85508235f0c2a1d6188
Analytical Overview
Analysis Summary
Cemindia Projects’ valuation metrics show a trailing P/E of 29.85 and forward P/E of 21.57, which are moderately above the industry average of 29.85, indicating a valuation premium justified by growth prospects. The company’s revenue growth rate of 3.1% quarterly and strong earnings growth of 27.4% year-over-year reflect a positive growth trajectory, although operating cash flow remains negative. Financial health is mixed, with a debt-to-equity ratio of 47.86% and negative operating cash flow contrasting with positive free cash flow, suggesting careful management of liabilities and capital expenditures. Sector-specific opportunities include infrastructure development driven by government initiatives and urbanization, while challenges involve regulatory scrutiny and competitive bidding. Considering India’s regulatory environment and economic outlook, Cemindia benefits from strong government infrastructure spending but must navigate macroeconomic and policy risks.
Overall Business and Market Assessment
Supporting Factors: a robust order book of ₹24,545 crore, strong return on equity of 20.3%, and backing by the Adani Group enhancing operational synergies
Risk Factors: the high debt levels and negative operating cash flow, which could impact liquidity and financial flexibility
SWOT Analysis
Strengths
- Strong order book valued at ₹24,545 crore supporting future revenue.
- High return on equity at 20.3% indicating efficient capital use.
- Backed by the Adani Group, providing operational synergies and market access.
- Diverse project portfolio across multiple infrastructure segments.
Weaknesses
- Negative operating cash flow over the trailing twelve months.
- Elevated debt-to-equity ratio near 48%, increasing financial risk.
- High price-to-book ratio of 6.84 indicating premium valuation.
- Limited institutional ownership at approximately 5%.
Opportunities
- Growing Indian infrastructure spending driven by government initiatives.
- Expansion into urban infrastructure and maritime projects.
- Potential for operational scaling through reinvestment of earnings.
- Synergies from integration with Adani Group’s infrastructure ecosystem.
Threats
- Regulatory and policy changes impacting construction and infrastructure sectors.
- Competitive pressures in bidding for large infrastructure contracts.
- Macroeconomic volatility affecting project financing and execution.
- Risks related to elevated debt and cash flow constraints.
Company Description
Cemindia Projects Limited is a well-established Indian construction and civil engineering company with a heritage dating back to 1931 under its earlier incorporation. Primarily engaged in urban infrastructure development, the company specializes in the construction of mass rapid transit systems, airports, highways, bridges, flyovers, and maritime structures such as jetties, breakwaters, and dry docks. Its comprehensive expertise extends to hydroelectric and irrigation projects, tunnels, dams, and industrial structures, alongside foundation and specialist engineering services including geotechnical investigations and ground improvement techniques. Following its acquisition by an Adani Group entity in 2025, Cemindia integrates access to a broad infrastructure ecosystem spanning ports, energy, transport, and logistics, boosting operational synergies. The firm serves a diverse clientele comprising government bodies and private sector clients, reflecting its significant role in India's infrastructure growth. With a workforce nearing 2,800 employees and a market capitalization in the multi-thousand crore range, Cemindia stands out as a major player in India's construction and engineering sector.