


Celanese Corporation (CE)
Stock Analysis Report
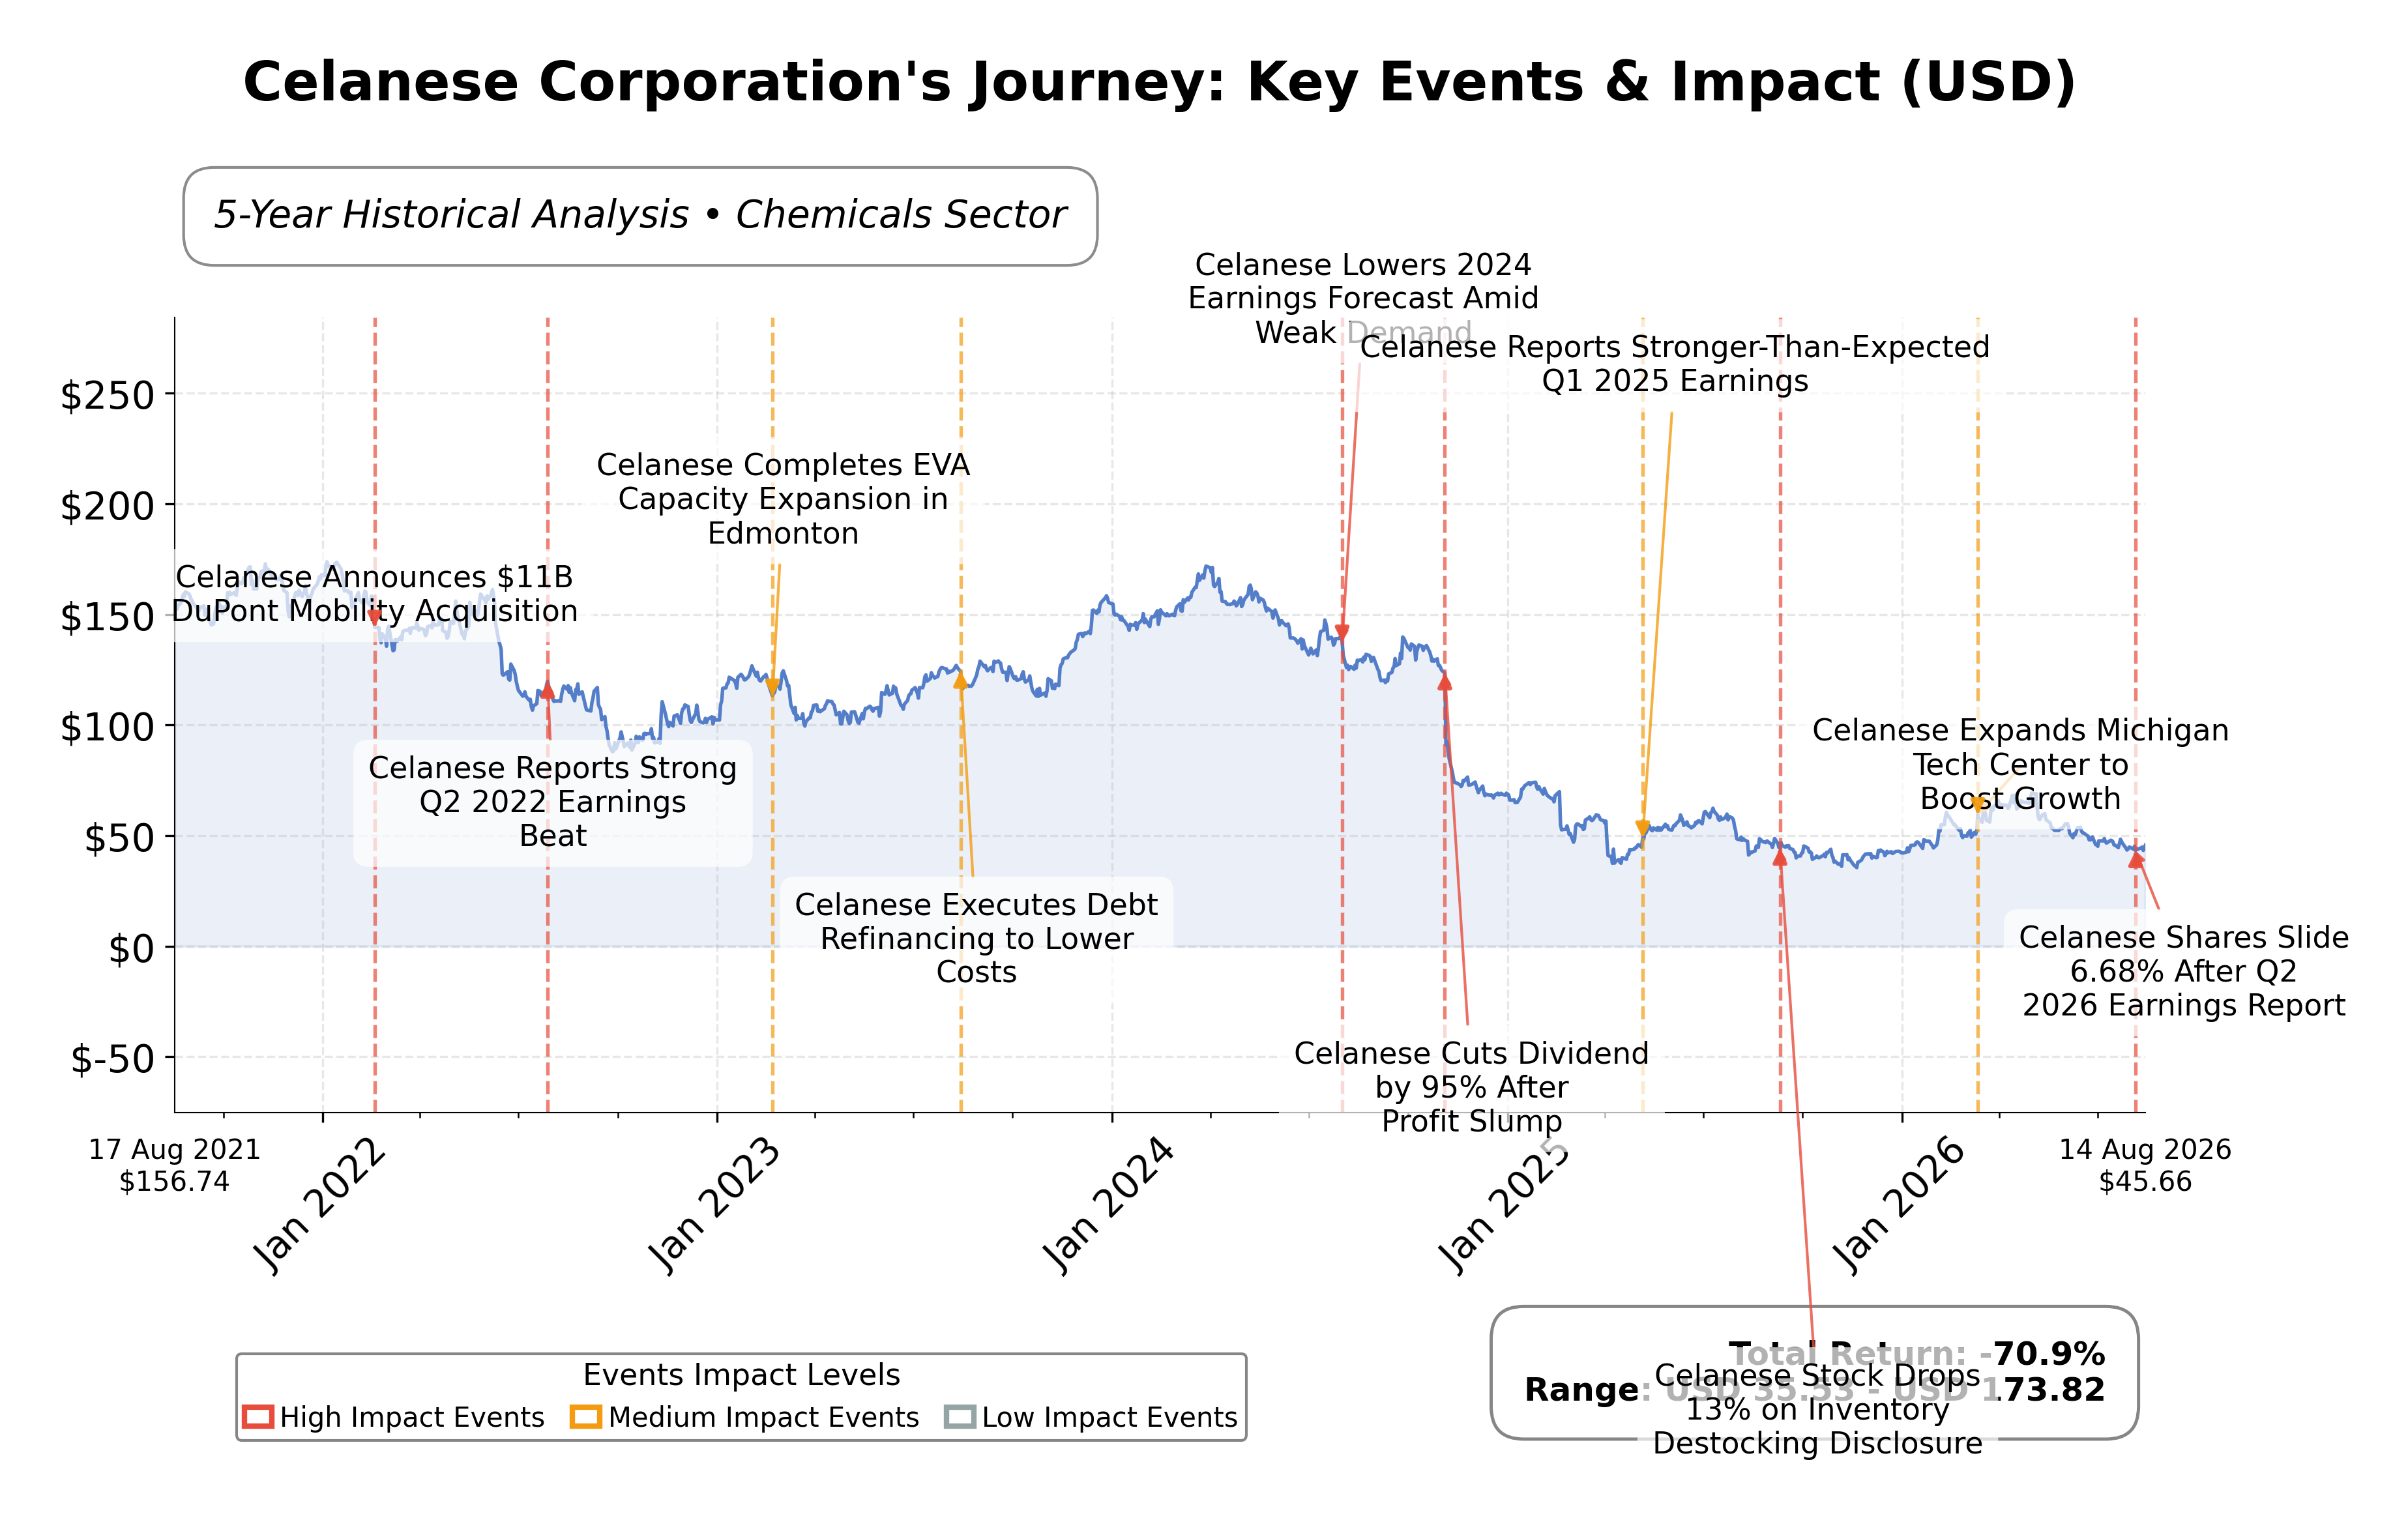
Stock Journey
Key Positives and Key Risks
Pros
- Trailing P/E ratio of 6.78 indicates the stock is trading at a relatively low valuation compared to earnings.
- Operating cash flow of $984 million and free cash flow near $985 million demonstrate strong cash generation capacity.
Cons
- Net income loss of $1.16 billion and negative ROE of -22.25% highlight ongoing profitability challenges.
- High debt-to-equity ratio of 270.2 signals significant financial leverage and potential risk.
- Profit margin compression due to volatile raw material costs and supply chain disruptions may pressure future earnings.
Disclosure: This information is for general awareness and does not constitute investment advice
Report Summary
Celanese Corporation operates as a global chemical and specialty materials company listed on the NYSE under the symbol CE. The company specializes in high-performance engineered polymers and acetyl products, serving diverse industrial and consumer markets including automotive, medical devices, electronics, construction, and energy storage. Positioned within the Basic Materials sector, Celanese maintains a significant footprint with manufacturing and R&D centers across North America, Europe, and Asia, enabling it to supply essential inputs for downstream manufacturing worldwide.
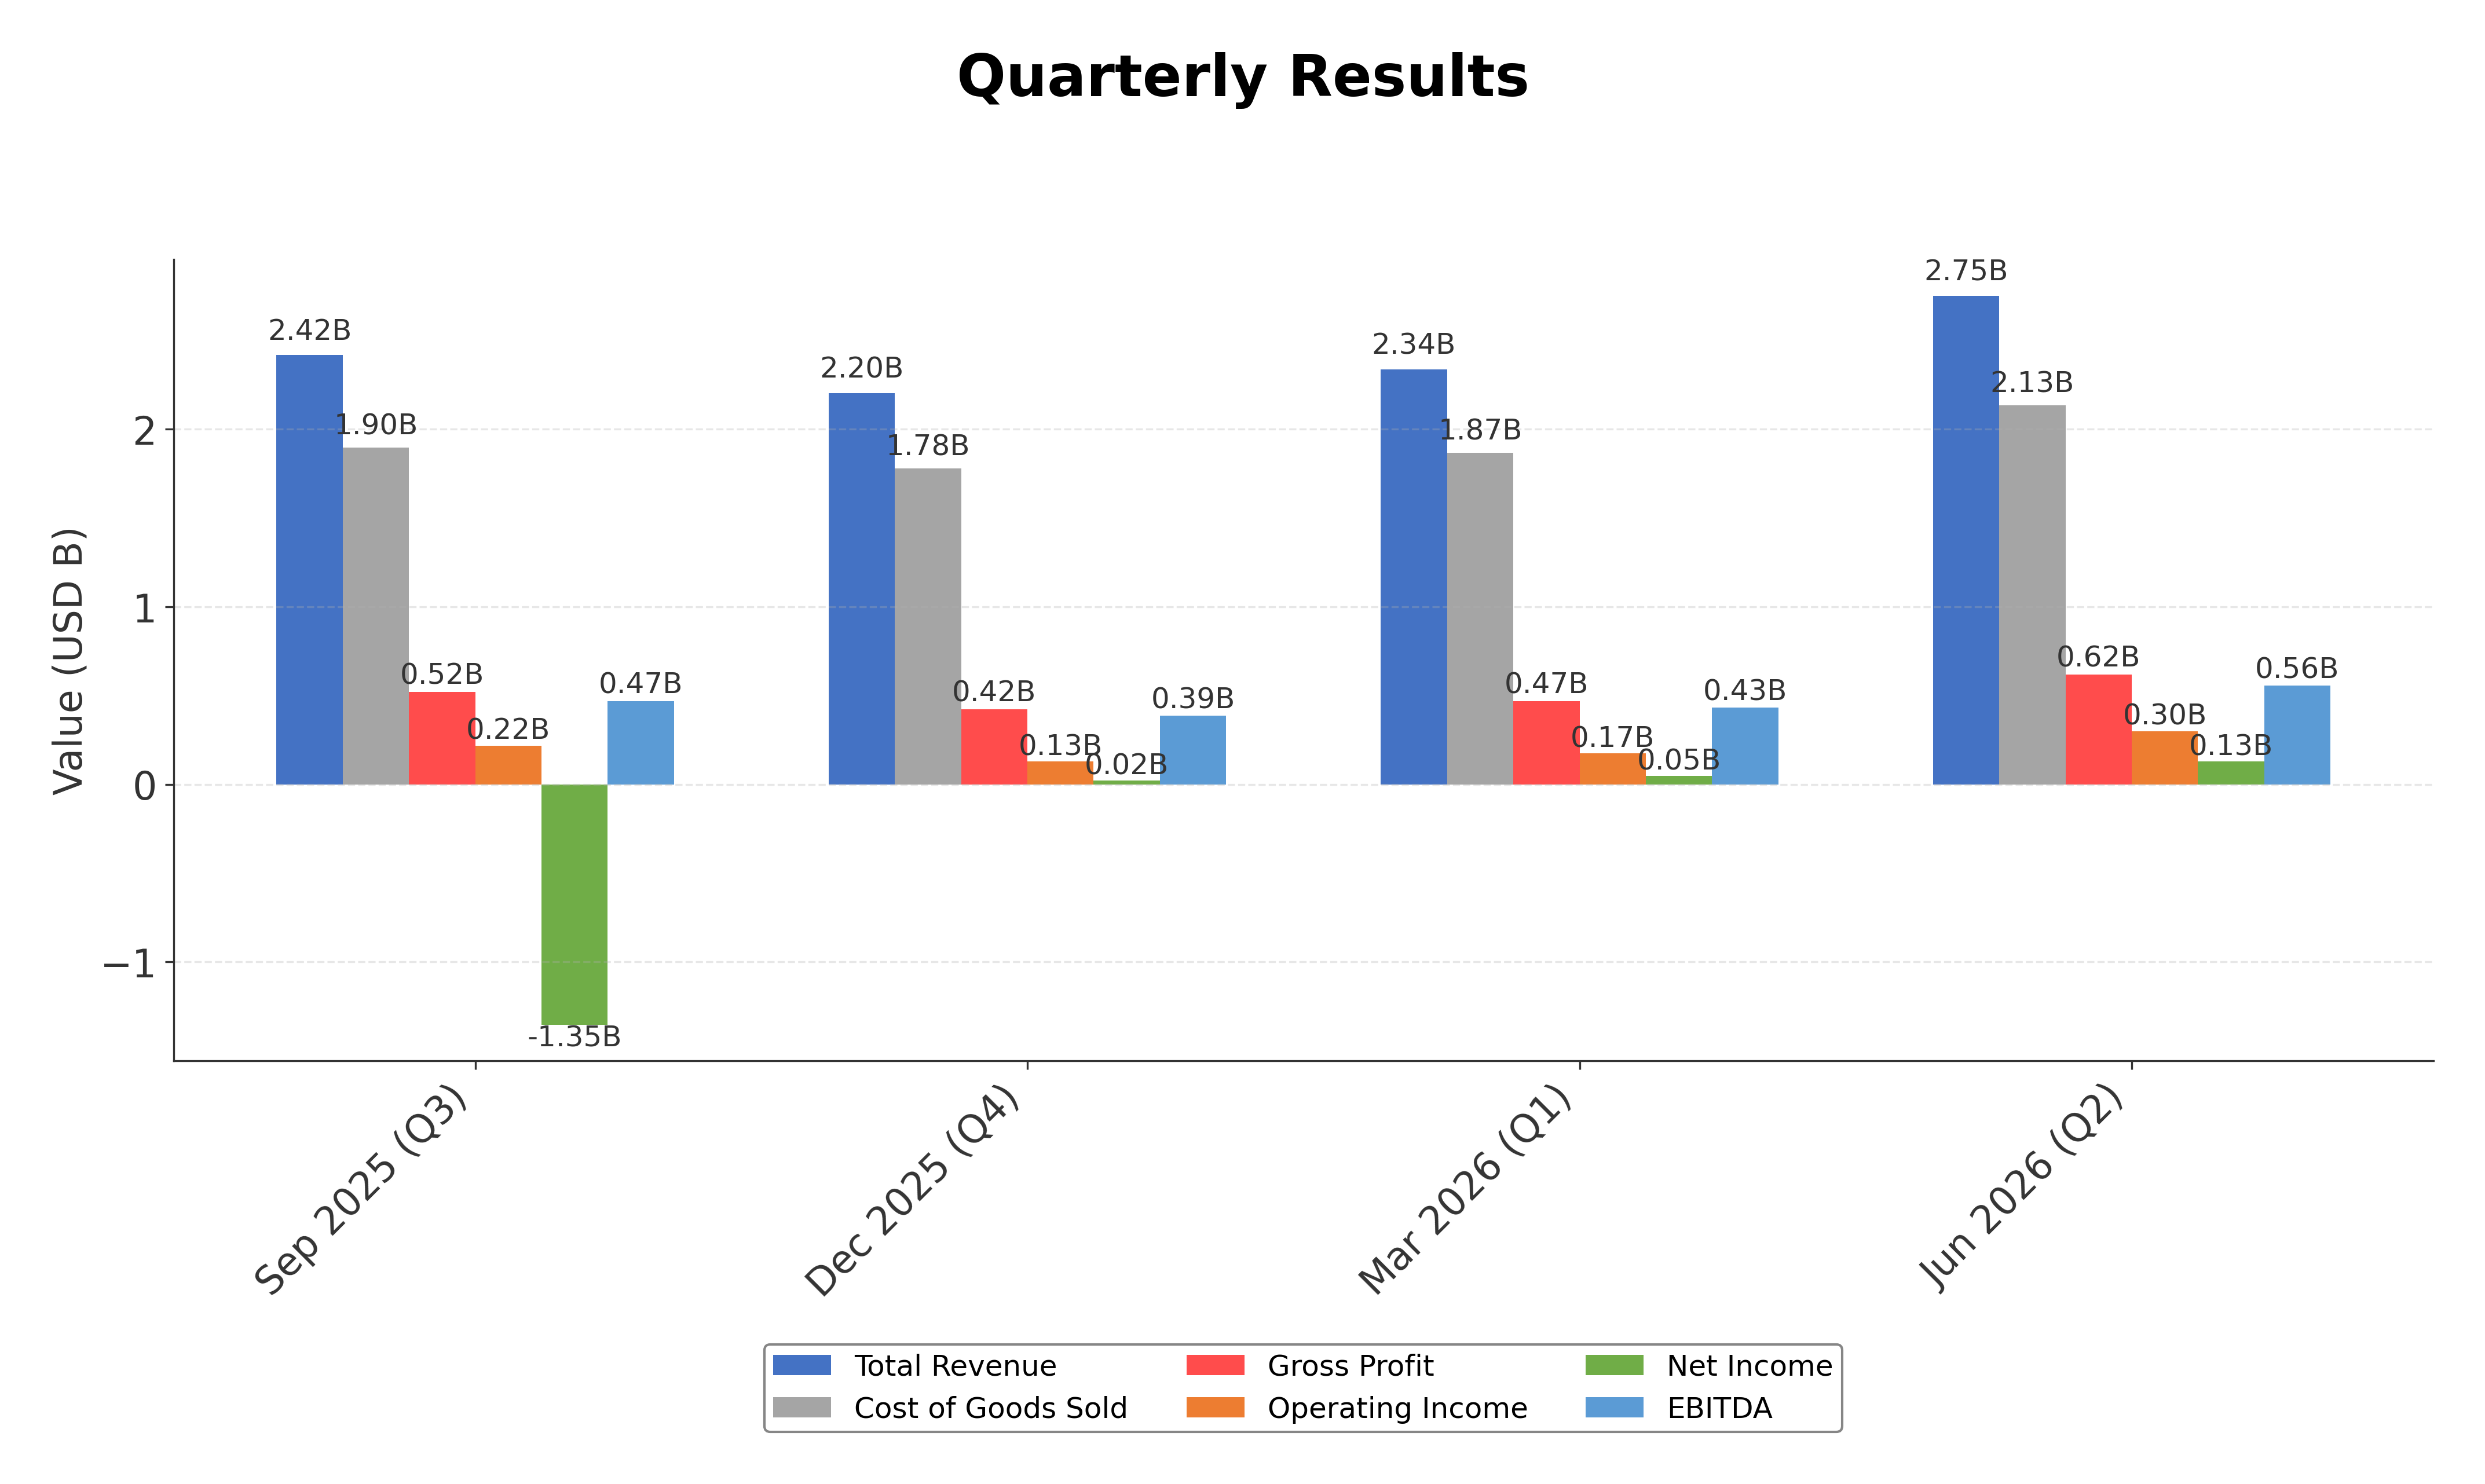
Financially, Celanese reported trailing twelve months (TTM) revenue of approximately $9.71 billion with a gross margin of 22.46% and an operating margin of 11.05%. However, the company posted a net loss margin of -12.04%, reflecting a net income loss of $1.16 billion over the same period. Return on equity (ROE) stands at -22.25%, and return on assets (ROA) is 2.57%, indicating challenges in profitability and capital efficiency despite positive operating cash flow of $984 million and free cash flow near $985 million.
Valuation metrics show a trailing price-to-earnings (P/E) ratio of 6.78 and a forward P/E of 7.39, with a price-to-book (P/B) ratio of 1.20 and an enterprise value to EBITDA (EV/EBITDA) multiple of 9.62. The market capitalization is approximately $5.01 billion, with the stock trading at $44.77, positioned near the midpoint of its 52-week range between $35.13 and $70.70. These valuation figures suggest the stock is priced modestly relative to earnings and book value, though the negative earnings and ROE warrant cautious interpretation.
Celanese’s strengths include a strong operating cash flow, a diversified product portfolio, and ongoing deleveraging efforts with a commitment to $1 billion in divestitures by 2027. Key risks involve volatile raw material costs, profit margin compression, and operational disruptions such as plant closures and joint venture performance. Recent strategic actions include facility closures in South Korea and Belgium to optimize the manufacturing footprint and insider buying activity by senior executives, signaling confidence in the company’s prospects.
Technically, the stock is trading below its 200-day moving average of $50.25 but above the 50-day average of $47.33, with momentum indicators reflecting mixed signals across timeframes. Recent news highlights earnings beats tempered by cautious guidance for the third quarter due to supply chain and margin pressures. Overall, the data suggests a balanced stance with attention to evolving operational and market conditions.
Company and Industry Overview
Company Basics
Price Performance
Company Size
Shareholding Pattern
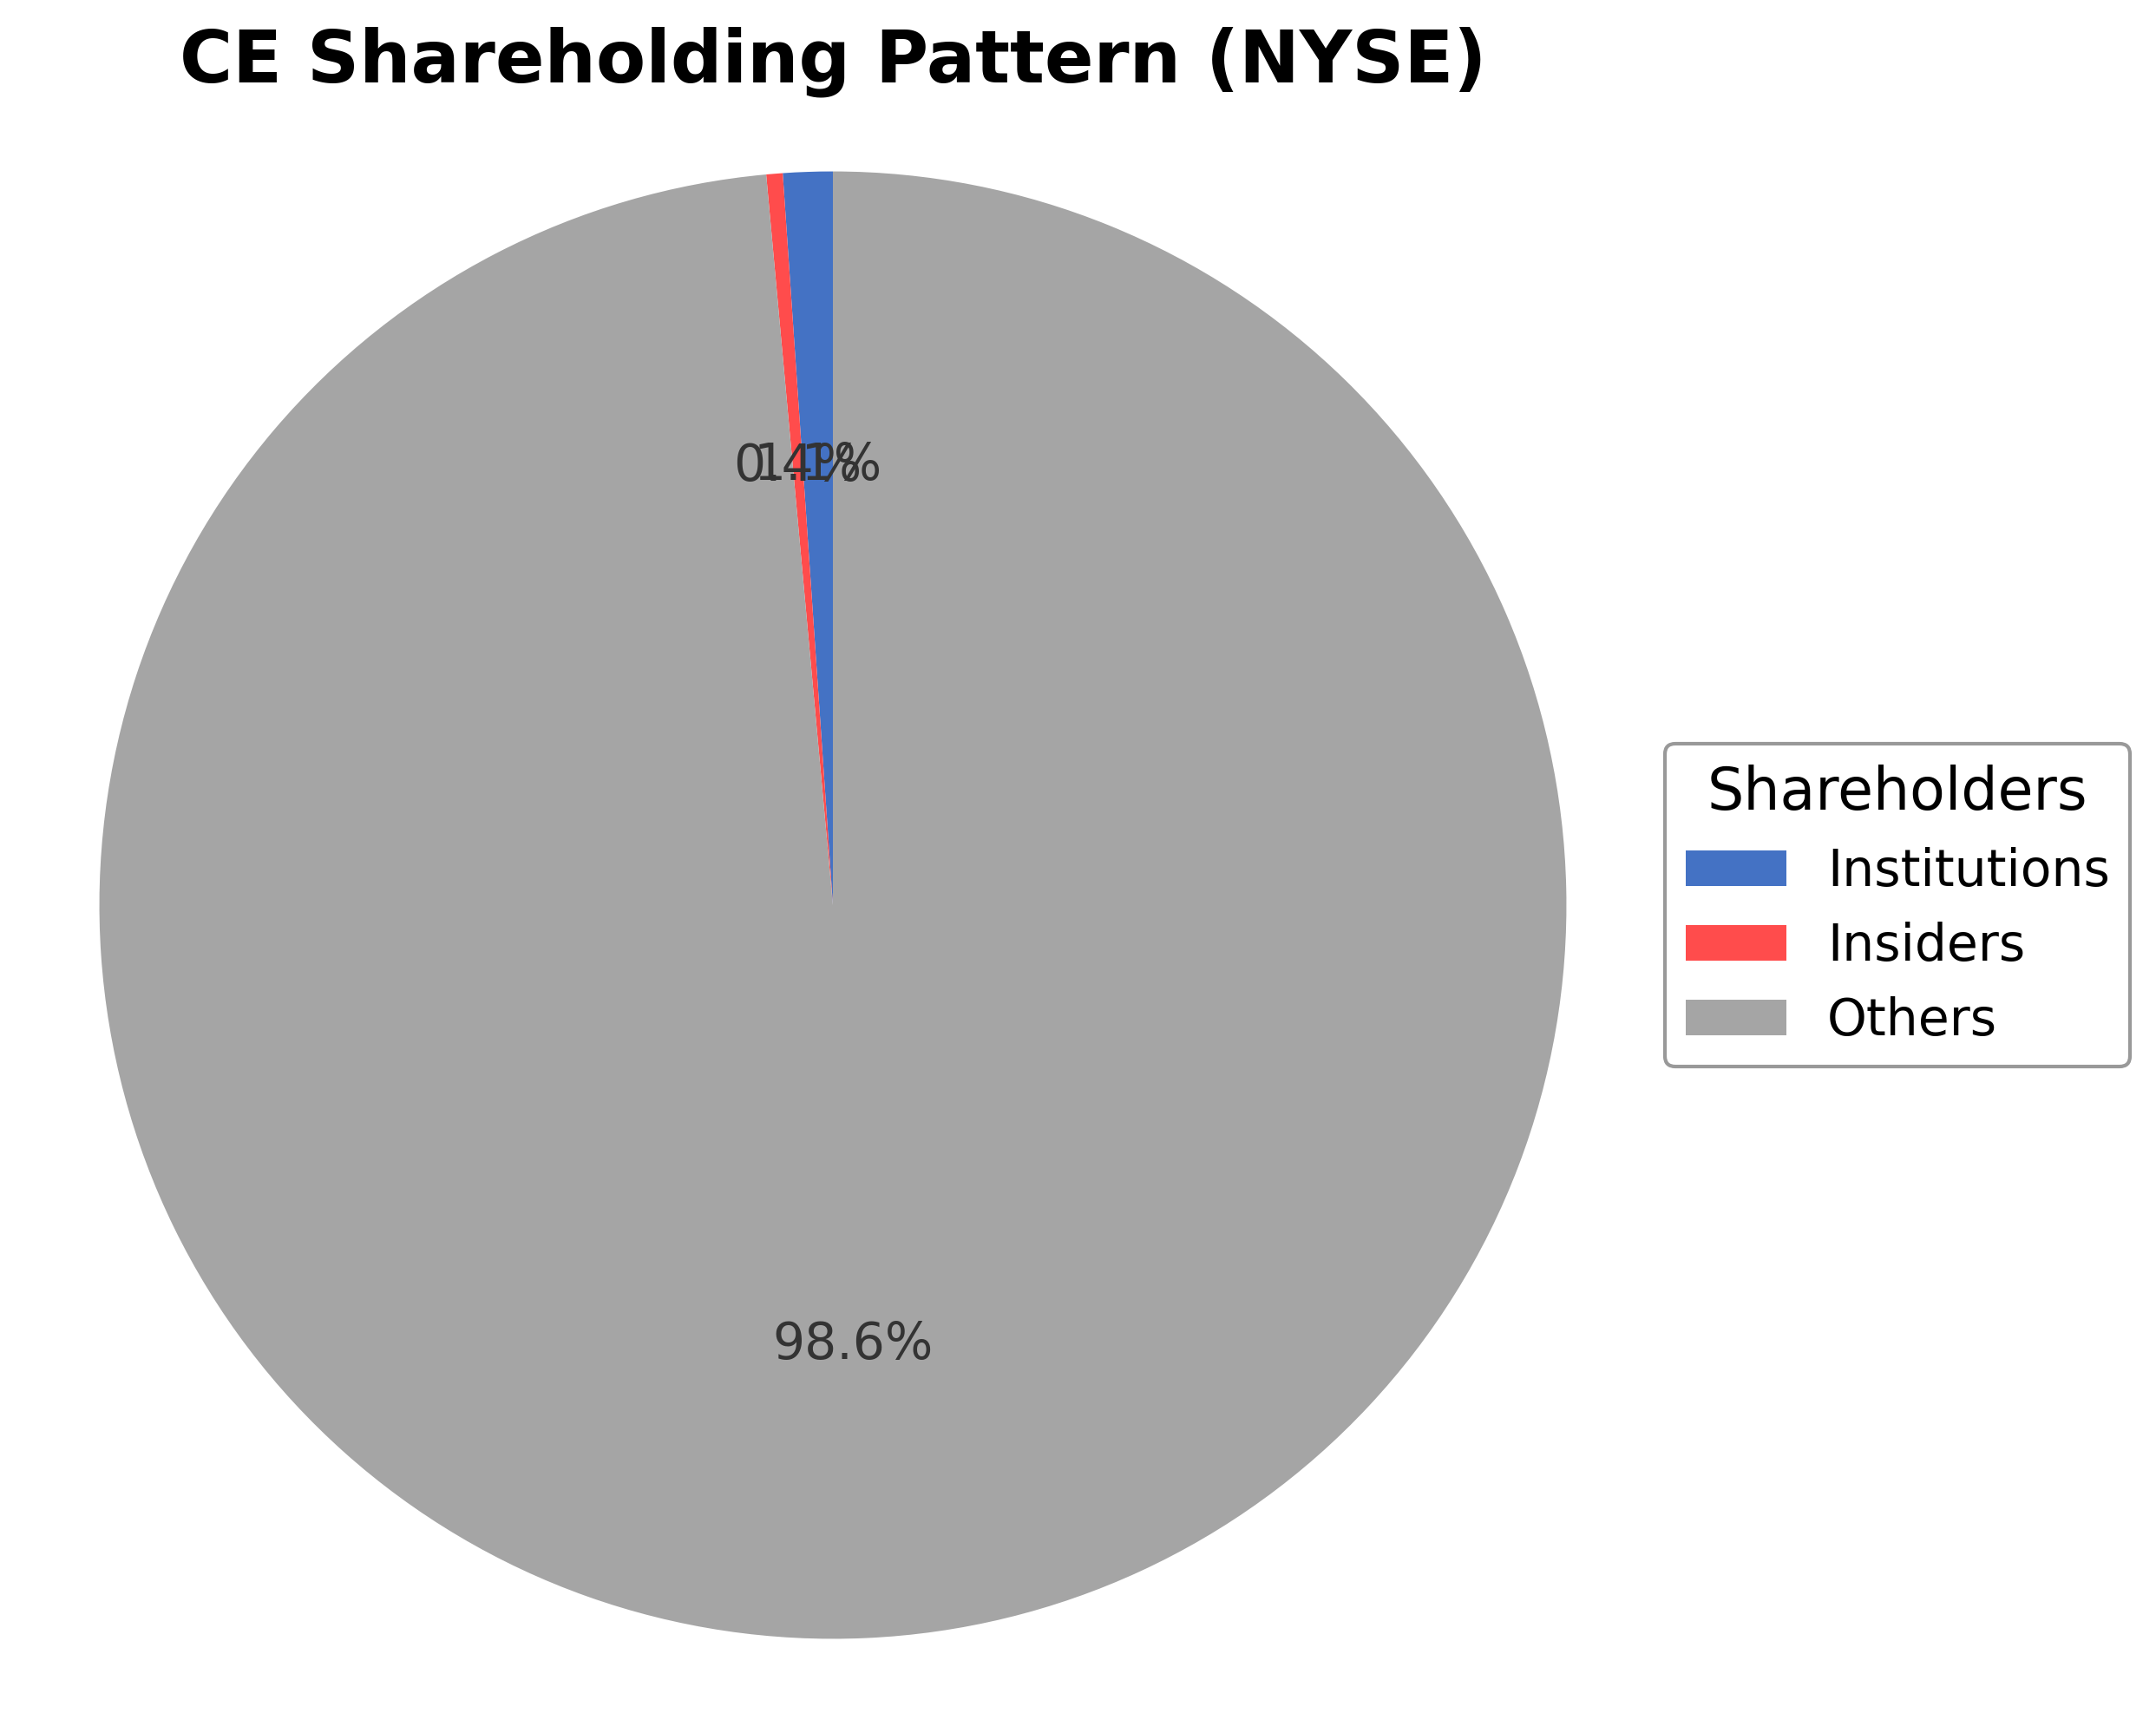
Celanese Corporation's ownership structure includes a modest insider shareholding of approximately 0.36%, with institutional investors holding about 109.45% of the shares, indicating significant institutional accumulation possibly due to derivative or leveraged positions. Public and other shareholder percentages are not explicitly detailed. Over the past 12-24 months, institutional ownership appears stable with some insider buying activity noted recently, reflecting confidence among senior management. This shareholding pattern suggests a governance framework influenced heavily by institutional investors, which may impact strategic decisions and corporate actions. The high institutional stake indicates strong market interest and potential influence on company direction, while insider holdings remain limited but active.
Sector and Industry Analysis
The Basic Materials sector, particularly the Chemicals industry, is a substantial global market driven by demand across automotive, construction, electronics, and medical end-markets. With revenues in the hundreds of billions globally, the sector experiences moderate growth influenced by industrial production cycles and raw material availability. Key players include diversified chemical producers such as Linde, Air Products, and Celanese Corporation, which collectively shape market dynamics through scale and product innovation.
Industry trends highlight a shift toward specialty chemicals and engineered materials with higher value-add and application specificity, reflecting customer demand for performance and sustainability. Competitive dynamics are characterized by significant capital intensity and technological expertise, creating high barriers to entry. Companies like Celanese leverage integrated operations and diversified product portfolios to maintain market share amid pricing pressures and input cost volatility.
The regulatory environment in the Chemicals sector is stringent, with oversight on environmental emissions, worker safety, and chemical handling standards imposed by agencies such as the EPA and OSHA in the U.S., and equivalent bodies globally. Increasing focus on sustainability and carbon footprint reduction is prompting investments in cleaner technologies and compliance measures. Regulatory compliance remains a critical factor influencing operational costs and strategic planning for industry participants.
Note: Analysis synthesized from industry research, market reports, and regulatory filings. Information is subject to change based on market conditions.
Financial Ratios Dashboard
Illustrative Scenario Analysis
DCF Assumptions:
Method: Two-Stage EPS-Priority Model
Financials
Peer Analysis
| Company Name | Market Cap | P/E Ratio | P/B Ratio | EV/EBITDA | Price to CFO |
|---|---|---|---|---|---|
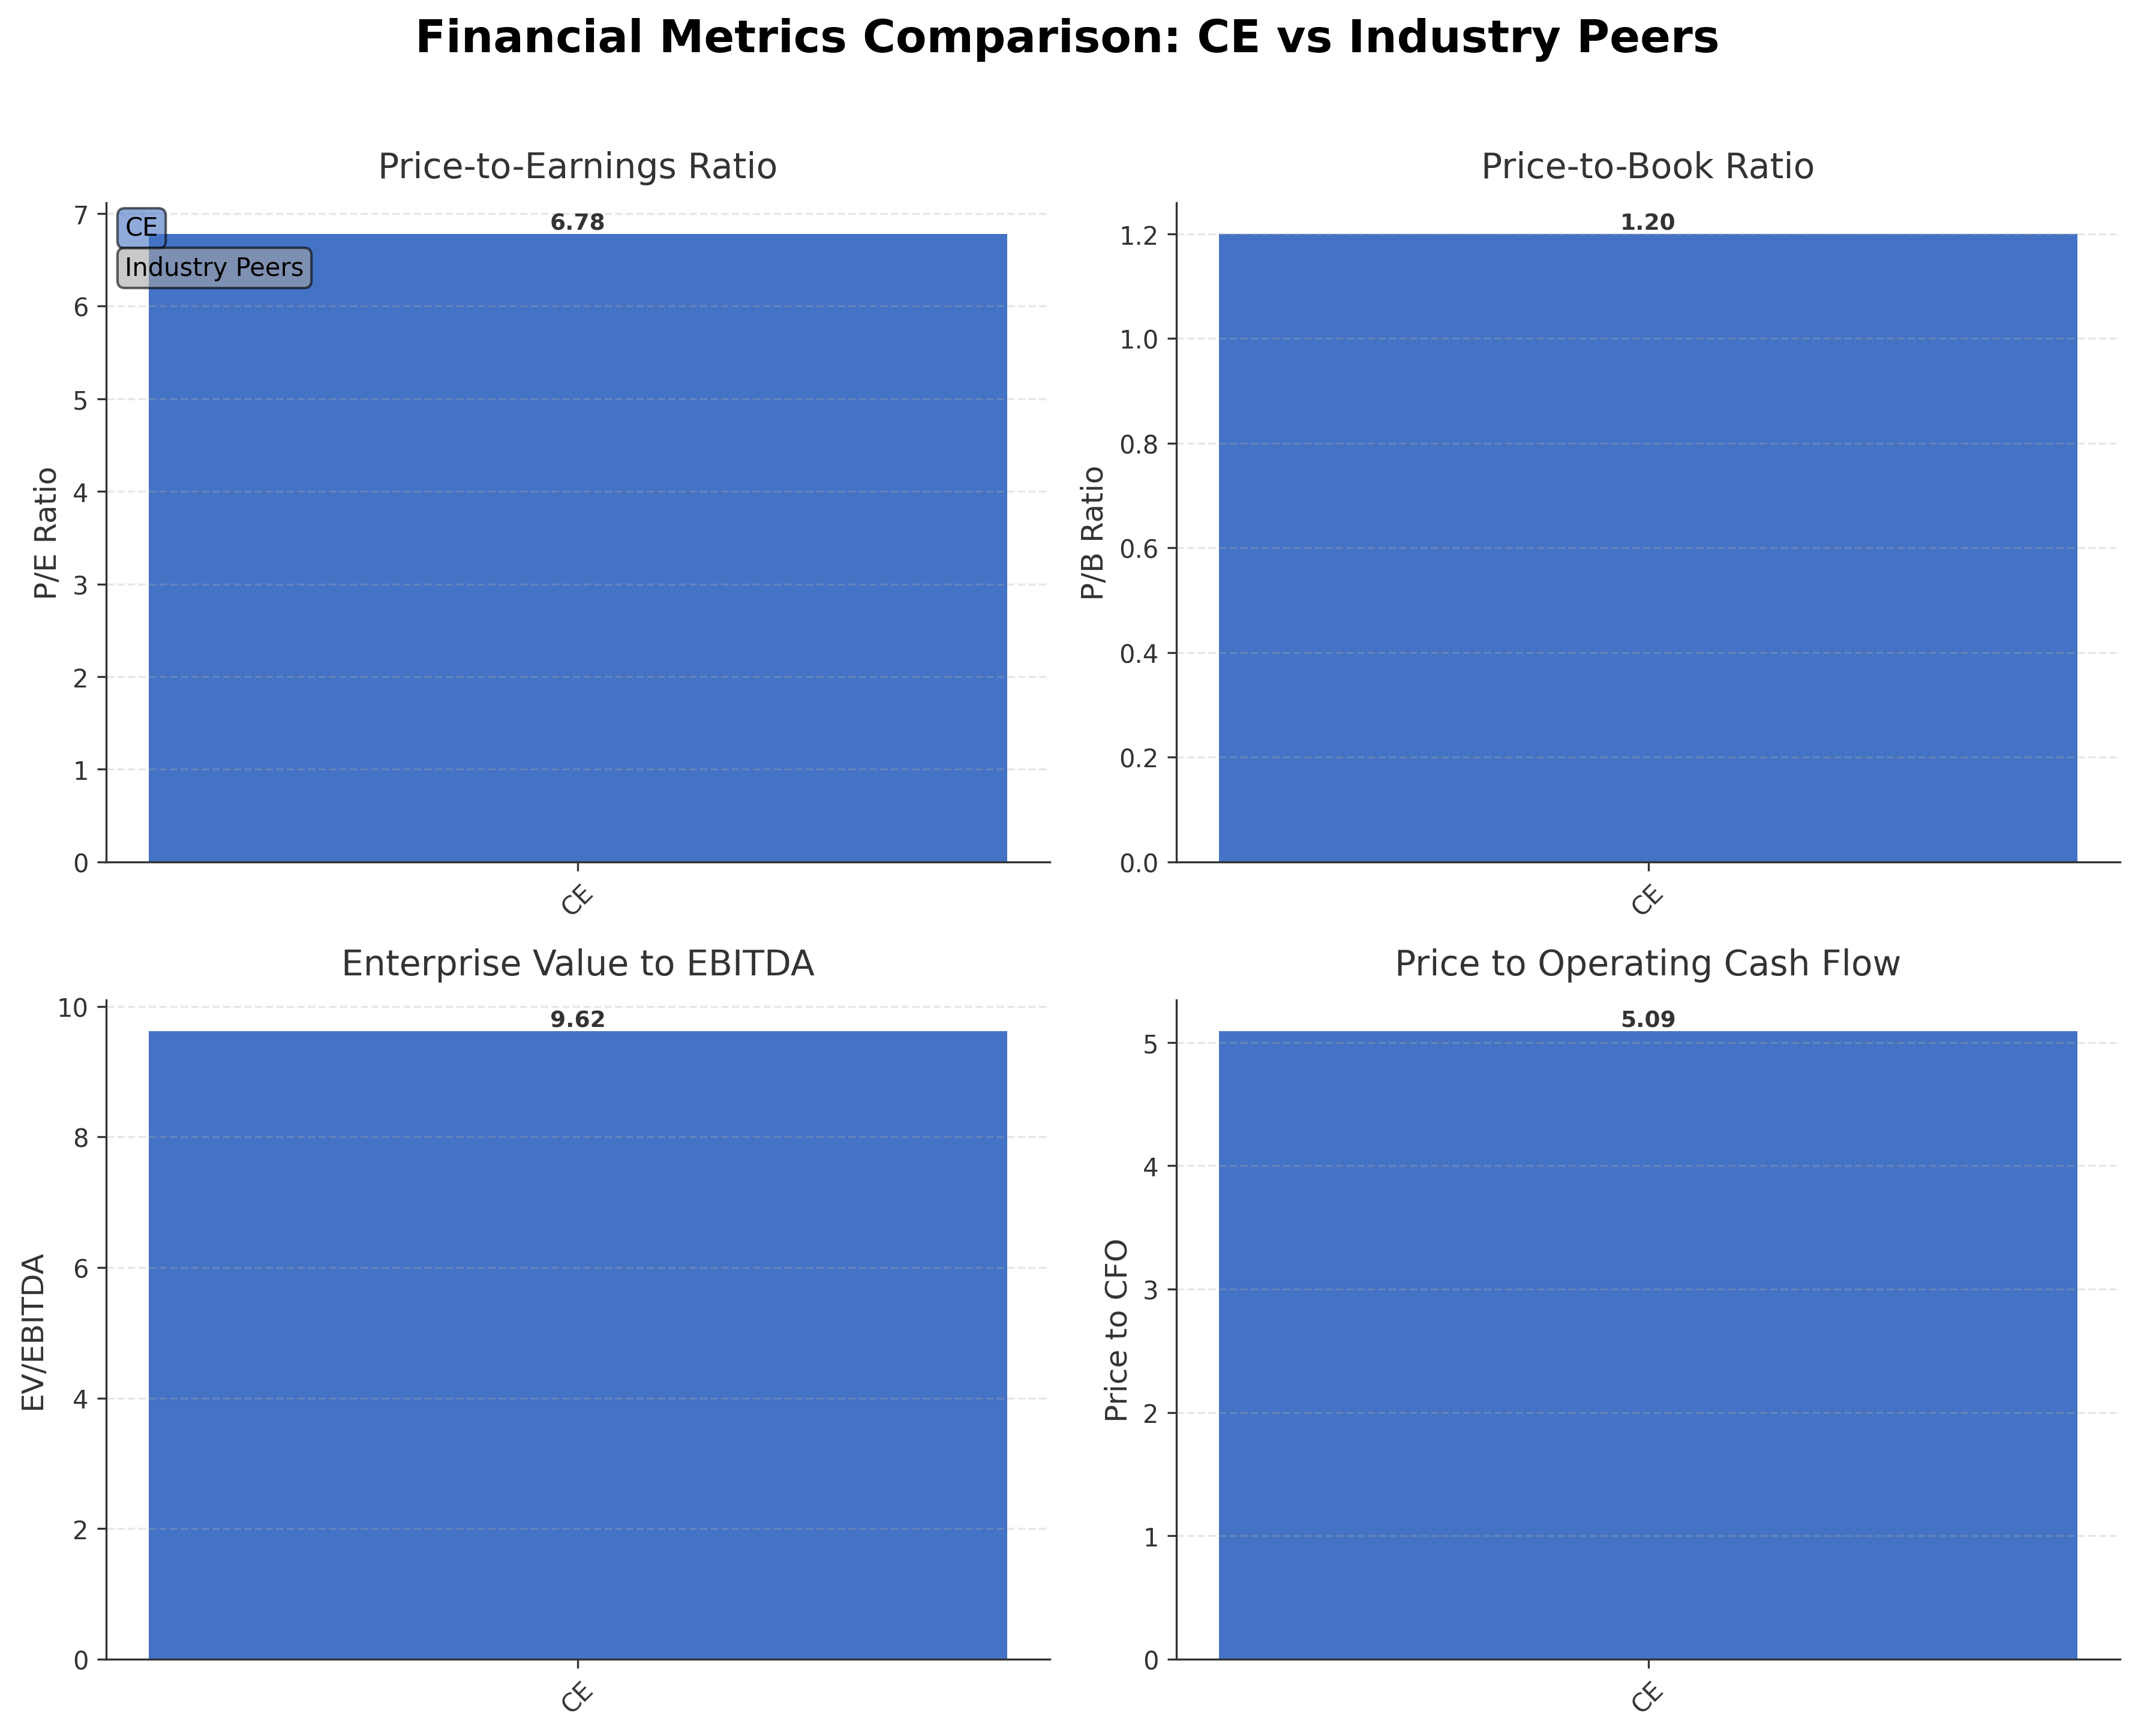
| Celanese Corporation | $5.01B | 6.78 | 1.20 | 9.62 | 5.09 |
Comparison Analysis: Celanese Corporation currently stands as a mid-cap player within the Chemicals industry, with a market capitalization of $5.01 billion. Its valuation multiples, including a P/E ratio of 6.78 and EV/EBITDA of 9.62, are modest and suggest the stock is trading at a discount relative to earnings and cash flow. The company’s negative return on equity of -22.25% indicates profitability challenges compared to typical industry peers, though cash flow metrics remain positive. The absence of direct peer data limits detailed comparative insights, but Celanese's valuation and financial profile position it as a potentially undervalued entity within its sector.
Financial Metrics Comparison with Peers
Financial Statements
Comprehensive financial data including income, balance sheet, and cash flow metrics
Income Statement
| fiscal_date | 2025-12-31 | 2024-12-31 | 2023-12-31 | 2022-12-31 | 2021-12-31 |
|---|---|---|---|---|---|
| Sales | 9.54B | 10.28B | 10.94B | 9.67B | 8.54B |
| Cost Of Goods | 7.59B | 7.92B | 8.34B | 7.29B | 5.86B |
| Gross Profit | 1.95B | 2.36B | 2.60B | 2.38B | 2.68B |
| Operating Expense Research And Development | 125.00M | 130.00M | 146.00M | 112.00M | 86.00M |
| Operating Expense Selling General And Administrative | 899.00M | 1.03B | 1.07B | 824.00M | 633.00M |
| Operating Income | 764.00M | 1.04B | 1.22B | 1.38B | 1.94B |
| Non Operating Interest Income | 24.00M | 33.00M | 39.00M | 69.00M | 8.00M |
| Non Operating Interest Expense | 701.00M | 676.00M | 720.00M | 405.00M | 91.00M |
| Other Income Expense | -1.24B | -1.39B | 653.00M | 375.00M | 402.00M |
| Pretax Income | -1.22B | -996.00M | 1.18B | 1.42B | 2.25B |
| Income Tax | -90.00M | 510.00M | -790.00M | -489.00M | 330.00M |
| Net Income | -1.15B | -1.51B | 1.96B | 1.90B | 1.90B |
| Eps Basic | -10.64 | -13.93 | 18.01 | 17.48 | 16.99 |
| Eps Diluted | -10.64 | -13.93 | 17.92 | 17.34 | 16.86 |
| Basic Shares Outstanding | 109.53M | 109.30M | 108.80M | 108.40M | 111.20M |
| Diluted Shares Outstanding | 109.53M | 109.30M | 108.80M | 108.40M | 111.20M |
| Ebit | -519.00M | -320.00M | 1.90B | 1.83B | 2.34B |
| Ebitda | 1.70B | 2.11B | 2.05B | 2.17B | 2.56B |
| Net Income Continuous Operations | -1.15B | -1.51B | 1.96B | 1.90B | 1.90B |
| Minority Interests | -14.00M | -8.00M | -4.00M | -8.00M | -6.00M |
Data provided by Twelve Data
Balance Sheet
| fiscal_date | 2025-12-31 | 2024-12-31 | 2023-12-31 | 2022-12-31 | 2021-12-31 |
|---|---|---|---|---|---|
| Cash And Cash Equivalents | 1.26B | 962.00M | 1.80B | 1.51B | 536.00M |
| Accounts Receivable | 922.00M | 1.12B | 1.24B | 1.38B | 1.16B |
| Total Assets | 21.70B | 22.86B | 26.60B | 26.27B | 11.97B |
| Total Liabilities | 17.22B | 17.25B | 19.05B | 20.17B | 7.44B |
| Long Term Debt | 11.66B | 11.37B | 12.63B | 13.74B | 3.38B |
| Shareholders Equity | 4.47B | 5.61B | 7.55B | 6.11B | 4.54B |
Data provided by Twelve Data
Cash Flow Statement
| fiscal_date | 2025-12-31 | 2024-12-31 | 2023-12-31 | 2022-12-31 | 2021-12-31 |
|---|---|---|---|---|---|
| Operating Activities Net Income | -1.15B | -1.51B | 1.96B | 1.90B | 1.90B |
| Operating Activities Depreciation | 786.00M | 823.00M | 739.00M | 478.00M | 378.00M |
| Operating Activities Deferred Taxes | -278.00M | 216.00M | -967.00M | -835.00M | 13.00M |
| Operating Activities Stock Based Compensation | 24.00M | 32.00M | 40.00M | 60.00M | 95.00M |
| Operating Activities Other Non Cash Items | 35.00M | -29.00M | -27.00M | -122.00M | -159.00M |
| Operating Activities Accounts Receivable | 213.00M | 92.00M | 105.00M | 218.00M | -396.00M |
| Operating Activities Accounts Payable | 26.00M | -234.00M | 20.00M | -84.00M | 353.00M |
| Operating Activities Other Assets Liabilities | -4.00M | -62.00M | 391.00M | 146.00M | -445.00M |
| Operating Activities Operating Cash Flow | 1.15B | -676.00M | 2.27B | 1.76B | 1.74B |
| Investing Activities Capital Expenditures | -343.00M | N/A | N/A | N/A | N/A |
| Investing Activities Net Acquisitions | 21.00M | 0.00 | 532.00M | -10.54B | -1.11B |
| Investing Activities Other Investing Activity | -27.00M | -52.00M | -98.00M | -57.00M | -53.00M |
| Investing Activities Investing Cash Flow | -349.00M | -35.00M | 434.00M | -10.60B | -652.00M |
| Financing Activities Long Term Debt Issuance | 4.35B | 328.00M | 3.00B | 10.77B | 990.00M |
| Financing Activities Long Term Debt Payments | -5.29B | -1.45B | -4.54B | -526.00M | -792.00M |
| Financing Activities Short Term Debt Issuance | -23.00M | -243.00M | -429.00M | 536.00M | 200.00M |
| Financing Activities Common Dividends | -13.00M | -307.00M | -305.00M | -297.00M | -304.00M |
| Financing Activities Other Financing Charges | -177.00M | -59.00M | -63.00M | -175.00M | -142.00M |
| Financing Activities Financing Cash Flow | -1.15B | -1.73B | -2.34B | 10.29B | -1.05B |
| End Cash Position | 1.26B | 962.00M | 1.80B | 1.51B | 536.00M |
| Income Tax Paid | 671.00M | 701.00M | 780.00M | 273.00M | 215.00M |
| Interest Paid | 255.00M | 349.00M | 237.00M | 122.00M | 105.00M |
| Free Cash Flow | 803.00M | 531.00M | 1.33B | 1.28B | 1.29B |
| Investing Activities Sale Of Investments | N/A | 17.00M | 0.00 | 0.00 | 516.00M |
| Financing Activities Common Stock Repurchase | N/A | 0.00 | 0.00 | -17.00M | -1.00B |
| Investing Activities Purchase Of Investments | N/A | N/A | N/A | 0.00 | 0.00 |
Data provided by Twelve Data
Technical Analysis
Key Insights
- Current trend shows mixed price action with the stock trading below its 200-day moving average ($50.25) but above the 50-day moving average ($47.33), indicating short-term support amid longer-term resistance.
- Key support levels are near the 52-week low of $35.13 and the 50-day moving average at approximately $47.33, while resistance is observed around the 200-day moving average at $50.25 and the recent 52-week high of $70.70.
- The stock is positioned below the 200-day moving average, suggesting a longer-term bearish trend, but remains above the 10-day and 50-day moving averages, reflecting some short-term bullish momentum.
- Momentum indicators show the Relative Strength Index (RSI) in a neutral range, MACD signals a potential convergence without clear trend direction, and Stochastic oscillators indicate mixed momentum across daily and weekly timeframes.
- Multi-timeframe analysis reveals consolidation on daily charts, with weekly and monthly charts indicating a longer-term sideways to slightly bearish trend.
- Potential market scenarios include a test of support near $44-$47 levels with possible rebound attempts, while failure to hold support could lead to further downside pressure toward the 52-week low.
Trending News
1. Headline: Celanese SVP Murray buys $98,004 in common stock By Investing.com
Summary: Murray beneficially owns 30,432 shares of Celanese common stock. The filing was signed by Christine Dryden, Attorney-in-Fact for Mark Christopher Murray, on August 12, 2026. For deeper insights into Celanese’s valuation and growth prospects, InvestingPro offers a comprehensive Pro Research Report covering this and 1,400+ other US equities. In other recent news...
Sentiment: neutral
2. Headline: Celanese Corp SVP & General Counsel Acquires 600 Shares in Open Market Transaction
Summary: World Acceptance Corporation Greenlights $50 Million Stock Buyback Pro... Granite Construction Completes $273.7M Convertible Notes Conversion an... ... A Form 4 filing submitted to the SEC on August 13, 2026, reveals that Ashley B. Duffie, Senior Vice President and General Counsel of Celanese Corp ...
Sentiment: neutral
3. Headline: Celanese Corp (CE) SVP & GC Ashley Duffie purchases 600 shares at $45.60
Summary: It matters to investors because the amount people save and how employers fund these plans influence consumer spending, corporate payroll costs and the flow of money into financial markets, which can affect stock prices and company valuations. Celanese reported that Ashley B.
Sentiment: neutral
4. Headline: Top Celanese Executive Makes Bold Insider Move on Company Stock - TipRanks.com
Summary: New insider activity at Celanese ( ($CE) ) has taken place on August 12, 2026. Celanese has seen notable insider activity as Senior Vice President of Acetyls, Mark ...
Sentiment: neutral
5. Headline: Celanese (CE) Beat Estimates, So Why Is Guidance Getting Trickier?
Summary: Celanese (NYSE:CE) walked into its August 4 earnings call having beaten the plan it laid out back in May, then spent the call flagging a bumpier third quarter ahead. CEO Scott Richardson and CFO Chuck Kyrish explained why: the company’s global production network flexed hard in the second ...
Sentiment: positive
Powered by Brave
Recent Updates
News Summary
As of August 12, 2026. Celanese Corporation reported second quarter 2026 earnings that exceeded analyst estimates, driven by strong pricing actions and operational flexibility within its Engineered Materials and Acetyl Chain segments. Management highlighted successful realignment toward higher-value subsegments such as electronics and medical, which contribute disproportionately to margins. The company is actively executing a footprint optimization strategy, including closures of facilities in South Korea and Belgium, aimed at reducing fixed costs and enhancing competitiveness. Despite these positives, the outlook for the third quarter is cautious due to accelerated plant shutdowns, inventory absorption impacts, and lower equity earnings from the Ibn Sina joint venture. Celanese remains committed to deleveraging, targeting $1 billion in divestitures by the end of 2027, and sustaining free cash flow guidance of $700 million to $800 million annually.
News Sentiment
The overall sentiment from recent updates is mixed to cautiously positive. Earnings beats and strategic initiatives such as footprint optimization and divestiture plans support a constructive view on operational discipline and cash flow generation. However, concerns around third quarter margin compression, supply chain disruptions, and equity earnings shortfalls temper enthusiasm. Insider buying activity by senior executives adds a neutral to positive tone, suggesting confidence in the company’s medium-term prospects. The balance of these factors points to a measured outlook with attention to near-term execution risks.
Source List
- https://finance.yahoo.com/markets/stocks/articles/celanese-ce-beat-estimates-why-215527585.html
- https://www.theglobeandmail.com/investing/markets/stocks/CE-N/pressreleases/3793430/celanese-ce-q2-2026-earnings-call-transcript/
- https://investors.celanese.com/
Analytical Overview
Analysis Summary
Celanese’s valuation metrics, including a trailing P/E of 6.78 and forward P/E of 7.39, are below or near industry averages, suggesting the stock is attractively priced relative to earnings despite recent net losses. Revenue growth of 8.7% quarter-over-quarter and positive operating cash flow trends indicate a recovering growth trajectory, although net income remains negative. The company’s financial health shows a high debt-to-equity ratio of 270.2, reflecting significant leverage, but operating cash flow and free cash flow generation provide some offset. Sector-specific challenges include raw material cost volatility and supply chain disruptions, while opportunities arise from strategic divestitures and focus on high-margin engineered materials. Market positioning benefits from diversified end markets and global manufacturing footprint.
Overall Business and Market Assessment
Supporting Factors: strong operating cash flow generation, ongoing deleveraging efforts, and strategic focus on higher-value product segments
Risk Factors: the high leverage level, negative net income, and margin pressures from raw material inflation and supply chain issues
SWOT Analysis
Strengths
- Strong operating cash flow and free cash flow generation.
- Diversified product portfolio serving multiple industrial and consumer sectors.
- Global manufacturing and R&D footprint across North America, Europe, and Asia.
- Committed deleveraging strategy with $1 billion divestiture target by 2027.
Weaknesses
- Negative net income and return on equity indicating profitability challenges.
- High debt-to-equity ratio of 270.2 reflecting significant financial leverage.
- Profit margin compression due to volatile raw material costs.
- Recent plant closures causing operational disruptions and inventory absorption.
Opportunities
- Growth potential in high-margin engineered materials segments such as electronics and medical.
- Strategic divestitures to optimize portfolio and improve capital structure.
- Pricing actions to offset raw material inflation.
- Expansion in emerging markets through global production network.
Threats
- Continued volatility in raw material prices impacting margins.
- Supply chain disruptions affecting production and delivery schedules.
- Competitive pressures within the specialty chemicals industry.
- Geopolitical risks influencing global acetyl chain supply dynamics.
Company Description
Celanese Corporation is a global chemical and specialty materials company that focuses on high-performance engineered polymers and acetyl products used across a broad range of industrial and consumer applications. The company’s engineered materials portfolio includes advanced polymers and compounds tailored for demanding uses in automotive components, medical devices, consumer electronics, construction materials, filtration systems, and energy storage solutions. Its acetyl chain business produces key intermediate chemicals such as acetic acid, vinyl acetate monomer, and related derivatives that serve as critical inputs for adhesives, coatings, paints, packaging, textiles, and various industrial processes. Celanese operates extensive manufacturing, R&D, and technical centers across North America, Europe, and Asia, supplying customers worldwide through a network of production facilities and strategic affiliates. Headquartered in Irving, Texas, Celanese today plays a significant role in the specialty chemicals and materials market as a major supplier of essential inputs that support downstream manufacturing and everyday consumer products across multiple sectors.