


BPCL (BPCL)
Stock Analysis Report
Stock Journey
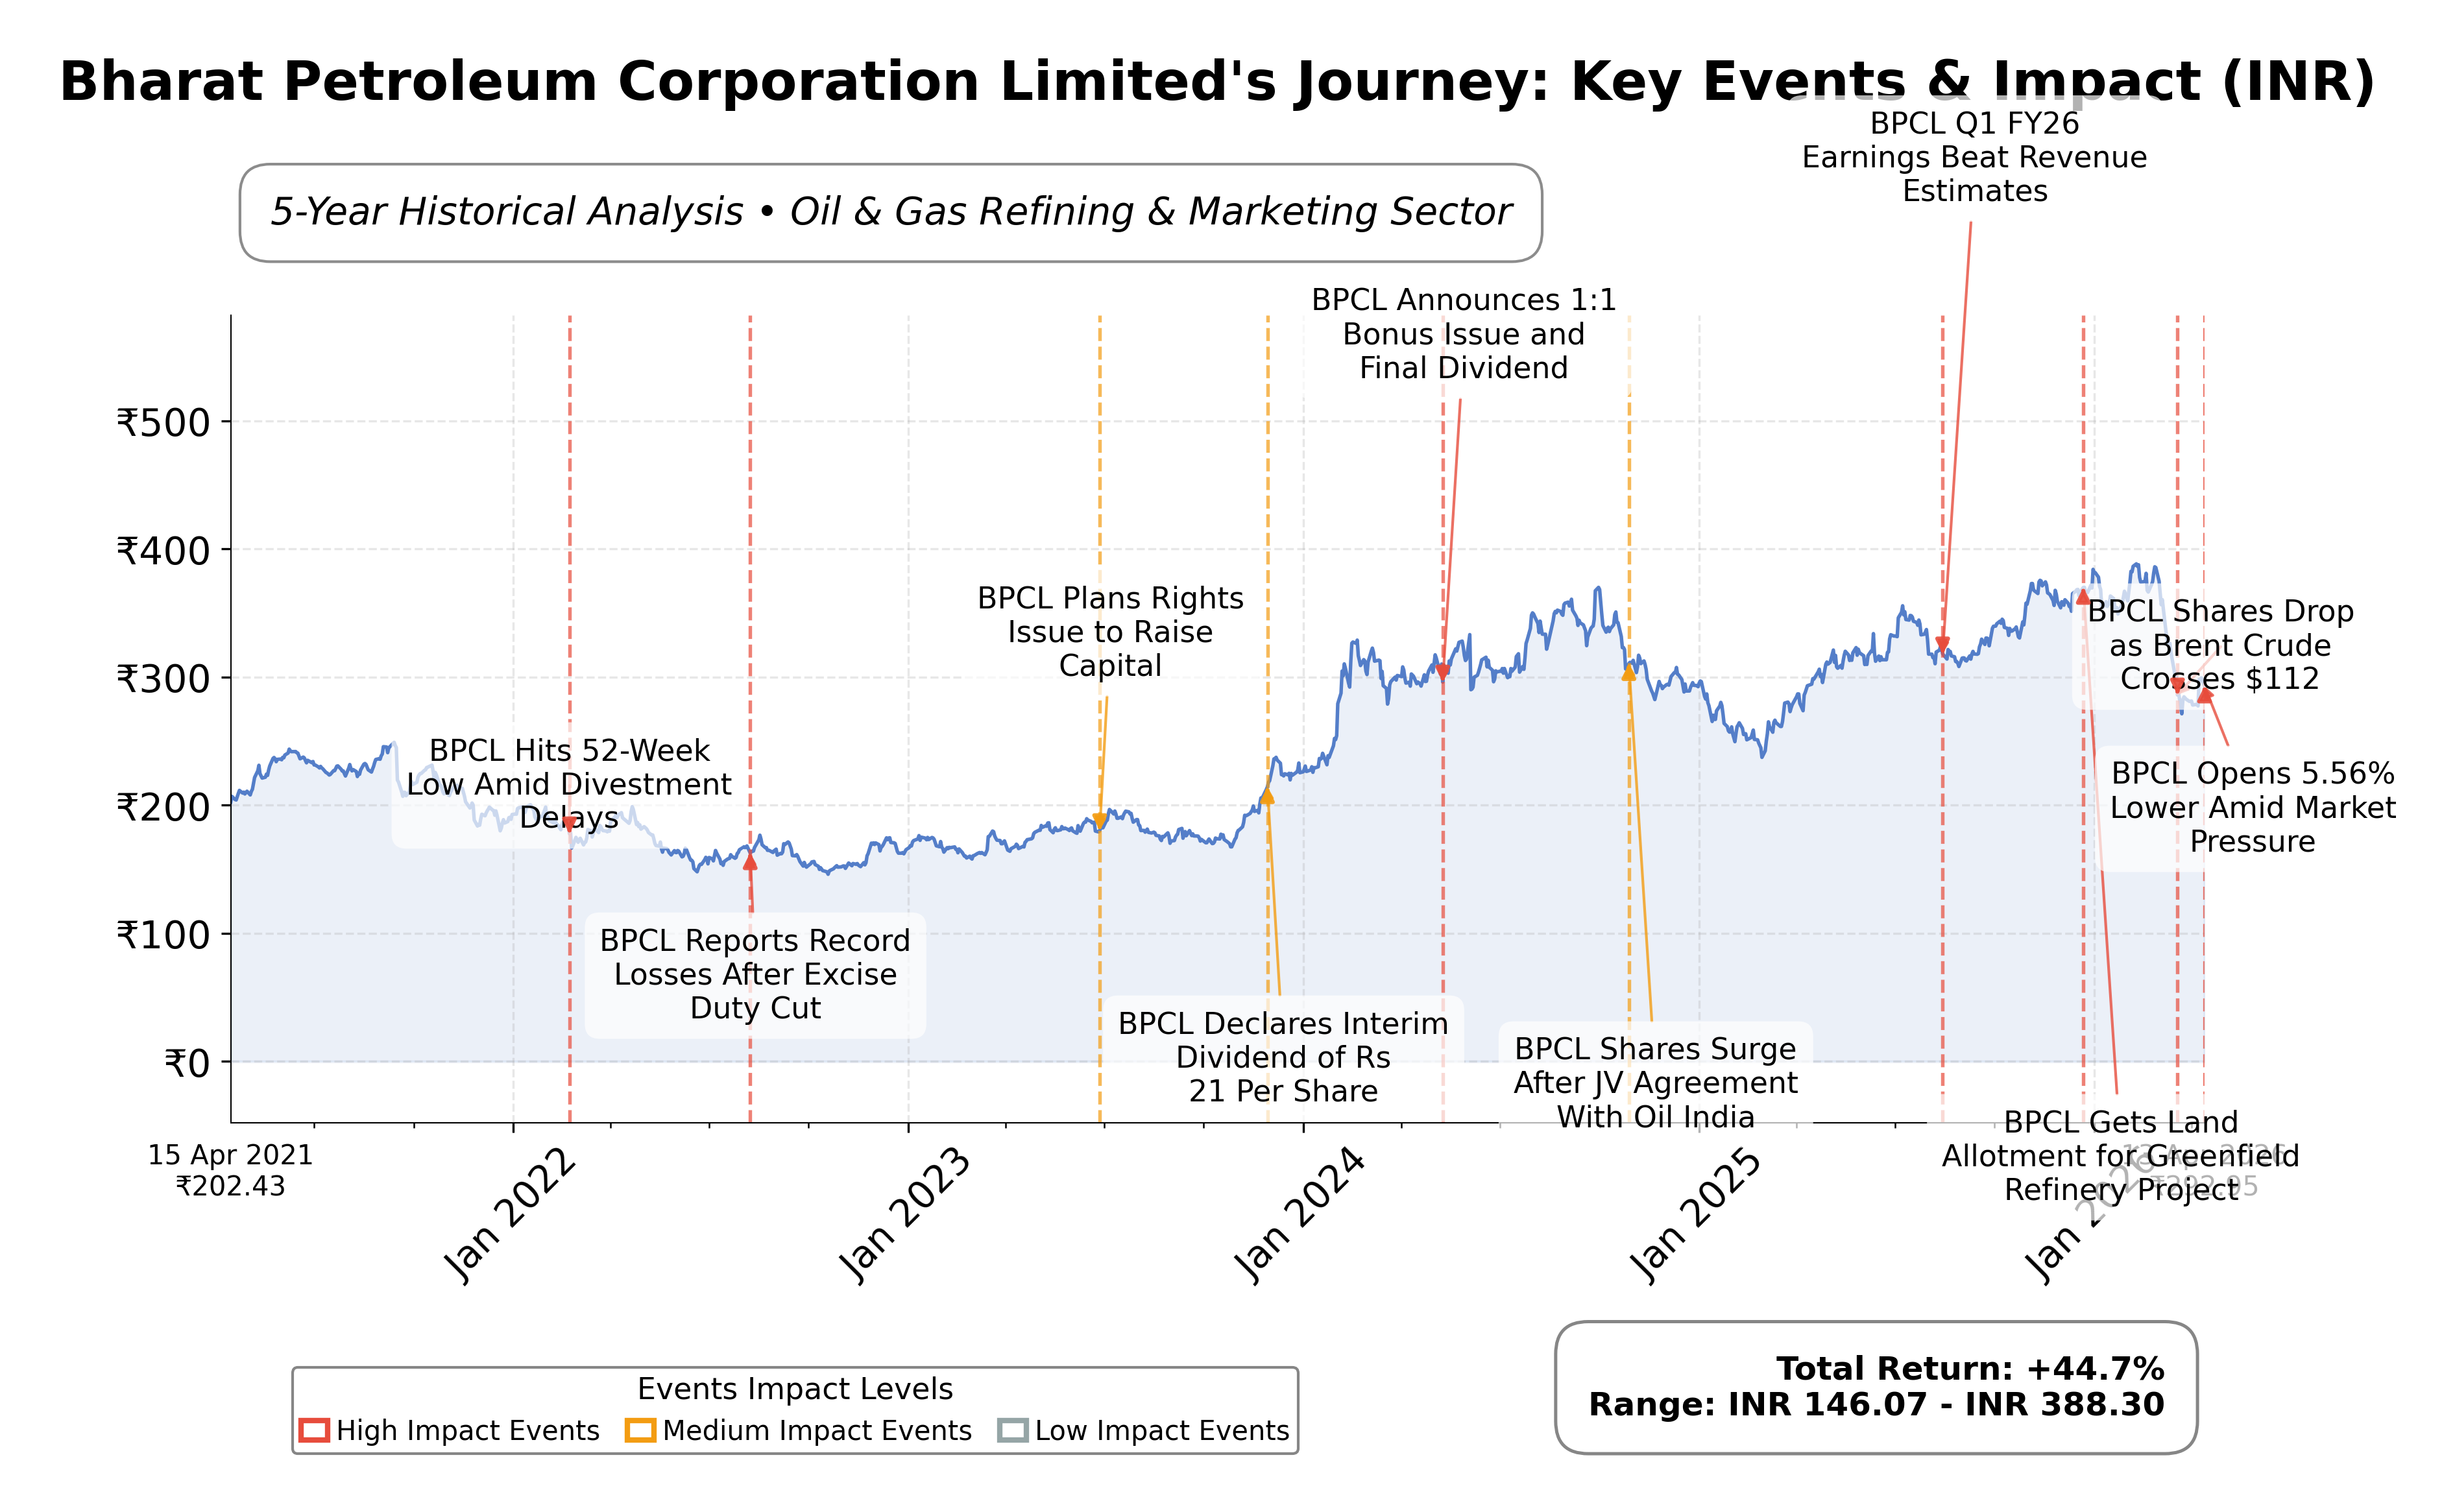
Key Positives and Key Risks
Pros
- Low trailing P/E ratio of 5.21 indicates potential undervaluation relative to earnings.
- Strong return on equity at 16.39% reflects efficient use of shareholder capital.
- Robust operating cash flow of INR 218.65 billion supports financial flexibility.
Cons
- Current ratio of 0.80 suggests potential short-term liquidity constraints.
- Total debt of INR 529.7 billion with a debt-to-equity ratio of 56.39% indicates moderate leverage.
- Geopolitical risks and crude oil price volatility pose threats to profit margins.
Disclosure: This information is for general awareness and does not constitute investment advice
Report Summary
Bharat Petroleum Corporation Limited (BPCL) is a leading Indian public sector oil and gas company operating primarily in the downstream sector of refining and marketing petroleum products. Listed on the NSE under the Energy sector, BPCL manages major refineries in Mumbai, Kochi, and Bina, and supplies a broad portfolio including aviation fuel, petrol, diesel, LPG, and lubricants. The company plays a critical role in India's energy infrastructure, supported by an extensive pipeline network and government oversight through the Ministry of Petroleum and Natural Gas. BPCL’s market positioning is that of a key player in India’s oil and gas refining and marketing industry, serving retail, industrial, and aviation customers nationwide.
Financially, BPCL reported a trailing twelve months (TTM) revenue of approximately INR 4.48 trillion, with a gross margin of 14.82%, operating margin of 8.16%, and a net profit margin of 5.50%. The company’s return on equity (ROE) stands at 16.39%, and return on assets (ROA) is 6.11%, reflecting solid profitability and efficient asset utilization. Operating cash flow for the TTM is INR 218.65 billion, with levered free cash flow at INR 133.37 billion, indicating healthy cash generation. The company’s balance sheet shows total cash of INR 174.3 billion against total debt of INR 529.7 billion, with a current ratio below 1 at 0.80, suggesting moderate liquidity constraints.
Valuation metrics reveal a trailing P/E ratio of 5.21 and a forward P/E of 6.90, both below typical industry averages, indicating the stock is trading at a relatively low earnings multiple. The price-to-book ratio is 1.37, and the enterprise value to EBITDA ratio is 4.27, suggesting the stock is reasonably valued relative to its fundamentals. BPCL’s market capitalization is approximately INR 1.30 trillion, with a 52-week price range between INR 266.60 and INR 391.65. The current price of INR 310.80 situates the stock closer to the mid-range of its annual trading band, reflecting a moderate valuation stance.
BPCL’s notable strengths include its strong market leadership in India’s downstream oil sector, robust cash flow generation, and a diversified product portfolio. Key risks involve regulatory challenges, volatility in crude oil prices, and geopolitical tensions impacting global energy markets. Recent strategic developments include operational adjustments to meet local fuel demand and ongoing scrutiny over refinery proposals, reflecting active management of operational and regulatory environments. The company also maintains a semi-annual dividend policy with a forward yield of approximately 6.67%, supporting shareholder returns.
Technically, BPCL exhibits mixed signals with recent price volatility and a trading range bounded by support near INR 266 and resistance around INR 392. The stock is positioned near its 50-day and 200-day moving averages, with momentum indicators showing moderate strength. Recent news highlights both positive market sentiment from price rallies and negative pressure from geopolitical and crude price fluctuations. Overall, the data suggests a balanced outlook with conditions warranting close observation of market developments and technical trends.
Company and Industry Overview
Company Basics
Price Performance
Company Size
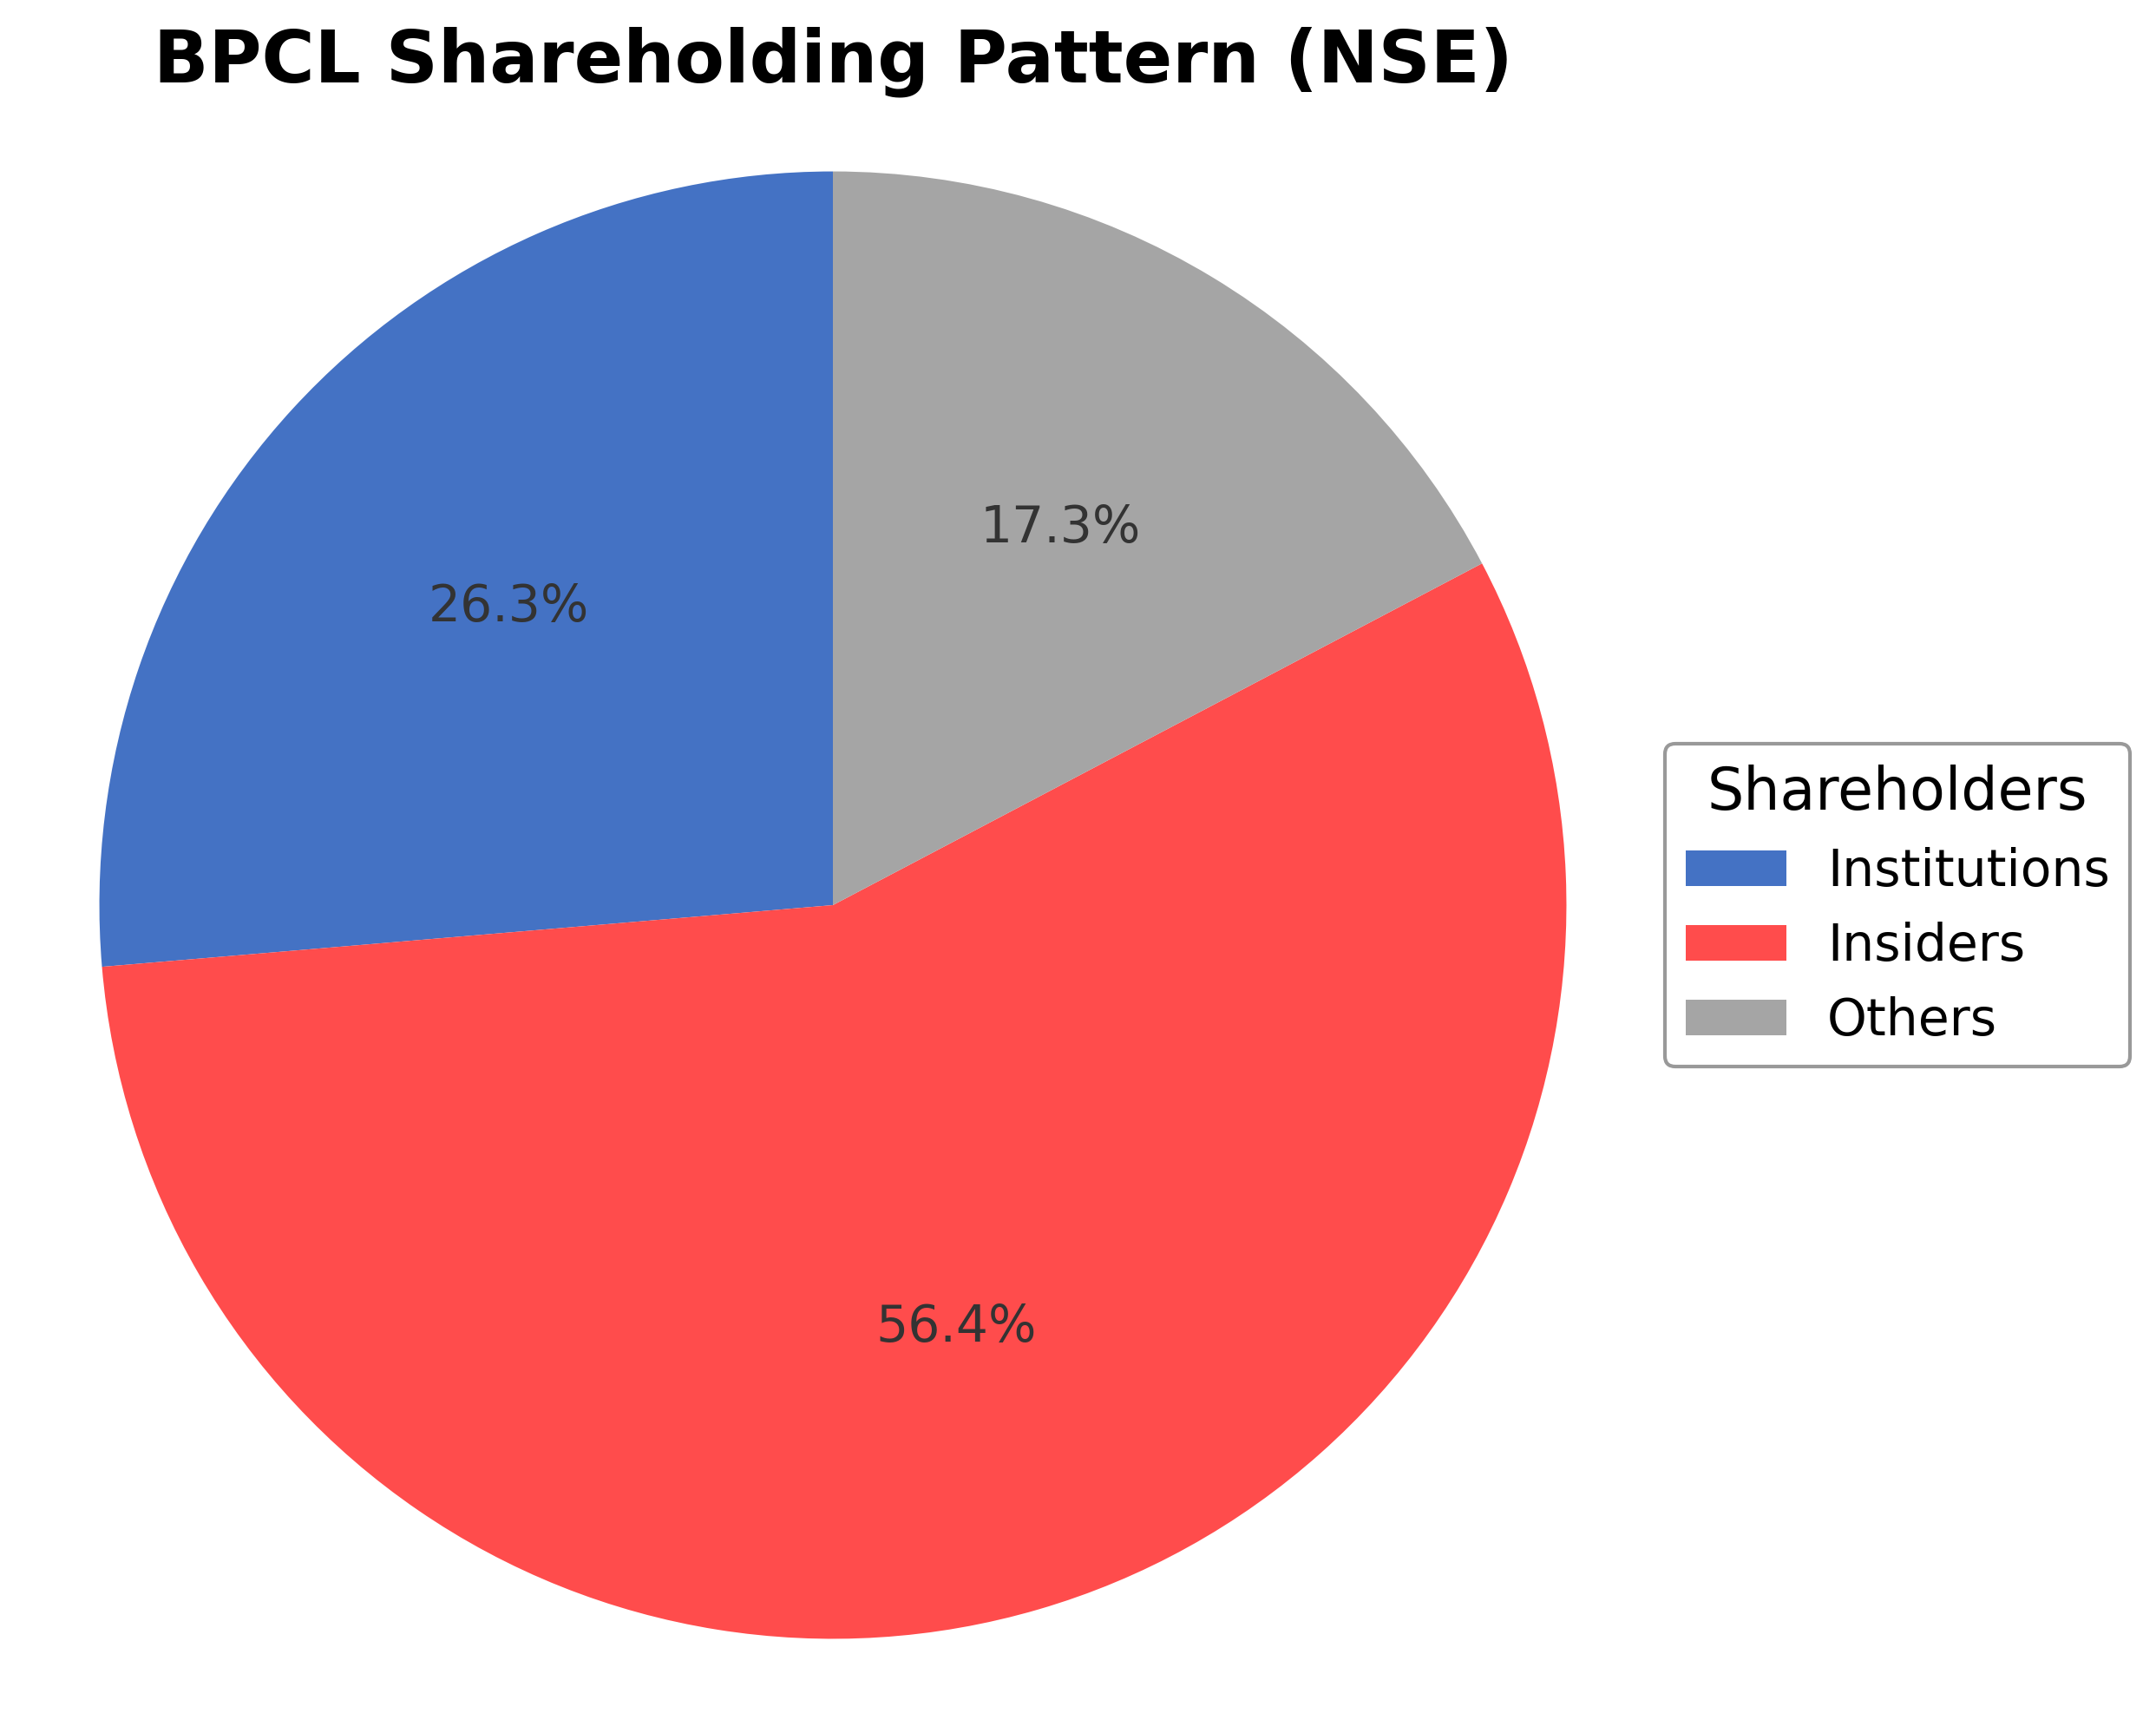
Shareholding Pattern
Sector and Industry Analysis
The oil and gas sector in India is a significant contributor to the economy, encompassing upstream exploration, refining, and marketing activities. The refining segment, where Bharat Petroleum Corporation Limited (BPCL) operates, processes a substantial volume of crude oil to meet domestic fuel demand. The sector has witnessed steady growth driven by rising energy consumption, urbanization, and industrialization, with major players including BPCL, Indian Oil Corporation, and Hindustan Petroleum Corporation. The market size is bolstered by India's status as one of the largest energy consumers globally.
Industry trends highlight a gradual shift towards cleaner fuels and increased refining capacity to meet environmental standards and growing demand. Competitive dynamics are shaped by state-owned enterprises dominating the landscape, with significant capital requirements and technological expertise acting as barriers to entry. BPCL maintains a strong position through integrated operations spanning refining, marketing, and distribution, leveraging economies of scale and strategic infrastructure. The industry is also adapting to global crude price volatility and evolving consumer preferences for alternative energy sources.
The regulatory environment is characterized by government policies aimed at energy security, environmental sustainability, and pricing reforms. Key regulations include mandates on fuel quality upgrades, emission standards, and periodic revisions of fuel prices linked to international crude rates. The government’s focus on reducing carbon intensity and promoting biofuels influences operational and investment decisions within the sector. These regulatory frameworks impact profitability and necessitate continuous compliance and innovation among industry participants.
Note: Analysis synthesized from industry research, market reports, and regulatory filings. Information is subject to change based on market conditions.
Financial Ratios Dashboard
Illustrative Scenario Analysis
DCF Assumptions:
Method: Two-Stage EPS-Priority Model
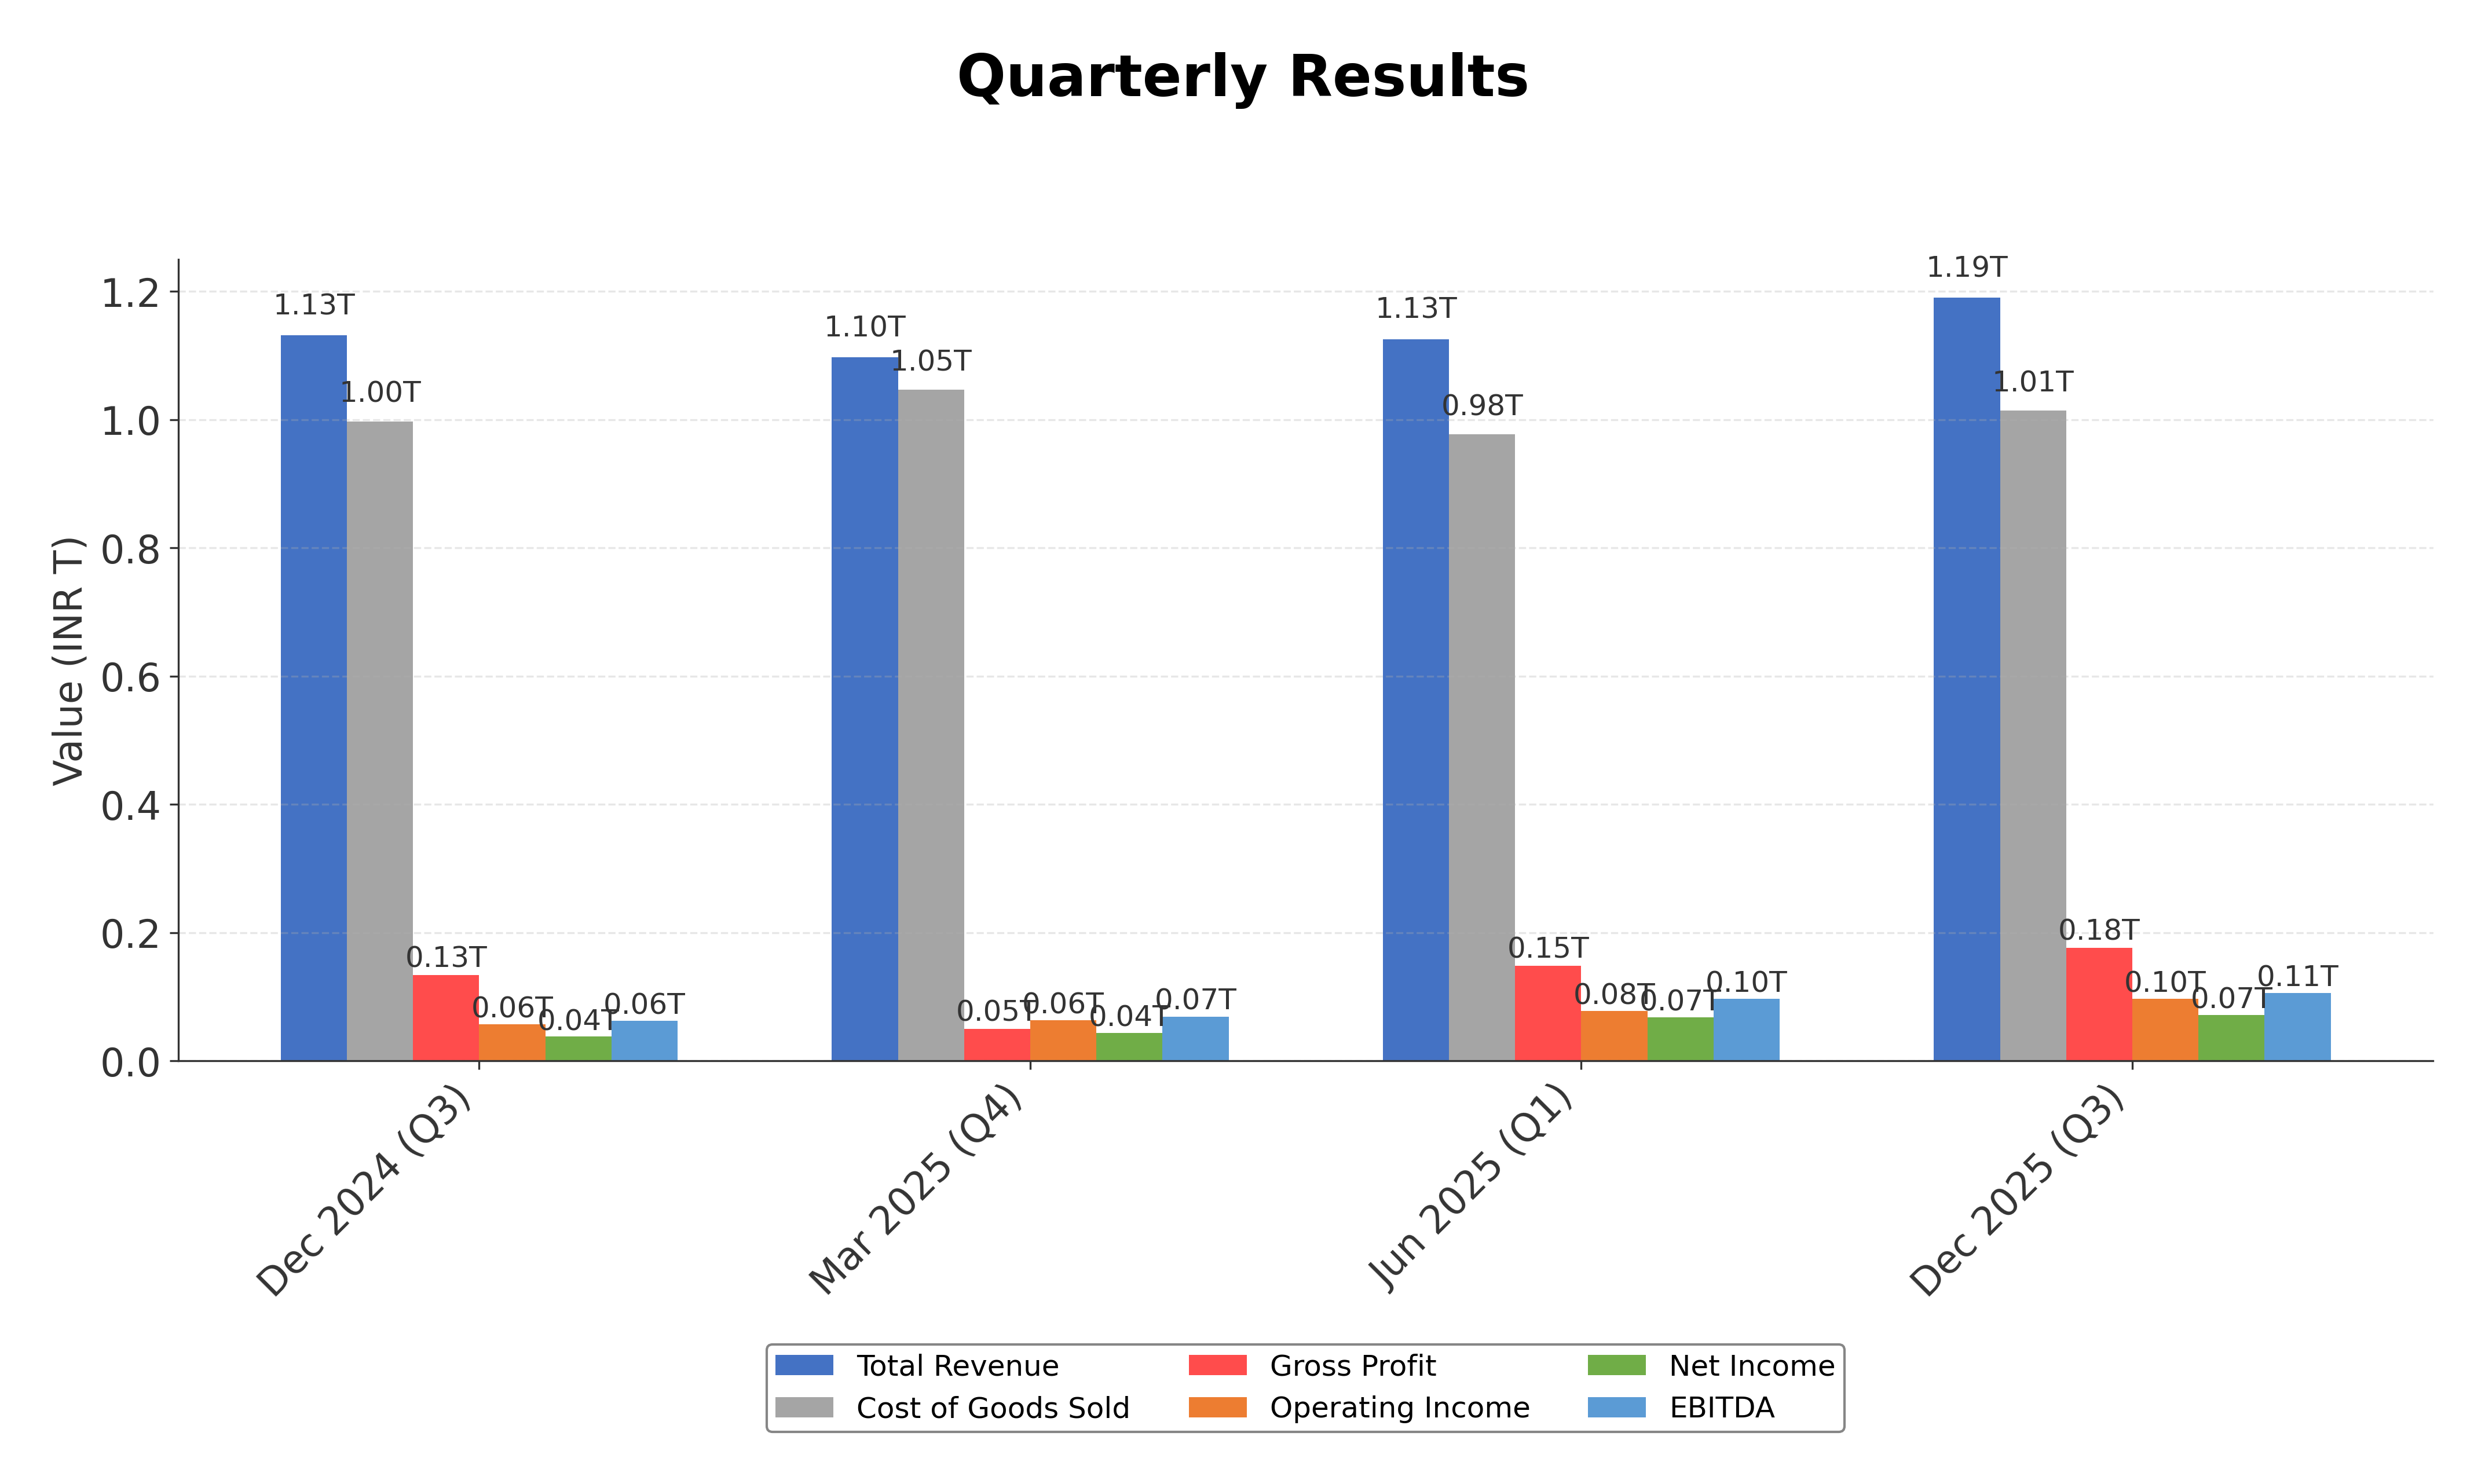
Financials
Peer Analysis
| Company Name | Market Cap | P/E Ratio | P/B Ratio | EV/EBITDA | Price to CFO |
|---|---|---|---|---|---|
| Bharat Petroleum Corporation Limited | ₹1.30T | 5.21 | 1.37 | 4.27 | 5.94 |
| Reliance Industries Ltd. | ₹18.27T | 22.22 | 2.08 | 12.61 | 18.03 |
| Chennai Petroleum Corporation Limited | ₹145.02B | 6.74 | 1.64 | 4.54 | 7.18 |
| Aegis Logistics Limited | ₹212.57B | 48.78 | 4.97 | 21.39 | 17.46 |
| Mangalore Refinery and Petrochemicals Limited | ₹306.38B | 14.06 | 2.30 | 7.11 | 18.88 |
| Hindustan Petroleum Corporation Limited | ₹767.29B | 4.98 | 1.35 | 4.94 | 16.80 |
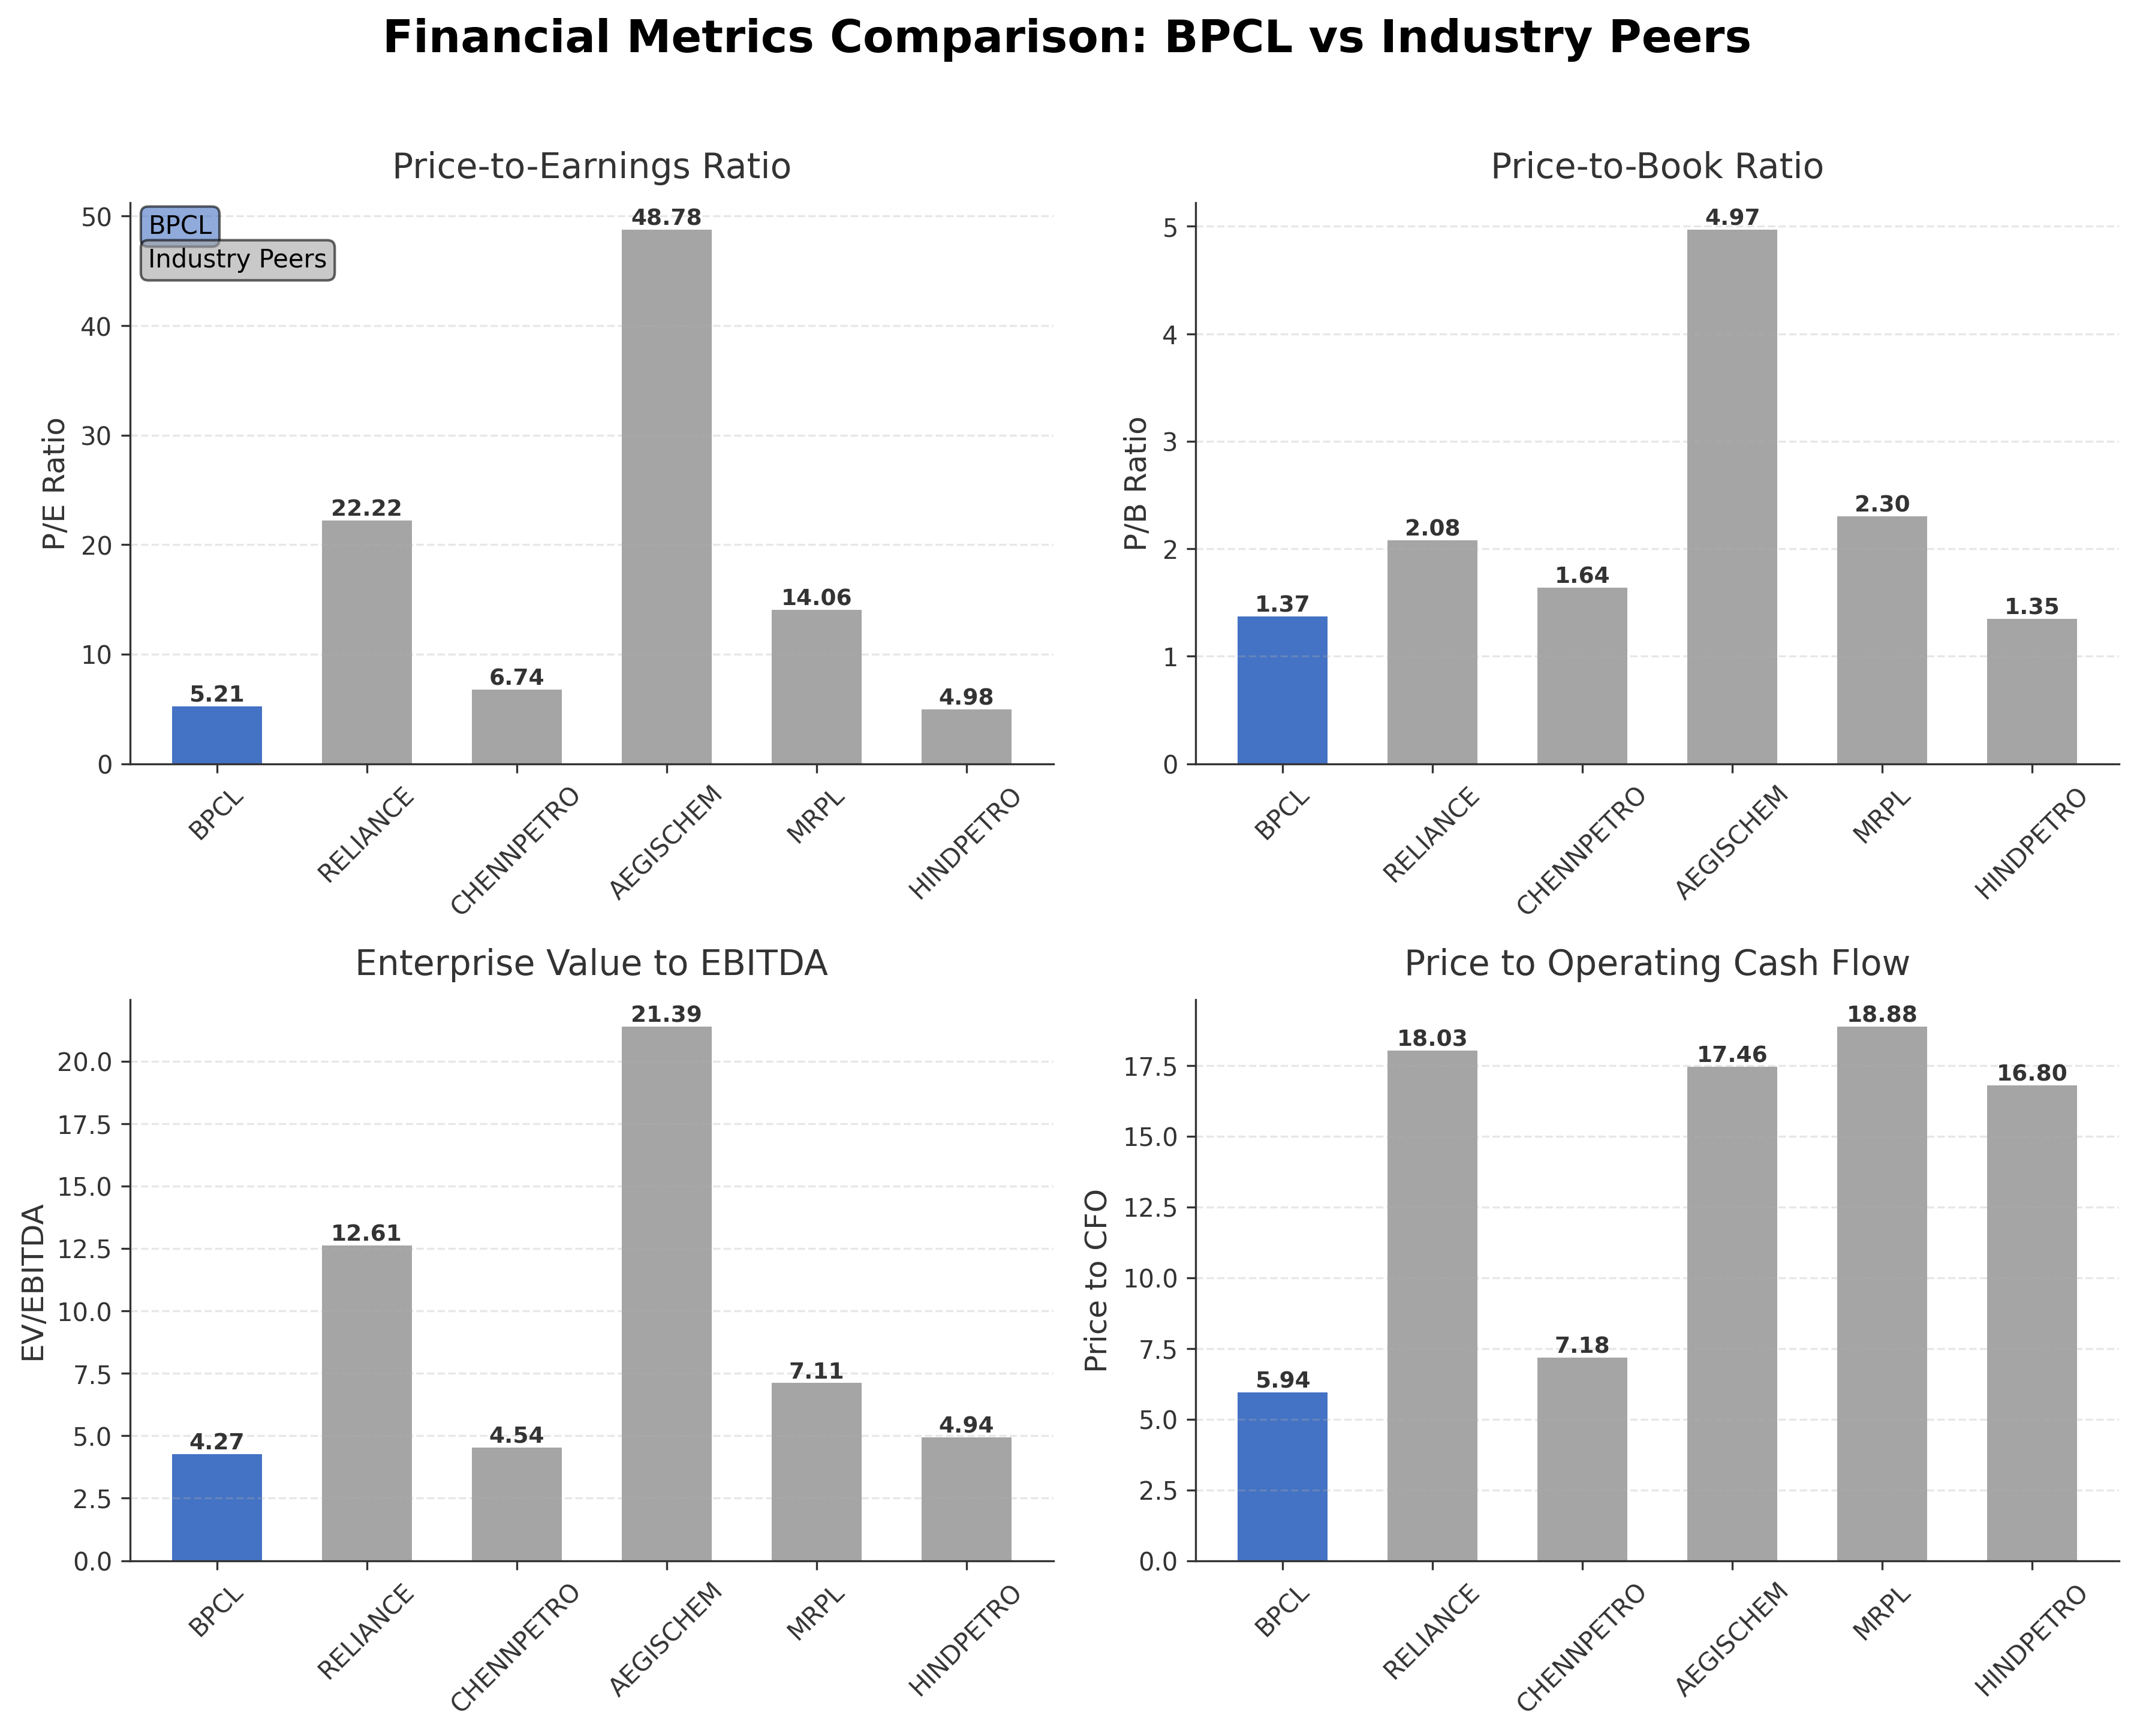
Comparison Analysis: Bharat Petroleum Corporation Limited (BPCL) trades at a significantly lower P/E ratio of 5.21 compared to Reliance Industries Ltd.’s 22.22 and other peers, indicating a more conservative valuation relative to earnings. Its price-to-book ratio of 1.37 is comparable to Hindustan Petroleum Corporation Limited’s 1.35 but lower than Chennai Petroleum and Aegis Logistics, reflecting moderate asset valuation. BPCL’s EV/EBITDA of 4.27 is among the lowest in the peer group, suggesting efficient operational earnings relative to enterprise value. The company’s return on equity at 16.39% is notably higher than most peers, highlighting superior profitability. Overall, BPCL demonstrates strong financial efficiency and value metrics relative to its regional industry competitors.
Financial Metrics Comparison with Peers
Financial Statements
Comprehensive financial data including income, balance sheet, and cash flow metrics
Income Statement
| fiscal_date | 2025-03-31 | 2024-03-31 | 2023-03-31 | 2022-03-31 | 2021-03-31 |
|---|---|---|---|---|---|
| Sales | 4387.38B | 4466.66B | 4662.58B | 3455.96B | 2291.09B |
| Cost Of Goods | 3997.93B | 3891.37B | 4458.83B | 3139.79B | 1957.53B |
| Gross Profit | 389.45B | 575.30B | 203.75B | 316.17B | 333.56B |
| Operating Expense Selling General And Administrative | 11.73B | 10.34B | 9.16B | 7.51B | 6.93B |
| Operating Expense Other Operating Expenses | 164.25B | 160.92B | 153.20B | 134.51B | 116.74B |
| Operating Income | 187.44B | 375.77B | 74.23B | 147.78B | 170.65B |
| Non Operating Interest Income | 15.63B | 13.73B | 7.65B | 10.89B | 10.85B |
| Non Operating Interest Expense | 35.55B | 41.00B | 39.30B | 23.31B | 19.47B |
| Pretax Income | 181.82B | 361.94B | 28.21B | 160.37B | 224.32B |
| Income Tax | 48.46B | 93.36B | 6.90B | 43.55B | 51.12B |
| Net Income | 133.37B | 268.59B | 21.31B | 116.81B | 173.20B |
| Eps Basic | 31.21 | 63.04 | 5.00 | 27.45 | 40.94 |
| Eps Diluted | 31.21 | 63.04 | 5.00 | 27.45 | 40.80 |
| Basic Shares Outstanding | 4.27B | 4.26B | 4.26B | 4.25B | 3.95B |
| Diluted Shares Outstanding | 4.27B | 4.26B | 4.26B | 4.25B | 3.95B |
| Ebit | 217.37B | 402.95B | 67.51B | 183.68B | 243.79B |
| Ebitda | 294.37B | 473.55B | 156.29B | 230.82B | 233.81B |
| Net Income Continuous Operations | 181.82B | 361.94B | 28.21B | 160.37B | 224.32B |
| Minority Interests | 0.00 | 0.00 | 0.00 | 0.00 | -11.55B |
| Preferred Stock Dividends | 0.00 | 0.00 | 0.00 | 0.00 | 0.00 |
Data provided by Twelve Data
Balance Sheet
| fiscal_date | 2025-03-31 | 2024-03-31 | 2023-03-31 | 2022-03-31 | 2021-03-31 |
|---|---|---|---|---|---|
| Cash And Cash Equivalents | 5.58B | 23.01B | 23.13B | 21.59B | 75.68B |
| Accounts Receivable | 93.39B | 83.42B | 67.24B | 97.07B | 78.35B |
| Total Assets | 2183.82B | 2024.18B | 1881.38B | 1875.29B | 1609.82B |
| Total Liabilities | 1369.98B | 1267.83B | 1346.16B | 1356.23B | 1074.26B |
| Long Term Debt | 353.68B | 354.77B | 496.35B | 444.00B | 433.52B |
| Shareholders Equity | 813.84B | 756.35B | 535.22B | 519.06B | 535.55B |
Data provided by Twelve Data
Cash Flow Statement
| fiscal_date | 2025-03-31 | 2024-03-31 | 2023-03-31 | 2022-03-31 | 2021-03-31 |
|---|---|---|---|---|---|
| Operating Activities Net Income | 181.82B | 361.94B | 28.21B | 160.37B | 224.32B |
| Operating Activities Other Non Cash Items | 27.76B | 39.91B | 61.85B | 27.56B | 31.02B |
| Operating Activities Accounts Receivable | -11.12B | -17.14B | 20.71B | -20.49B | 33.68B |
| Operating Activities Other Assets Liabilities | 20.18B | 4.78B | -22.47B | 33.72B | 3.39B |
| Operating Activities Operating Cash Flow | 218.65B | 389.49B | 88.30B | 201.15B | 292.42B |
| Investing Activities Capital Expenditures | -133.03B | -95.45B | -85.06B | -84.87B | -90.52B |
| Investing Activities Net Intangibles | -18.01B | N/A | N/A | N/A | N/A |
| Investing Activities Net Acquisitions | -4.35B | 3.41B | -17.19B | -9.21B | 81.74B |
| Investing Activities Purchase Of Investments | -90.31B | -36.85B | -19.16B | -213.07B | -91.02B |
| Investing Activities Sale Of Investments | 38.02B | 567.20M | 70.20M | 207.22B | 68.99B |
| Investing Activities Other Investing Activity | 2.20B | 2.15B | 5.54B | N/A | -19.32B |
| Investing Activities Investing Cash Flow | -187.47B | -126.17B | -115.80B | -99.93B | -50.12B |
| Financing Activities Long Term Debt Issuance | 102.29B | 54.82B | 147.84B | 72.44B | 49.96B |
| Financing Activities Long Term Debt Payments | -116.84B | -210.51B | -130.64B | -87.82B | -36.61B |
| Financing Activities Short Term Debt Issuance | 61.82B | 783.60M | -2.91B | 5.54B | -133.25B |
| Financing Activities Common Stock Issuance | 0.00 | 3.98B | 0.00 | 4.62B | 0.00 |
| Financing Activities Common Dividends | -65.61B | -53.29B | -12.82B | -144.83B | -49.24B |
| Financing Activities Financing Cash Flow | -18.33B | -204.41B | 1.48B | -150.04B | -113.95B |
| End Cash Position | 5.58B | 23.01B | 23.13B | 20.56B | 75.29B |
| Free Cash Flow | 85.35B | 263.57B | 39.17B | 117.90B | 143.48B |
| Financing Activities Other Financing Charges | N/A | -195.00M | N/A | N/A | 55.20B |
Data provided by Twelve Data
Technical Analysis
Key Insights
- The current trend shows mixed price action with recent volatility and a gap-up opening, indicating short-term bullish momentum amid broader market fluctuations.
- Key support levels are identified near ₹266.60, the 52-week low, while resistance is observed around ₹391.65, the 52-week high.
- The stock price is trading close to its 50-day moving average at ₹336.27 and 200-day moving average at ₹342.92, suggesting consolidation near long-term trend lines.
- Momentum indicators show moderate strength with RSI near neutral levels, MACD signaling a potential bullish crossover, and stochastic oscillators reflecting short-term overbought conditions.
- Multi-timeframe analysis reveals daily charts exhibiting volatility, weekly charts indicating sideways movement, and monthly charts maintaining an overall upward bias.
- Current technical setup suggests potential scenarios of range-bound trading with breakouts contingent on crude oil price movements and geopolitical developments.
Trending News
1. Headline: Bharat Petroleum Corporation Ltd Opens 5.64% Higher Amid Mixed Technical Signals
Summary: Bharat Petroleum Corporation Ltd (BPCL) commenced trading on 15 Apr 2026 with a significant gap up, opening at a price 5.64% higher than the previous close. This robust start underscores a positive market sentiment amid a day marked by high volatility and notable outperformance relative to ...
Sentiment: positive
2. Headline: Crude-Sensitive Stocks Surge as Oil Prices Fall
Summary: Shares of state-run refiners such as Bharat Petroleum Corporation Limited and Hindustan Petroleum Corporation Limited rallied over 4 per cent each, while Indian Oil Corporation also posted solid gains.
Sentiment: positive
3. Headline: Petrol, diesel prices hike in India possible due to…, petrol rate likely to reach…
Summary: Although retail fuel prices were deregulated over a decade ago and left to market forces, state-run companies like Indian Oil Corporation, Bharat Petroleum Corporation Limited, and Hindustan Petroleum Corporation Limited have not revised petrol and diesel prices since April 2022.
Sentiment: negative
4. Headline: Bharat Petroleum Corp Ltd stock (INE029A01011): Why does its refining capacity edge matter more now
Summary: As India's fuel demand surges, Bharat Petroleum's massive refining operations position it as a key player in stable energy supply chains. For you in the United States and English-speaking markets worldwide, this stock offers exposure to Asia's growth without direct geopolitical risks.
Sentiment: positive
Summary: The US-Iran war, which began in the last quarter of the March fiscal, has clouded the earnings outlook for the companies in the oil and gas sector, with downstream players like Indian Oil Corporation (IOC), Hindustan Petroleum Corporation Limited (HPCL) and Bharat Petroleum Corporation Limited ...
Sentiment: negative
Powered by Brave
Recent Updates
News Summary
Recent news on Bharat Petroleum Corporation Limited highlights a shift in technical momentum with a bearish downgrade, reflecting increased market caution. Indian refiners, including BPCL, have postponed maintenance shutdowns to meet rising local fuel demand, indicating operational responsiveness amid supply pressures. Safety and transparency concerns have been raised regarding a refinery proposal in Nellore, signaling regulatory scrutiny. Additionally, Gujarat Gas Limited's efforts to stabilize fuel supply amid global energy volatility indirectly impact BPCL's operating environment. Market sentiment fluctuated as oil marketing company shares, including BPCL, surged on easing crude prices driven by renewed US-Iran peace talks, though geopolitical tensions continue to influence sector volatility.
News Sentiment
The overall sentiment is mixed with a slight tilt towards neutral to negative due to geopolitical and regulatory concerns. Positive technical signals and operational adjustments provide some optimism, while ongoing safety issues and geopolitical risks temper enthusiasm. Sentiment across sources varies, reflecting the complex interplay of market, operational, and external factors affecting BPCL.
Analytical Overview
Analysis Summary
Bharat Petroleum Corporation Limited’s valuation metrics, including a trailing P/E of 5.21 and forward P/E of 6.90, are significantly lower than industry averages, indicating a potentially undervalued stock relative to earnings. The company exhibits a stable growth trajectory with a quarterly revenue growth rate of 5.2% and a strong year-over-year earnings growth of 88.9%, supported by consistent operating cash flow generation of INR 218.65 billion. Financial health appears robust with a total debt to equity ratio of 56.39%, manageable given the company’s cash reserves of INR 174.3 billion, although the current ratio below 1 suggests some liquidity pressure. Sector-specific challenges include crude price volatility and geopolitical risks, while opportunities arise from increasing domestic fuel demand and refining capacity expansion. Considering India-specific factors, regulatory oversight and evolving energy policies play a crucial role in shaping BPCL’s operational environment and market positioning.
Overall Business and Market Assessment
Supporting Factors: BPCL’s strong profitability metrics such as a 16.39% ROE and efficient cash flow generation, alongside a reasonable valuation reflected in a low P/E ratio
Risk Factors: the geopolitical tensions impacting crude prices and regulatory scrutiny over refinery projects, which could affect margins and operational continuity
SWOT Analysis
Strengths
- Strong market leadership in India’s downstream oil refining and marketing sector.
- Robust profitability with a return on equity of 16.39%.
- Healthy cash flow generation supporting operational and strategic initiatives.
- Diverse product portfolio including aviation fuel, LPG, and lubricants.
Weaknesses
- Current ratio below 1 indicating potential short-term liquidity constraints.
- Moderate debt levels with a total debt to equity ratio of 56.39%.
- Exposure to volatile crude oil prices impacting margins.
- Limited international presence compared to global peers.
Opportunities
- Rising domestic fuel demand driving volume growth.
- Potential for refining capacity expansion and modernization.
- Government support for energy infrastructure development.
- Increasing focus on cleaner fuels and alternative energy sources.
Threats
- Geopolitical tensions affecting crude oil supply and prices.
- Regulatory scrutiny and environmental compliance challenges.
- Competitive pressures from private and international oil companies.
- Fluctuations in global energy markets impacting profitability.
Company Description
Bharat Petroleum Corporation Limited is an Indian public sector oil and gas company headquartered in Mumbai. It serves as one of India's leading downstream oil producers, focusing on the refining of crude oil and the marketing of petroleum products across the nation. The company operates key refineries in Mumbai, Kochi, and Bina, supported by an extensive pipeline network that facilitates efficient distribution throughout the energy value chain. Bharat Petroleum Corporation Limited provides a wide array of products including aviation fuel, petrol, diesel, LPG gas cylinders, and MAK lubricants, catering to retail consumers, industrial clients, and aviation sectors. Its business units emphasize purity and reliability in fuel supply, leveraging advanced refining capabilities to meet diverse energy demands. As a major player under the oversight of the Ministry of Petroleum and Natural Gas, it plays a critical role in ensuring stable petroleum product availability in India's energy market. Founded in 1977, Bharat Petroleum Corporation Limited continues to uphold its position as a cornerstone of the country's oil and gas infrastructure.