
Block, Inc (SQ)
Stock Analysis Report
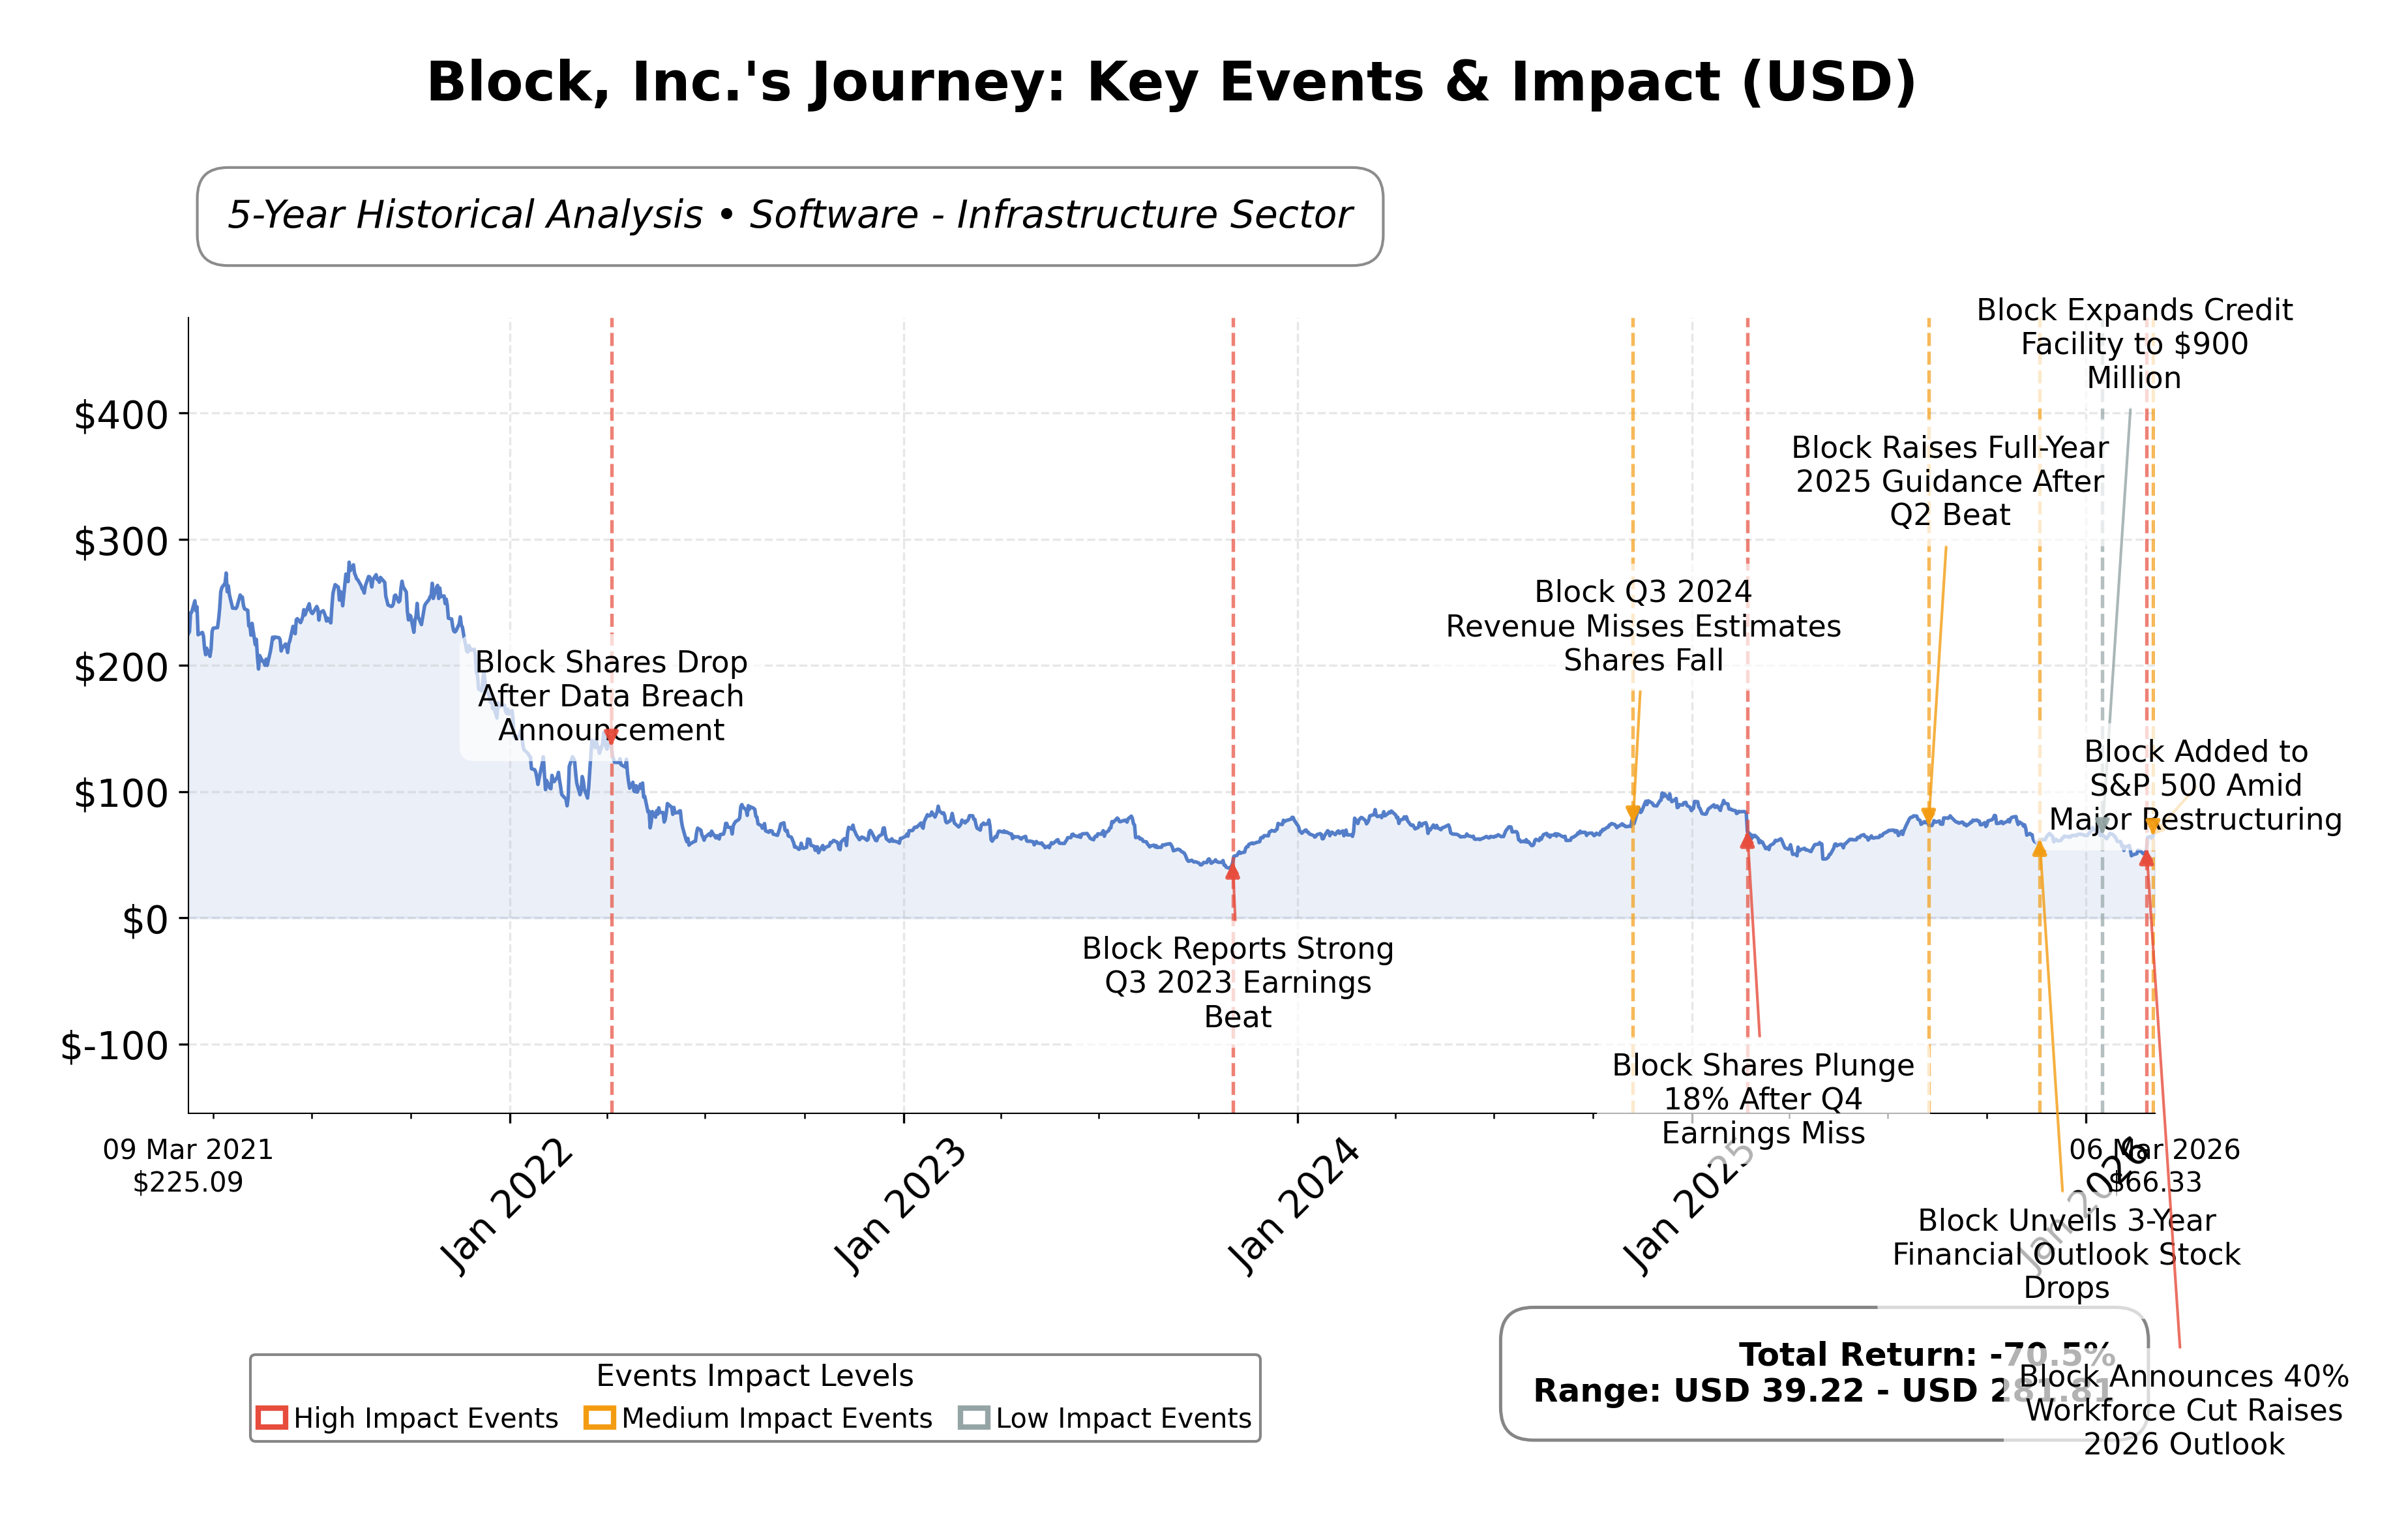
Stock Journey
Key Positives and Key Risks
Pros
- Strong liquidity with $11.27 billion in cash and equivalents supports financial stability and operational flexibility.
- Forward P/E ratio of 19.15 indicates market expectations for earnings growth relative to current valuation.
- Robust free cash flow of approximately $6.05 billion enhances capacity for investments and strategic initiatives.
Cons
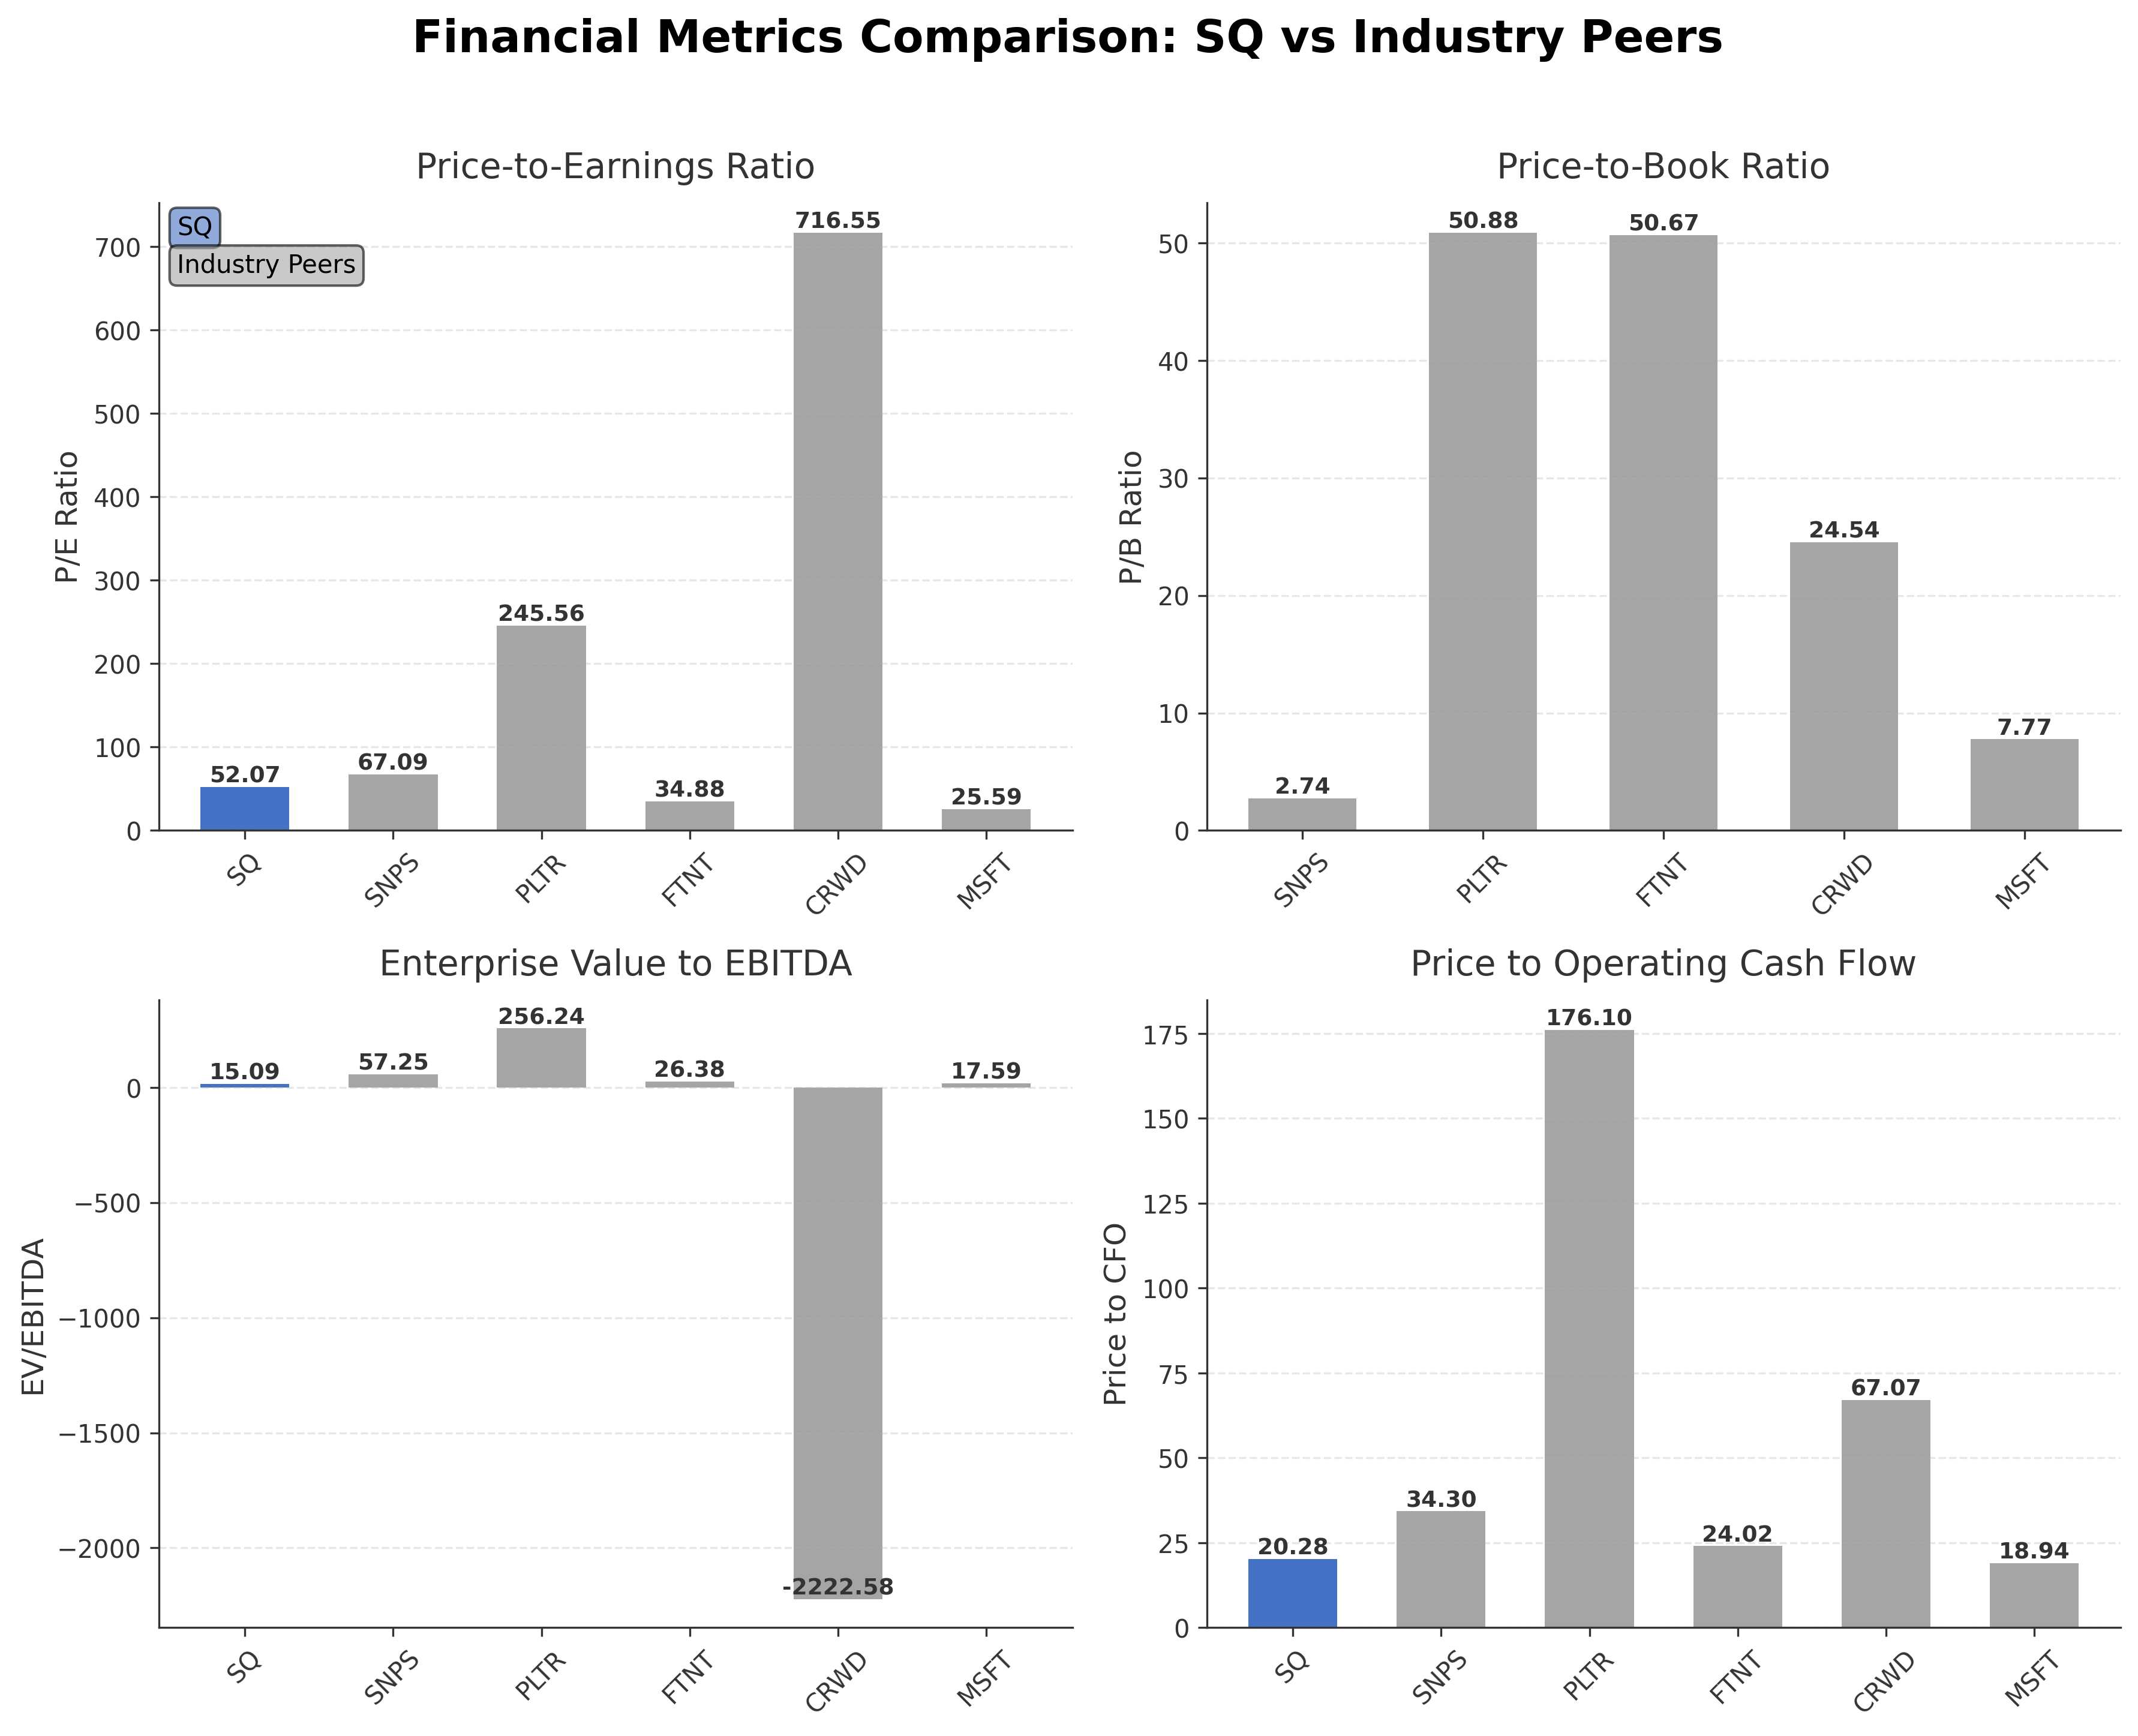
- High trailing P/E ratio of 52.07 may imply elevated valuation risk compared to some industry peers.
- Recent layoffs affecting 40% of workforce introduce operational and reputational risks.
- Modest quarterly revenue growth of under 1% suggests potential challenges in accelerating top-line expansion.
Disclosure: This information is for general awareness and does not constitute investment advice
Report Summary
Block, Inc., formerly known as Square, Inc., operates in the financial technology sector, specializing in mobile payment solutions and digital financial services. The company offers a comprehensive ecosystem including point-of-sale systems for merchants and the Cash App peer-to-peer payment platform. Block has expanded its footprint through acquisitions like Afterpay and ventures into cryptocurrency and blockchain, positioning itself as an innovator in the evolving fintech landscape primarily within the United States market.
Financially, Block reported a market capitalization of approximately $41.1 billion with a trailing P/E ratio of 52.07 and a forward P/E of 19.15, reflecting expectations of earnings growth. The company generated $24.1 billion in trailing twelve-month revenue with a profit margin of 36.85% and operating margin near 7%. It maintains a strong liquidity position with $11.27 billion in cash and a current ratio above 2.3, alongside manageable debt levels with a debt-to-equity ratio of 0.37. Valuation metrics such as EV/EBITDA stand at 15.09, indicating moderate valuation relative to earnings before interest, taxes, depreciation, and amortization.
Recent strategic initiatives include significant workforce reductions attributed to AI-driven efficiencies, with leadership emphasizing organizational restructuring to enhance productivity. The companyâs stock trades at $66.33 within a 52-week range of $44.27 to $82.50, showing upside potential relative to the current price. Technical indicators and volume trends suggest active market interest. Notable strengths include robust cash flow generation and innovation in digital payments, while risks involve market reactions to layoffs, AI integration challenges, and competitive pressures in fintech.
In peer comparison within the U.S. software infrastructure and fintech industry, Blockâs valuation metrics such as P/E and EV/EBITDA are moderate compared to larger peers like Microsoft and Oracle, which have lower P/E ratios but higher market caps. Blockâs return on equity (13.64%) is competitive relative to peers, though some companies like Fortinet exhibit higher profitability metrics. The companyâs valuation is more attractive than high-growth peers with elevated multiples such as Palantir and CrowdStrike, which show significantly higher P/E ratios and volatility in earnings multiples.
Block, Inc. stands at a pivotal juncture navigating rapid technological change and market dynamics in fintech. Recent achievements include revenue growth and strategic acquisitions, while ongoing challenges involve workforce restructuring and market sentiment around AI adoption. The companyâs future trajectory will depend on successful integration of AI efficiencies and sustaining competitive innovation. Given the current financial and market data, a balanced approach that monitors operational execution and market response may be appropriate for those assessing the stockâs potential.
Company and Industry Overview
Company Basics
Price Performance
Company Size
Shareholding Pattern
Block, Inc.'s ownership structure details are not explicitly provided in the data; however, typical fintech companies in the U.S. feature a mix of insiders including executives and board members, institutional investors such as mutual funds and asset managers, and public shareholders comprising retail investors and employee stock plans. Over recent years, institutional accumulation trends often reflect confidence in fintech innovation and growth potential, though specific changes in major stakeholder positions for Block are not detailed. The ownership distribution likely influences governance and strategic decisions, particularly in light of recent workforce reductions and AI-driven initiatives, highlighting a focus on operational efficiency and technological advancement within a competitive software infrastructure industry.
Sector and Industry Analysis
Block, Inc. (SQ) operates primarily within the Financial Technology (FinTech) sector, a rapidly expanding segment of the broader financial services industry. The global FinTech market has experienced robust growth, driven by increasing digital adoption, the proliferation of mobile payment solutions, and demand for seamless financial services. Valued in the hundreds of billions globally, the sector is projected to maintain a double-digit compound annual growth rate (CAGR) over the next five years. Key players alongside Block include PayPal, Square’s traditional competitor, Stripe, Adyen, and traditional financial institutions increasingly investing in digital capabilities. Block’s market capitalization near $40 billion and substantial institutional ownership reflect its significant role in this dynamic market.
Industry trends within FinTech are characterized by rapid technological innovation and evolving consumer preferences. The shift toward cashless transactions, accelerated by the COVID-19 pandemic, has entrenched digital wallets, peer-to-peer payments, and contactless payments as mainstream. Block’s ecosystem, which integrates payment processing, point-of-sale hardware, and financial services for small and medium-sized businesses, exemplifies the trend toward platform-based solutions. Additionally, blockchain technology, cryptocurrency integration, and embedded finance are emerging opportunities reshaping the industry landscape. Consumer demand for convenience, security, and real-time financial management continues to drive innovation in mobile banking, buy-now-pay-later (BNPL) services, and decentralized finance (DeFi) offerings.
The regulatory environment for FinTech firms like Block is complex and evolving, reflecting the sector’s intersection with traditional banking and emerging technologies. Key regulatory frameworks include anti-money laundering (AML) laws, know-your-customer (KYC) requirements, data privacy regulations such as GDPR and CCPA, and evolving rules around cryptocurrency transactions. Compliance with financial regulations enforced by bodies like the U.S. Securities and Exchange Commission (SEC), the Consumer Financial Protection Bureau (CFPB), and international equivalents is critical. Regulatory uncertainty, particularly around digital currencies and cross-border payments, poses ongoing challenges but also opportunities for firms that can navigate compliance effectively and innovate within regulatory guardrails.
Competitive dynamics in the FinTech sector are shaped by a mix of established incumbents, agile startups, and technology giants entering financial services. The market structure tends toward oligopolistic competition with a few dominant platforms leveraging network effects, scale economies, and integrated service offerings. Barriers to entry include regulatory compliance costs, technology infrastructure investment, and the necessity of building trust and brand recognition among consumers and merchants. Block’s competitive positioning benefits from its diversified product suite, strong brand, and ecosystem approach that locks in users through integrated hardware and software solutions. However, competition remains intense with constant innovation required to maintain market share against both specialized FinTech startups and large technology firms expanding into payments and financial services.
Note: Analysis synthesized from industry research, market reports, and regulatory filings. Information is subject to change based on market conditions.
Illustrative Scenario Analysis
DCF Assumptions:
Method: Two-Stage EPS-Priority Model
Financials
Peer Analysis
| Company Name | Market Cap | P/E Ratio | P/B Ratio | EV/EBITDA | Price to CFO |
|---|---|---|---|---|---|
| Block, Inc. | $41.10B | 52.07 | N/A | 15.09 | 20.28 |
| Synopsys, Inc. | $83.79B | 67.09 | 2.74 | 57.25 | 34.30 |
| Palantir Technologies Inc. | $375.88B | 245.56 | 50.88 | 256.24 | 176.10 |
| Fortinet Inc. | $62.22B | 34.88 | 50.67 | 26.38 | 24.02 |
| CrowdStrike Holdings Inc. | $108.15B | 716.55 | 24.54 | -2222.58 | 67.07 |
| Microsoft Corp. | $3.04T | 25.59 | 7.77 | 17.59 | 18.94 |
| Oracle Corporation | $439.62B | 28.75 | 14.67 | 21.21 | 19.72 |
| Palo Alto Networks Inc. | $134.68B | 90.14 | 12.21 | 86.45 | 33.89 |
Comparison Analysis: Block, Inc. presents a moderate valuation profile relative to its U.S. software infrastructure peers, with a trailing P/E of 52.07 and EV/EBITDA of 15.09, which are lower than high-growth peers like Palantir and CrowdStrike but higher than established giants such as Microsoft and Oracle. The company’s return on equity at approximately 13.64% is competitive within the peer group, indicating efficient capital use compared to some peers with lower profitability metrics. Block’s price-to-cash-flow ratio is moderate, reflecting balanced cash generation relative to market valuation. Overall, Block’s financial metrics position it as a mid-sized player with growth potential amid a competitive and diverse peer landscape.
Financial Metrics Comparison with Peers
Financial Statements
Comprehensive financial data including income, balance sheet, and cash flow metrics
Income Statement
| fiscal_date | 2024-12-31 | 2023-12-31 | 2022-12-31 | 2021-12-31 | 2020-12-31 |
|---|---|---|---|---|---|
| Sales | 24.12B | 21.92B | 17.53B | 17.66B | 9.50B |
| Cost Of Goods | 15.23B | 14.41B | 11.54B | 13.24B | 6.76B |
| Gross Profit | 8.89B | 7.50B | 5.99B | 4.42B | 2.73B |
| Operating Expense Research And Development | 2.91B | 2.72B | 2.14B | 1.38B | 885.68M |
| Operating Expense Selling General And Administrative | 4.13B | 4.23B | 3.74B | 2.60B | 1.69B |
| Operating Income | 1.69B | 381.82M | -27.28M | 420.23M | 158.85M |
| Other Income Expense | -320.09M | -458.19M | -501.81M | -229.64M | 114.06M |
| Pretax Income | 1.36B | -29.14M | -565.32M | 157.46M | 215.97M |
| Income Tax | -1.51B | -8.02M | -12.31M | -1.36M | 2.86M |
| Net Income | 2.87B | -21.12M | -553.00M | 158.83M | 213.10M |
| Ebit | 1.69B | 381.82M | -27.28M | 420.23M | 272.91M |
| Ebitda | 2.44B | 1.45B | 910.50M | 814.10M | 534.79M |
| Net Income Continuous Operations | 2.87B | -21.12M | -553.00M | 158.83M | 213.10M |
| Minority Interests | 30.55M | 30.90M | 12.26M | 7.46M | 0.00 |
| Eps Basic | N/A | 0.02 | -0.93 | 0.36 | 0.48 |
| Eps Diluted | N/A | 0.02 | -0.93 | 0.33 | 0.44 |
| Basic Shares Outstanding | N/A | 608.86M | 578.95M | 458.43M | 443.13M |
| Diluted Shares Outstanding | N/A | 608.86M | 578.95M | 458.43M | 443.13M |
| Operating Expense Other Operating Expenses | N/A | N/A | 550.68M | 187.99M | 177.67M |
| Non Operating Interest Expense | N/A | N/A | 36.23M | 33.12M | 56.94M |
Data provided by Twelve Data
Balance Sheet
| fiscal_date | 2024-12-31 | 2023-12-31 | 2022-12-31 | 2021-12-31 | 2020-12-31 |
|---|---|---|---|---|---|
| Cash And Cash Equivalents | 12.26B | 8.17B | 7.72B | 7.27B | 5.20B |
| Accounts Receivable | 3.71B | 5.81B | 4.43B | 1.26B | 1.07B |
| Total Assets | 36.78B | 34.07B | 31.36B | 13.93B | 9.87B |
| Total Liabilities | 15.54B | 15.38B | 14.11B | 10.61B | 7.19B |
| Long Term Debt | 6.68B | 5.26B | 5.34B | 4.95B | 2.98B |
| Shareholders Equity | 21.23B | 18.69B | 17.25B | 3.31B | 2.68B |
Data provided by Twelve Data
Cash Flow Statement
| fiscal_date | 2024-12-31 | 2023-12-31 | 2022-12-31 | 2021-12-31 | 2020-12-31 |
|---|---|---|---|---|---|
| Operating Activities Net Income | 2.87B | -21.12M | -553.00M | 158.83M | 213.10M |
| Operating Activities Depreciation | 376.13M | 408.56M | 340.52M | 134.76M | 84.21M |
| Operating Activities Deferred Taxes | -1.67B | -85.88M | -69.59M | -10.44M | -8.02M |
| Operating Activities Stock Based Compensation | 1.27B | 1.28B | 1.07B | 608.04M | 397.80M |
| Operating Activities Other Non Cash Items | -1.03B | -733.19M | 13.53M | 142.40M | -7.68M |
| Operating Activities Accounts Receivable | 1.95B | -1.11B | -1.50B | -346.22M | -547.48M |
| Operating Activities Accounts Payable | -1.86B | 802.54M | 1.27B | 186.80M | 515.13M |
| Operating Activities Other Assets Liabilities | 121.45M | -379.27M | -369.64M | -61.98M | -1.34B |
| Operating Activities Operating Cash Flow | 2.03B | 159.21M | 202.79M | 812.20M | -689.78M |
| Investing Activities Capital Expenditures | -153.95M | -151.15M | -170.81M | -134.32M | -138.40M |
| Investing Activities Net Acquisitions | 0.00 | -4.97M | 539.45M | -163.97M | -79.22M |
| Investing Activities Purchase Of Investments | -1.25B | -1.16B | -812.41M | -3.25B | -1.97B |
| Investing Activities Sale Of Investments | 1.45B | 1.73B | 1.84B | 2.41B | 1.63B |
| Investing Activities Other Investing Activity | 603.98M | 272.86M | -169.40M | N/A | N/A |
| Investing Activities Investing Cash Flow | 649.95M | 683.20M | 1.23B | -1.14B | -556.64M |
| Financing Activities Long Term Debt Issuance | 3.26B | 1.39B | 1.62B | 1.97B | 2.58B |
| Financing Activities Long Term Debt Payments | -1.33B | -1.60B | -1.94B | -648.10M | 0.00 |
| Financing Activities Common Stock Repurchase | -1.17B | -156.81M | 0.00 | 0.00 | N/A |
| Financing Activities Other Financing Charges | 1.04B | -4.74M | 338.95M | 520.05M | 702.02M |
| Financing Activities Financing Cash Flow | 1.80B | -387.41M | -464.88M | 1.88B | 3.75B |
| End Cash Position | 13.23B | 9.01B | 8.44B | 6.98B | 4.79B |
| Income Tax Paid | 270.31M | N/A | N/A | N/A | N/A |
| Interest Paid | 205.78M | N/A | N/A | N/A | N/A |
| Free Cash Flow | 1.55B | -50.19M | 5.09M | 543.51M | -15.29M |
| Investing Activities Net Intangibles | N/A | 0.00 | 0.00 | -170.00M | -50.00M |
| Financing Activities Short Term Debt Issuance | N/A | -16.84M | -480.69M | 33.44M | 464.09M |
Data provided by Twelve Data
Technical Analysis
Key Insights
- The current trend direction shows Block's stock trading within an upward channel, with price action consolidating near the mid-range of its 52-week high and low.
- Key support levels are identified near $60.00 and $55.00, while resistance is observed around the 52-week high of $82.50.
- The stock price is positioned above the 10-day, 50-day, and 200-day moving averages, indicating a generally bullish medium to long-term trend.
- Momentum indicators reveal a Relative Strength Index (RSI) near neutral levels around 50-55, a positive MACD crossover signaling upward momentum, and a stochastic oscillator suggesting moderate buying pressure.
- Multi-timeframe analysis shows daily charts with steady gains, weekly charts indicating consolidation, and monthly charts reflecting an overall upward trajectory over the past year.
- Potential market scenarios include continuation of the current uptrend if support holds, or a pullback toward $60 if resistance near $82.50 proves strong, with volatility likely influenced by upcoming earnings and macroeconomic factors.
Trending News
1. Headline: Dimensional Fund Advisors LP Buys 520,999 Shares of Block, Inc. $XYZ
Summary: Dimensional Fund Advisors LP boosted its stake in Block, Inc. (NYSE:XYZ - Free Report) by 20.4% during the 3rd quarter, according to the company in its most recent filing with the Securities and Exchange Commission (SEC). The institutional investor owned 3,077,581 shares of the technology company'
Sentiment: positive
2. Headline: Aol
Summary: That’s the question swirling around Block after CEO Jack Dorsey announced plans to lay off 4,000 employees, about 40% of the company, just as the parent of Square and Cash App reported Q4 gross profit of $2.9 billion, up 24% year over year.
Sentiment: positive
3. Headline: Block employee says the company dangled a 75% pay raise to get her to stay after layoffs — but she decided to quit
Summary: Naoko Takeda was a data scientist at Block's Cash App for two years, per LinkedIn. After over 4,000 of her Block colleagues were laid off last week, Takeda wrote on LinkedIn that the company offered her a roughly 75% pay increase as well as a "retention bonus."
Sentiment: positive
4. Headline: Jack Dorsey Blamed AI for 4,000 Layoffs. A Former Block Exec Says That’s Not the Real Story
Summary: In a 'New York Times' opinion piece, former Block executive Aaron Zamost argues that artificial intelligence may be serving as a convenient story line for traditional corporate downsizing.
Sentiment: neutral
5. Headline: Morgan Stanley Reiterates Overweight Rating on Block Inc. (XYZ) following AMA
Summary: Morgan Stanley analyst James Faucette reiterated an Overweight rating and $93.00 price target on Block Inc. (NYSE: XYZ)The analyst commented, "Blocks CEO highlighted AI as a driver of organizational...
Sentiment: positive
Summary: When fintech company Block laid off 40% off its workforce last week, CEO Jack Dorsey explained the decision in a memo to employees that he also shared on social media. He was eliminating more than 4,000 jobs in the name of AI efficiency, he said, even though the company’s profitability was increasing...
Sentiment: negative
Summary: CEO cited AI advances in cutting 4,000 workers, but a weak crypto market and declining stock price may also be at play
Sentiment: negative
8. Headline: Fintech company Block lays off 4,000 of its 10,000 staff, citing gains from AI
Summary: Layoffs by American companies remain at relatively healthy levels, but the job cuts at Block are the latest among thousands announced in recent months. A number of other high-profile companies have announced layoffs recently, including UPS, Amazon, Dow and the Washington Post.
Sentiment: positive
9. Headline: Block lays off nearly half its staff because of AI. Its CEO said most companies will do the same | CNN Business
Summary: Block, the company behind Square, Cash App and Afterpay, is cutting its staff by 40%. The reason: “intelligence tools,” according to a letter to shareholders by co-founder Jack Dorsey.
Sentiment: negative
10. Headline: Block shares soar as much as 24% as company slashes workforce by nearly half
Summary: Block announced the layoffs in conjunction with its fourth-quarter earnings results. ... The payments company reported adjusted earnings per share of 65 cents on revenue of $6.25 billion, while analysts estimated 65 cents per share and $6.24 billion, according to LSEG. Gross profit increased 24% ...
Sentiment: positive
Powered by Brave
Recent Updates
News Summary
Recent news highlights Block's significant workforce reduction of approximately 4,000 employees, attributed by leadership to advances in artificial intelligence over the past 18 months. This move has sparked discussion regarding the true motivations behind the layoffs, with some former employees and industry observers questioning the AI rationale. CEO Jack Dorsey has publicly explained the decision as part of a strategic rebuild to enhance efficiency and future growth. Industry leaders such as Salesforce's CEO have commented on the broader implications of such layoffs in the tech sector. These developments occur amid a backdrop of sustained revenue growth and profitability, underscoring a complex balance between operational restructuring and market expectations.
News Sentiment
Sentiment across recent updates is mixed to moderately negative, reflecting skepticism about the AI-driven layoff justification alongside recognition of the company's efforts to adapt strategically. Positive commentary centers on leadership transparency and potential long-term benefits of restructuring, while negative sentiment arises from employee reactions and concerns over workforce reductions. Neutral perspectives emphasize the broader industry context and ongoing debates about technology's impact on employment.
Analytical Overview
Analysis Summary
Valuation Metrics: Block's trailing P/E ratio of 52.07 is aligned with the industry average of approximately 52, while its forward P/E of 19.15 suggests anticipated earnings growth. These metrics indicate a valuation consistent with growth expectations in the fintech sector.
Growth Trajectory: Revenue growth is modest at approximately 0.95% quarterly, with positive quarterly earnings growth of 4.5%. Operating and free cash flow remain strong, supporting sustainable growth prospects.
Financial Health: The company maintains a healthy current ratio of 2.33 and a manageable debt-to-equity ratio of 0.37, supported by significant cash reserves exceeding $11 billion, indicating solid financial stability.
Sector Specific Factors: Fintech faces regulatory scrutiny and rapid technological change, with AI integration presenting both opportunities for efficiency and risks related to workforce adjustments and market acceptance.
Market Positioning: Block benefits from strong market positioning through its diversified product ecosystem and strategic acquisitions, enabling competitive advantages in digital payments and financial services.
Investment Conclusion
Supporting Factors: Robust cash flow generation with $6.05 billion in free cash flow supports operational flexibility.
Risk Factors: Significant workforce reductions may impact operational capacity and employee morale.
SWOT Analysis
Strengths
- Strong cash reserves exceeding $11 billion provide financial flexibility.
- Diverse product ecosystem including Cash App and Afterpay enhances market reach.
- Consistent profitability with a profit margin near 37% demonstrates operational efficiency.
- Competitive return on equity of approximately 13.6% indicates effective capital use.
Weaknesses
- High trailing P/E ratio of 52.07 may reflect elevated valuation risk.
- Modest quarterly revenue growth under 1% suggests growth challenges.
- Recent layoffs affecting 40% of workforce could disrupt operations and morale.
- Lack of dividend payments may limit income appeal to certain stakeholders.
Opportunities
- Expansion into AI and blockchain technologies offers potential for innovation.
- Growing adoption of digital payments supports market demand.
- Strategic acquisitions can enhance product offerings and customer base.
- Increasing efficiency from AI integration may improve margins over time.
Threats
- Regulatory scrutiny in fintech could impose operational constraints.
- Competitive pressure from established and emerging fintech firms.
- Market skepticism regarding AI-driven layoffs may affect reputation.
- Volatility in cryptocurrency markets could impact related business segments.
Company Description
Block, Inc., formerly known as Square, Inc., is a prominent financial technology company renowned for its innovative payment solutions. It primarily serves as a dynamic player in the mobile payment industry, providing a comprehensive ecosystem of products designed to facilitate seamless electronic transactions. Block, Inc. pioneered its way into the marketplace with its iconic point-of-sale system, which allows small and medium-sized businesses to accept card payments through mobile devices. This solution significantly impacts retail, hospitality, and services industries by empowering merchants with accessible financial tools. Additionally, Block, Inc. extends its reach with Cash App, a popular peer-to-peer payment service, enabling users to send and receive money within minutes. The company’s acquisition of firms like Afterpay and its ventures into cryptocurrency and blockchain technology further underscore its commitment to digital finance innovation. Based in San Francisco, Block, Inc. plays a critical role in the evolving landscape of financial technology, fostering a more inclusive and digitized global economy.