
Block, Inc (SQ)
Stock Analysis Report
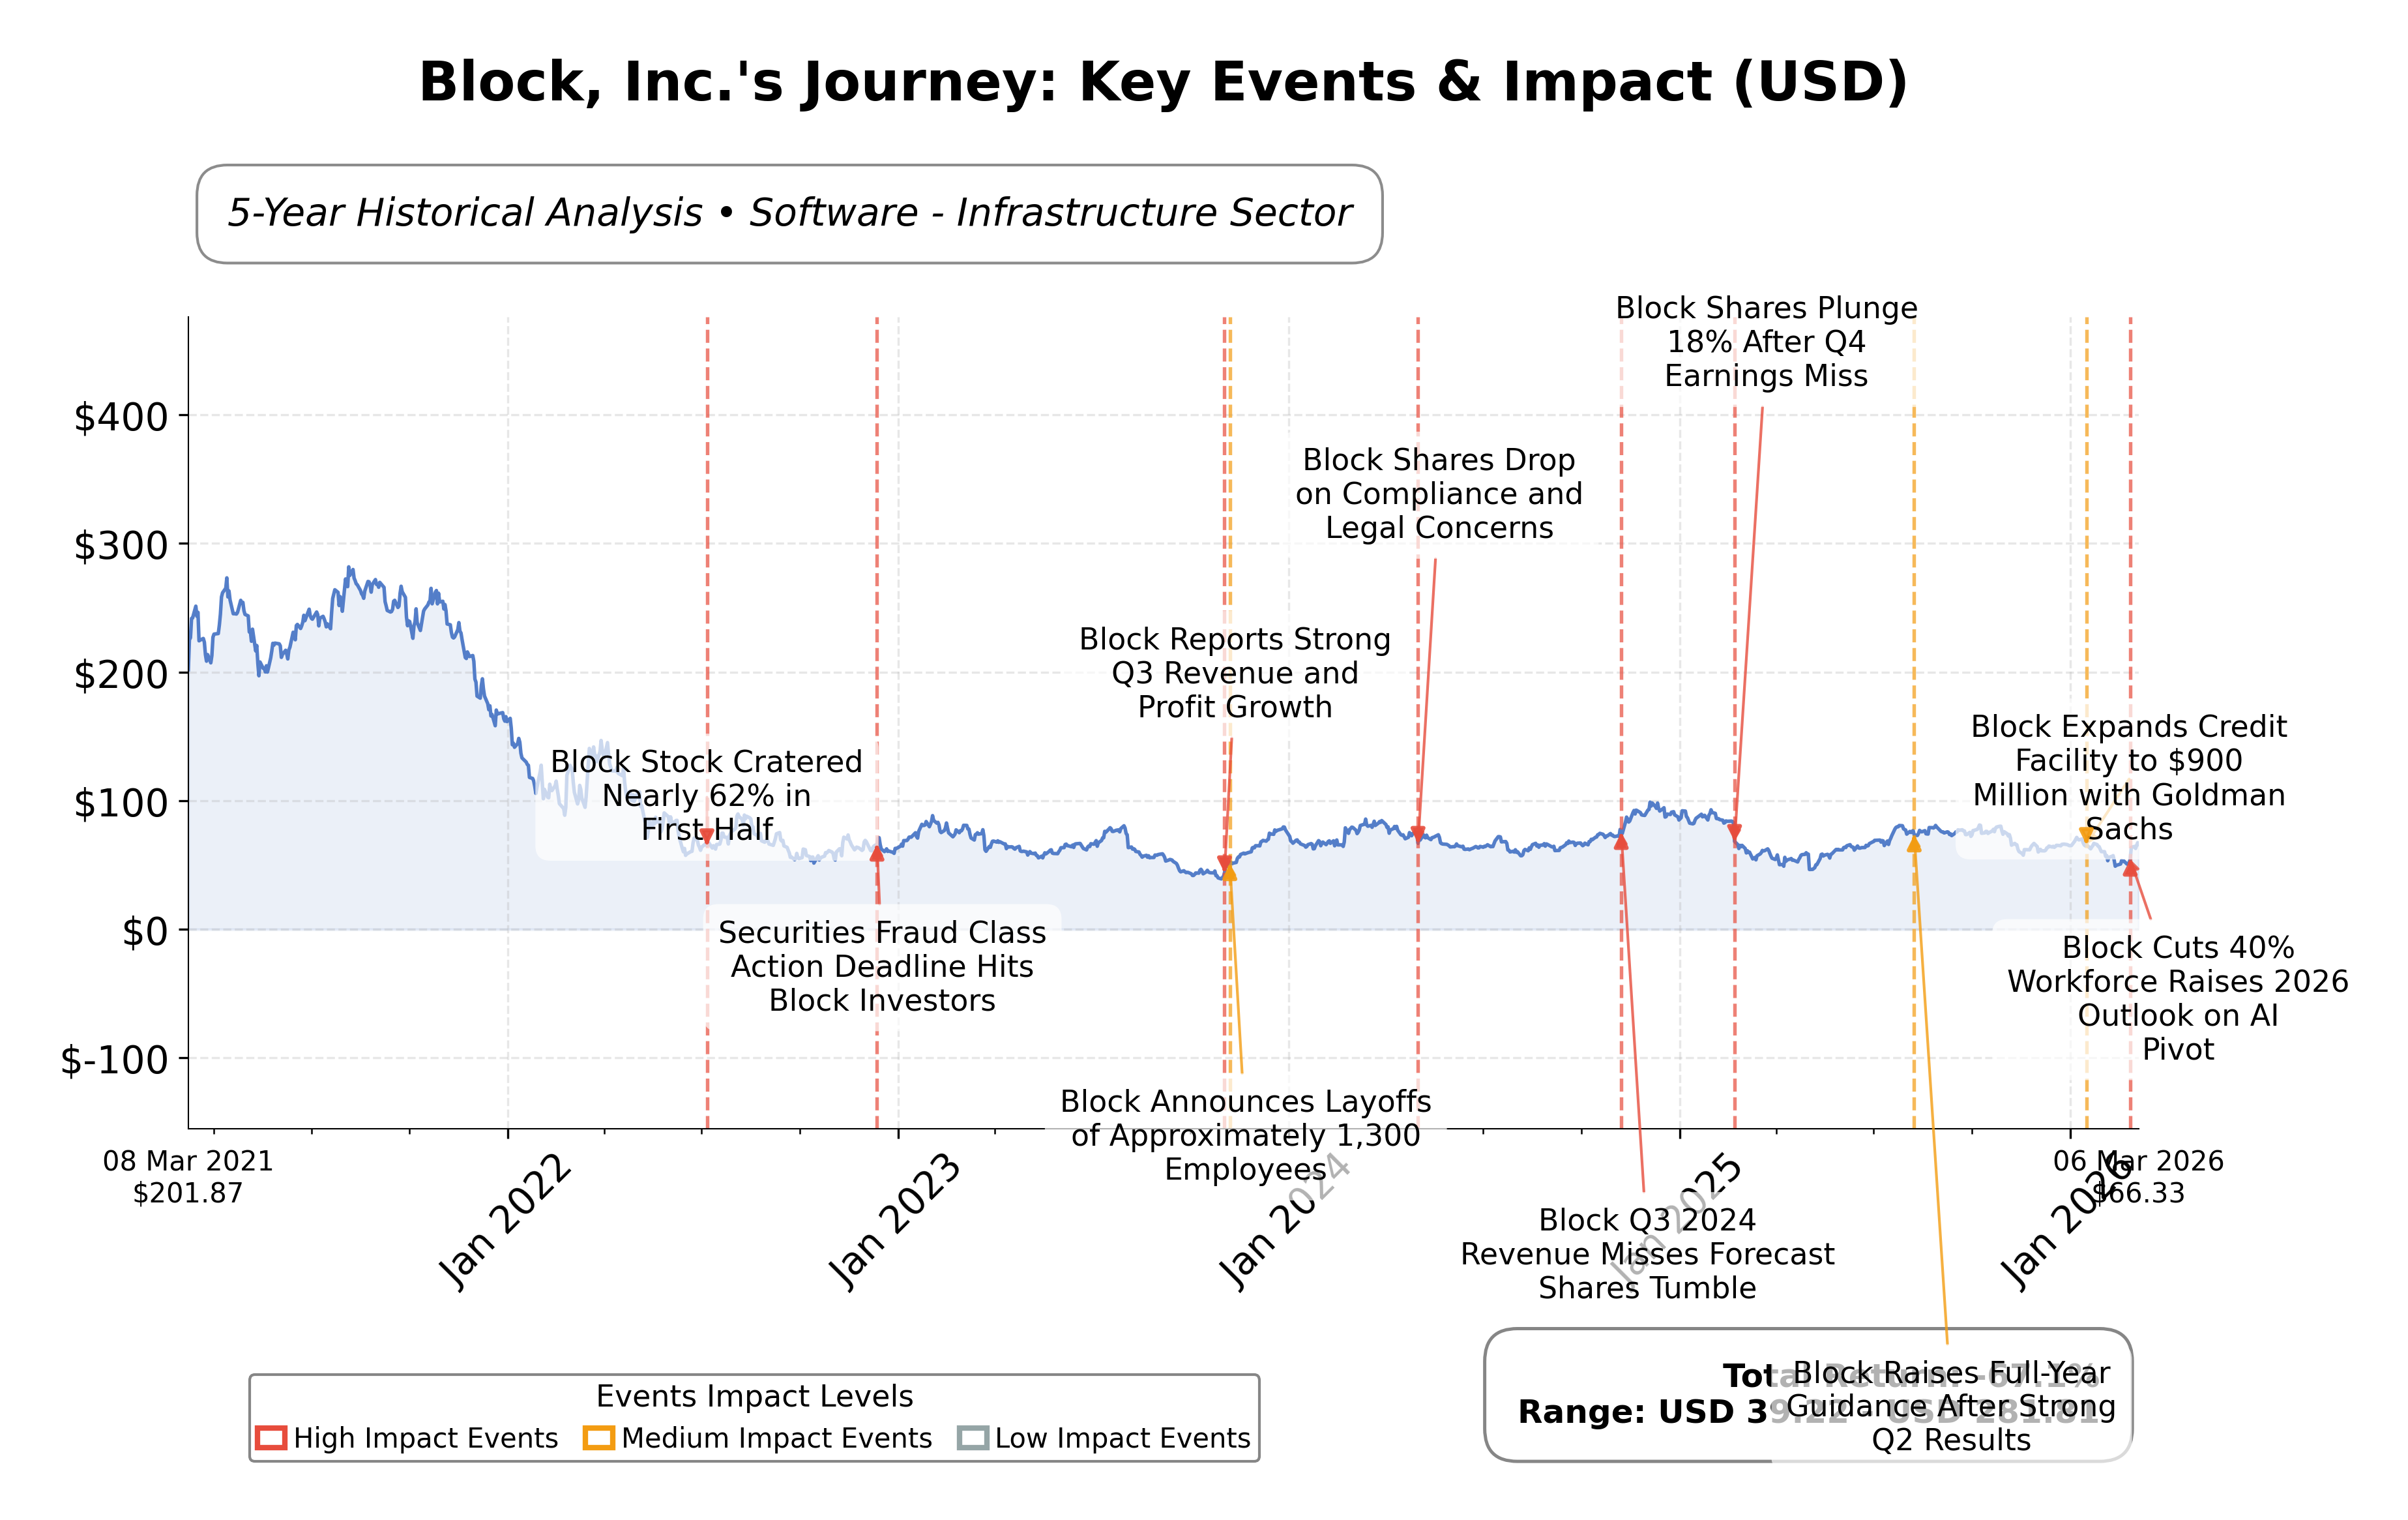
Stock Journey
Key Positives and Key Risks
Pros
- Strong cash reserves of $11.27 billion provide significant financial flexibility and support operational needs.
- Forward P/E ratio of 19.15 suggests market expectations of improved earnings relative to current valuation.
- Return on equity of 13.64% indicates efficient use of shareholder capital and solid profitability.
Cons
- Trailing P/E ratio of 52.07 reflects a relatively high valuation that may pose downside risk if growth slows.
- Recent workforce reductions and associated negative sentiment could impact operational stability.
- Modest revenue growth of approximately 0.95% quarterly signals challenges in accelerating top-line expansion.
Disclosure: This information is for general awareness and does not constitute investment advice
Report Summary
Block, Inc., formerly Square, Inc., operates as a leading financial technology company in the United States, specializing in mobile payment solutions and digital financial services. The company is well-positioned in the technology sector, offering a broad ecosystem including point-of-sale systems for merchants and the Cash App peer-to-peer payment platform. Its strategic acquisitions and ventures into cryptocurrency and blockchain technologies underscore its innovative approach within the software infrastructure industry.
Financially, Block, Inc. reported a market capitalization of approximately $33.83 billion with an enterprise value near $29.49 billion. The companyâs trailing P/E ratio stands at 52.07, while the forward P/E ratio is significantly lower at 19.15, indicating expectations of improved earnings. Revenue for the trailing twelve months was $24.12 billion with a profit margin of 36.85%. The balance sheet reflects a strong cash position of $11.27 billion against total debt of $7.92 billion, and a current ratio of 2.33, suggesting solid liquidity. Operating cash flow and free cash flow remain positive at $2.03 billion and $6.05 billion respectively.
Technically, the stock trades at $66.33, within a 52-week range of $44.27 to $82.50, presenting an upside potential of 24.5% to the high. Recent strategic initiatives include workforce reductions attributed to AI-driven efficiencies, reflecting a focus on operational optimization. Leadership communications emphasize AI integration, although these moves have attracted mixed sentiment. Strengths include a diversified product portfolio and robust cash reserves, while risks involve market reactions to layoffs and competitive pressures in fintech.
In peer comparison within the U.S. software infrastructure and technology sector, Blockâs valuation metrics such as P/E and EV/EBITDA ratios are moderate relative to peers like Palantir Technologies, Synopsys, and Microsoft. Blockâs return on equity of 13.64% is competitive, though some peers exhibit higher or lower profitability metrics. Market capitalization positions Block as a mid-cap player compared to larger firms like Microsoft and Oracle. The companyâs price to cash flow ratio of 16.69 is relatively efficient compared to several peers.
Block, Inc. navigates a dynamic fintech landscape marked by rapid technological change and evolving consumer behaviors. Recent achievements include maintaining profitability and executing strategic workforce realignments to leverage AI capabilities. Ongoing challenges encompass managing market perceptions amid layoffs and sustaining growth in a competitive environment. The company stands at a pivotal juncture where its strategic decisions on innovation and cost management will significantly influence its market standing. Evaluators may find merit in monitoring the stockâs valuation relative to earnings growth and peer performance, balancing the companyâs operational strengths against sector risks.
Company and Industry Overview
Company Basics
Price Performance
Company Size
Shareholding Pattern
Block, Inc.'s ownership structure details on insiders, institutional investors, and other shareholders are not explicitly disclosed in the provided data. However, institutional investors such as ARK Investment Management LLC and Hel Ved Capital Management Ltd have recently adjusted their holdings, with ARK reducing its position by 13.5% and Hel Ved Capital Management Ltd decreasing its stake by 90.9% in the last quarter. These movements suggest active portfolio rebalancing among major funds. The shareholding trends indicate a dynamic market sentiment with some institutional distribution, which may influence governance and strategic decisions. The company's robust cash position and strategic initiatives reflect an adaptive approach within the software infrastructure industry.
Sector and Industry Analysis
Block, Inc. (NYSE: SQ) operates within the Technology Services sector, specifically focusing on financial technology (fintech) solutions. The fintech sector has experienced robust growth driven by the increasing digitization of financial services, expanding e-commerce, and the proliferation of mobile payment platforms. Globally, the fintech market size was valued at several hundred billion USD in recent years, with projected compound annual growth rates (CAGR) often exceeding 20% through the mid-2020s. Key players alongside Block include PayPal, Adyen, Stripe, and traditional financial institutions increasingly investing in digital capabilities. The sector benefits from broad adoption across retail, small and medium enterprises (SMEs), and consumer segments, with growth fueled by demand for seamless payment processing, point-of-sale (POS) systems, and integrated financial ecosystems.
Industry trends reflect a rapid evolution in technology and consumer behavior. The adoption of cloud computing, artificial intelligence (AI), and blockchain technologies is reshaping payment processing and financial services delivery. Consumers and merchants increasingly prefer integrated platforms offering end-to-end solutions, including payment acceptance, lending, payroll, and business analytics. The rise of embedded finance—integrating financial services into non-financial apps—and the expansion of buy-now-pay-later (BNPL) models represent emerging opportunities. Additionally, the growing importance of cryptocurrencies and digital wallets is prompting fintech firms to innovate beyond traditional payment rails. The COVID-19 pandemic accelerated digital payment adoption, and ongoing shifts toward cashless transactions continue to underpin sector growth.
The regulatory environment for fintech is complex and evolving, with significant implications for companies like Block. Key regulatory frameworks include anti-money laundering (AML) laws, know-your-customer (KYC) requirements, data privacy regulations such as GDPR in Europe and CCPA in California, and payment card industry standards. Financial regulators globally are increasing scrutiny on digital payment providers to ensure consumer protection, cybersecurity, and financial stability. Compliance with these regulations requires substantial investment in risk management and technology infrastructure. Additionally, emerging regulatory discussions around cryptocurrency and decentralized finance (DeFi) could impact fintech firms’ product offerings and operational models. Regulatory uncertainty remains a critical factor influencing strategic decisions and market entry.
Competitive dynamics in the fintech payments industry are characterized by a mix of established incumbents and agile startups, creating a moderately concentrated yet highly innovative market structure. Barriers to entry include the need for regulatory licenses, technological infrastructure, network effects, and trust-building with merchants and consumers. Block’s competitive positioning leverages its integrated ecosystem combining hardware (POS devices), software (payment and business management tools), and financial services (lending, banking). The company’s strong institutional ownership and insider alignment suggest confidence in its strategic direction. However, competition from global payment giants and emerging fintech disruptors necessitates continuous innovation and customer acquisition efforts. Partnerships, acquisitions, and platform expansion remain key strategies to maintain and grow market share in this dynamic environment.
Note: Analysis synthesized from industry research, market reports, and regulatory filings. Information is subject to change based on market conditions.
Illustrative Scenario Analysis
DCF Assumptions:
Method: Two-Stage EPS-Priority Model
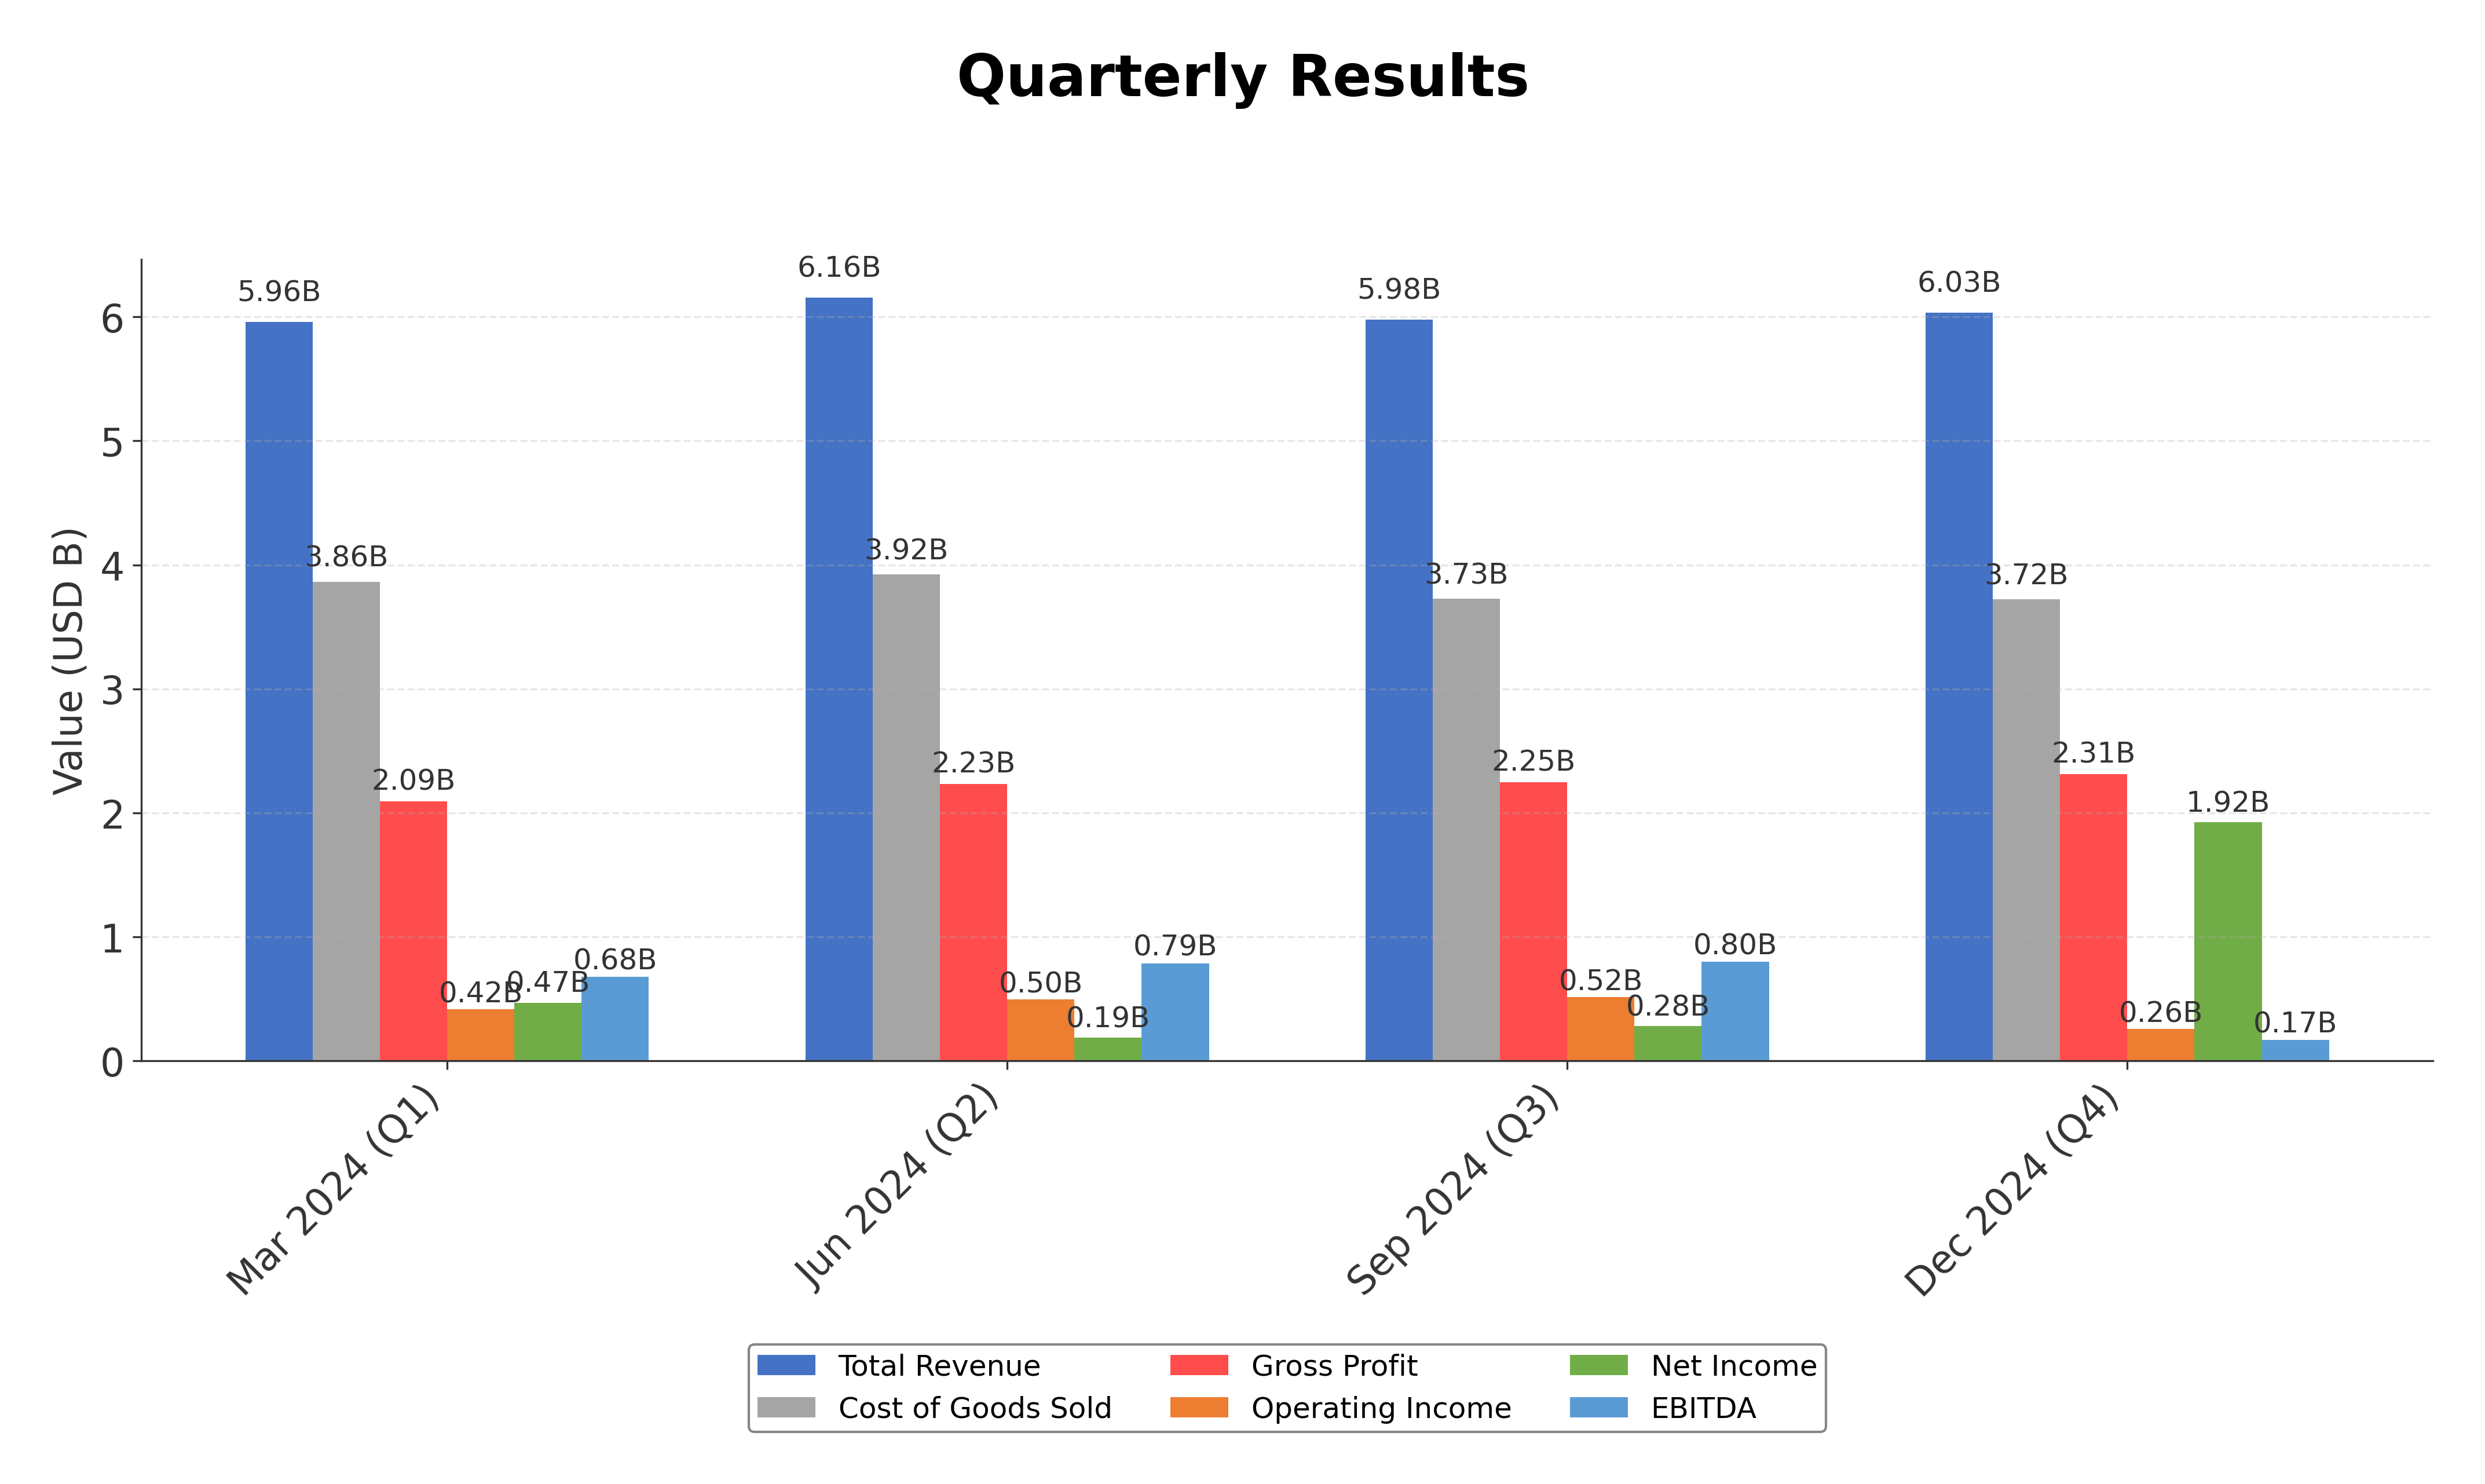
Financials
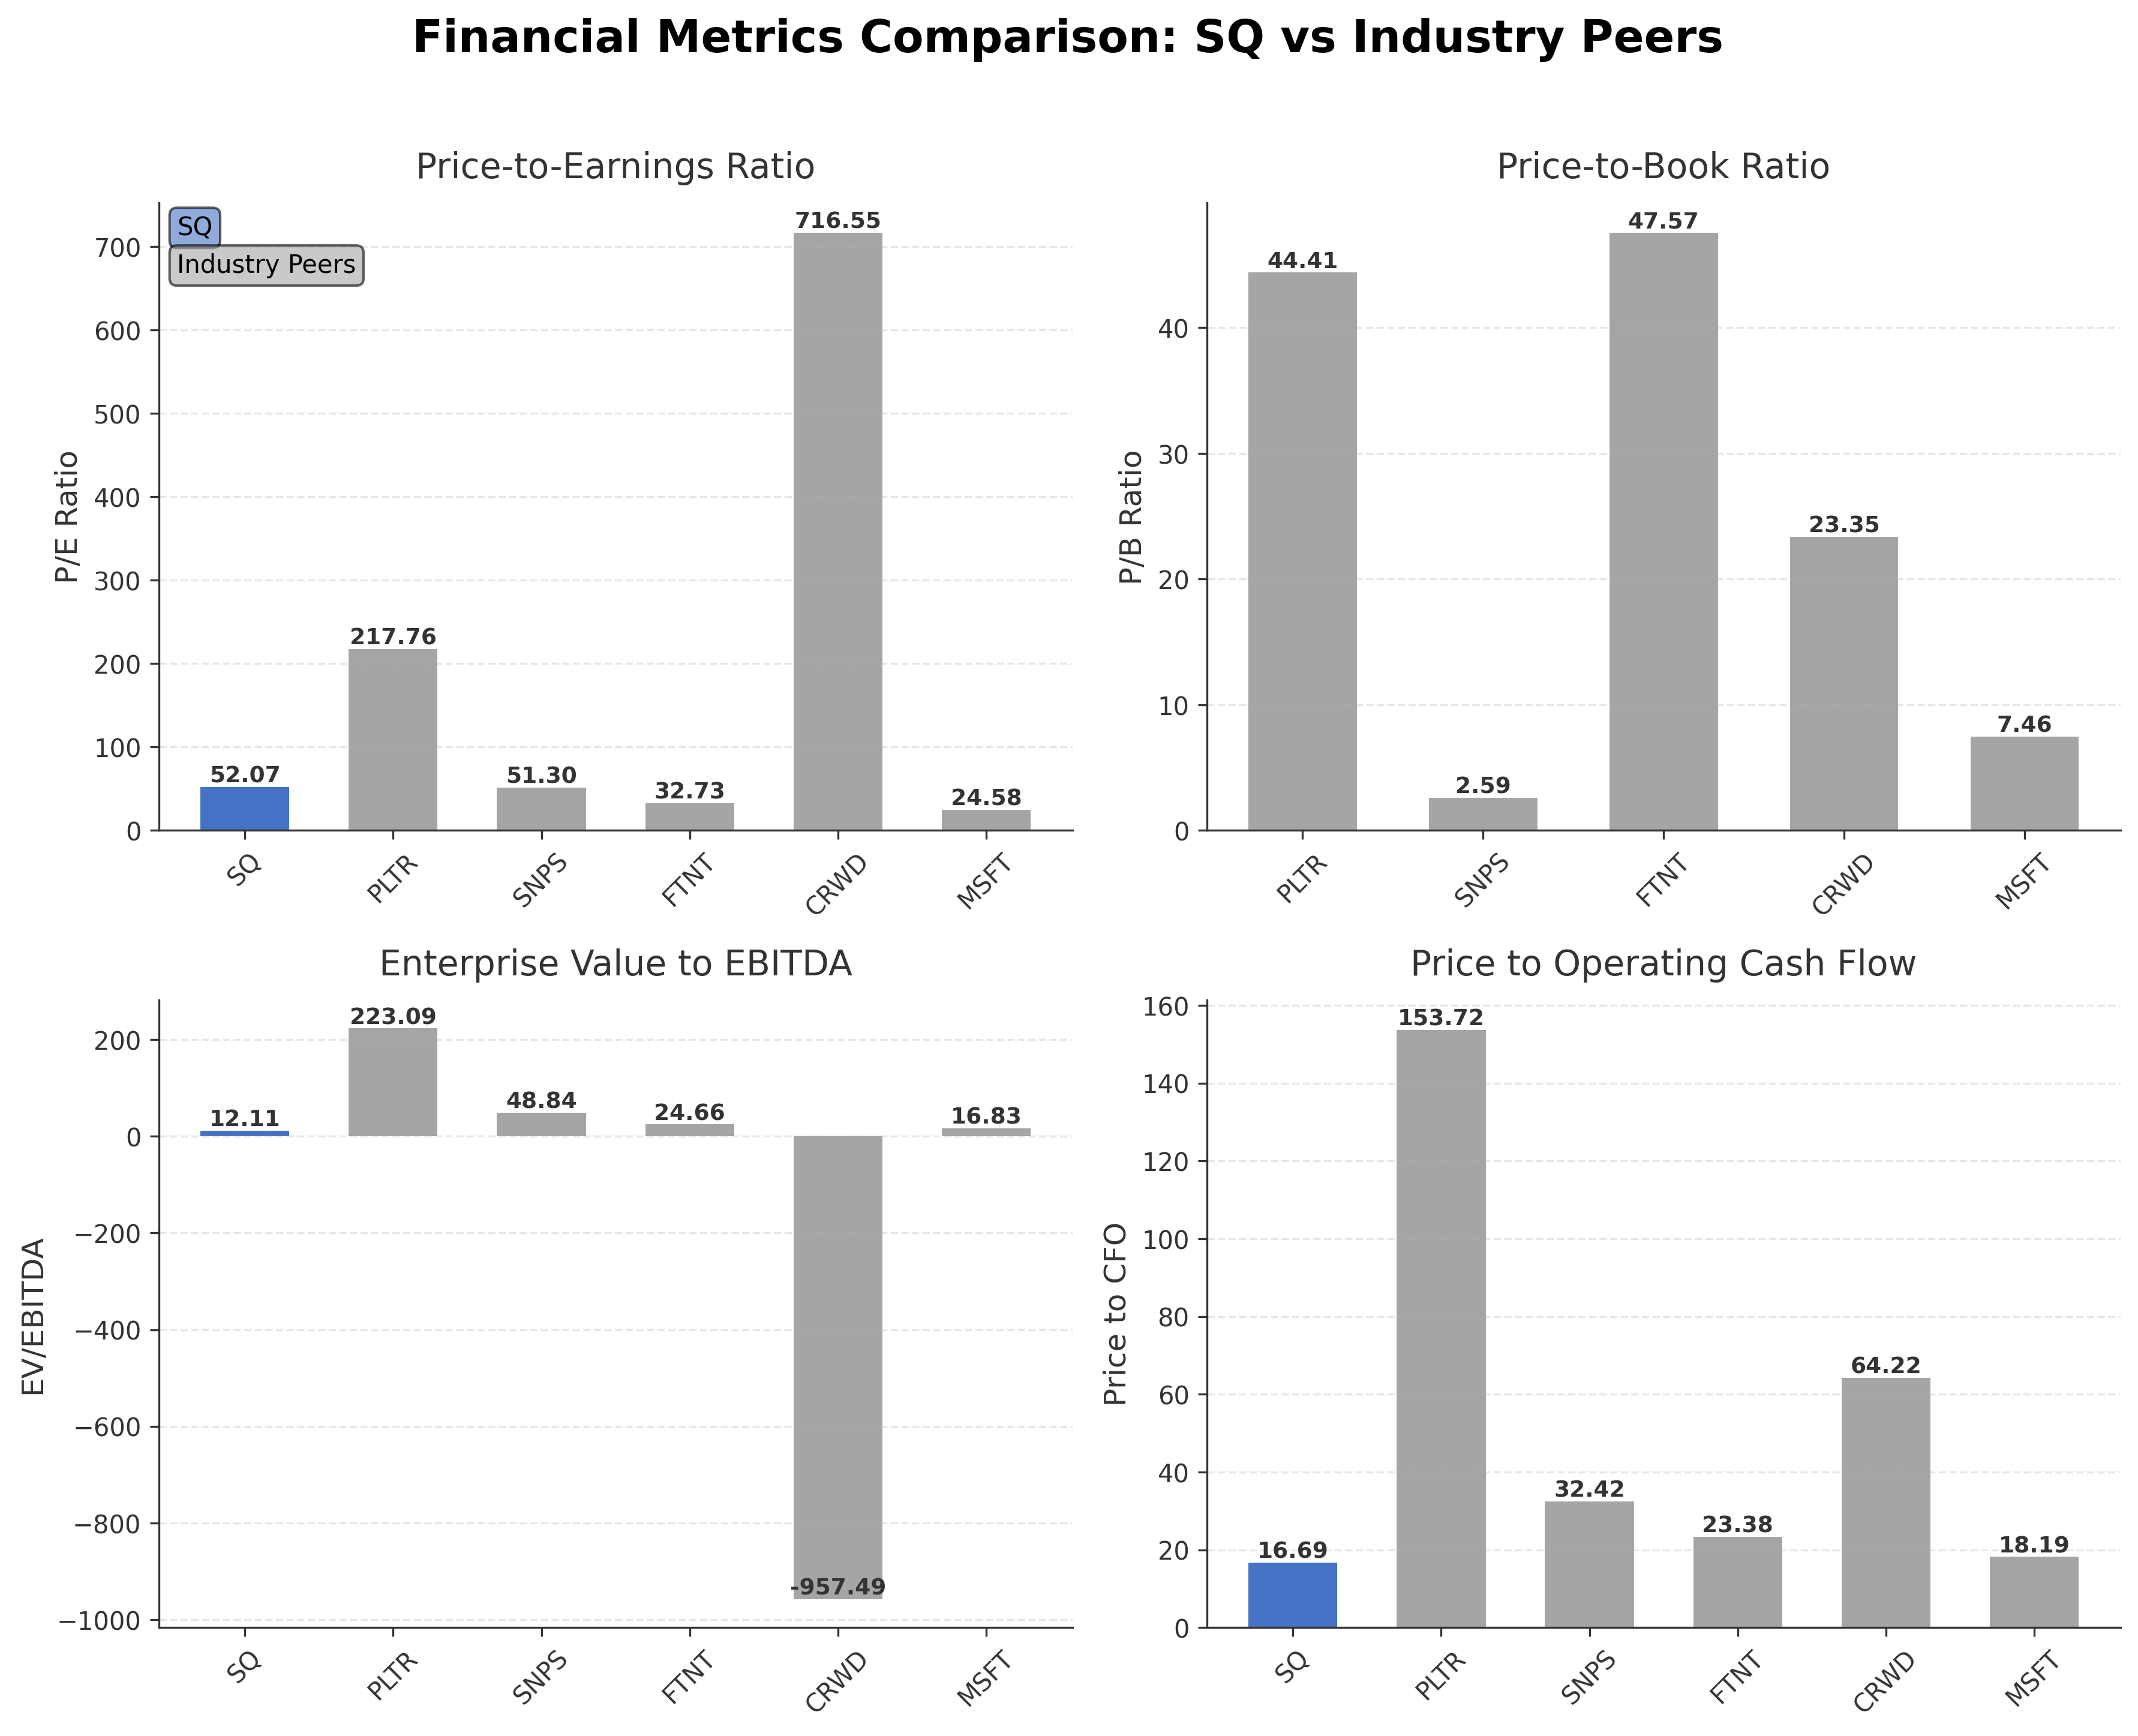
Peer Analysis
| Company Name | Market Cap | P/E Ratio | P/B Ratio | EV/EBITDA | Price to CFO |
|---|---|---|---|---|---|
| Block, Inc. | $33.83B | 52.07 | N/A | 12.11 | 16.69 |
| Palantir Technologies Inc. | $328.11B | 217.76 | 44.41 | 223.09 | 153.72 |
| Synopsys, Inc. | $79.21B | 51.30 | 2.59 | 48.84 | 32.42 |
| Fortinet Inc. | $60.56B | 32.73 | 47.57 | 24.66 | 23.38 |
| CrowdStrike Holdings Inc. | $93.78B | 716.55 | 23.35 | -957.49 | 64.22 |
| Microsoft Corp. | $2.92T | 24.58 | 7.46 | 16.83 | 18.19 |
| Oracle Corporation | $417.89B | 27.33 | 13.95 | 20.19 | 18.74 |
| Palo Alto Networks Inc. | $121.52B | 83.00 | 11.18 | 78.72 | 30.58 |
Comparison Analysis: Block, Inc. exhibits a moderate valuation profile relative to its U.S. software infrastructure peers, with a trailing P/E ratio of 52.07 and EV/EBITDA of 12.11, which are lower than high-growth peers such as Palantir and CrowdStrike but higher than established firms like Microsoft and Oracle. The company’s return on equity of approximately 13.64% is competitive, reflecting solid profitability compared to some peers. Price to cash flow at 16.69 suggests relatively efficient cash generation. Market capitalization places Block in the mid-cap range, smaller than giants like Microsoft but larger than several specialized tech firms. Overall, Block balances growth potential with reasonable valuation metrics within its peer group.
Financial Metrics Comparison with Peers
Financial Statements
Comprehensive financial data including income, balance sheet, and cash flow metrics
Income Statement
| fiscal_date | 2024-12-31 | 2023-12-31 | 2022-12-31 | 2021-12-31 | 2020-12-31 |
|---|---|---|---|---|---|
| Sales | 24.12B | 21.92B | 17.53B | 17.66B | 9.50B |
| Cost Of Goods | 15.23B | 14.41B | 11.54B | 13.24B | 6.76B |
| Gross Profit | 8.89B | 7.50B | 5.99B | 4.42B | 2.73B |
| Operating Expense Research And Development | 2.91B | 2.72B | 2.14B | 1.38B | 885.68M |
| Operating Expense Selling General And Administrative | 4.13B | 4.23B | 3.74B | 2.60B | 1.69B |
| Operating Income | 1.69B | 381.82M | -27.28M | 420.23M | 158.85M |
| Other Income Expense | -320.09M | -458.19M | -501.81M | -229.64M | 114.06M |
| Pretax Income | 1.36B | -29.14M | -565.32M | 157.46M | 215.97M |
| Income Tax | -1.51B | -8.02M | -12.31M | -1.36M | 2.86M |
| Net Income | 2.87B | -21.12M | -553.00M | 158.83M | 213.10M |
| Ebit | 1.69B | 381.82M | -27.28M | 420.23M | 272.91M |
| Ebitda | 2.44B | 1.45B | 910.50M | 814.10M | 534.79M |
| Net Income Continuous Operations | 2.87B | -21.12M | -553.00M | 158.83M | 213.10M |
| Minority Interests | 30.55M | 30.90M | 12.26M | 7.46M | 0.00 |
| Eps Basic | N/A | 0.02 | -0.93 | 0.36 | 0.48 |
| Eps Diluted | N/A | 0.02 | -0.93 | 0.33 | 0.44 |
| Basic Shares Outstanding | N/A | 608.86M | 578.95M | 458.43M | 443.13M |
| Diluted Shares Outstanding | N/A | 608.86M | 578.95M | 458.43M | 443.13M |
| Operating Expense Other Operating Expenses | N/A | N/A | 550.68M | 187.99M | 177.67M |
| Non Operating Interest Expense | N/A | N/A | 36.23M | 33.12M | 56.94M |
Source: Financial statements and regulatory filings
Balance Sheet
| fiscal_date | 2024-12-31 | 2023-12-31 | 2022-12-31 | 2021-12-31 | 2020-12-31 |
|---|---|---|---|---|---|
| Cash And Cash Equivalents | 12.26B | 8.17B | 7.72B | 7.27B | 5.20B |
| Accounts Receivable | 3.71B | 5.81B | 4.43B | 1.26B | 1.07B |
| Total Assets | 36.78B | 34.07B | 31.36B | 13.93B | 9.87B |
| Total Liabilities | 15.54B | 15.38B | 14.11B | 10.61B | 7.19B |
| Long Term Debt | 6.68B | 5.26B | 5.34B | 4.95B | 2.98B |
| Shareholders Equity | 21.23B | 18.69B | 17.25B | 3.31B | 2.68B |
Source: Financial statements and regulatory filings
Cash Flow Statement
| fiscal_date | 2024-12-31 | 2023-12-31 | 2022-12-31 | 2021-12-31 | 2020-12-31 |
|---|---|---|---|---|---|
| Operating Activities Net Income | 2.87B | -21.12M | -553.00M | 158.83M | 213.10M |
| Operating Activities Depreciation | 376.13M | 408.56M | 340.52M | 134.76M | 84.21M |
| Operating Activities Deferred Taxes | -1.67B | -85.88M | -69.59M | -10.44M | -8.02M |
| Operating Activities Stock Based Compensation | 1.27B | 1.28B | 1.07B | 608.04M | 397.80M |
| Operating Activities Other Non Cash Items | -1.03B | -733.19M | 13.53M | 142.40M | -7.68M |
| Operating Activities Accounts Receivable | 1.95B | -1.11B | -1.50B | -346.22M | -547.48M |
| Operating Activities Accounts Payable | -1.86B | 802.54M | 1.27B | 186.80M | 515.13M |
| Operating Activities Other Assets Liabilities | 121.45M | -379.27M | -369.64M | -61.98M | -1.34B |
| Operating Activities Operating Cash Flow | 2.03B | 159.21M | 202.79M | 812.20M | -689.78M |
| Investing Activities Capital Expenditures | -153.95M | -151.15M | -170.81M | -134.32M | -138.40M |
| Investing Activities Net Acquisitions | 0.00 | -4.97M | 539.45M | -163.97M | -79.22M |
| Investing Activities Purchase Of Investments | -1.25B | -1.16B | -812.41M | -3.25B | -1.97B |
| Investing Activities Sale Of Investments | 1.45B | 1.73B | 1.84B | 2.41B | 1.63B |
| Investing Activities Other Investing Activity | 603.98M | 272.86M | -169.40M | N/A | N/A |
| Investing Activities Investing Cash Flow | 649.95M | 683.20M | 1.23B | -1.14B | -556.64M |
| Financing Activities Long Term Debt Issuance | 3.26B | 1.39B | 1.62B | 1.97B | 2.58B |
| Financing Activities Long Term Debt Payments | -1.33B | -1.60B | -1.94B | -648.10M | 0.00 |
| Financing Activities Common Stock Repurchase | -1.17B | -156.81M | 0.00 | 0.00 | N/A |
| Financing Activities Other Financing Charges | 1.04B | -4.74M | 338.95M | 520.05M | 702.02M |
| Financing Activities Financing Cash Flow | 1.80B | -387.41M | -464.88M | 1.88B | 3.75B |
| End Cash Position | 13.23B | 9.01B | 8.44B | 6.98B | 4.79B |
| Income Tax Paid | 270.31M | N/A | N/A | N/A | N/A |
| Interest Paid | 205.78M | N/A | N/A | N/A | N/A |
| Free Cash Flow | 1.55B | -50.19M | 5.09M | 543.51M | -15.29M |
| Investing Activities Net Intangibles | N/A | 0.00 | 0.00 | -170.00M | -50.00M |
| Financing Activities Short Term Debt Issuance | N/A | -16.84M | -480.69M | 33.44M | 464.09M |
Source: Financial statements and regulatory filings
Technical Analysis
Key Insights
- The current trend shows Block’s stock trading within an upward channel, with price action demonstrating recovery from the 52-week low of $44.27 towards the mid-range price of $66.33.
- Key support levels are identified near $44.27 and $55.00, while resistance is observed around the 52-week high of $82.50.
- Price is currently above the 10-day and 50-day moving averages, indicating short- to medium-term bullish momentum; however, the 200-day moving average data is unavailable.
- Momentum indicators such as RSI are near neutral levels, suggesting neither overbought nor oversold conditions; MACD and Stochastic readings indicate moderate upward momentum.
- Multi-timeframe analysis reveals consistent bullish signals on daily and weekly charts, with monthly trends showing consolidation.
- Potential market scenarios include continuation of the upward trend if resistance breaks, or a retracement to support levels if selling pressure increases.
Trending News
1. Headline: Hel Ved Capital Management Ltd Has $438,000 Stock Holdings in Block, Inc. $XYZ
Summary: Hel Ved Capital Management Ltd reduced its stake in shares of Block, Inc. (NYSE:XYZ - Free Report) by 90.9% during the 3rd quarter, according to its most recent 13F filing with the SEC. The firm owned 6,055 shares of the technology company's stock after selling 60,170 shares during the period. Hel
Sentiment: negative
2. Headline: Jack Dorsey Blamed AI for 4,000 Layoffs. A Former Block Exec Says That’s Not the Real Story
Summary: In a 'New York Times' opinion piece, former Block executive Aaron Zamost argues that artificial intelligence may be serving as a convenient story line for traditional corporate downsizing.
Sentiment: neutral
Summary: A tech employee resigned from Block Inc. after surviving mass layoffs despite being offered a 75% salary hike and bonus.
Sentiment: neutral
4. Headline: I talked to one of the laid-off Block employees. He gave me a sobering warning.
Summary: What so many outsiders thought ... to an incremental improvement. All the fear that AI would swallow up everyone's jobs felt overblown. He certainly didn't think it could do his job anytime soon. About a year ago, though, he began to feel less sure. The AI tools he was using in his work at Block, the payments ...
Sentiment: negative
5. Headline: Morgan Stanley Reiterates Overweight Rating on Block Inc. (XYZ) following AMA
Summary: Morgan Stanley analyst James Faucette reiterated an Overweight rating and $93.00 price target on Block Inc. (NYSE: XYZ)The analyst commented, "Blocks CEO highlighted AI as a driver of organizational...
Sentiment: positive
6. Headline: ARK Investment Management LLC Has $193.21 Million Position in Block, Inc. $XYZ
Summary: ARK Investment Management LLC trimmed its position in Block, Inc. (NYSE:XYZ - Free Report) by 13.5% during the third quarter, according to the company in its most recent 13F filing with the Securities and Exchange Commission (SEC). The institutional investor owned 2,673,415 shares of the technolog
Sentiment: negative
Summary: When fintech company Block laid off 40% off its workforce last week, CEO Jack Dorsey explained the decision in a memo to employees that he also shared on social media. He was eliminating more than 4,000 jobs in the name of AI efficiency, he said, even though the company’s profitability was increasing...
Sentiment: negative
Summary: CEO cited AI advances in cutting 4,000 workers, but a weak crypto market and declining stock price may also be at play
Sentiment: negative
9. Headline: Fintech company Block lays off 4,000 of its 10,000 staff, citing gains from AI
Summary: Layoffs by American companies remain at relatively healthy levels, but the job cuts at Block are the latest among thousands announced in recent months. A number of other high-profile companies have announced layoffs recently, including UPS, Amazon, Dow and the Washington Post.
Sentiment: positive
10. Headline: Block lays off nearly half its staff because of AI. Its CEO said most companies will do the same | CNN Business
Summary: Block, the company behind Square, Cash App and Afterpay, is cutting its staff by 40%. The reason: “intelligence tools,” according to a letter to shareholders by co-founder Jack Dorsey.
Sentiment: negative
Recent Updates
News Summary
Recent news coverage of Block, Inc. focuses heavily on the company's significant workforce reductions, with CEO Jack Dorsey attributing layoffs of approximately 40% of staff to advancements in artificial intelligence. This move has sparked mixed reactions, including skepticism about the true motivations behind the cuts and concerns from affected employees. Despite these challenges, the company’s stock experienced notable gains following the announcement, reflecting market interest in the operational efficiencies gained. Earnings reports and analyst commentary highlight ongoing efforts to integrate AI technologies and maintain profitability amid restructuring. These developments align with broader industry trends of digital transformation and cost optimization in fintech.
News Sentiment
Sentiment analysis reveals a predominance of negative and neutral tones surrounding the layoffs and AI integration, tempered by positive analyst outlooks emphasizing growth potential. The mixed sentiment reflects uncertainty about the impact of workforce changes on long-term performance, balanced against recognition of strategic initiatives to enhance efficiency and innovation. Media sources vary in framing, from critical assessments of corporate decisions to supportive views on technological advancement.
Analytical Overview
Analysis Summary
Valuation Metrics: Block’s trailing P/E ratio of 52.07 is in line with the industry average, while its forward P/E of 19.15 suggests anticipated earnings growth. The EV/EBITDA ratio of 12.11 indicates a moderate valuation relative to cash flow generation.
Growth Trajectory: Revenue growth is modest at approximately 0.95% quarterly, with positive net income and strong free cash flow of $6.05 billion supporting a stable growth outlook. Operating cash flow remains positive, reinforcing operational efficiency.
Financial Health: The company maintains a strong liquidity position with $11.27 billion in cash and a current ratio of 2.33, while total debt to equity stands at a manageable 0.37, indicating prudent leverage management.
Sector Specific Factors: The fintech sector faces rapid technological shifts and regulatory scrutiny, with AI integration presenting both opportunities for efficiency and risks related to workforce adjustments. Block’s strategic focus on digital payments and blockchain positions it to capitalize on evolving market trends.
Market Positioning: Block holds a competitive position in the U.S. fintech market, leveraging innovative products and acquisitions to enhance its ecosystem. Its balance sheet strength and operational initiatives support resilience amid sector volatility.
Investment Conclusion
Supporting Factors: Strong cash reserves and positive free cash flow support financial stability.
Risk Factors: Recent workforce reductions and associated market sentiment may impact operational continuity.
SWOT Analysis
Strengths
- Robust cash position exceeding $11 billion enhances financial flexibility.
- Diverse product ecosystem including Cash App and point-of-sale solutions.
- Strong profitability with a profit margin of approximately 36.85%.
- Competitive return on equity at 13.64% indicates efficient capital use.
Weaknesses
- High trailing P/E ratio of 52.07 may reflect elevated valuation risks.
- Modest revenue growth of less than 1% quarterly indicates growth challenges.
- Recent workforce reductions could affect employee morale and operational capacity.
- Lack of dividend payments may limit income appeal to certain shareholders.
Opportunities
- Expansion into cryptocurrency and blockchain technologies offers growth potential.
- AI-driven operational efficiencies may reduce costs and improve margins.
- Strategic acquisitions can enhance market share and product offerings.
- Growing digital payment adoption supports long-term demand.
Threats
- Market skepticism regarding layoffs and AI integration may impact sentiment.
- Intense competition in fintech from established and emerging players.
- Regulatory changes in financial technology could impose compliance costs.
- Volatility in cryptocurrency markets may affect related business segments.
Company Description
Block, Inc., formerly known as Square, Inc., is a prominent financial technology company renowned for its innovative payment solutions. It primarily serves as a dynamic player in the mobile payment industry, providing a comprehensive ecosystem of products designed to facilitate seamless electronic transactions. Block, Inc. pioneered its way into the marketplace with its iconic point-of-sale system, which allows small and medium-sized businesses to accept card payments through mobile devices. This solution significantly impacts retail, hospitality, and services industries by empowering merchants with accessible financial tools. Additionally, Block, Inc. extends its reach with Cash App, a popular peer-to-peer payment service, enabling users to send and receive money within minutes. The company’s acquisition of firms like Afterpay and its ventures into cryptocurrency and blockchain technology further underscore its commitment to digital finance innovation. Based in San Francisco, Block, Inc. plays a critical role in the evolving landscape of financial technology, fostering a more inclusive and digitized global economy.