


Birlasoft Ltd (BSOFT)
Stock Analysis Report
Stock Journey
Key Positives and Key Risks
Pros
- Strong cash reserves of INR 24.56 billion provide liquidity and financial flexibility.
- Low debt-to-equity ratio of 0.034 indicates conservative leverage and low financial risk.
- Robust year-over-year earnings growth of 44.1% demonstrates improving profitability.
Cons
- Modest quarterly revenue growth of 2.4% suggests limited top-line expansion.
- Return on equity at 13.7% is moderate compared to higher-performing peers.
- Stock price trading below the 200-day moving average indicates technical weakness.
Disclosure: This information is for general awareness and does not constitute investment advice
Report Summary
Birlasoft Ltd. is a prominent Indian-based global information technology services provider listed on the NSE under the technology sector. The company specializes in delivering digital and technology solutions across diverse industries such as manufacturing, banking, healthcare, and insurance. Its core offerings include enterprise application services, digital transformation, and IT infrastructure management, leveraging advanced technologies like artificial intelligence, data analytics, and cloud computing. Birlasoft maintains a competitive position in the IT consulting and services industry, supported by strategic partnerships and a skilled workforce.
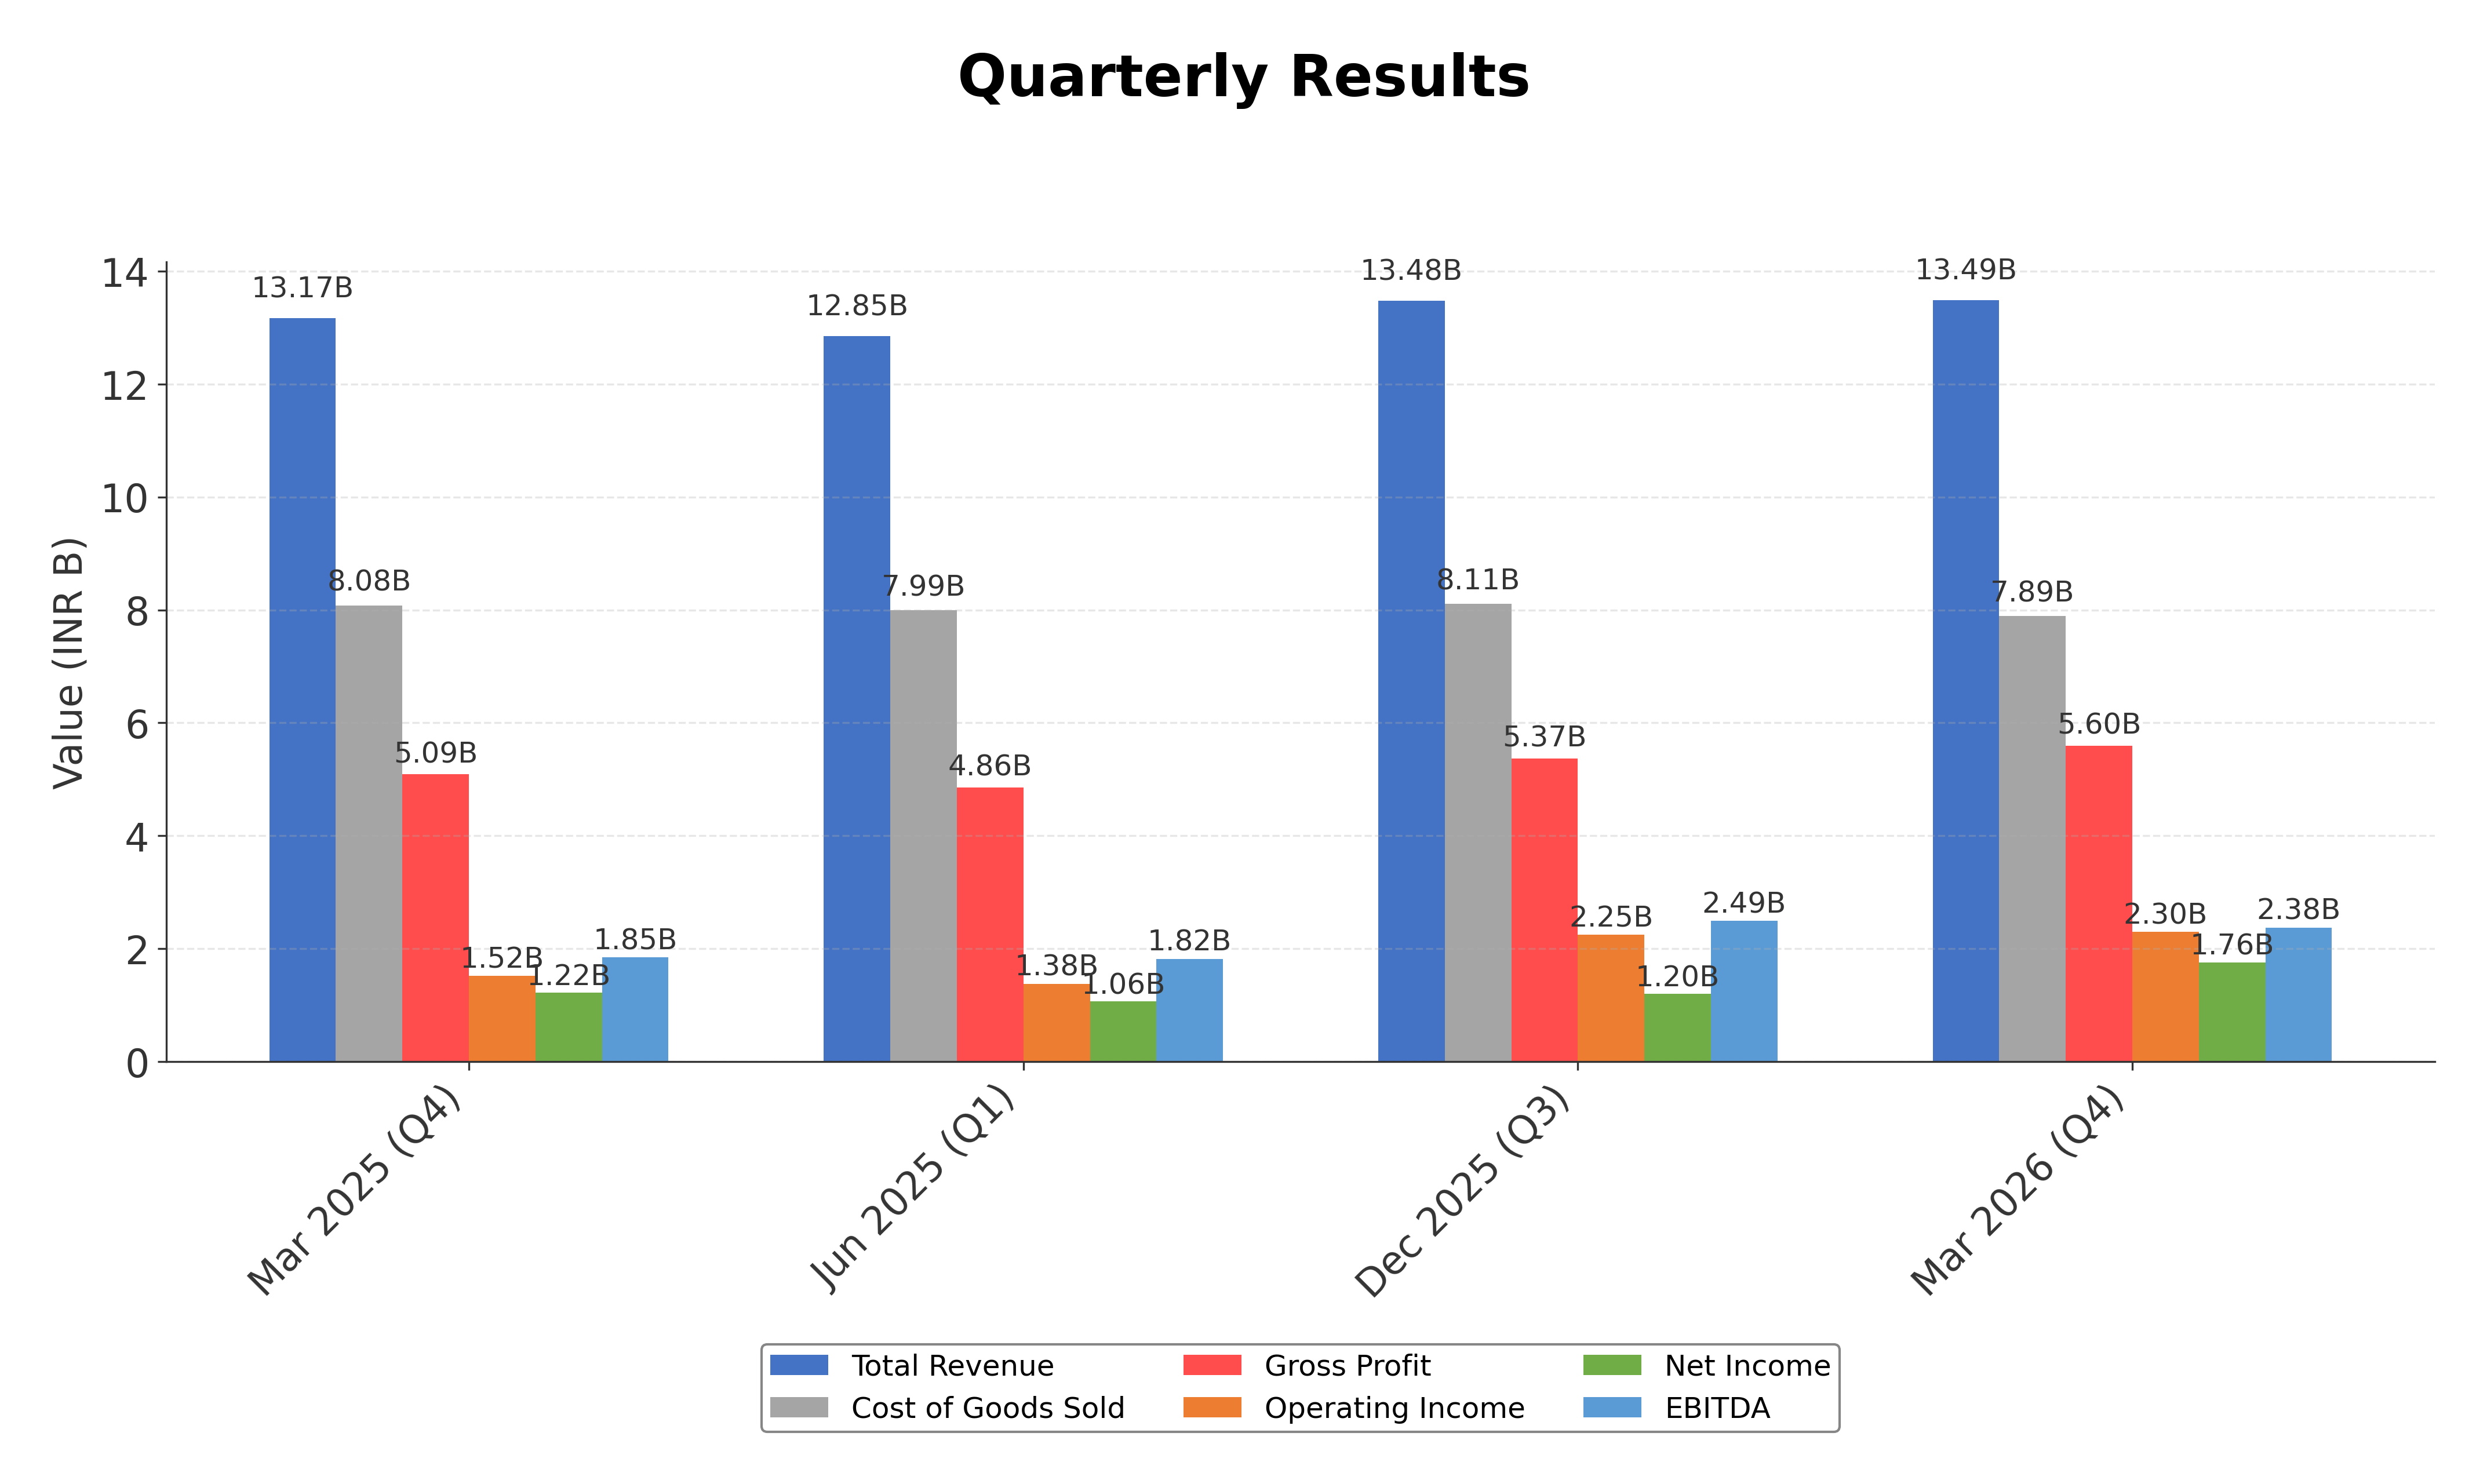
Financially, Birlasoft reported trailing twelve months (TTM) revenue of approximately INR 53.1 billion with a gross margin of 41.5%, operating margin of 17.0%, and net profit margin near 9.8%. The company’s return on equity (ROE) stands at 13.7%, return on assets (ROA) at 10.1%, and return on invested capital (ROIC) reflects efficient capital utilization. These metrics indicate solid profitability and operational efficiency within its industry context. Quarterly revenue growth was modest at 2.4%, while year-over-year earnings growth showed a robust 44.1%, underscoring improving profitability.
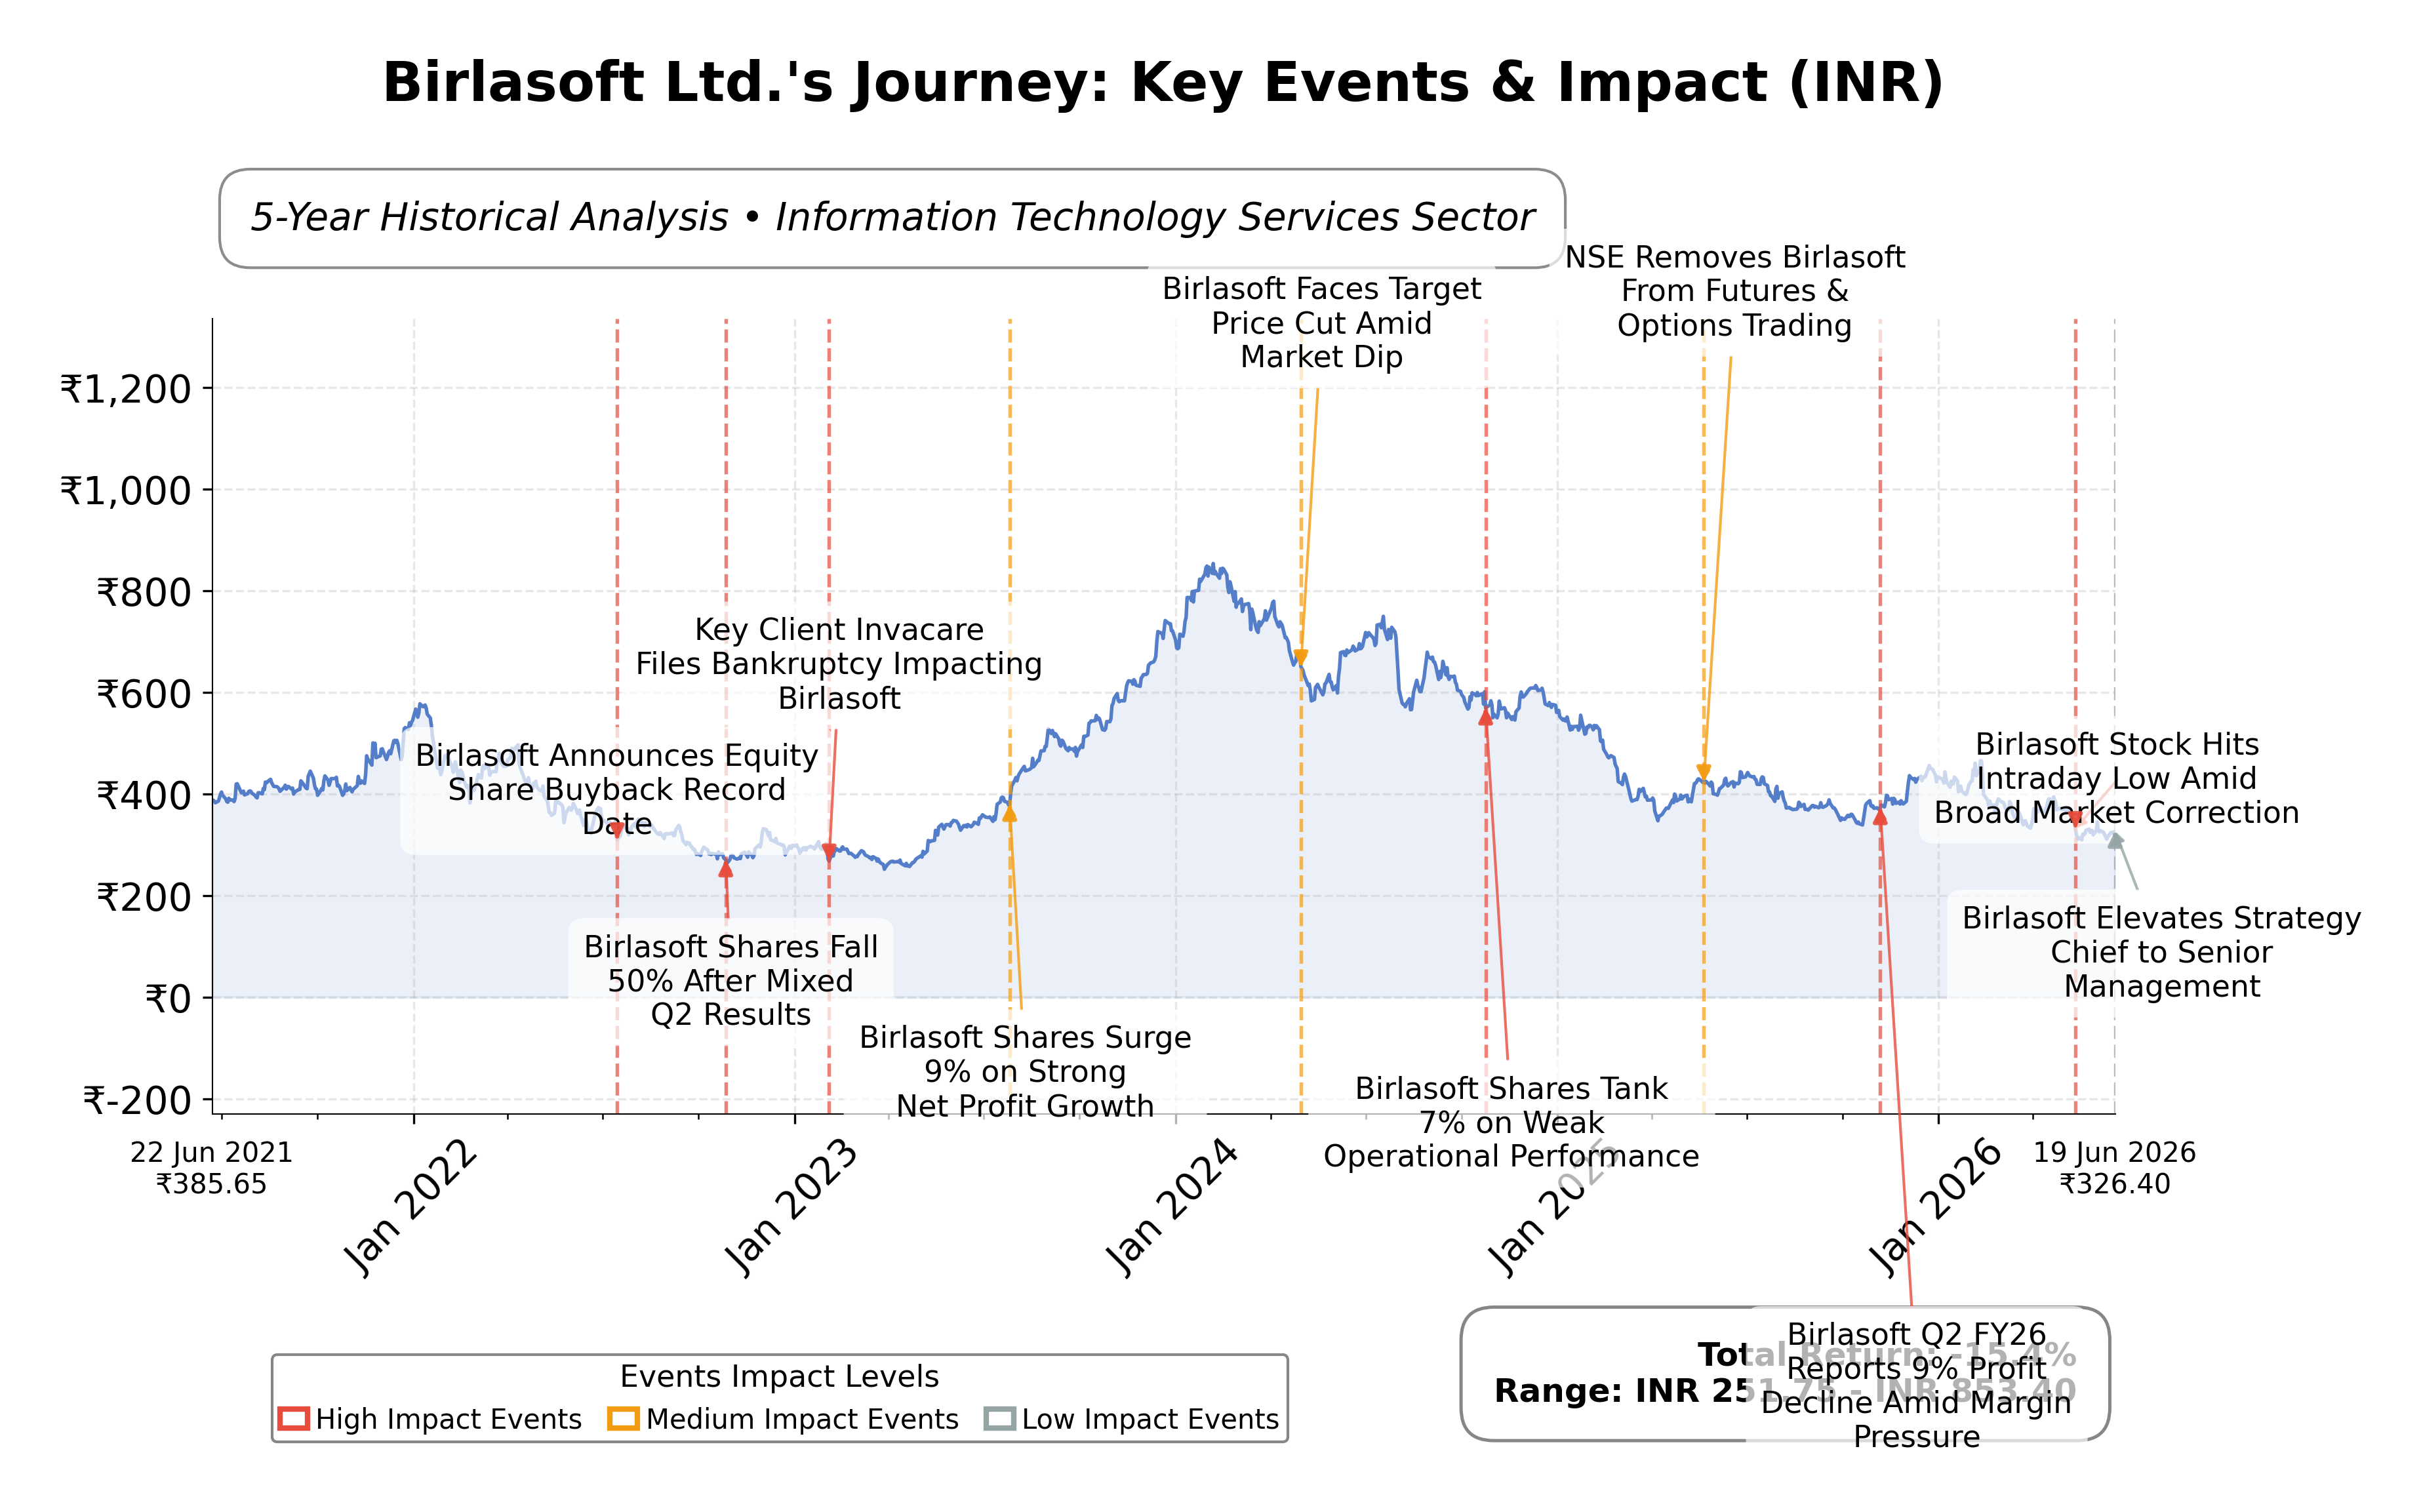
Valuation metrics reveal a trailing price-to-earnings (P/E) ratio of 17.1 and a forward P/E of 13.0, suggesting the stock is priced with moderate growth expectations. The price-to-book (P/B) ratio is 2.16, and the enterprise value to EBITDA (EV/EBITDA) multiple is 7.56, indicating reasonable valuation relative to earnings and book value. The market capitalization is approximately INR 90.5 billion. The stock’s 52-week range spans INR 306.4 to INR 474, with the current price near INR 317, reflecting a significant discount from its high, which may imply valuation considerations by the market.
Birlasoft’s strengths include strong cash reserves of over INR 24.5 billion, low debt levels with a debt-to-equity ratio of 0.034, and a high current ratio of 4.29, indicating robust liquidity. The company benefits from market leadership in IT services and strategic initiatives such as appointing a Chief Strategy Officer and allotting ESOP shares to incentivize talent. Risks include competitive pressures in the IT sector, regulatory compliance challenges, and macroeconomic uncertainties affecting client spending. Recent strategic actions focus on leadership enhancement and AI-driven capabilities recognition, reflecting ongoing innovation.
Technically, the stock exhibits mixed momentum signals with price near key moving averages and fluctuating momentum indicators. Recent news highlights both positive developments in leadership and innovation as well as some bearish technical momentum shifts. Overall, the data suggests a cautious stance with potential for accumulation under favorable conditions, balanced by the need to monitor evolving market and operational factors.
Company and Industry Overview
Company Basics
Price Performance
Company Size
Shareholding Pattern
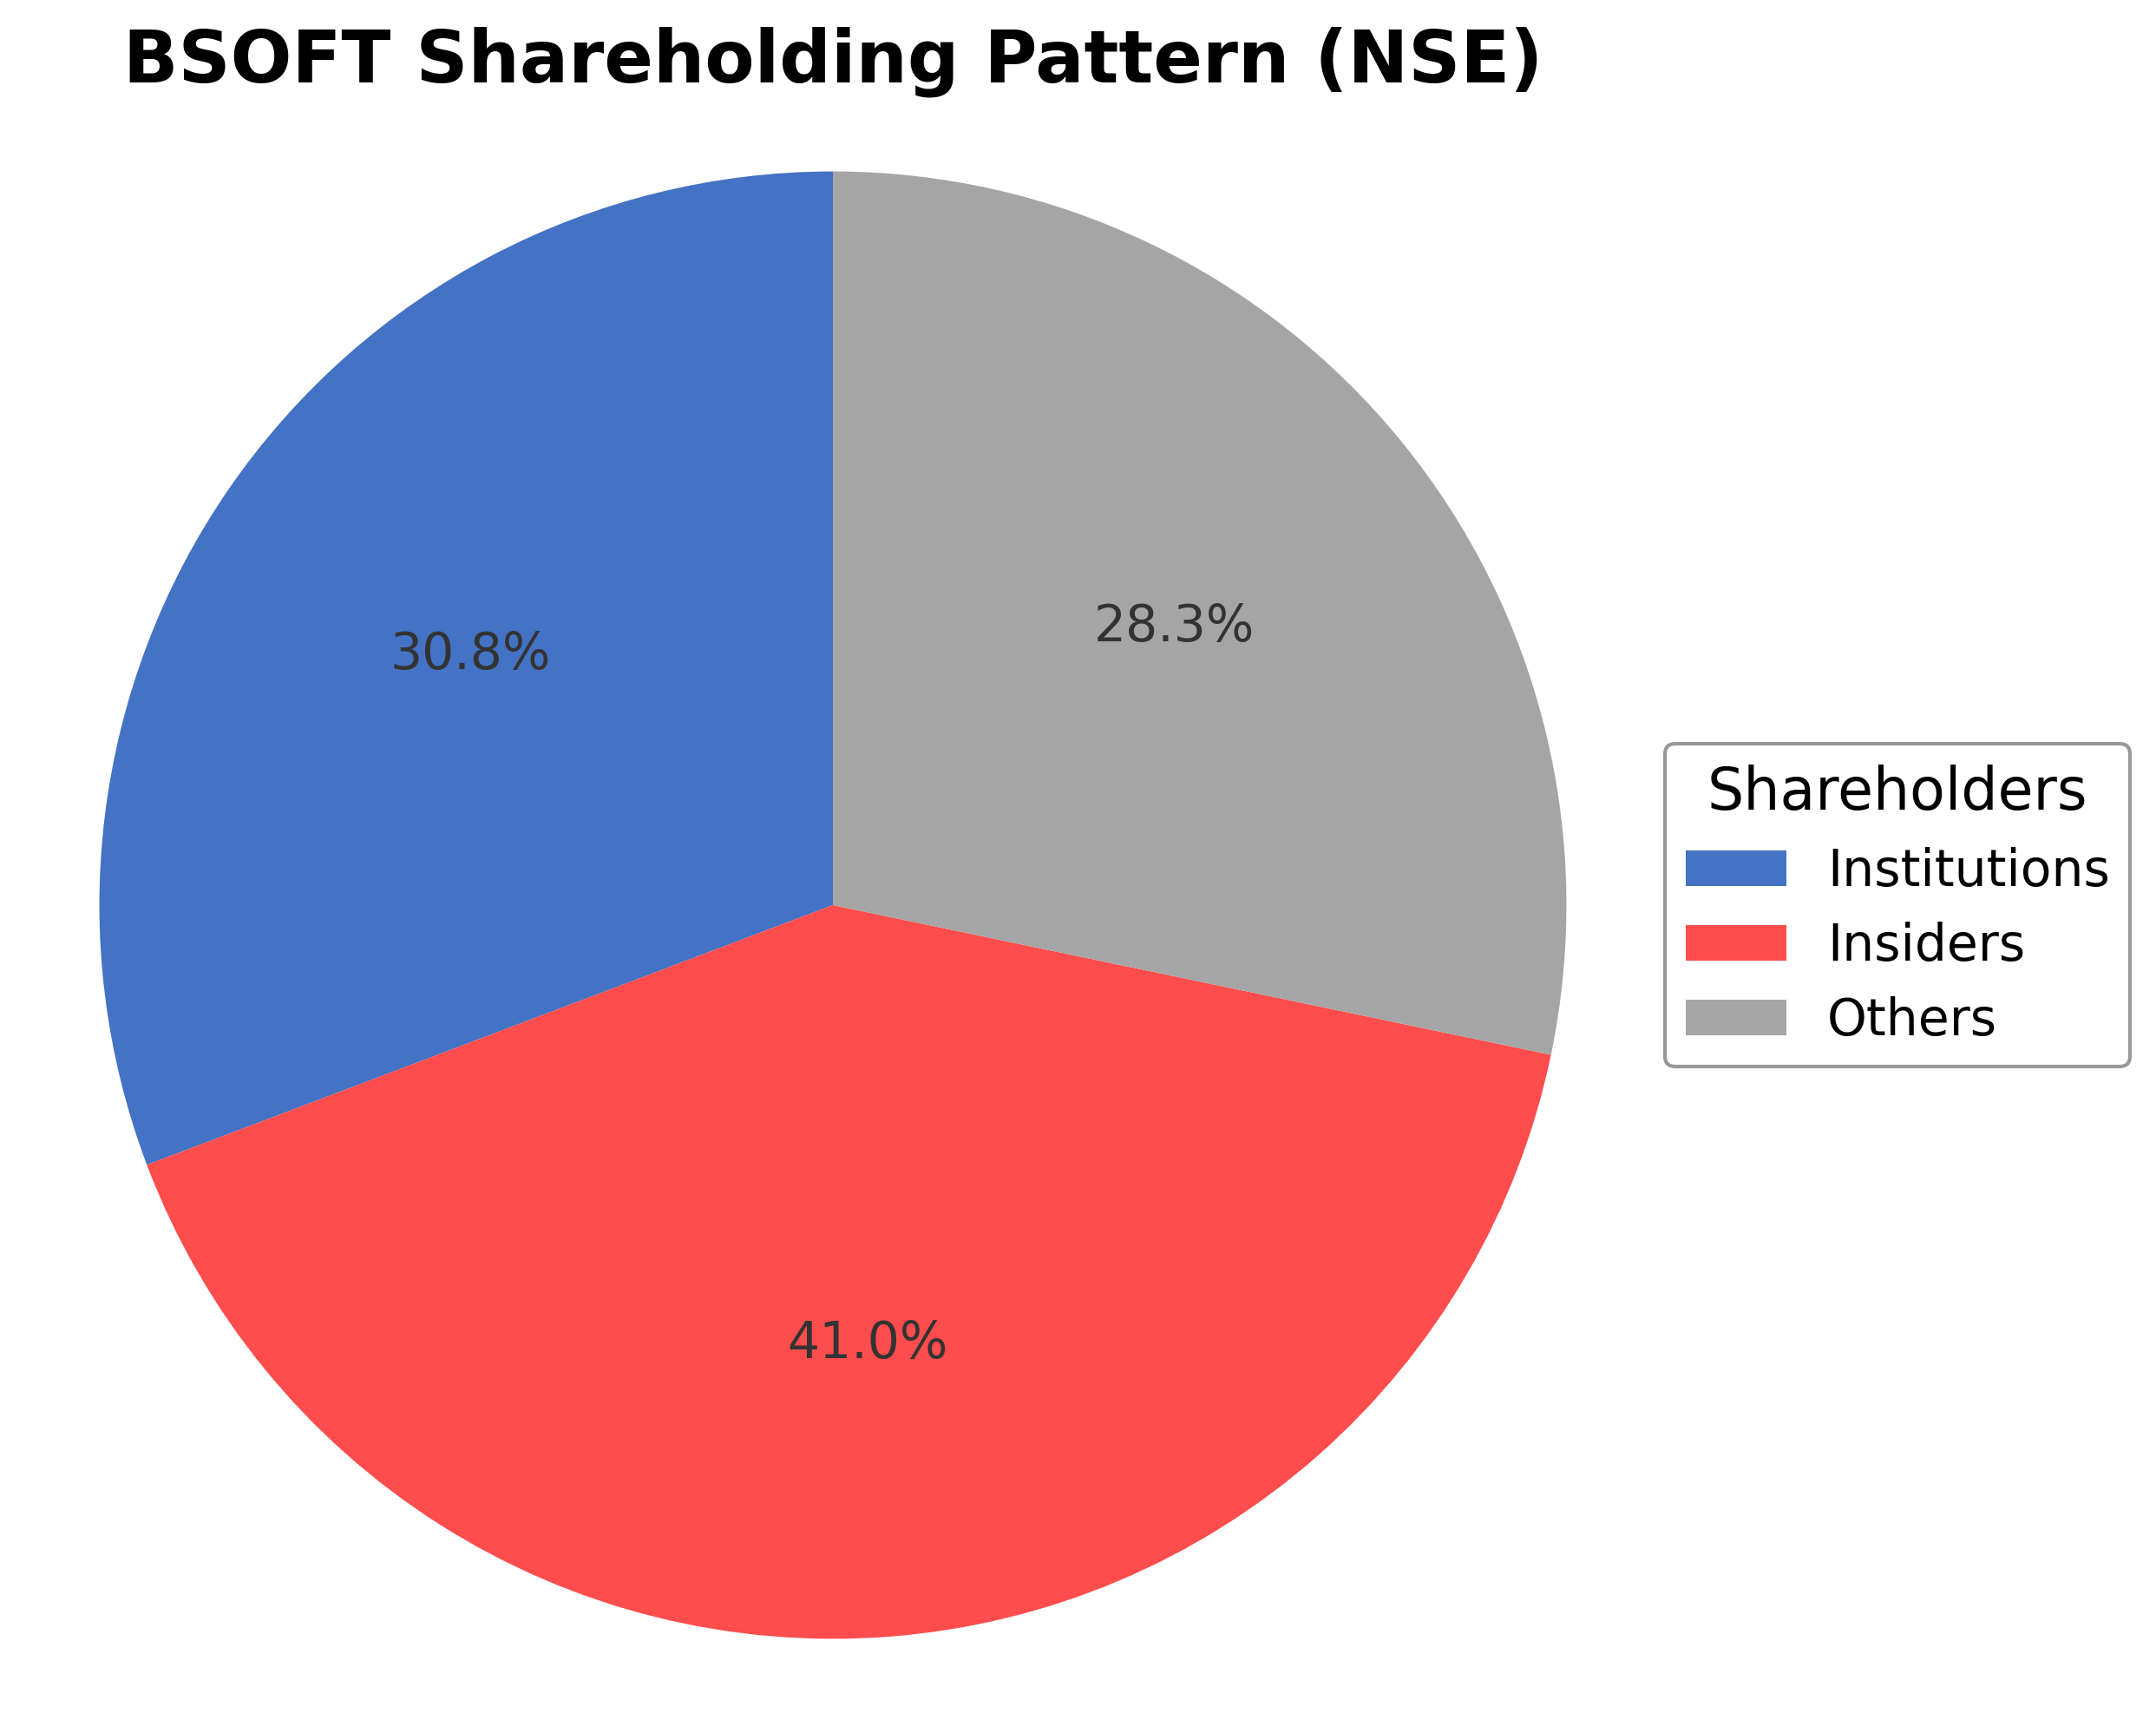
Birlasoft Ltd.'s ownership structure comprises approximately 40.97% held by insiders including executives and board members, 30.76% by institutional investors such as mutual funds and pension funds, and the remaining 28.27% by public shareholders including retail investors and employee stock plans. Over the past 12-24 months, institutional holdings have shown moderate accumulation, reflecting confidence from major funds. Promoters maintain a significant stake with no encumbrance on shares as confirmed in FY26, supporting governance stability. The shareholding pattern indicates balanced market sentiment with strong insider commitment and institutional interest, which may influence strategic decisions and corporate governance going forward.
Sector and Industry Analysis
The global information technology sector continues to expand, driven by increasing digital transformation initiatives across industries. Market size has grown substantially, with cloud computing, AI, and enterprise software services leading the growth trajectory. Key players include established IT service providers such as TCS, Infosys, Wipro, and mid-sized firms like Birlasoft, which have carved niches in specialized digital services.
Industry trends highlight a shift towards cloud adoption, AI integration, and automation, with companies investing heavily in emerging technologies like Generative AI. Competitive dynamics are intense, with barriers to entry including technological expertise, client relationships, and scale of operations. Firms like Birlasoft focus on sectors such as BFSI and Life Sciences, navigating challenges like project ramp-ups and sector-specific demand fluctuations to maintain market positioning.
The regulatory environment for IT services is shaped by data privacy laws, cross-border data flow restrictions, and cybersecurity mandates, impacting service delivery models. Compliance with frameworks such as GDPR and evolving local data protection regulations requires continuous adaptation. The outlook remains cautiously optimistic as companies balance regulatory compliance with innovation to sustain growth amid macroeconomic uncertainties.
Note: Analysis synthesized from industry research, market reports, and regulatory filings. Information is subject to change based on market conditions.
Financial Ratios Dashboard
Illustrative Scenario Analysis
DCF Assumptions:
Method: Two-Stage EPS-Priority Model
Financials
Peer Analysis
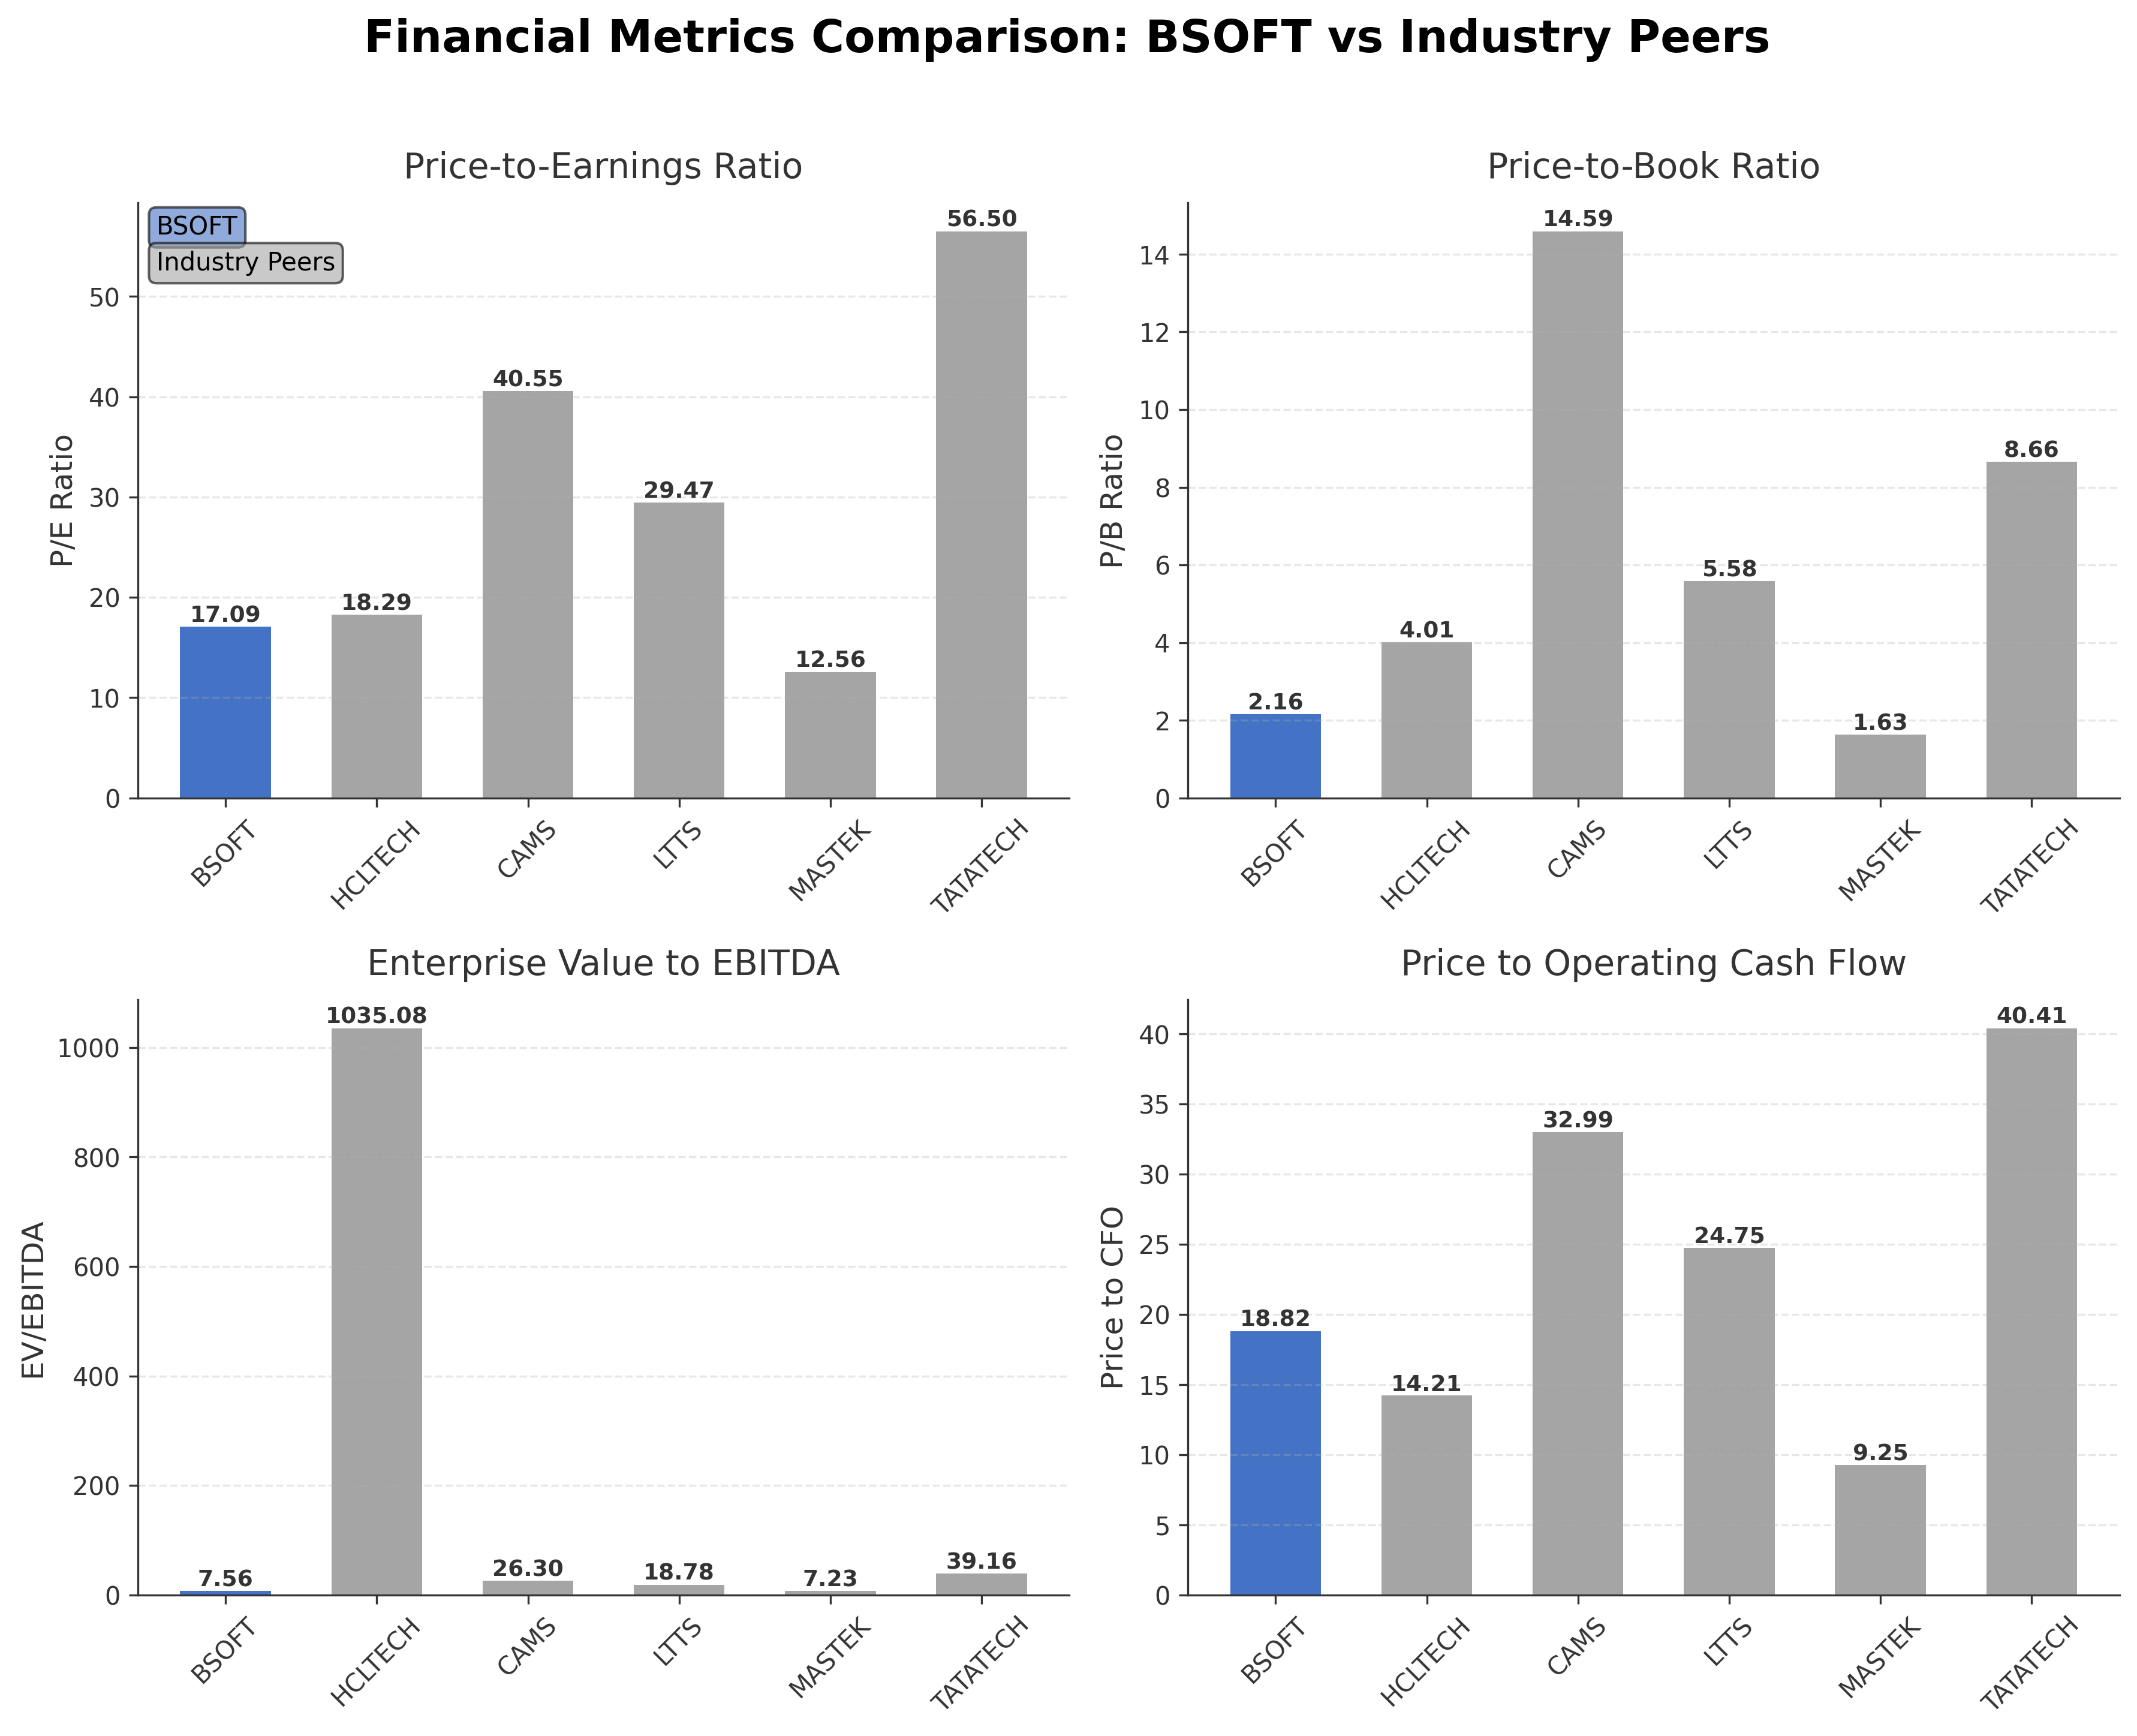
| Company Name | Market Cap | P/E Ratio | P/B Ratio | EV/EBITDA | Price to CFO |
|---|---|---|---|---|---|
| Birlasoft Ltd. | ₹90.53B | 17.09 | 2.16 | 7.56 | 18.82 |
| HCL Technologies Limited | ₹3.03T | 18.29 | 4.01 | 1035.08 | 14.21 |
| Computer Age Management Services Ltd. | ₹192.77B | 40.55 | 14.59 | 26.30 | 32.99 |
| L&T Technology Services Ltd. | ₹360.13B | 29.47 | 5.58 | 18.78 | 24.75 |
| Mastek Ltd. | ₹50.13B | 12.56 | 1.63 | 7.23 | 9.25 |
| Tata Technologies Ltd. | ₹313.43B | 56.50 | 8.66 | 39.16 | 40.41 |
Comparison Analysis: Birlasoft Ltd. trades at a lower P/E ratio of 17.09 compared to many peers such as CAMS (40.55) and Tata Technologies (56.50), indicating a more moderate valuation relative to earnings. Its P/B ratio of 2.16 is also below several peers, suggesting a more conservative book value pricing. The EV/EBITDA multiple of 7.56 is among the lowest in the peer group, reflecting potentially attractive enterprise valuation. Return on equity at 13.66% is moderate, lower than leaders like CAMS (38.69%) and HCL Technologies (23.36%), but comparable to Mastek and Tata Technologies. Overall, Birlasoft presents a balanced profile with reasonable valuation metrics and moderate profitability relative to its regional IT services peers.
Financial Metrics Comparison with Peers
Financial Statements
Comprehensive financial data including income, balance sheet, and cash flow metrics
Income Statement
| fiscal_date | 2026-03-31 | 2025-03-31 | 2024-03-31 | 2023-03-31 | 2022-03-31 |
|---|---|---|---|---|---|
| Sales | 53.10B | 53.75B | 52.78B | 47.95B | 41.30B |
| Cost Of Goods | 32.01B | 33.40B | 29.49B | 27.61B | 23.49B |
| Gross Profit | 21.09B | 20.35B | 23.29B | 20.33B | 17.81B |
| Operating Expense Other Operating Expenses | 12.42B | 13.38B | 10.26B | 12.24B | 9.94B |
| Operating Income | 7.86B | 6.12B | 9.24B | 4.75B | 5.64B |
| Non Operating Interest Expense | 196.02M | 234.38M | 199.42M | 185.89M | 130.16M |
| Pretax Income | 7.90B | 6.97B | 8.35B | 4.42B | 6.17B |
| Income Tax | 2.72B | 1.80B | 2.11B | 1.11B | 1.53B |
| Net Income | 5.18B | 5.17B | 6.24B | 3.32B | 4.64B |
| Eps Basic | 18.54 | 18.64 | 22.54 | 11.96 | 16.63 |
| Eps Diluted | 18.50 | 18.48 | 22.25 | 11.92 | 16.43 |
| Basic Shares Outstanding | 279.59M | 277.23M | 276.73M | 277.13M | 278.84M |
| Diluted Shares Outstanding | 279.59M | 277.23M | 276.73M | 277.13M | 278.84M |
| Ebit | 8.10B | 7.20B | 8.55B | 4.61B | 6.30B |
| Ebitda | 8.98B | 7.75B | 10.86B | 5.69B | 7.01B |
| Net Income Continuous Operations | 7.90B | 6.97B | 8.35B | 4.42B | 4.64B |
| Preferred Stock Dividends | 0.00 | 0.00 | 0.00 | 0.00 | 0.00 |
| Operating Expense Selling General And Administrative | N/A | 1.11B | 1.44B | 1.43B | 813.61M |
| Non Operating Interest Income | N/A | 696.03M | 504.12M | 188.67M | 322.39M |
| Minority Interests | N/A | N/A | N/A | N/A | N/A |
Data provided by Twelve Data
Balance Sheet
| fiscal_date | 2026-03-31 | 2025-03-31 | 2024-03-31 | 2023-03-31 | 2022-03-31 |
|---|---|---|---|---|---|
| Cash And Cash Equivalents | 4.26B | 3.27B | 3.93B | 4.67B | 2.91B |
| Accounts Receivable | 12.13B | 7.91B | 7.68B | 7.32B | 6.81B |
| Total Assets | 52.66B | 44.62B | 39.26B | 31.87B | 33.83B |
| Total Liabilities | 11.53B | 9.84B | 8.82B | 7.39B | 8.00B |
| Long Term Debt | 1.11B | 1.12B | 577.63M | 662.12M | 911.58M |
| Shareholders Equity | 41.13B | 34.78B | 30.44B | 24.48B | 25.83B |
Data provided by Twelve Data
Cash Flow Statement
| fiscal_date | 2026-03-31 | 2025-03-31 | 2024-03-31 | 2023-03-31 | 2022-03-31 |
|---|---|---|---|---|---|
| Operating Activities Net Income | 7.90B | 6.97B | 8.35B | 4.42B | 4.64B |
| Operating Activities Stock Based Compensation | 163.21M | 514.06M | 617.93M | 288.75M | 132.06M |
| Operating Activities Other Non Cash Items | -592.91M | -503.82M | -304.70M | -2.78M | -192.23M |
| Operating Activities Accounts Receivable | -2.01B | -172.84M | -1.68B | -2.44B | -2.17B |
| Operating Activities Other Assets Liabilities | 907.82M | 666.32M | 423.77M | 1.42B | -1.15B |
| Operating Activities Operating Cash Flow | 6.37B | 7.47B | 7.40B | 3.69B | 1.26B |
| Investing Activities Capital Expenditures | -399.86M | -466.07M | -191.49M | -565.39M | -617.44M |
| Investing Activities Purchase Of Investments | -52.32B | -53.94B | -66.43B | -40.31B | -21.19B |
| Investing Activities Sale Of Investments | 50.77B | 49.56B | 59.96B | 43.16B | 18.41B |
| Investing Activities Investing Cash Flow | -1.95B | -4.84B | -6.66B | 2.28B | -3.39B |
| Financing Activities Long Term Debt Issuance | 0.00 | 140.34M | N/A | N/A | N/A |
| Financing Activities Long Term Debt Payments | -30.45M | -29.35M | N/A | N/A | N/A |
| Financing Activities Common Stock Issuance | 58.62M | 105.66M | 98.54M | 129.17M | 78.96M |
| Financing Activities Common Dividends | -1.81B | -1.80B | -1.24B | -1.25B | -1.11B |
| Financing Activities Financing Cash Flow | -1.78B | -1.58B | -1.14B | -5.81B | -1.03B |
| End Cash Position | 4.26B | 3.27B | 3.93B | 4.67B | 2.91B |
| Free Cash Flow | 4.37B | 5.39B | 6.92B | 5.03B | 2.17B |
| Financing Activities Common Stock Repurchase | N/A | N/A | 0.00 | -3.90B | 0.00 |
| Financing Activities Other Financing Charges | N/A | N/A | N/A | -788.95M | N/A |
| Financing Activities Short Term Debt Issuance | N/A | N/A | N/A | N/A | N/A |
Data provided by Twelve Data
Technical Analysis
Key Insights
- The current trend shows mixed price action with the stock trading near its 50-day moving average at ₹348.68 and below the 200-day moving average of ₹380.59, indicating a neutral to slightly bearish trend.
- Key support levels are identified near the 52-week low of ₹306.4, while resistance is observed around the 52-week high of ₹474 and the 200-day moving average at ₹380.59.
- The stock is currently trading below the 200-day moving average but close to the 50-day moving average, suggesting consolidation within a defined range.
- Momentum indicators such as RSI and MACD show fluctuating signals with RSI near neutral levels, indicating neither overbought nor oversold conditions.
- Multi-timeframe analysis reveals that daily and weekly charts show consolidation, while monthly charts suggest longer-term sideways movement.
- Potential market scenarios include a breakout above resistance levels for bullish momentum or a decline towards support levels if bearish pressure intensifies.
Trending News
Summary: Birlasoft Limited informed that the Board of Directors, at its meeting held on June 19, 2026, designated Mr. Ankur Vaish, Chief Strategy Officer, as a Senior Management Personnel of the Company,...
Sentiment: neutral
2. Headline: Birlasoft designates Ankur Vaish as SMP, allots ESOP shares
Summary: Birlasoft Limited designated Ankur Vaish as Senior Management Personnel and approved the allotment of 93,301 equity shares to employees under its ESOP plans. The board meeting held on June 19, 2026, also confirmed an increase in paid-up capital to ₹55,91,99,178.
Sentiment: positive
3. Headline: Birlasoft Appoints Chief Strategy Officer, Allots ESOP Shares | Whalesbook Corporate News
Summary: Birlasoft Ltd appoints Ankur Vaish as Chief Strategy Officer, bolstering its growth strategy. Also allotted 93,301 ESOP shares.
Sentiment: neutral
Summary: Recognition highlights Birlasoft's AI-first infrastructure capabilities and platform-led approach to enabling intelligent, scalable, and resilient enterprise
Sentiment: positive
5. Headline: Birlasoft Ltd Upgraded to Hold by MarketsMOJO Amid Mixed Financial and Technical Signals
Summary: Over the past week, the stock declined ... horizons, the stock’s five-year return of -19.19% contrasts sharply with Sensex’s 44.51% gain, though the ten-year return of 81.40% remains positive, albeit well below the benchmark’s 185.35%. Birlasoft Ltd or something ...
Sentiment: negative
Powered by Brave
Recent Updates
News Summary
As of June 19, 2026. Birlasoft Limited has strengthened its leadership by designating Ankur Vaish as Senior Management Personnel and allotting 93,301 equity shares under its ESOP plans, reflecting a strategic focus on leadership and employee incentives. The board meeting also confirmed an increase in paid-up capital to ₹55,91,99,178. Additionally, the promoters have confirmed that their shares remain free of any encumbrance for FY26, which supports investor confidence in the company's governance and financial stability. These developments underscore Birlasoft's commitment to governance transparency and strategic growth initiatives.
News Sentiment
The overall sentiment from recent updates is positive, driven by leadership appointments and employee share allotments that signal organizational strengthening. Confirmation of promoter shares being unencumbered further enhances confidence in governance practices. While the news does not directly address financial performance, these corporate actions contribute to a constructive outlook on the company's operational stability and strategic direction.
Source List
- https://scanx.trade/stock-market-news/companies/birlasoft-designates-ankur-vaish-as-smp-approves-esop-allotment/43414921
- https://scanx.trade/stock-market-news/companies/birlasoft-promoters-confirm-no-encumbrance-on-shares-in-fy26/43108514
Analytical Overview
Analysis Summary
Birlasoft’s valuation metrics show a trailing P/E of 17.09 and a forward P/E of 12.96, which are below or near the industry average P/E of 17.09, indicating the stock is reasonably valued relative to its peers. The PEG ratio of 0.35 suggests undervaluation relative to earnings growth potential. Revenue growth is modest at 2.4% quarterly, but earnings growth is strong at 44.1% year-over-year, supported by positive cash flow trends with operating cash flow of INR 4.81 billion and free cash flow of INR 4.72 billion. The company maintains a strong financial position with low debt (debt-to-equity ratio of 0.034) and a high current ratio of 4.29, reflecting liquidity strength. Sector-specific challenges include competitive pressures and regulatory compliance, while opportunities arise from digital transformation demand and AI-driven innovation. Considering India-specific factors, Birlasoft benefits from a favorable regulatory environment and growing IT outsourcing demand.
Overall Business and Market Assessment
Supporting Factors: strong cash reserves exceeding INR 24.5 billion, low leverage with a debt-to-equity ratio of 0.034, and robust earnings growth of 44.1% year-over-year
Risk Factors: modest revenue growth of 2.4% and sector competition that could pressure margins
SWOT Analysis
Strengths
- Strong cash reserves exceeding INR 24.5 billion enhance liquidity.
- Low debt-to-equity ratio of 0.034 indicates conservative leverage.
- Robust net profit margin near 9.8% reflects operational efficiency.
- Recognition for AI-driven capabilities underscores innovation leadership.
Weaknesses
- Modest quarterly revenue growth of 2.4% limits top-line momentum.
- Return on equity at 13.7% is moderate compared to industry leaders.
- Stock price trading below 200-day moving average signals technical weakness.
- Relatively high price to cash flow ratio of 18.82 may indicate valuation concerns.
Opportunities
- Growing demand for digital transformation and cloud services in India.
- Strategic leadership appointments and ESOP plans support talent retention.
- Expanding AI-first infrastructure capabilities can drive future growth.
- Favorable regulatory environment in the Indian IT sector.
Threats
- Intense competition in the global IT services industry.
- Potential regulatory changes impacting outsourcing business models.
- Macroeconomic uncertainties affecting client IT spending.
- Volatility in stock price due to mixed technical signals.
Company Description
Birlasoft Ltd. is a renowned global information technology services provider headquartered in India. It specializes in delivering digital and technology solutions across various industries, including manufacturing, banking, healthcare, and insurance. The primary function of Birlasoft is to empower businesses through innovative IT solutions, adopting cutting-edge technologies like artificial intelligence, data analytics, and cloud services. Its offerings encompass enterprise application services, digital transformation, and IT infrastructure management, proving essential in the digital age. Birlasoft commands significant respect in the IT consulting and services sector, playing a pivotal role in technological advancement and digital integration for legacy systems. By fostering partnerships with technology titans and investing in employee expertise, Birlasoft sustains its competitive stance in the dynamic world of IT services, contributing significantly to the global IT outsourcing industry.