
BIRD (BIRD)
Stock Analysis Report
Stock Journey
Key Positives and Key Risks
Pros
- Current ratio of 2.02 indicates solid short-term liquidity supporting operational needs.
- Price-to-book ratio of 2.62 suggests moderate valuation relative to book value despite losses.
- Strategic pivot to AI infrastructure and rebranding as NewBird AI opens potential new growth markets.
Cons
- Net profit margin of -50.7% and negative operating margin reflect ongoing unprofitability.
- High debt-to-equity ratio of 110.4% raises concerns about financial leverage and risk.
- Quarterly revenue decline of 14.6% indicates challenges in maintaining top-line growth.
Disclosure: This information is for general awareness and does not constitute investment advice
Report Summary
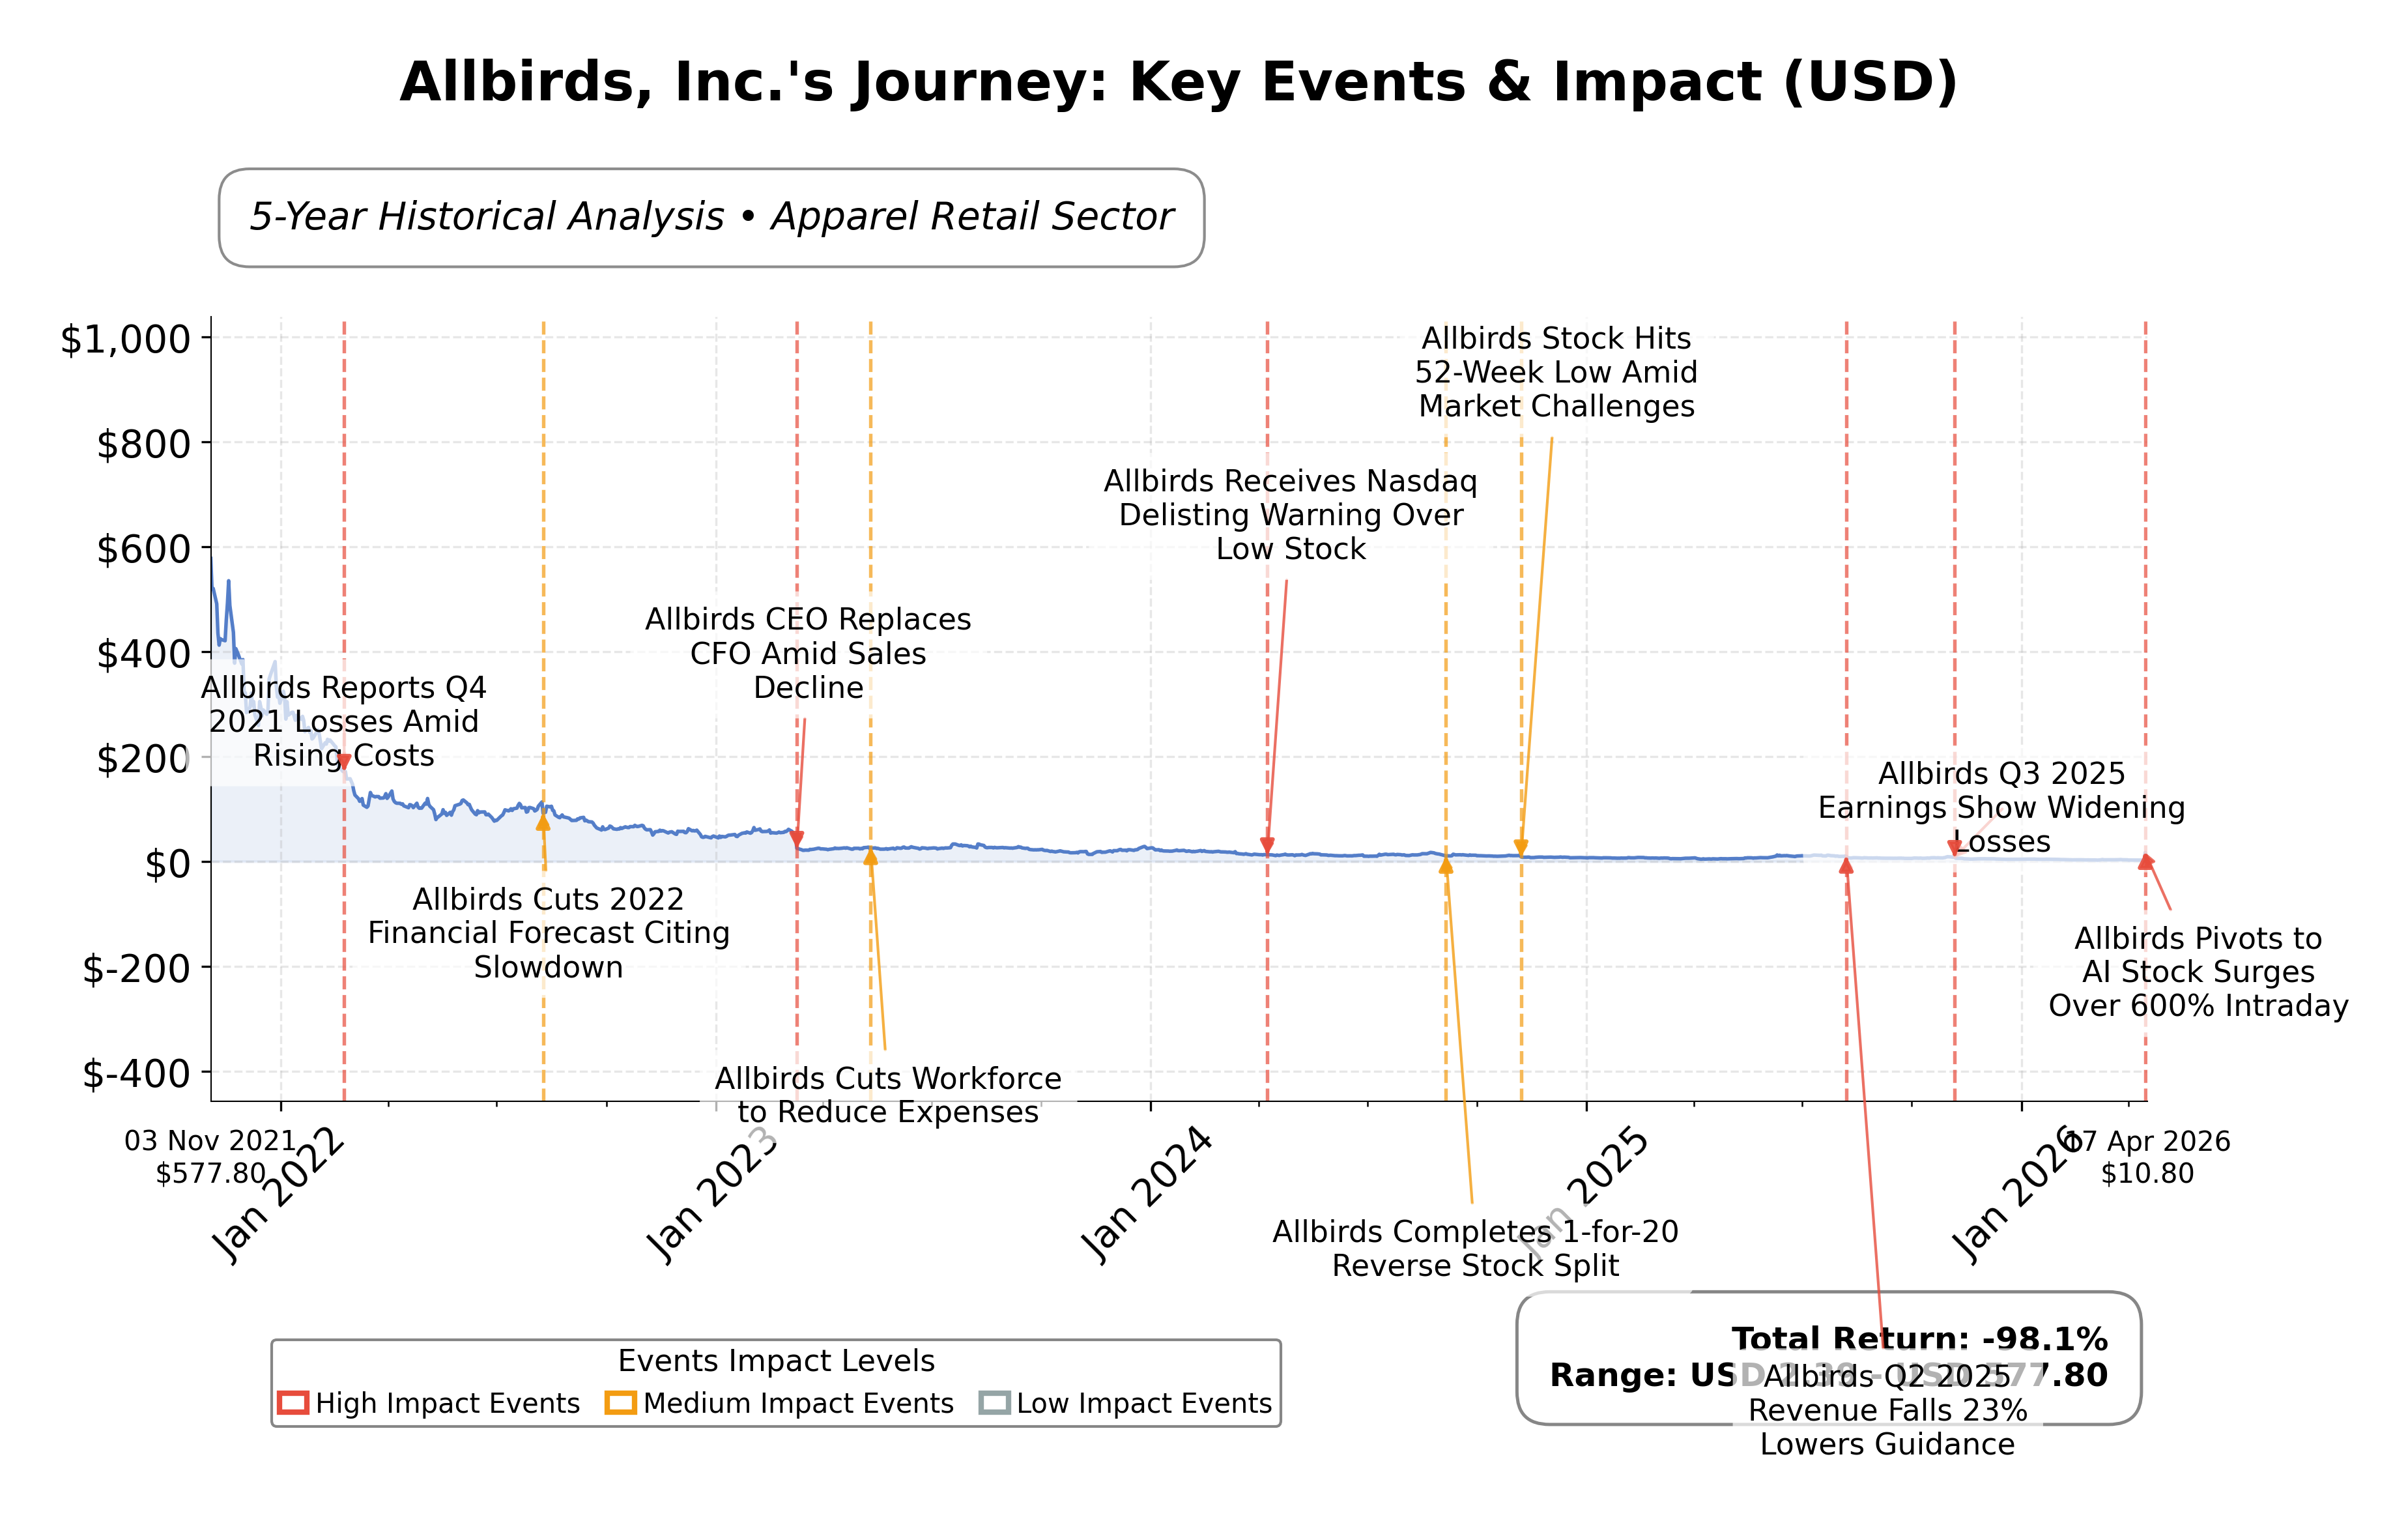
Allbirds, Inc. is a consumer cyclical company listed on the NASDAQ exchange under the ticker BIRD. The company operates in the apparel retail industry, specializing in sustainable footwear and apparel products made from naturally derived materials. Founded in 2015 and headquartered in San Francisco, California, Allbirds has positioned itself as a global lifestyle brand focused on eco-conscious consumers, distributing products through retail stores, third-party retailers, and digital platforms. Recently, the company announced a strategic pivot from its traditional sneaker business toward AI infrastructure, signaling a significant shift in its business model.
Financially, Allbirds reported trailing twelve months (TTM) revenue of approximately $152.5 million, with a gross margin of 37.2%. However, the company is currently unprofitable, posting a net loss margin of -50.7% and an operating margin of -34.9%. Return on equity (ROE) and return on assets (ROA) are negative at -112.3% and -31.5%, respectively, reflecting ongoing challenges in profitability and asset utilization. The company’s operating cash flow and free cash flow remain negative at -$55.1 million and -$25.8 million TTM, respectively, indicating cash burn despite a current ratio of 2.02, which suggests adequate short-term liquidity.
From a valuation standpoint, Allbirds trades at a market capitalization of approximately $94 million with an enterprise value of about $107 million. The stock’s trailing and forward price-to-earnings (P/E) ratios are negative, at -1.16 and -1.56 respectively, consistent with its unprofitable status. The price-to-book (P/B) ratio stands at 2.62, while the enterprise value to EBITDA (EV/EBITDA) is -1.59, indicating valuation metrics are not meaningful due to losses. The stock price currently sits at $10.95, within a 52-week range of $2.15 to $24.31, reflecting significant volatility and recent price appreciation.
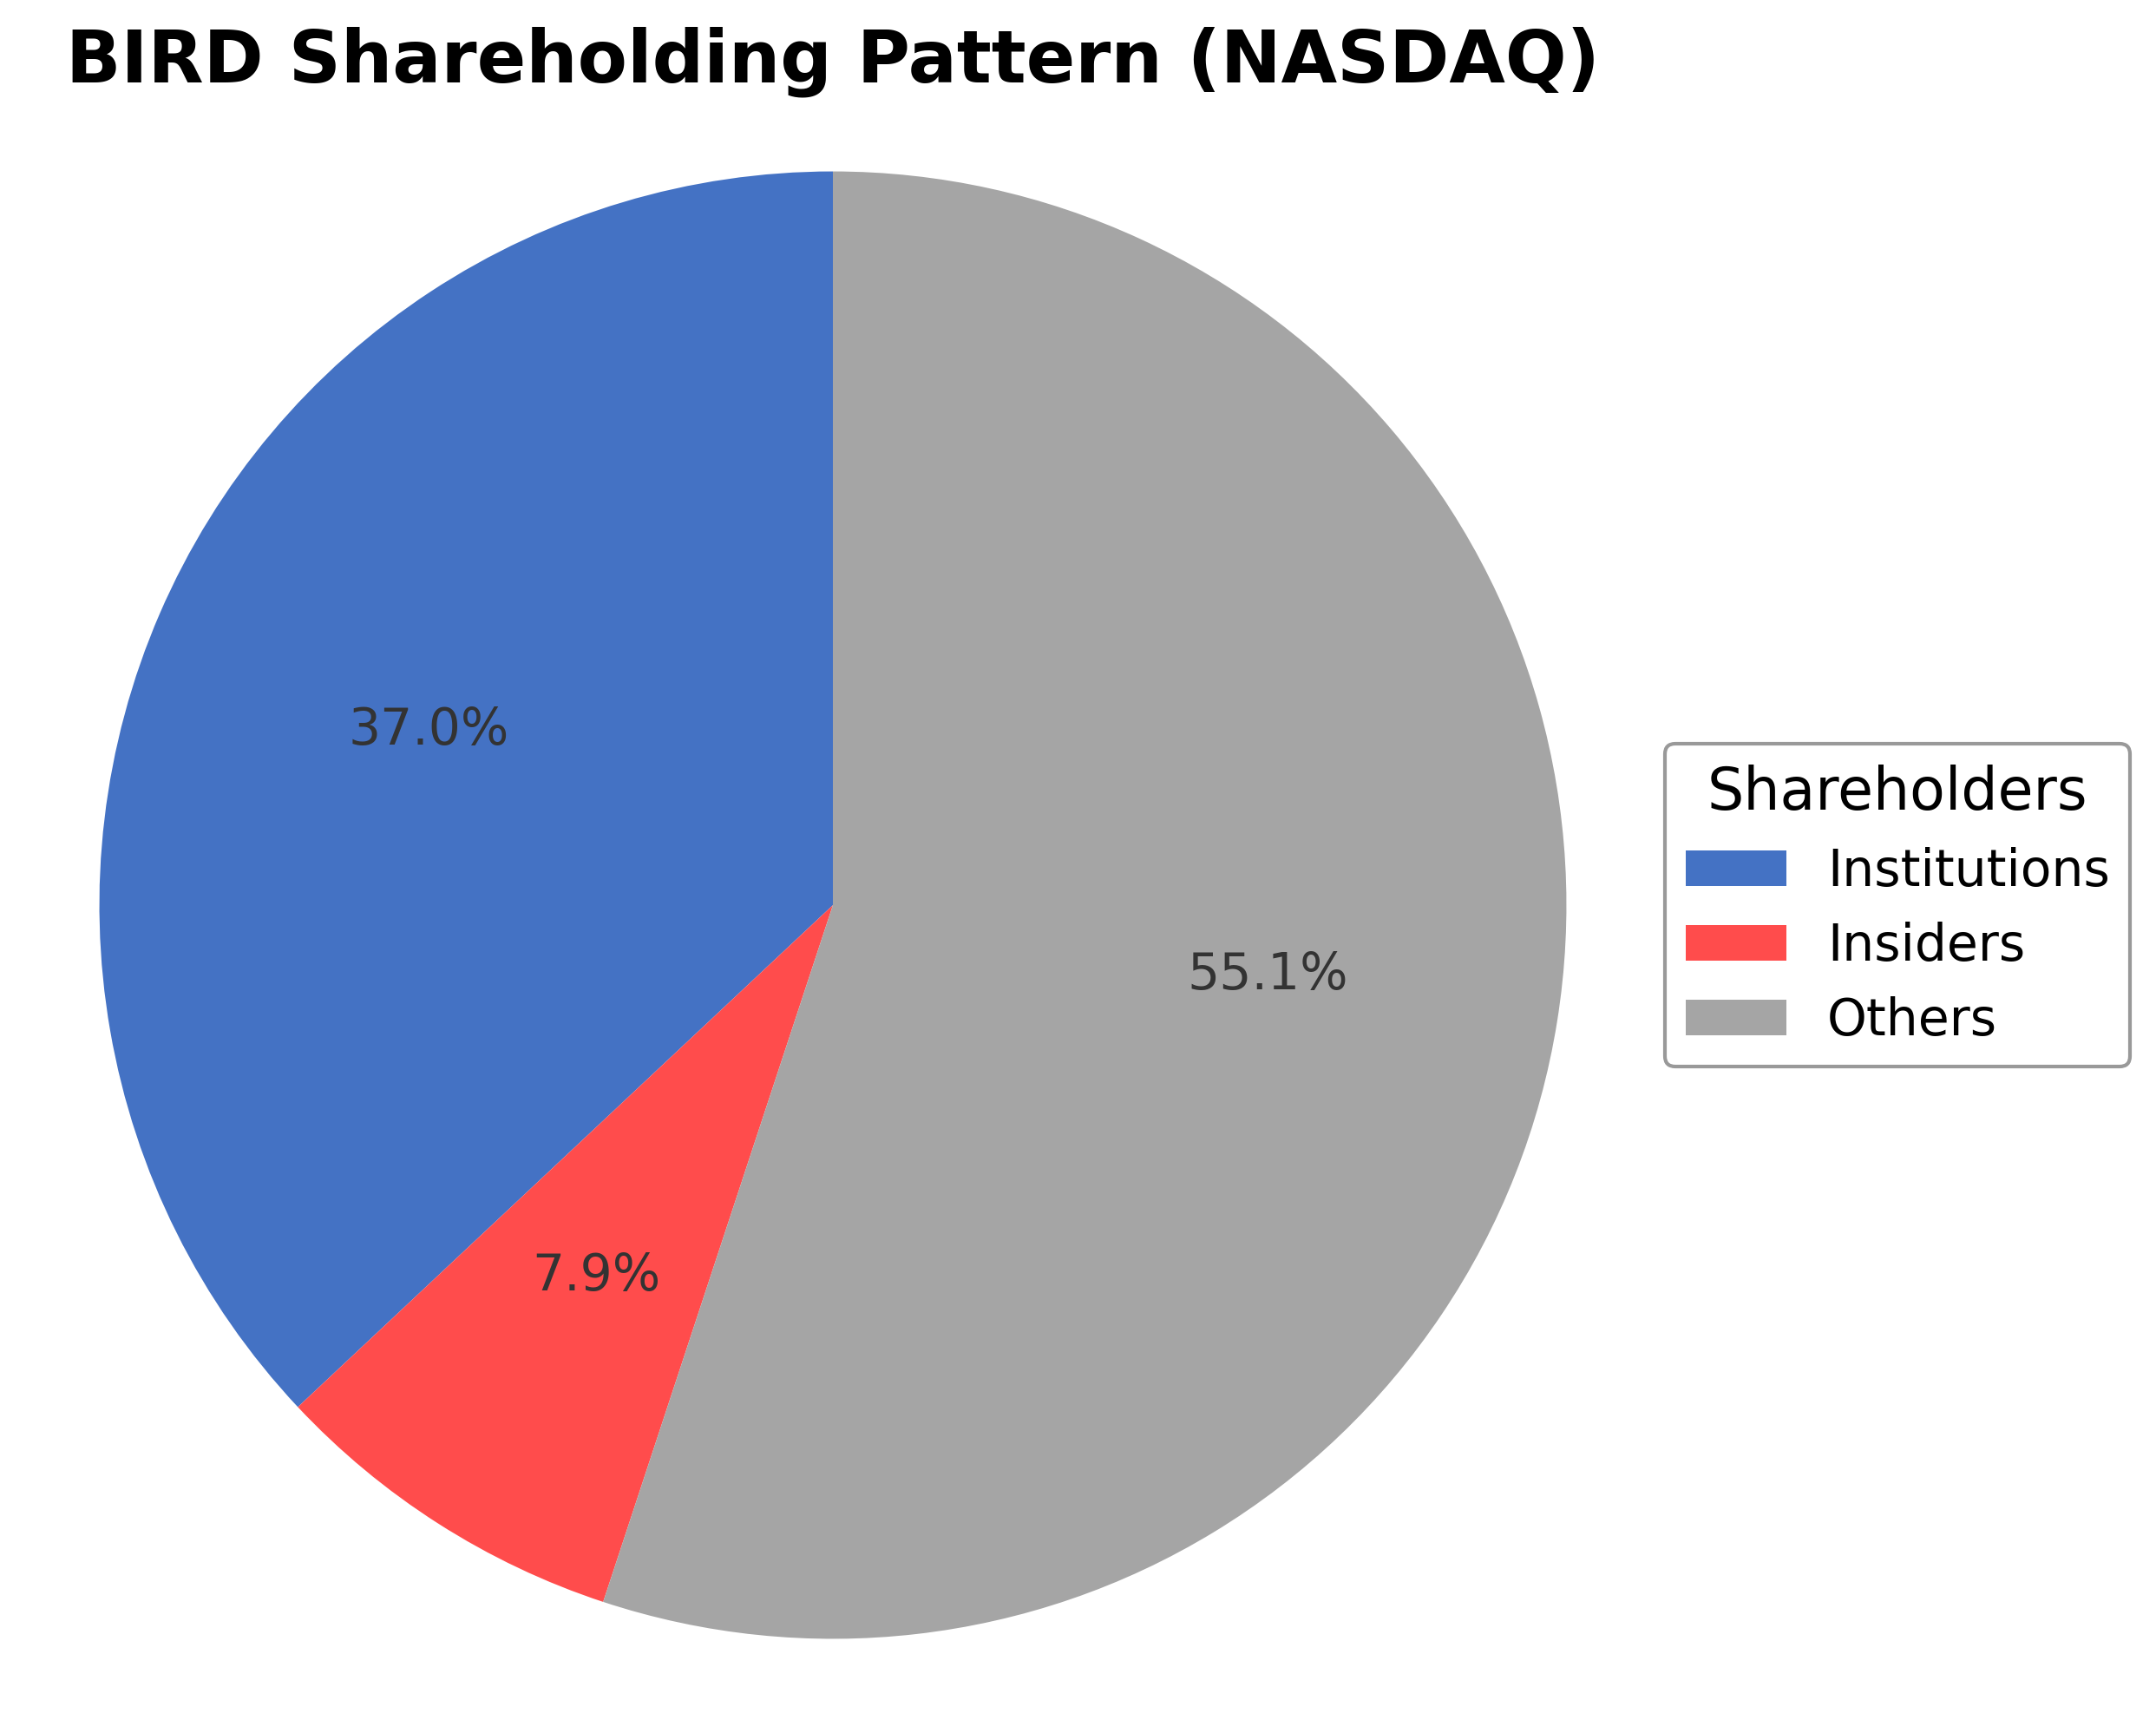
Allbirds’ key strengths include a strong brand presence in sustainable apparel and footwear, a current ratio above 2 indicating solid liquidity, and a recent strategic pivot that has garnered significant market attention. Risks include continued negative profitability, high debt-to-equity ratio of 110.4%, and uncertainty surrounding the new AI infrastructure business model. The company recently rebranded as NewBird AI and entered into a $39 million asset sale deal, marking a major strategic transformation. Institutional ownership is moderate at approximately 37%, with insider holdings below 8%.
Technically, the stock has experienced a sharp rally driven by news of the AI pivot, with price action moving well above the 50-day moving average but still below the 200-day moving average. Momentum indicators show elevated readings consistent with recent volatility. The current market environment suggests heightened investor interest but also increased risk of price corrections. Overall, the data indicates a dynamic situation warranting close observation as the company navigates its transition.
Company and Industry Overview
Company Basics
Price Performance
Company Size
Shareholding Pattern
Sector and Industry Analysis
The technology sector, particularly the software application industry, encompasses companies developing cloud-based platforms and digital tools, serving global markets including Europe and North America. This sector has experienced moderate growth, driven by increasing demand for digital transformation and cloud computing solutions. Major players include established software firms and emerging cloud service providers, with market capitalization varying widely from small-cap to large-cap entities.
Within the software application industry, trends emphasize cloud-native development, video editing, and publishing platforms, reflecting growing content creation needs. Competitive dynamics are shaped by rapid innovation cycles, scalability challenges, and the necessity for seamless user experiences. Barriers to entry include high development costs, technological expertise, and the need for continuous product enhancement to maintain relevance against well-funded incumbents.
The regulatory environment for technology companies involves data privacy laws, intellectual property protections, and cross-border data transfer restrictions, which influence operational strategies. Compliance with frameworks such as GDPR in Europe and evolving cybersecurity standards is critical to mitigate legal risks. Ongoing regulatory scrutiny is expected to increase, impacting product design, data management, and international expansion plans within the sector.
Note: Analysis synthesized from industry research, market reports, and regulatory filings. Information is subject to change based on market conditions.
Financial Ratios Dashboard
Illustrative Scenario Analysis
DCF Assumptions:
Method: Two-Stage EPS-Priority Model
Financials
Peer Analysis
| Company Name | Market Cap | P/E Ratio | P/B Ratio | EV/EBITDA | Price to CFO |
|---|---|---|---|---|---|
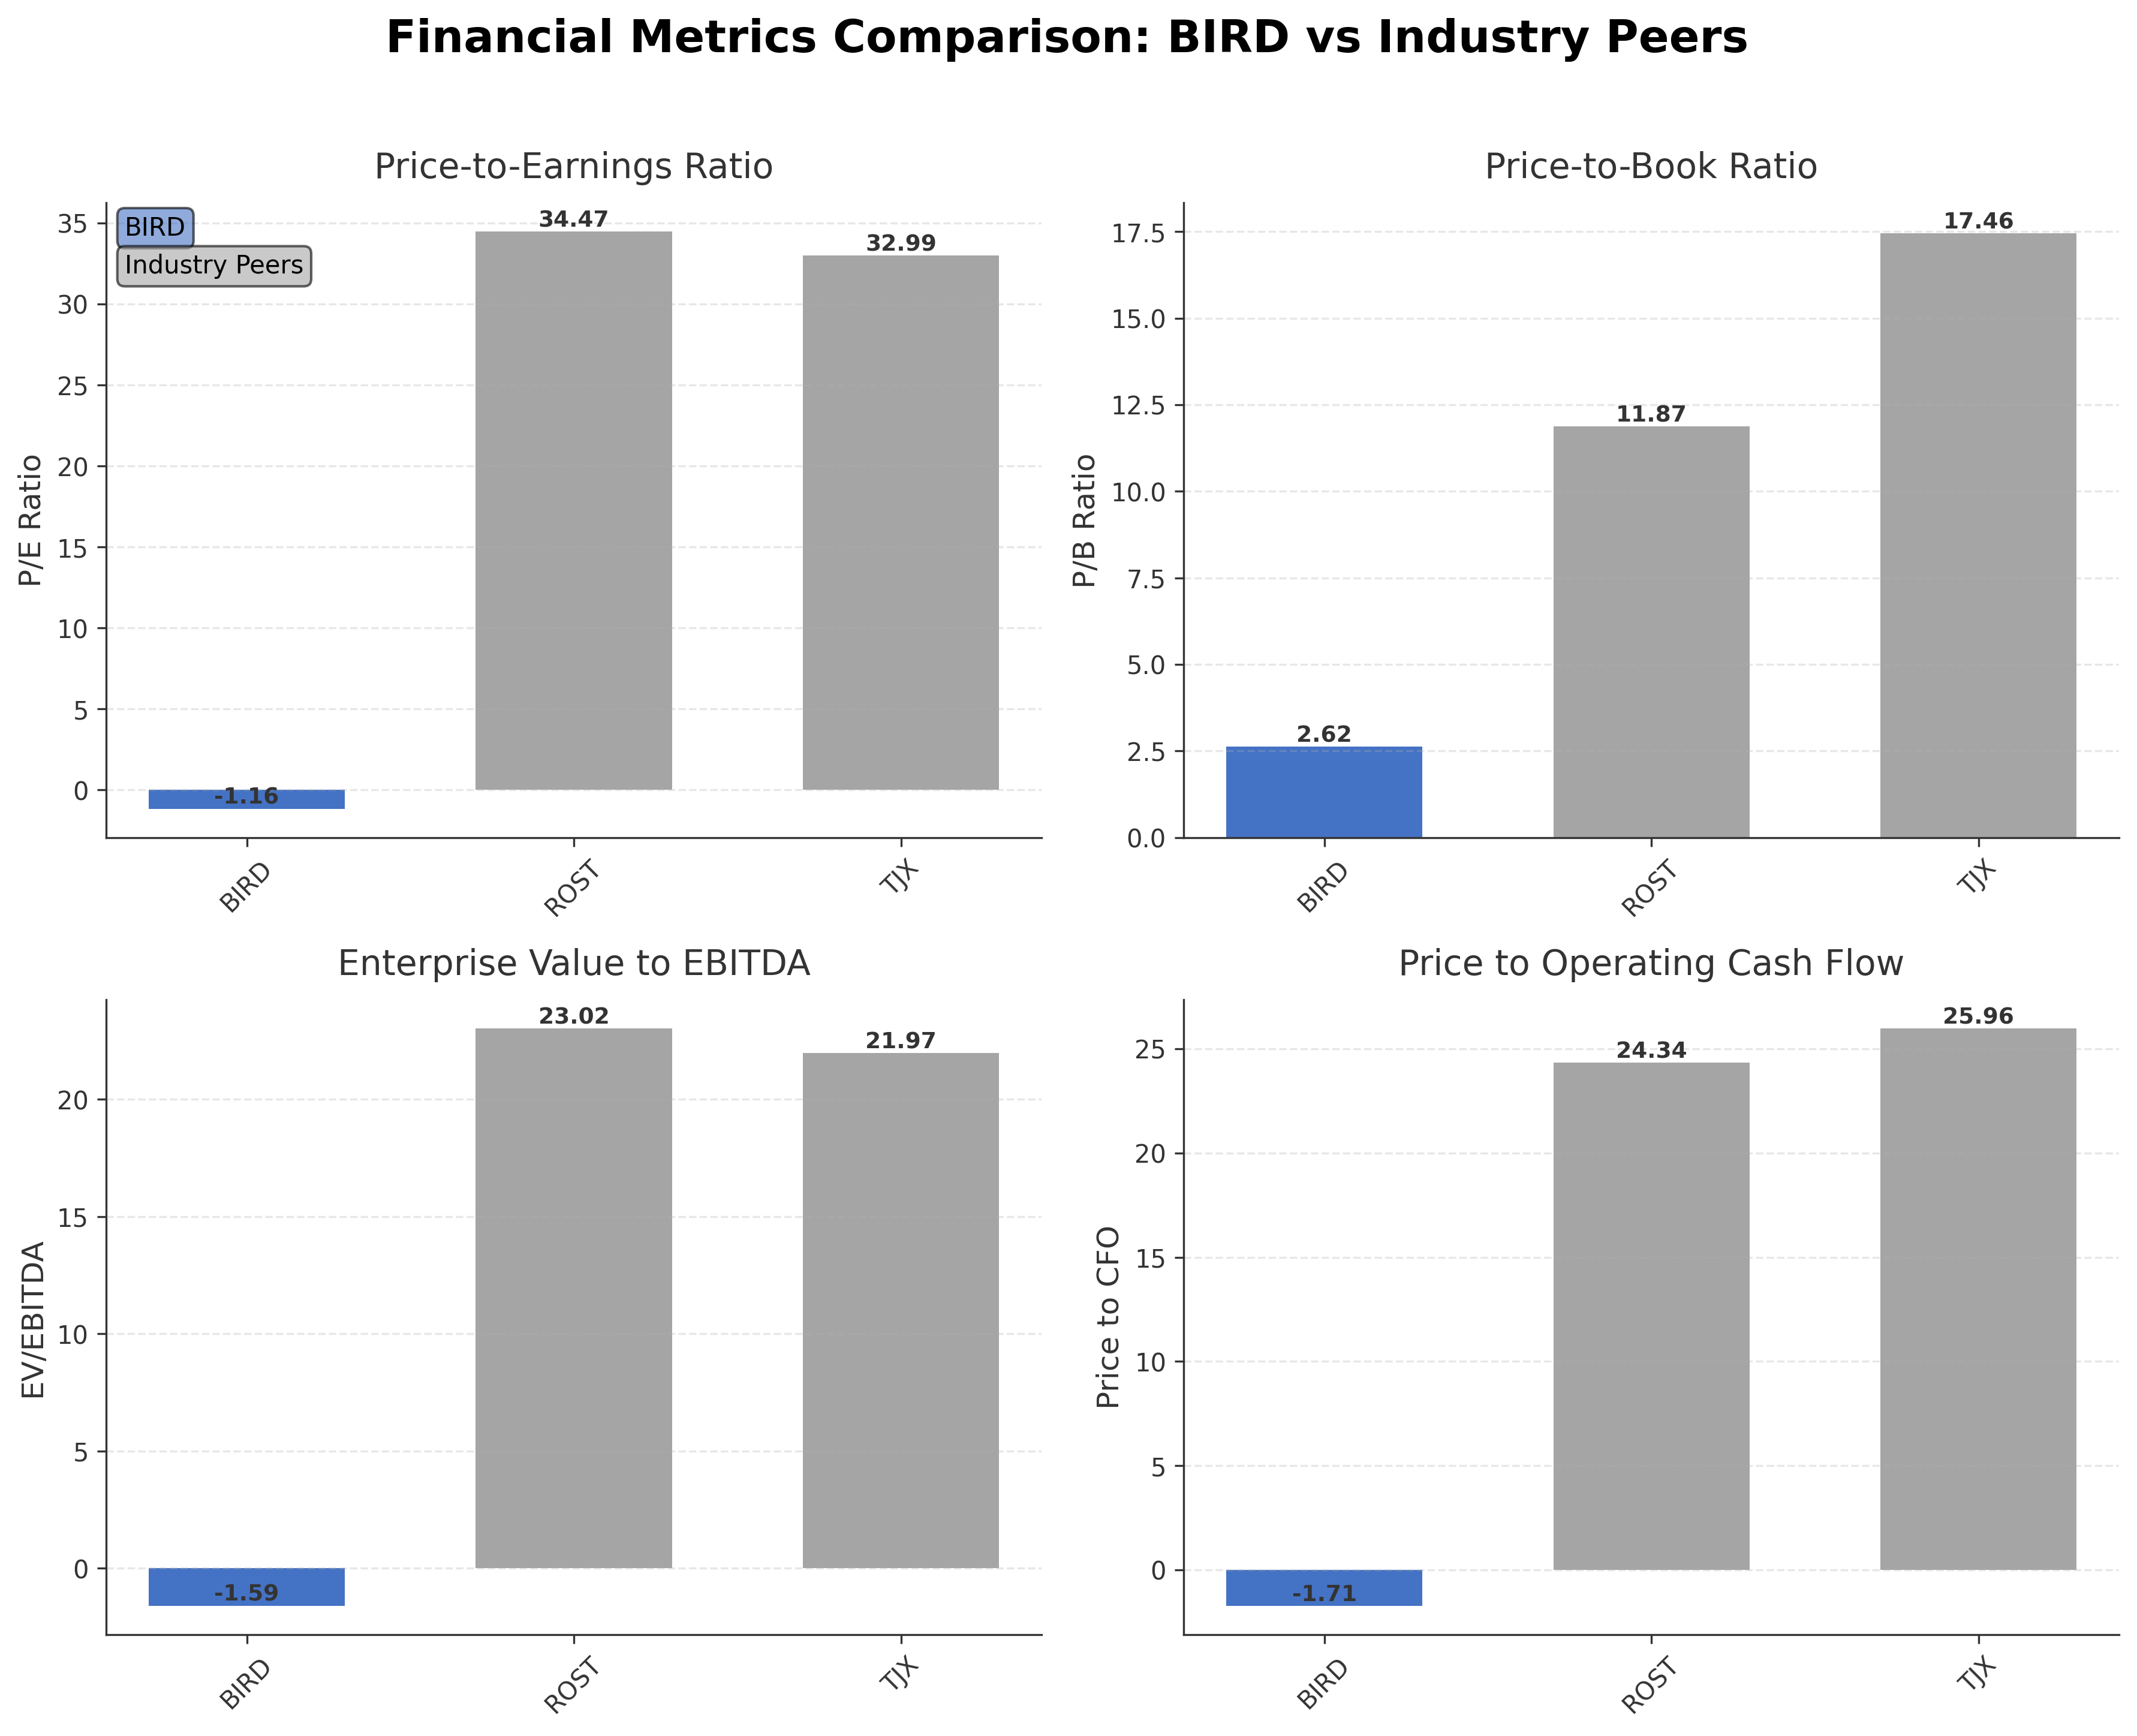
| Allbirds, Inc. | $0.09B | -1.16 | 2.62 | -1.59 | -1.71 |
| Ross Stores, Inc. | $73.69B | 34.47 | 11.87 | 23.02 | 24.34 |
| The TJX Companies, Inc. | $178.43B | 32.99 | 17.46 | 21.97 | 25.96 |
Comparison Analysis: Allbirds, Inc. currently trades at a significantly lower market capitalization of approximately $94 million compared to its industry peers Ross Stores and The TJX Companies, which have market caps of $73.69 billion and $178.43 billion respectively. Allbirds exhibits negative profitability metrics with a trailing P/E of -1.16 and negative EV/EBITDA, while its peers maintain positive P/E ratios above 30 and EV/EBITDA around 22-23, reflecting stronger earnings and operational efficiency. The company’s price-to-book ratio of 2.62 is notably lower than peers’ ratios exceeding 11, indicating a different valuation profile likely due to its unprofitable status and ongoing business transition. Return on equity for Allbirds is negative at -1.12%, contrasting with modest positive returns for peers. Overall, Allbirds stands out as an early-stage or turnaround entity within the apparel retail sector, distinct from more established and profitable competitors.
Financial Metrics Comparison with Peers
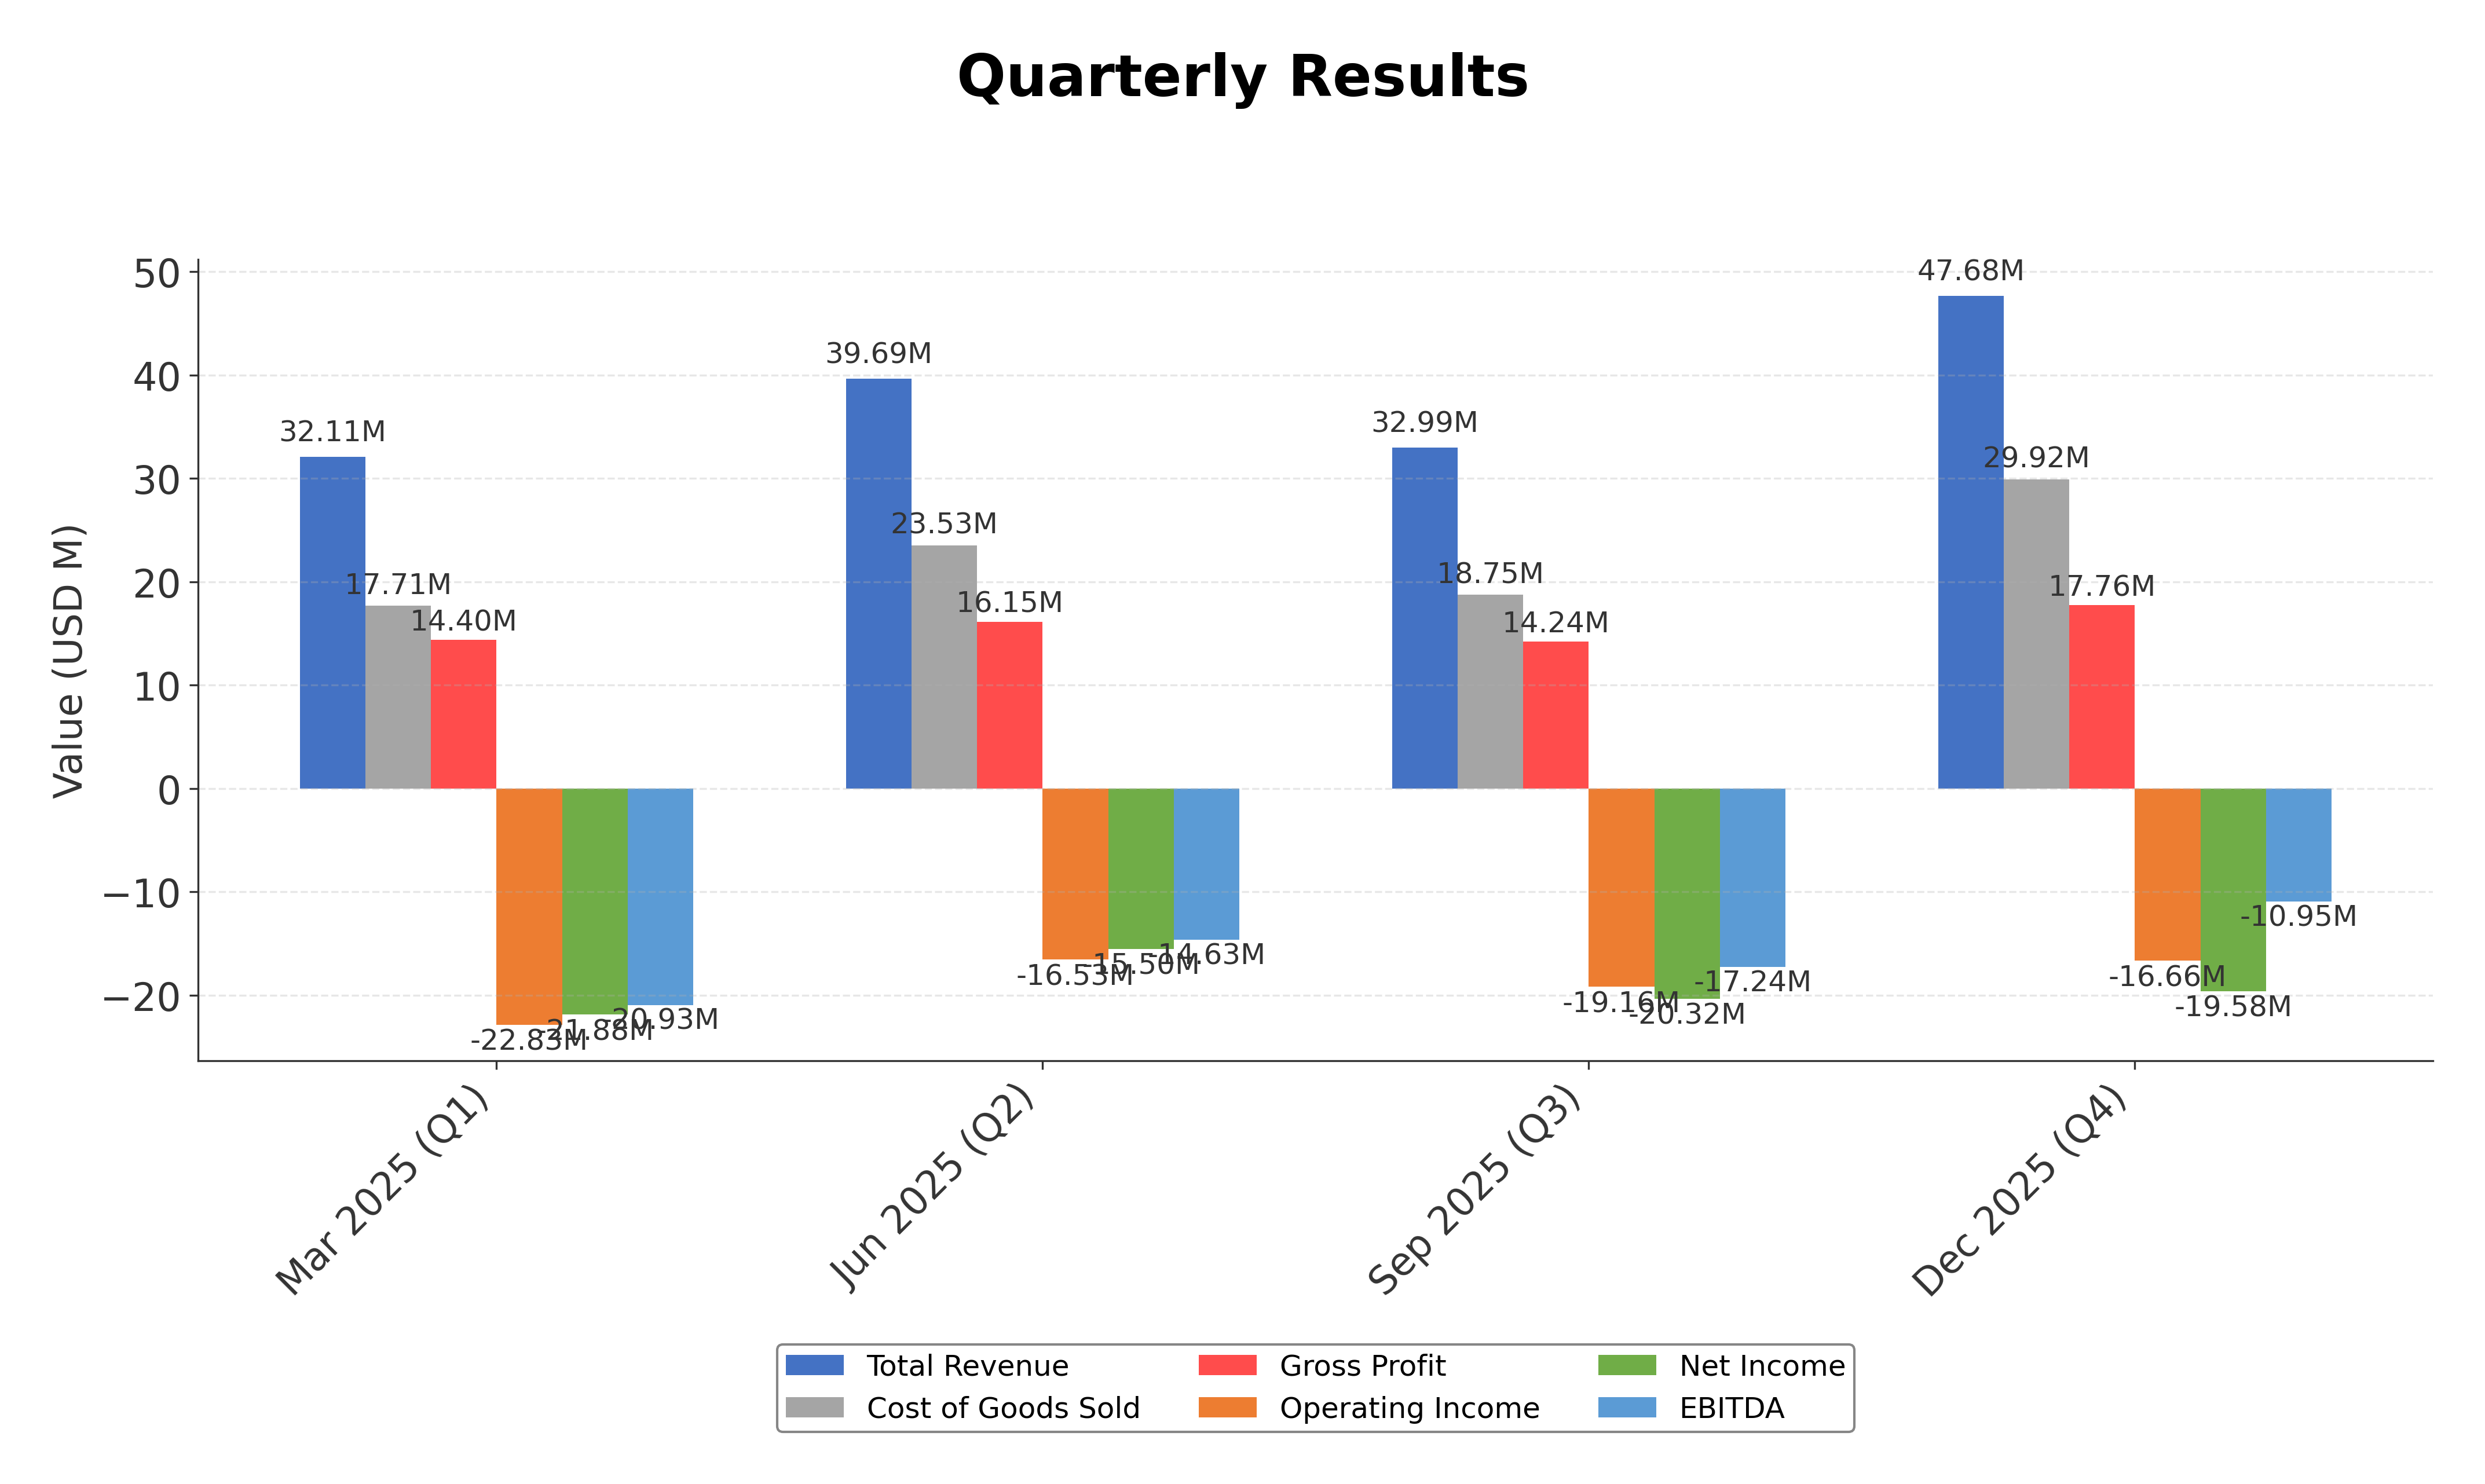
Financial Statements
Comprehensive financial data including income, balance sheet, and cash flow metrics
Income Statement
| fiscal_date | 2025-12-31 | 2024-12-31 | 2023-12-31 | 2022-12-31 | 2021-12-31 |
|---|---|---|---|---|---|
| Sales | 152.47M | 189.76M | 254.06M | 297.77M | 277.47M |
| Cost Of Goods | 89.92M | 108.69M | 149.83M | 168.14M | 130.81M |
| Gross Profit | 62.55M | 81.06M | 104.23M | 129.63M | 146.66M |
| Operating Expense Selling General And Administrative | 137.73M | 175.02M | 223.09M | 225.84M | 179.54M |
| Operating Income | -75.17M | -93.95M | -118.85M | -96.22M | -32.88M |
| Non Operating Interest Expense | 1.07M | N/A | N/A | N/A | 178.00K |
| Other Income Expense | -648.00K | -983.00K | -37.35M | -3.93M | -11.51M |
| Pretax Income | -76.89M | -91.45M | -152.12M | -100.13M | -44.56M |
| Income Tax | 393.00K | 1.87M | 334.00K | 1.23M | 810.00K |
| Net Income | -77.28M | -93.32M | -152.46M | -101.35M | -45.37M |
| Eps Basic | -9.47 | -11.87 | -20.20 | -13.60 | -13.00 |
| Eps Diluted | -9.47 | -11.87 | -20.20 | -13.60 | -13.00 |
| Basic Shares Outstanding | 8.16M | 7.86M | 7.58M | 7.44M | 3.47M |
| Diluted Shares Outstanding | 8.16M | 7.86M | 7.58M | 7.44M | 3.47M |
| Ebit | -75.82M | -93.95M | -118.85M | -96.22M | -44.38M |
| Ebitda | -63.02M | -77.53M | -60.94M | -77.47M | -34.73M |
| Net Income Continuous Operations | -77.28M | -93.32M | -152.46M | -101.35M | -45.37M |
| Non Operating Interest Income | N/A | 3.49M | 4.08M | 19.00K | N/A |
Data provided by Twelve Data
Balance Sheet
| fiscal_date | 2025-12-31 | 2024-12-31 | 2023-12-31 | 2022-12-31 | 2021-12-31 |
|---|---|---|---|---|---|
| Cash And Cash Equivalents | 26.69M | 66.73M | 130.03M | 167.14M | 288.58M |
| Accounts Receivable | 6.84M | 6.17M | 8.19M | 9.21M | 10.98M |
| Total Assets | 109.42M | 188.88M | 312.70M | 462.36M | 488.43M |
| Total Liabilities | 73.50M | 87.19M | 127.38M | 145.59M | 91.42M |
| Long Term Debt | 32.86M | 42.80M | 78.73M | 95.58M | 0.00 |
| Shareholders Equity | 35.91M | 101.69M | 185.33M | 316.77M | 397.00M |
Data provided by Twelve Data
Cash Flow Statement
| fiscal_date | 2025-12-31 | 2024-12-31 | 2023-12-31 | 2022-12-31 | 2021-12-31 |
|---|---|---|---|---|---|
| Operating Activities Net Income | -77.28M | -93.32M | -152.46M | -101.35M | -45.37M |
| Operating Activities Depreciation | 8.02M | 12.40M | 21.00M | 14.68M | 9.65M |
| Operating Activities Deferred Taxes | 65.00K | 912.00K | -474.00K | -898.00K | 252.00K |
| Operating Activities Stock Based Compensation | 7.76M | 11.47M | 19.35M | 19.87M | 11.24M |
| Operating Activities Other Non Cash Items | -1.51M | 8.00K | 49.00K | 49.00K | 49.00K |
| Operating Activities Accounts Receivable | -643.00K | 1.96M | 1.00M | 1.60M | -9.11M |
| Operating Activities Other Assets Liabilities | -5.53M | -4.88M | 50.69M | -22.76M | -41.93M |
| Operating Activities Operating Cash Flow | -69.12M | -71.44M | -60.84M | -88.81M | -75.21M |
| Investing Activities Capital Expenditures | -3.15M | -4.09M | -10.87M | -31.36M | -24.18M |
| Investing Activities Net Acquisitions | 390.00K | 4.01M | 2.18M | 0.00 | N/A |
| Investing Activities Other Investing Activity | 852.00K | 2.20M | 810.00K | -929.00K | -1.21M |
| Investing Activities Investing Cash Flow | -1.90M | 2.12M | -7.71M | -32.29M | -25.64M |
| Financing Activities Long Term Debt Issuance | 19.23M | N/A | 0.00 | 539.00K | 0.00 |
| Financing Activities Long Term Debt Payments | -1.85M | N/A | N/A | 0.00 | 0.00 |
| Financing Activities Common Stock Issuance | 1.70M | N/A | N/A | 0.00 | 236.96M |
| Financing Activities Other Financing Charges | -3.12M | -1.00K | -581.00K | -910.00K | -4.69M |
| Financing Activities Financing Cash Flow | 15.95M | -1.00K | -581.00K | -371.00K | 232.27M |
| End Cash Position | 27.55M | 67.58M | 130.67M | 167.77M | 288.58M |
| Interest Paid | 58.00K | 124.00K | 111.00K | 88.00K | 118.00K |
| Free Cash Flow | -58.23M | -67.95M | -41.09M | -121.95M | -75.03M |
| Investing Activities Sale Of Investments | N/A | 0.00 | 166.00K | 0.00 | N/A |
| Income Tax Paid | N/A | 1.67M | 1.78M | 1.42M | 438.00K |
| Investing Activities Purchase Of Investments | N/A | N/A | N/A | 0.00 | -250.00K |
| Operating Activities Accounts Payable | N/A | N/A | N/A | N/A | N/A |
Data provided by Twelve Data
Technical Analysis
Key Insights
- The current trend shows a strong upward price movement driven by recent news of the company’s pivot to AI, with price action breaking above the 50-day moving average but remaining below the 200-day moving average.
- Key support levels are identified near $3.58 (50-day moving average) and $2.15 (52-week low), while resistance is observed near $24.31 (52-week high).
- The stock price is currently trading above the 10-day and 50-day moving averages but below the 200-day moving average, indicating short-term bullish momentum within a longer-term neutral to bearish context.
- Momentum indicators such as RSI are elevated, suggesting overbought conditions; MACD shows positive crossover consistent with recent upward momentum; stochastic oscillators also reflect strong short-term momentum.
- Analysis across daily, weekly, and monthly timeframes reveals increased volatility and a recent breakout from a prolonged consolidation phase, with weekly and monthly charts showing early signs of trend reversal.
- Potential scenarios include continued short-term price appreciation driven by speculative interest and news flow, with risk of pullbacks or consolidation as the market digests the company’s strategic pivot.
Trending News
1. Headline: Allbirds stock gains 350% this week as shoemaker pivots to AI
Summary: Allbirds is getting out of the sustainable sneaker business and into the AI business.
Sentiment: positive
2. Headline: Allbirds (BIRD) Soars On Radical Pivot To NewBird AI, Special Dividend
Summary: Live Update At 11:32:13 EDT: On ... Allbirds Inc. stock [NASDAQ: BIRD] is trending up by 15.86%! Discover the key drivers behind this movement as well as our expert analysis in the detailed breakdown below. BIRD’s chart looks like a classic “story change” blow‑up followed by a massive repricing. For most of late March and early April, Allbirds traded in a sleepy $2.40–$3.50 range. Then the news ...
Sentiment: positive
3. Headline: It's not just Allbirds - another meme-stock season is on the horizon, Vanda Research says | Reuters
Summary: U.S. tax season is over, but meme-stock season is just getting started.
Sentiment: neutral
4. Headline: Allbirds Stock Now Crashing as Reality Sets in About Its Delusional AI Pivot
Summary: Tech bro sneaker company Allbirds made a huge splash yesterday when it announced a baffling pivot to AI infrastructure news that was met with a mix of incredulity and ridicule.
Sentiment: positive
5. Headline: Allbirds pivots from sneakers to AI infrastructure, rebrands as NewBird AI | Fox Business
Summary: Over the long term, NewBird AI wants to provide GPUs as a service as well as AI-powered cloud solutions to its customers, including through the growth of its neocloud platform, while also evaluating strategic opportunities for ... Allbirds' stock surged on Wednesday following the announcement, ...
Sentiment: positive
Powered by Brave
Recent Updates
News Summary
As of 2026-04-15. Allbirds has announced a strategic pivot from its core sustainable sneaker business to AI infrastructure, culminating in a rebranding to NewBird AI. The company entered into a $39 million deal with American Exchange Group to sell its intellectual property and other assets related to its footwear business. This transition represents a fundamental shift in business focus toward offering GPUs as a service and AI-powered cloud solutions via its neocloud platform. The pivot has triggered a significant surge in the company’s stock price, reflecting investor interest in the new growth prospects and market positioning. These developments mark a critical juncture for Allbirds as it seeks to redefine its competitive landscape and revenue streams.
News Sentiment
The overall sentiment across recent updates is cautiously optimistic, driven primarily by the company’s bold strategic pivot to AI infrastructure and the associated rebranding to NewBird AI. Positive market reactions are evident in the substantial stock price appreciation following the announcement and asset sale deal. However, the shift away from the traditional sustainable sneaker market introduces uncertainty, as the company navigates a new industry with different competitive dynamics. The sentiment reflects a balance between enthusiasm for potential growth opportunities in AI and recognition of the risks inherent in such a transformative change. This nuanced outlook underscores the importance of monitoring execution and market acceptance of the new business model.
Analytical Overview
Analysis Summary
Allbirds’ valuation metrics, including negative trailing and forward P/E ratios and a price-to-book ratio of 2.62, contrast sharply with industry averages that typically feature positive earnings multiples. This reflects the company’s current unprofitable status and ongoing transition, making traditional valuation comparisons less informative. The company’s revenue has declined by 14.6% quarter-over-quarter, and operating cash flow remains negative at -$55.1 million TTM, indicating challenges in growth and cash generation.
The growth trajectory is currently constrained, with declining revenues and negative free cash flow of approximately -$25.8 million TTM. However, the recent strategic pivot to AI infrastructure may open new avenues for growth, although this remains in early stages. Financial health shows a high debt-to-equity ratio of 110.4%, which could pressure liquidity, despite a current ratio of 2.02 suggesting short-term solvency.
Sector-specific challenges include shifting consumer preferences and competitive pressures in apparel retail, while opportunities arise from the company’s pivot into the rapidly expanding AI technology sector. Market positioning is evolving as Allbirds rebrands to NewBird AI, aiming to leverage technological innovation. The company’s moderate institutional ownership and recent strategic moves highlight a transitional phase with both risks and potential.
Overall Business and Market Assessment
Supporting Factors: Allbirds’ strong liquidity position with a current ratio above 2, its established brand equity in sustainable products, and the strategic pivot to AI infrastructure that could diversify revenue streams
Risk Factors: the company’s continued negative profitability, high leverage indicated by a debt-to-equity ratio exceeding 110%, and execution risks associated with entering a new industry
SWOT Analysis
Strengths
- Strong brand recognition in sustainable footwear and apparel.
- Adequate liquidity with a current ratio of 2.02.
- Recent strategic pivot to AI infrastructure opens new growth avenues.
- Moderate institutional ownership supporting governance.
Weaknesses
- Negative profitability with net margin of -50.7%.
- High debt-to-equity ratio of 110.4% indicating leverage concerns.
- Declining revenue growth at -14.6% quarter-over-quarter.
- Negative operating and free cash flows indicating cash burn.
Opportunities
- Expansion into AI infrastructure and cloud services markets.
- Growing demand for environmentally conscious and tech-driven products.
- Potential to leverage neocloud platform for AI-powered solutions.
- Strategic asset sale provides capital for reinvestment.
Threats
- Uncertainty and skepticism around the new AI business model.
- Competitive pressures in both apparel retail and AI sectors.
- Volatility in stock price due to speculative trading and market sentiment.
- Execution risks related to business model transformation.
Company Description
Allbirds, Inc. is a global lifestyle brand that innovates with naturally derived and sustainable materials to create footwear and apparel products designed to minimize environmental impact. The company manufactures and sells a diverse range of lifestyle products for men and women, including running shoes, everyday sneakers, high-tops, slip-ons, boat shoes, flats, weather-resistant shoes, and sandals, alongside apparel such as classic tees, sweats, activewear, tops, bottoms, dresses, socks, and underwear. Allbirds distributes its products through multiple channels, including its own retail stores, third-party retailers and distributors, as well as digital platforms including its website and various online marketplaces. Headquartered in San Francisco, California and founded in 2015, Allbirds focuses on combining style with sustainability, appealing to consumers seeking environmentally conscious footwear and apparel options. The company serves customers globally, positioning itself as a forward-thinking brand within the broader consumer discretionary sector.