
Biocon Ltd (BIOCON)
Stock Analysis Report
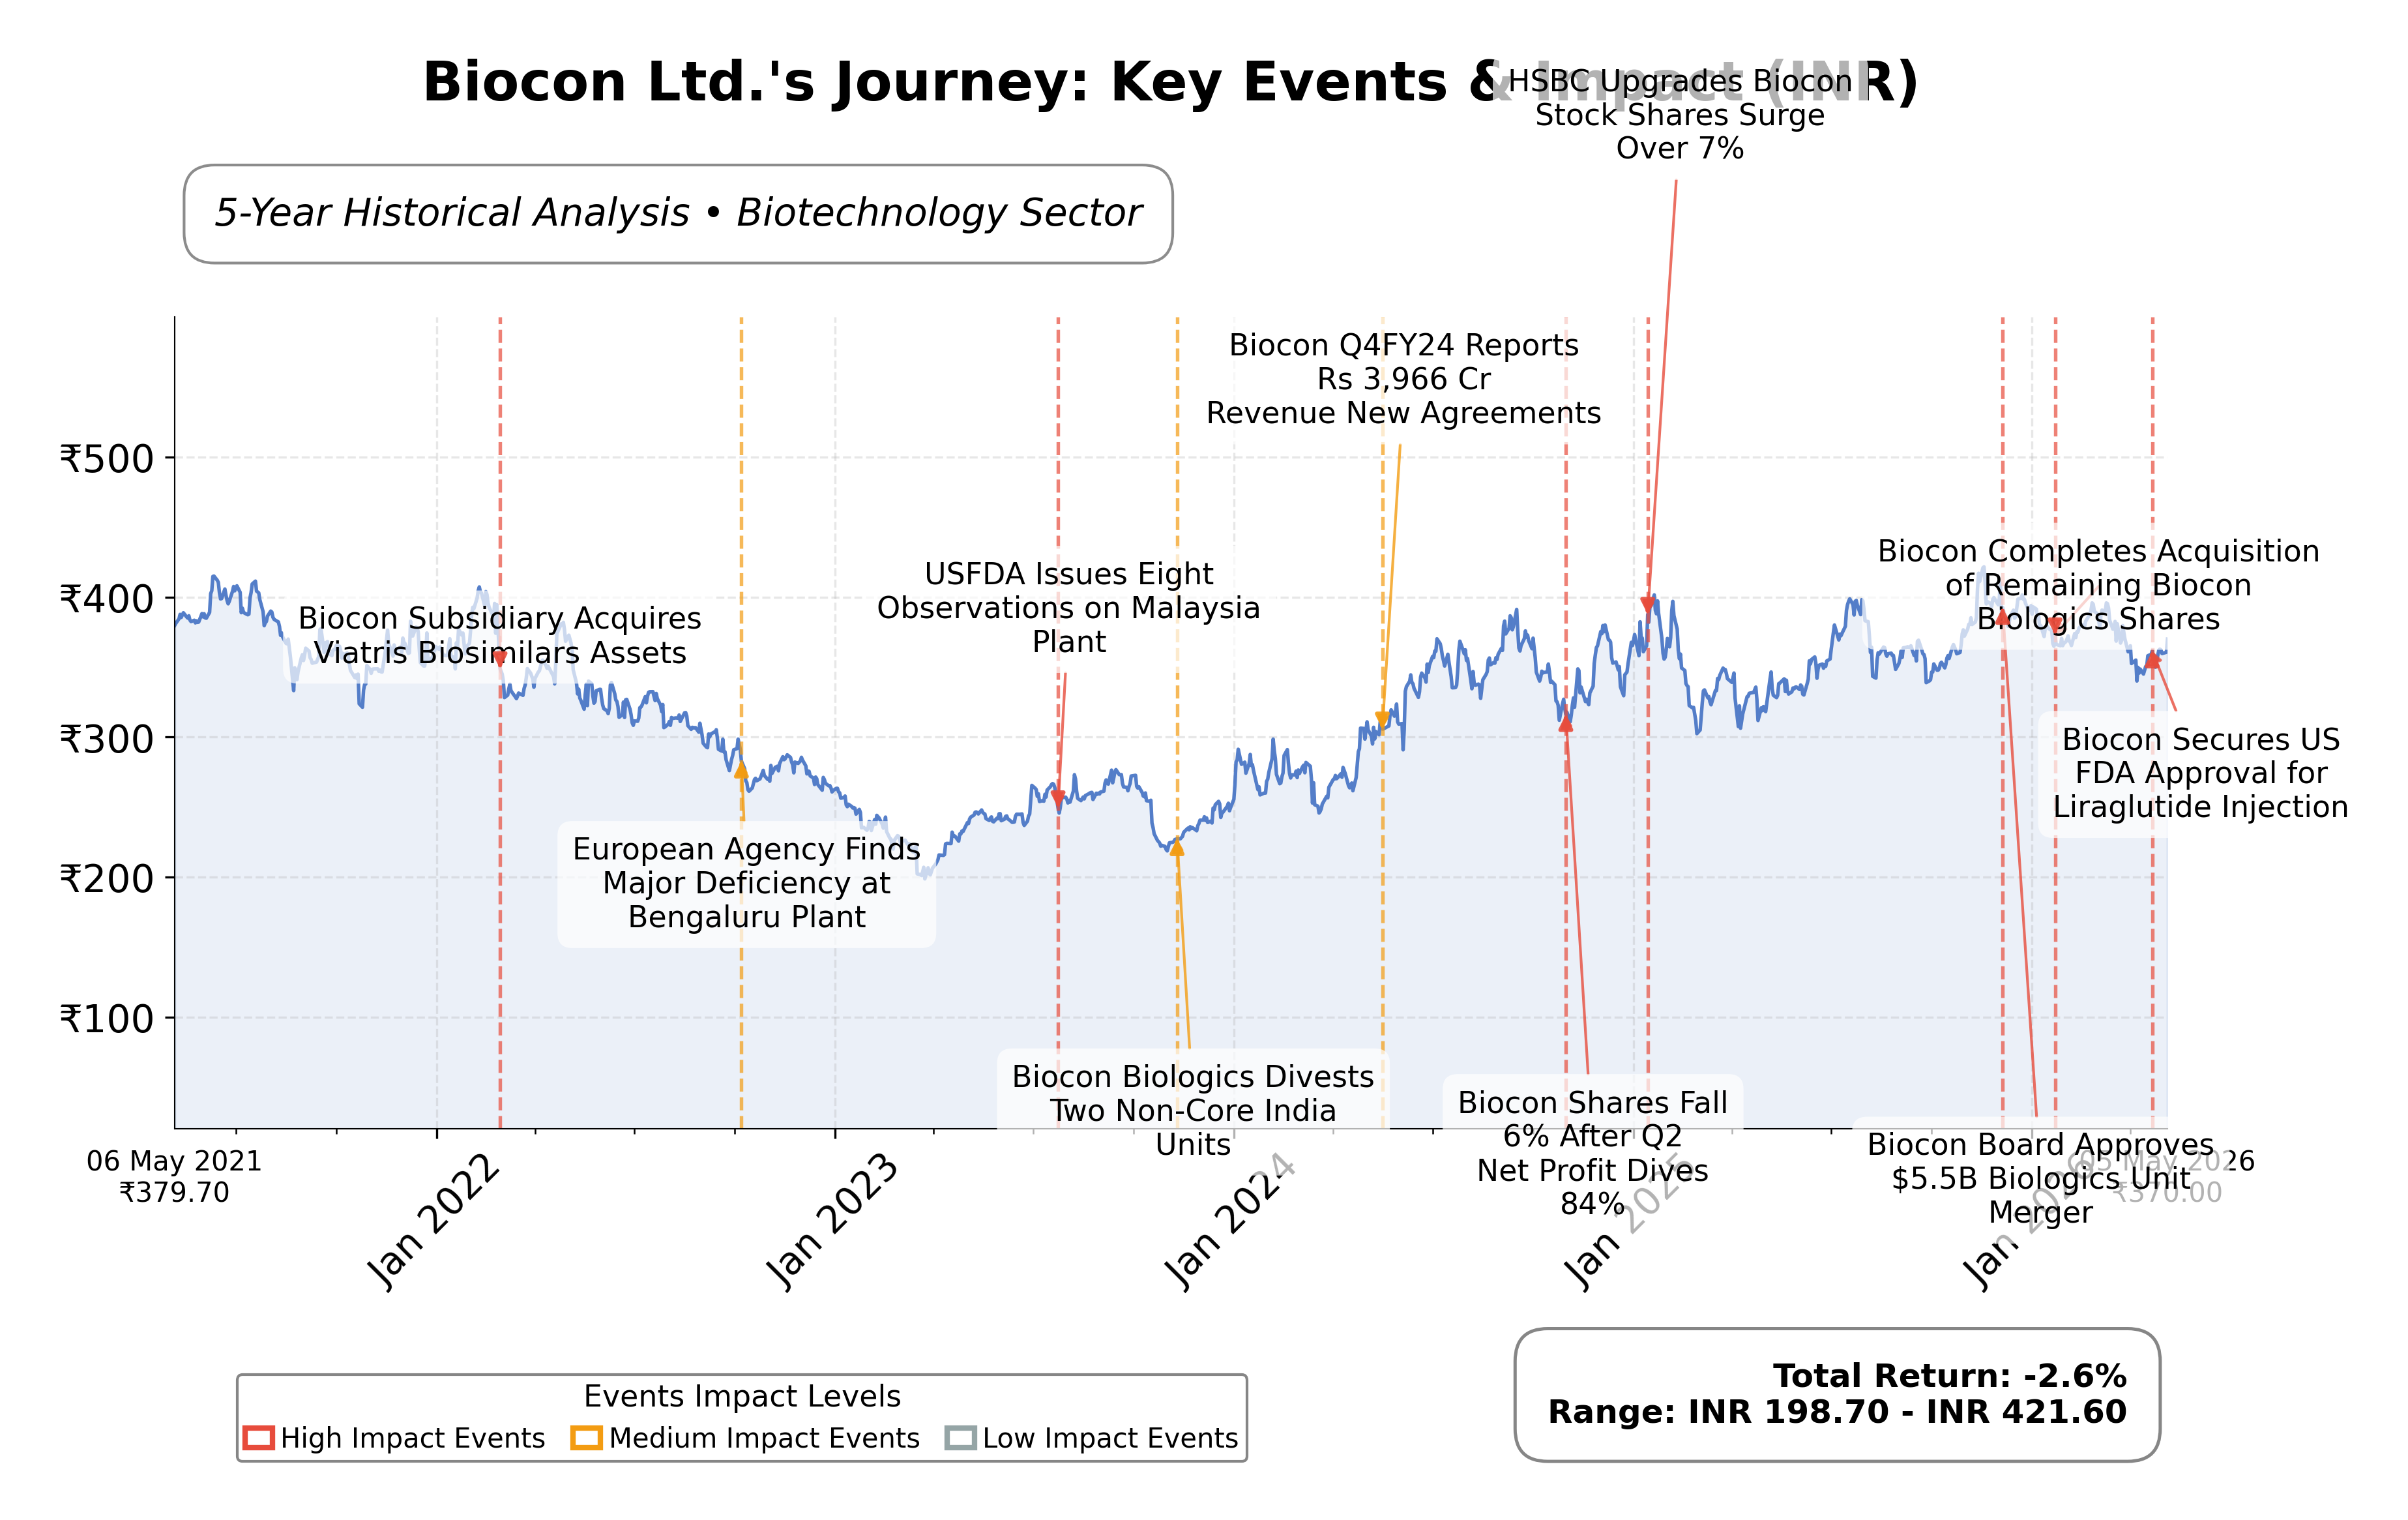
Stock Journey
Key Positives and Key Risks
Pros
- Revenue growth of 9.2% quarterly indicates stable expansion in business operations.
- Operating cash flow of INR 17.78 billion demonstrates strong cash generation capacity.
Cons
- Trailing P/E ratio of 73.34 suggests a high valuation relative to earnings.
- Net profit margin of 3.6% reflects limited profitability.
- Debt-to-equity ratio of 0.50 indicates moderate financial leverage risk.
Disclosure: This information is for general awareness and does not constitute investment advice
Report Summary
Biocon Ltd. is a leading Indian biopharmaceutical company listed on the NSE, operating within the healthcare sector with a focus on biotechnology. The company specializes in developing and manufacturing innovative and affordable biopharmaceuticals, including biologics, biosimilars, complex APIs, and branded formulations. Its key therapeutic areas include oncology, diabetes, and autoimmune diseases, supported by strong R&D capabilities and a global footprint. Biocon's strategic collaborations and partnerships enhance its market positioning in the competitive pharmaceutical industry.
Financially, Biocon reported trailing twelve months (TTM) revenue of approximately INR 168.27 billion with a gross margin of 67.9%, indicating efficient production and cost management. Operating margin stands at 7.6%, and net profit margin is modest at 3.6%, reflecting ongoing investments and operational costs. The company’s return on equity (ROE) and return on assets (ROA) are relatively low at 3.7% and 1.7% respectively, suggesting room for improvement in capital efficiency. Its return on invested capital (ROIC) is not explicitly stated but can be inferred as moderate given the operating metrics.
Valuation metrics show a trailing P/E ratio of 73.34 and a forward P/E of 39.53, indicating the market prices the stock at a premium relative to near-term earnings expectations. The price-to-book ratio is 1.72, and EV/EBITDA stands at 19.29, suggesting a relatively high valuation compared to some peers. The market capitalization is approximately INR 582.39 billion, with the stock trading at INR 381.30, close to its 52-week high of INR 424.95 and well above the 52-week low of INR 317.90, reflecting moderate price appreciation over the past year.
Biocon’s strengths include robust cash flow generation with operating cash flow of INR 17.78 billion and free cash flow of INR 10.13 billion, alongside a manageable current ratio of 1.16, indicating adequate short-term liquidity. However, the company carries significant debt of INR 165.35 billion, with a debt-to-equity ratio of 0.50, which introduces financial leverage risk. Recent strategic developments include a well-structured succession plan with Claire Mazumdar named as the future leader, which has positively influenced market sentiment. Key risks involve regulatory challenges, competitive pressures in the biotechnology sector, and execution risks related to growth initiatives.
Technically, the stock shows mixed signals with price hovering near the 50-day and 200-day moving averages around INR 370, and momentum indicators reflecting cautious sentiment. Recent news highlights leadership transition and strategic clarity, which may stabilize investor confidence. Overall, the data suggests a nuanced environment where accumulation or realization of gains should be considered carefully, with attention to evolving fundamentals and market dynamics.
Company and Industry Overview
Company Basics
Price Performance
Company Size
Shareholding Pattern
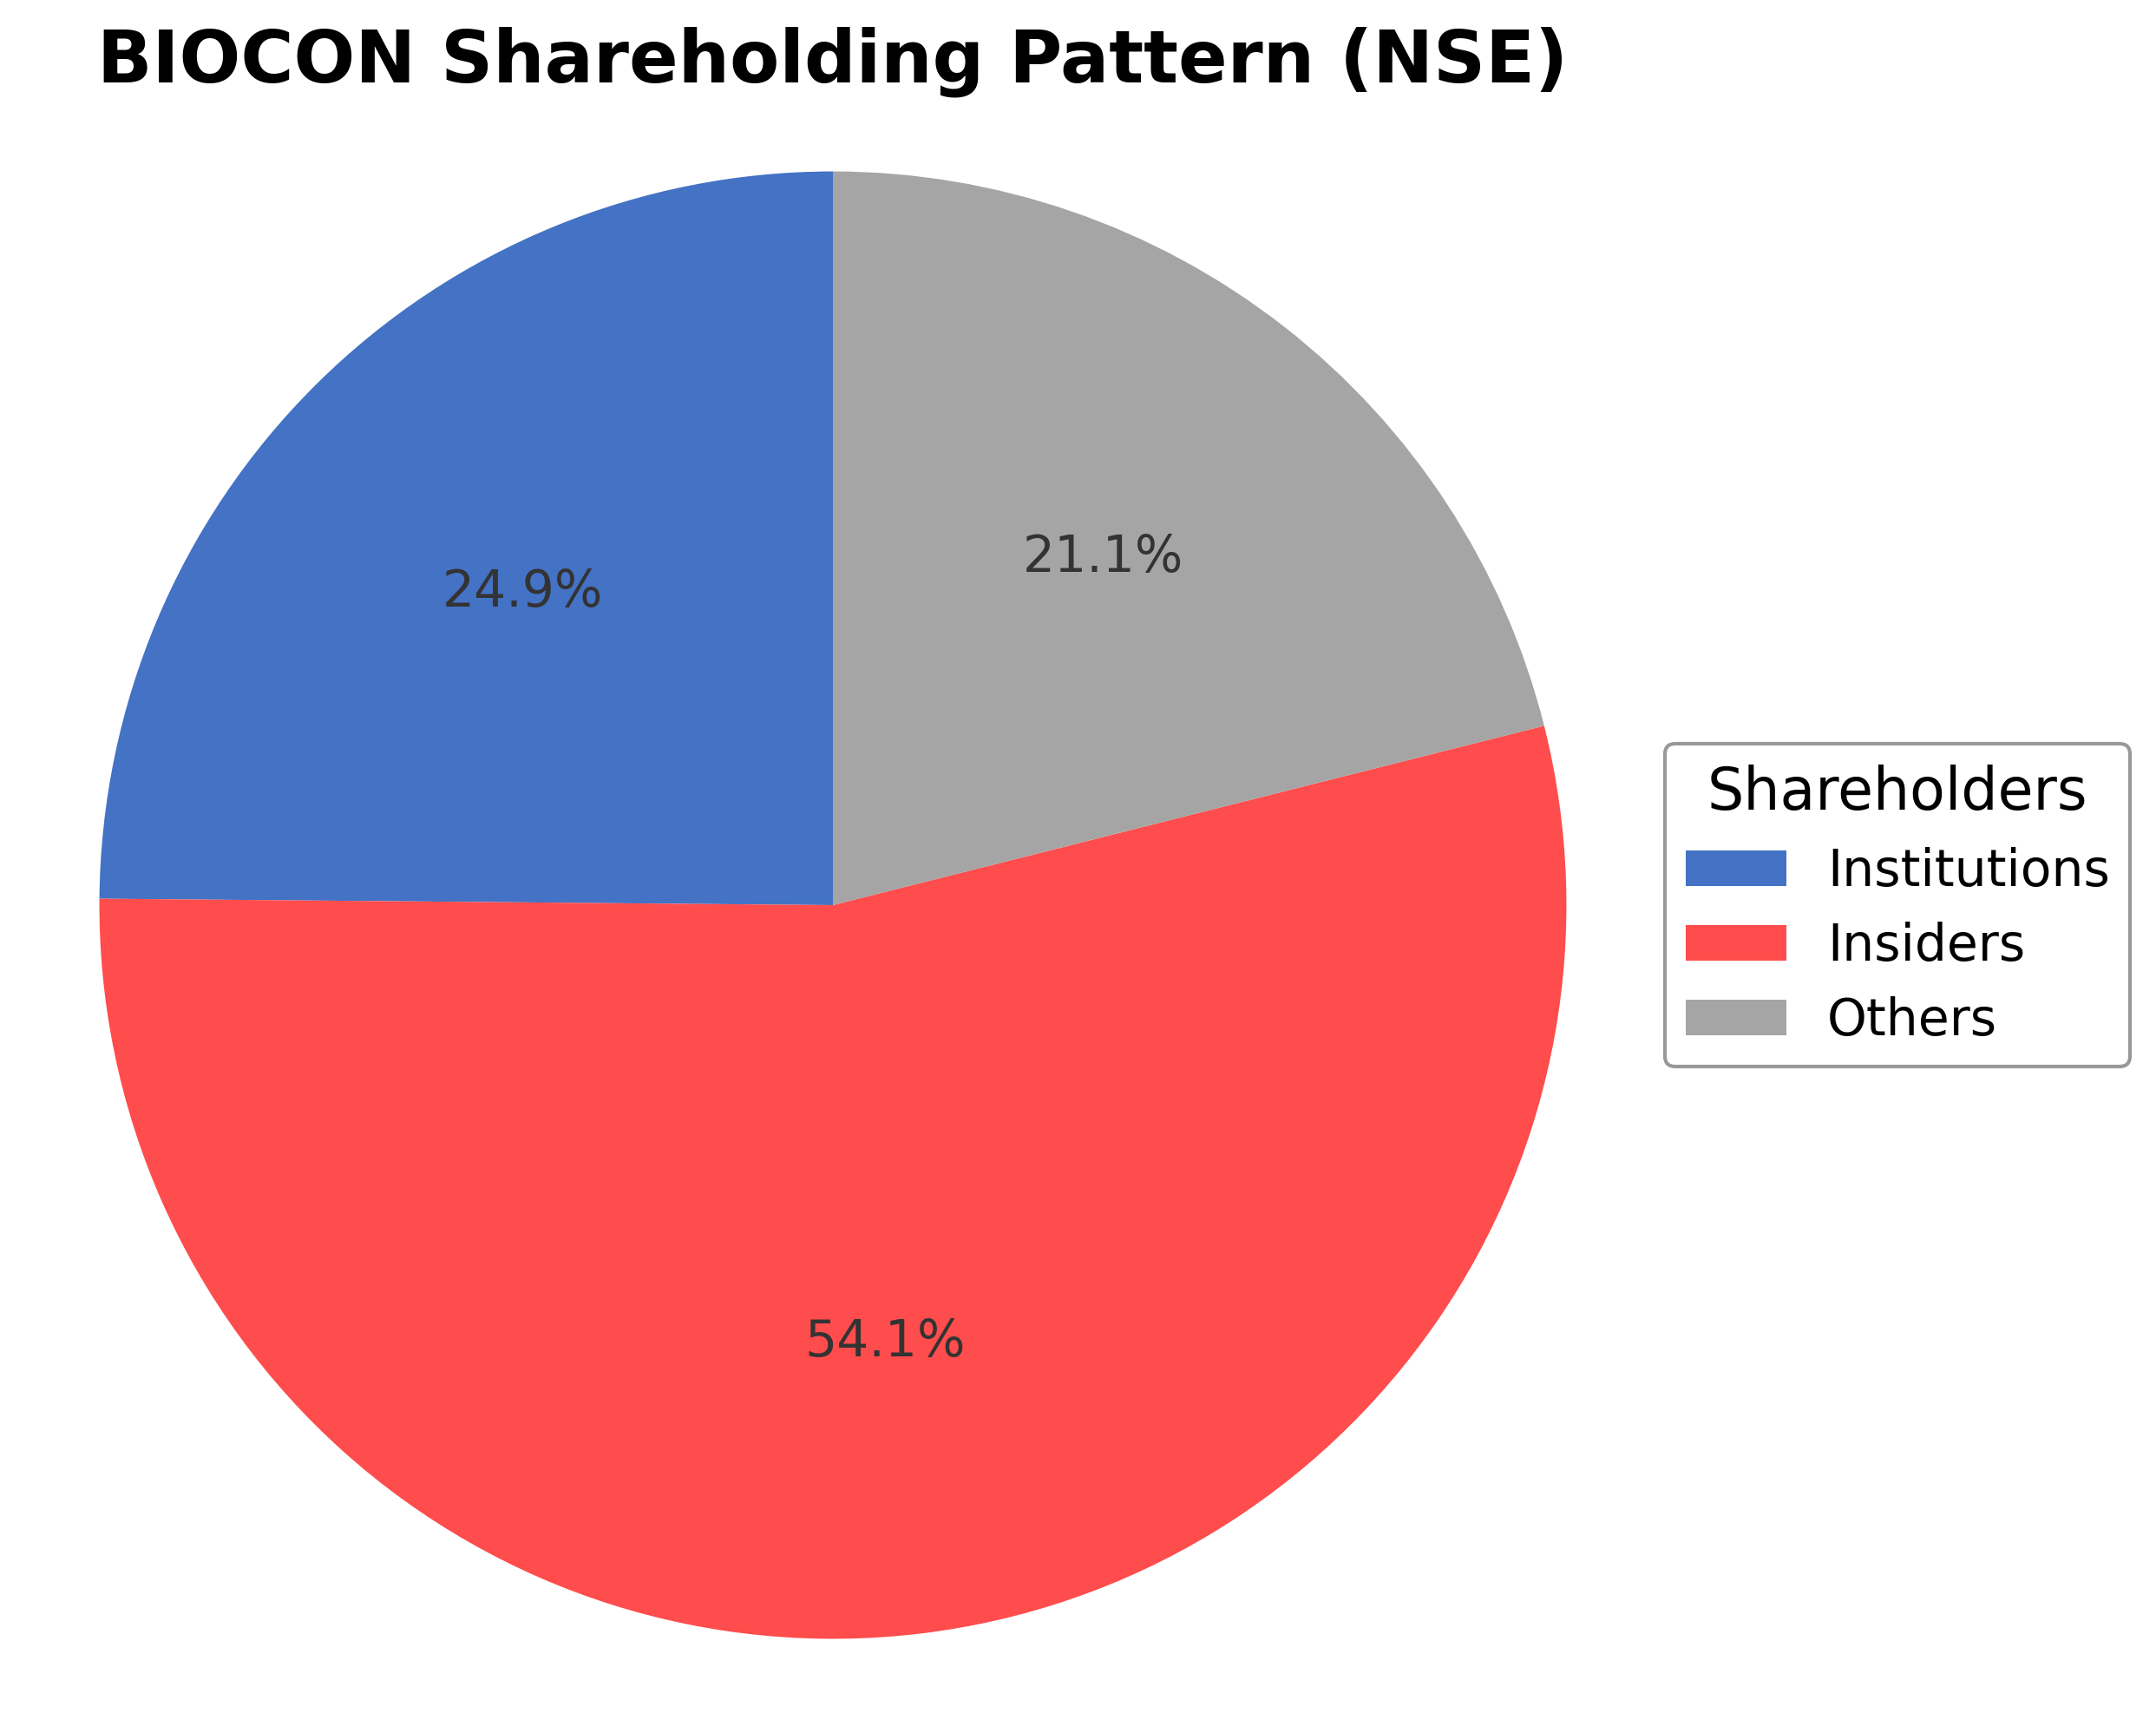
Biocon Ltd.'s shareholding structure is dominated by insiders holding approximately 54.07%, which includes executives, board members, and affiliated individuals. Institutional investors own about 24.86%, comprising mutual funds, pension funds, and asset managers, while the remaining 21.07% is held by public shareholders including retail investors and employee stock plans. Over the past 12-24 months, institutional ownership has shown moderate stability with no significant accumulation or distribution trends reported. Major funds maintain steady positions, reflecting a balanced market sentiment towards the company. This ownership distribution supports robust governance frameworks and strategic continuity, positioning Biocon to pursue its growth and innovation objectives within the biotechnology sector.
Sector and Industry Analysis
The global pharmaceutical sector is a large and rapidly growing market driven by increasing healthcare demand, aging populations, and rising chronic diseases. The biologics and biosimilars segment is expanding swiftly, supported by advancements in biotechnology and growing acceptance of cost-effective alternatives to branded biologics. Key players include multinational firms such as Pfizer, Novartis, and emerging Indian companies like Biocon, which have significant footprints in biosimilars, generics, and contract research services.
Industry trends highlight a shift toward biosimilars and specialty generics, with companies investing heavily in R&D and strategic acquisitions to enhance product pipelines and geographic reach. Integration of biosimilar portfolios, like Biocon’s acquisition of Viatris’ biosimilars assets, exemplifies consolidation aimed at scaling operations and market penetration. Barriers to entry remain high due to complex manufacturing processes, regulatory approvals, and the need for extensive clinical data, favoring established players with strong capabilities and partnerships.
The regulatory environment is stringent, with agencies like the USFDA and EMA enforcing rigorous approval standards for biosimilars and generics to ensure safety and efficacy. Recent challenges such as Complete Response Letters (CRLs) for certain biosimilars underscore the complexity of gaining market access. However, evolving frameworks and strategic alliances, such as Biocon’s vaccine supply agreement, present opportunities for growth, especially in advanced and emerging markets where regulatory pathways are becoming more defined.
Note: Analysis synthesized from industry research, market reports, and regulatory filings. Information is subject to change based on market conditions.
Financial Ratios Dashboard
Illustrative Scenario Analysis
DCF Assumptions:
Method: Two-Stage EPS-Priority Model
Financials
Peer Analysis
| Company Name | Market Cap | P/E Ratio | P/B Ratio | EV/EBITDA | Price to CFO |
|---|---|---|---|---|---|
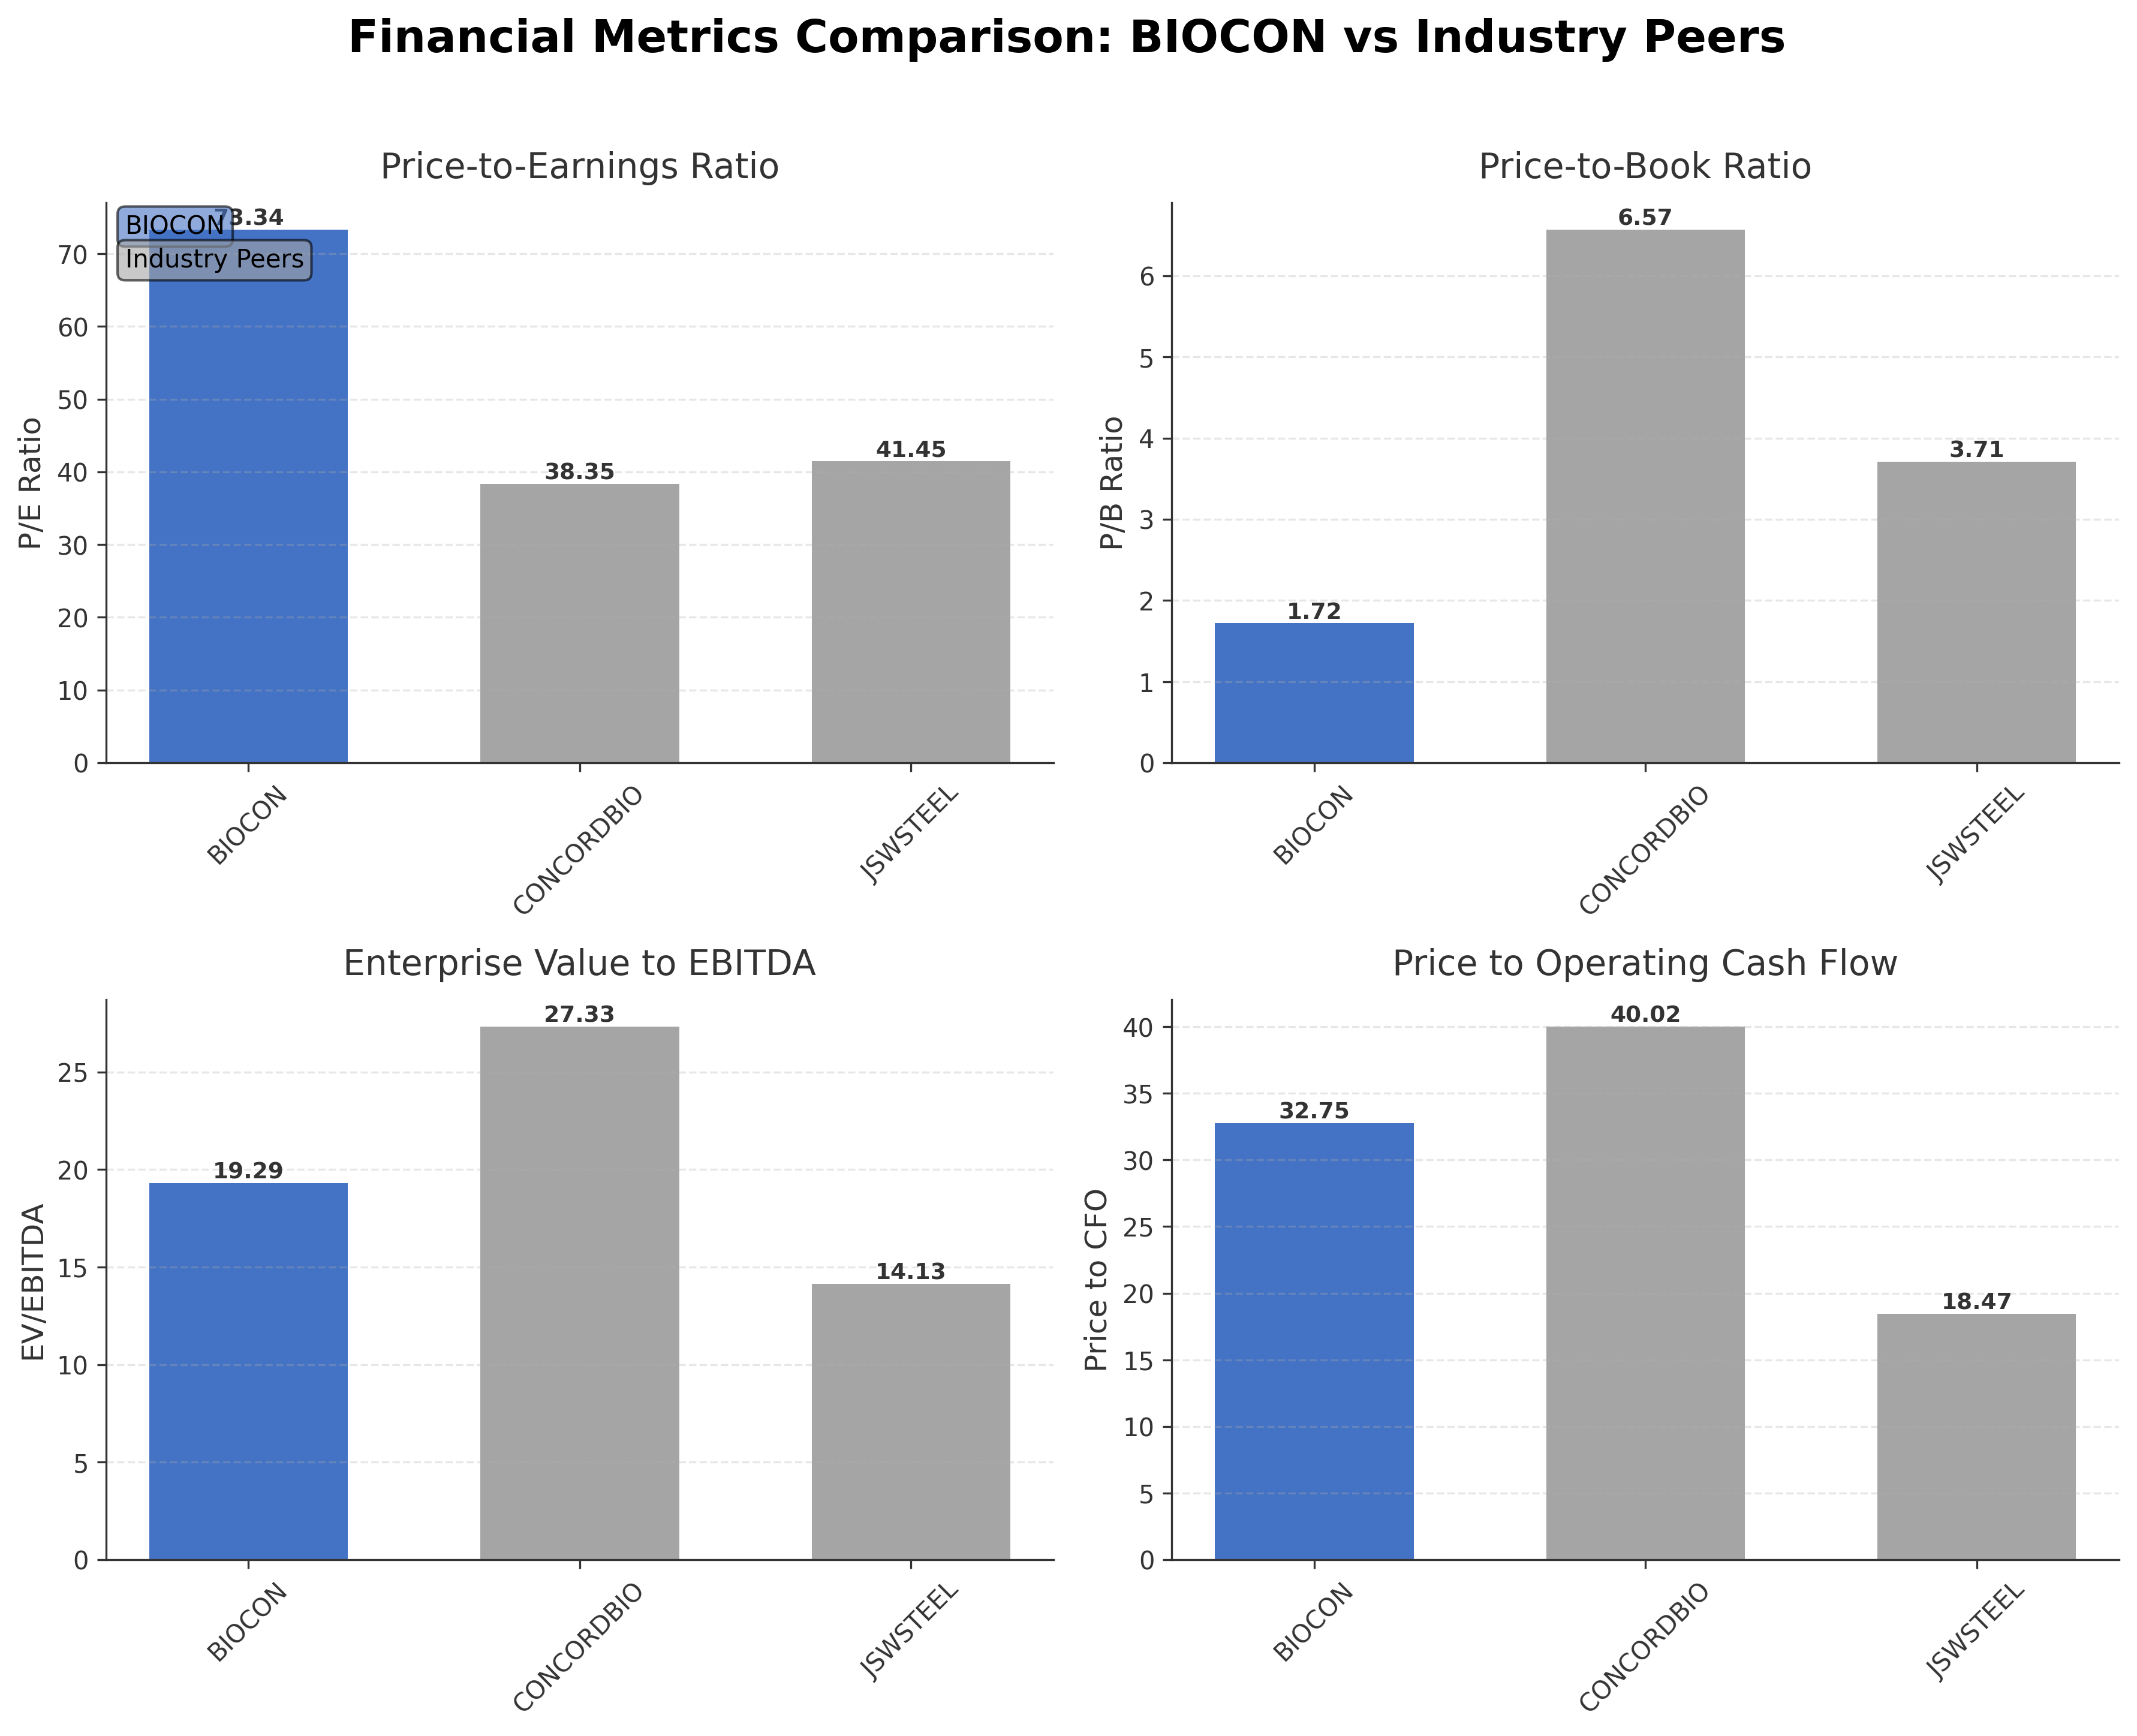
| Biocon Ltd. | ₹582.39B | 73.34 | 1.72 | 19.29 | 32.75 |
| Concord Biotech Ltd. | ₹119.47B | 38.35 | 6.57 | 27.33 | 40.02 |
| JSW Steel Ltd. | ₹3.09T | 41.45 | 3.71 | 14.13 | 18.47 |
Comparison Analysis: Biocon Ltd. trades at a higher P/E ratio of 73.34 compared to Concord Biotech's 38.35 and JSW Steel's 41.45, indicating a premium valuation relative to earnings. Its price-to-book ratio of 1.72 is lower than Concord Biotech's 6.57 and JSW Steel's 3.71, suggesting a more conservative book value pricing. The EV/EBITDA multiple of 19.29 is moderate, positioned between Concord Biotech's higher 27.33 and JSW Steel's lower 14.13, reflecting relative operational valuation. Biocon's price to cash flow ratio at 32.75 is higher than JSW Steel's 18.47 but lower than Concord Biotech's 40.02, indicating mixed cash flow valuation metrics. Return on equity is low at 0.04%, comparable to JSW Steel but below Concord Biotech's 0.21%, highlighting potential for improved capital efficiency. Overall, Biocon shows a premium valuation with moderate operational metrics relative to its peers.
Financial Metrics Comparison with Peers
Financial Statements
Comprehensive financial data including income, balance sheet, and cash flow metrics
Income Statement
| fiscal_date | 2025-03-31 | 2024-03-31 | 2023-03-31 | 2022-03-31 | 2021-03-31 |
|---|---|---|---|---|---|
| Sales | 150.52B | 141.96B | 109.34B | 80.25B | 70.07B |
| Cost Of Goods | 51.98B | 49.07B | 36.67B | 27.24B | 22.45B |
| Gross Profit | 98.54B | 92.89B | 72.67B | 53.01B | 47.62B |
| Operating Expense Research And Development | 6.34B | 7.96B | 8.82B | 3.10B | 5.31B |
| Operating Expense Selling General And Administrative | 12.72B | 8.86B | 4.87B | 4.31B | 4.89B |
| Operating Expense Other Operating Expenses | 16.58B | 22.13B | 15.92B | 9.40B | 8.03B |
| Operating Income | 16.26B | 13.51B | 12.35B | 10.68B | 6.05B |
| Non Operating Interest Income | 1.09B | 1.61B | 1.12B | 1.12B | 770.00M |
| Non Operating Interest Expense | 8.88B | 9.74B | 4.19B | 676.00M | 577.00M |
| Pretax Income | 18.87B | 15.25B | 8.97B | 9.83B | 10.68B |
| Income Tax | 4.57B | 2.27B | 2.54B | 2.12B | 2.21B |
| Net Income | 14.29B | 12.98B | 6.43B | 7.72B | 8.46B |
| Eps Basic | 8.46 | 8.55 | 3.88 | 5.44 | 6.24 |
| Eps Diluted | 8.46 | 8.54 | 3.87 | 5.42 | 6.19 |
| Basic Shares Outstanding | 1.20B | 1.20B | 1.19B | 1.19B | 1.19B |
| Diluted Shares Outstanding | 1.20B | 1.20B | 1.19B | 1.19B | 1.19B |
| Ebit | 27.74B | 25.00B | 13.16B | 10.51B | 11.25B |
| Ebitda | 33.60B | 30.32B | 25.29B | 19.64B | 16.66B |
| Net Income Continuous Operations | 14.29B | 12.98B | 6.43B | 7.72B | 8.46B |
| Minority Interests | -4.16B | -2.75B | -1.80B | -1.23B | -1.06B |
| Preferred Stock Dividends | 0.00 | 0.00 | 0.00 | 0.00 | 0.00 |
Source: Financial statements and regulatory filings
Balance Sheet
| fiscal_date | 2025-03-31 | 2024-03-31 | 2023-03-31 | 2022-03-31 | 2021-03-31 |
|---|---|---|---|---|---|
| Cash And Cash Equivalents | 32.27B | 12.33B | 13.23B | 6.63B | 9.53B |
| Accounts Receivable | 54.88B | 62.31B | 35.73B | 20.58B | 15.03B |
| Total Assets | 587.97B | 560.71B | 520.43B | 203.94B | 185.22B |
| Total Liabilities | 310.85B | 307.96B | 295.54B | 109.24B | 100.15B |
| Long Term Debt | 129.44B | 134.25B | 155.00B | 42.20B | 30.76B |
| Shareholders Equity | 277.12B | 252.75B | 224.89B | 94.70B | 85.08B |
Source: Financial statements and regulatory filings
Cash Flow Statement
| fiscal_date | 2025-03-31 | 2024-03-31 | 2023-03-31 | 2022-03-31 | 2021-03-31 |
|---|---|---|---|---|---|
| Operating Activities Net Income | 14.29B | 12.98B | 6.43B | 7.72B | 8.46B |
| Operating Activities Stock Based Compensation | 1.37B | 1.01B | 1.38B | 1.26B | 1.06B |
| Operating Activities Other Non Cash Items | -1.30B | 14.25B | 3.56B | 771.00M | -298.00M |
| Operating Activities Accounts Receivable | 5.48B | -24.17B | 15.90B | -4.74B | -2.79B |
| Operating Activities Other Assets Liabilities | -2.06B | -11.54B | 16.44B | -4.78B | -4.55B |
| Operating Activities Operating Cash Flow | 17.78B | -7.49B | 43.72B | 231.00M | 1.88B |
| Investing Activities Capital Expenditures | -21.36B | -16.57B | -15.93B | -16.96B | -15.07B |
| Investing Activities Net Intangibles | -2.07B | -2.51B | -1.30B | -2.27B | -2.29B |
| Investing Activities Net Acquisitions | 18.25B | -5.53B | -122.17B | 0.00 | -1.02B |
| Investing Activities Purchase Of Investments | -102.42B | -53.34B | -187.14B | -77.94B | -96.99B |
| Investing Activities Sale Of Investments | 104.08B | 66.46B | 182.50B | 80.25B | 78.48B |
| Investing Activities Investing Cash Flow | -1.45B | -8.98B | -142.75B | -14.64B | -35.62B |
| Financing Activities Long Term Debt Issuance | 96.58B | 13.72B | 109.40B | 10.70B | 26.57B |
| Financing Activities Long Term Debt Payments | -97.70B | -27.68B | -281.00M | -10.95B | -7.34B |
| Financing Activities Short Term Debt Issuance | 6.85B | 1.25B | 15.04B | 3.46B | -345.00M |
| Financing Activities Common Stock Issuance | 104.00M | 307.00M | 12.66B | 428.00M | 8.07B |
| Financing Activities Common Dividends | -829.00M | -2.03B | -718.00M | N/A | N/A |
| Financing Activities Other Financing Charges | -15.81B | N/A | N/A | N/A | N/A |
| Financing Activities Financing Cash Flow | -10.81B | -14.44B | 135.46B | 3.64B | 26.86B |
| End Cash Position | 29.24B | 9.20B | 12.95B | 6.54B | 8.97B |
| Free Cash Flow | 17.18B | 10.22B | 1.26B | -7.48B | -5.87B |
| Financing Activities Common Stock Repurchase | N/A | 0.00 | -647.00M | -3.00M | -93.00M |
| Investing Activities Other Investing Activity | N/A | N/A | N/A | N/A | -1.02B |
Source: Financial statements and regulatory filings
Technical Analysis
Key Insights
- Biocon's current trend shows consolidation with price action fluctuating near the 50-day (₹369.94) and 200-day (₹372.89) moving averages, indicating a neutral to slightly bearish trend.
- Key support levels are identified around ₹318 (52-week low) and ₹370, while resistance is near the 52-week high of ₹425, marking critical price points for trend confirmation.
- The stock is trading slightly above the 50-day and 200-day moving averages but below short-term momentum levels, suggesting mixed signals from moving averages.
- Momentum indicators show RSI near neutral levels, MACD indicates weakening bullish momentum, and Stochastic oscillators reflect potential overbought conditions in the short term.
- Analysis across daily, weekly, and monthly timeframes reveals a cautious outlook with no clear breakout, highlighting consolidation phases and potential volatility.
- Current technical setup suggests scenarios of either a breakout above resistance levels leading to renewed upward momentum or a breakdown towards support levels signaling further consolidation or decline.
Trending News
1. Headline: Claire Mazumdar set to lead Biocon into its next growth era
Summary: Claire who had a chequered career, led business development and corporate strategy at Rheos Medicines, where she supported a major partnership with Roche.
Sentiment: neutral
2. Headline: Succession buzz lifts Biocon shares, but Kiran Mazumdar-Shaw says 'not imminent' | Stock Market News
Summary: For investors who have long discounted Biocon's stock relative to its pharmaceutical peers on succession concerns, Tuesday's news cycle offered a complicated picture. The surge suggests the market is hungry for clarity.
Sentiment: positive
3. Headline: Biocon shares surge as chairperson Kiran Mazumdar-Shaw reveals successor to Fortune India
Summary: Founder's niece, Claire Mazumdar, identified as the successor is founder-CEO of Bicara Therapeutics, a Nasdaq-listed firm incubated by Biocon.
Sentiment: positive
4. Headline: Who is Claire Mazumdar, Kiran Mazumdar-Shaw's chosen successor at Biocon? – Firstpost
Summary: Claire Mazumdar, 37, founder-CEO of Bicara Therapeutics, led its 2024 NASDAQ listing and $1.6 billion valuation. With degrees from MIT and Stanford, she is set to succeed Kiran Mazumdar-Shaw at Biocon, which recently merged its generics and biologics businesses amid a strategic overhaul
Sentiment: neutral
5. Headline: Kiran Mazumdar-Shaw picks niece Claire Mazumdar as successor at Biocon: Report - The Times of India
Summary: India Business News: Kiran Mazumdar-Shaw, Biocon’s founder and chairperson, has reportedly put in place a structured succession plan for the biotechnology firm, identifyin.
Sentiment: neutral
Recent Updates
News Summary
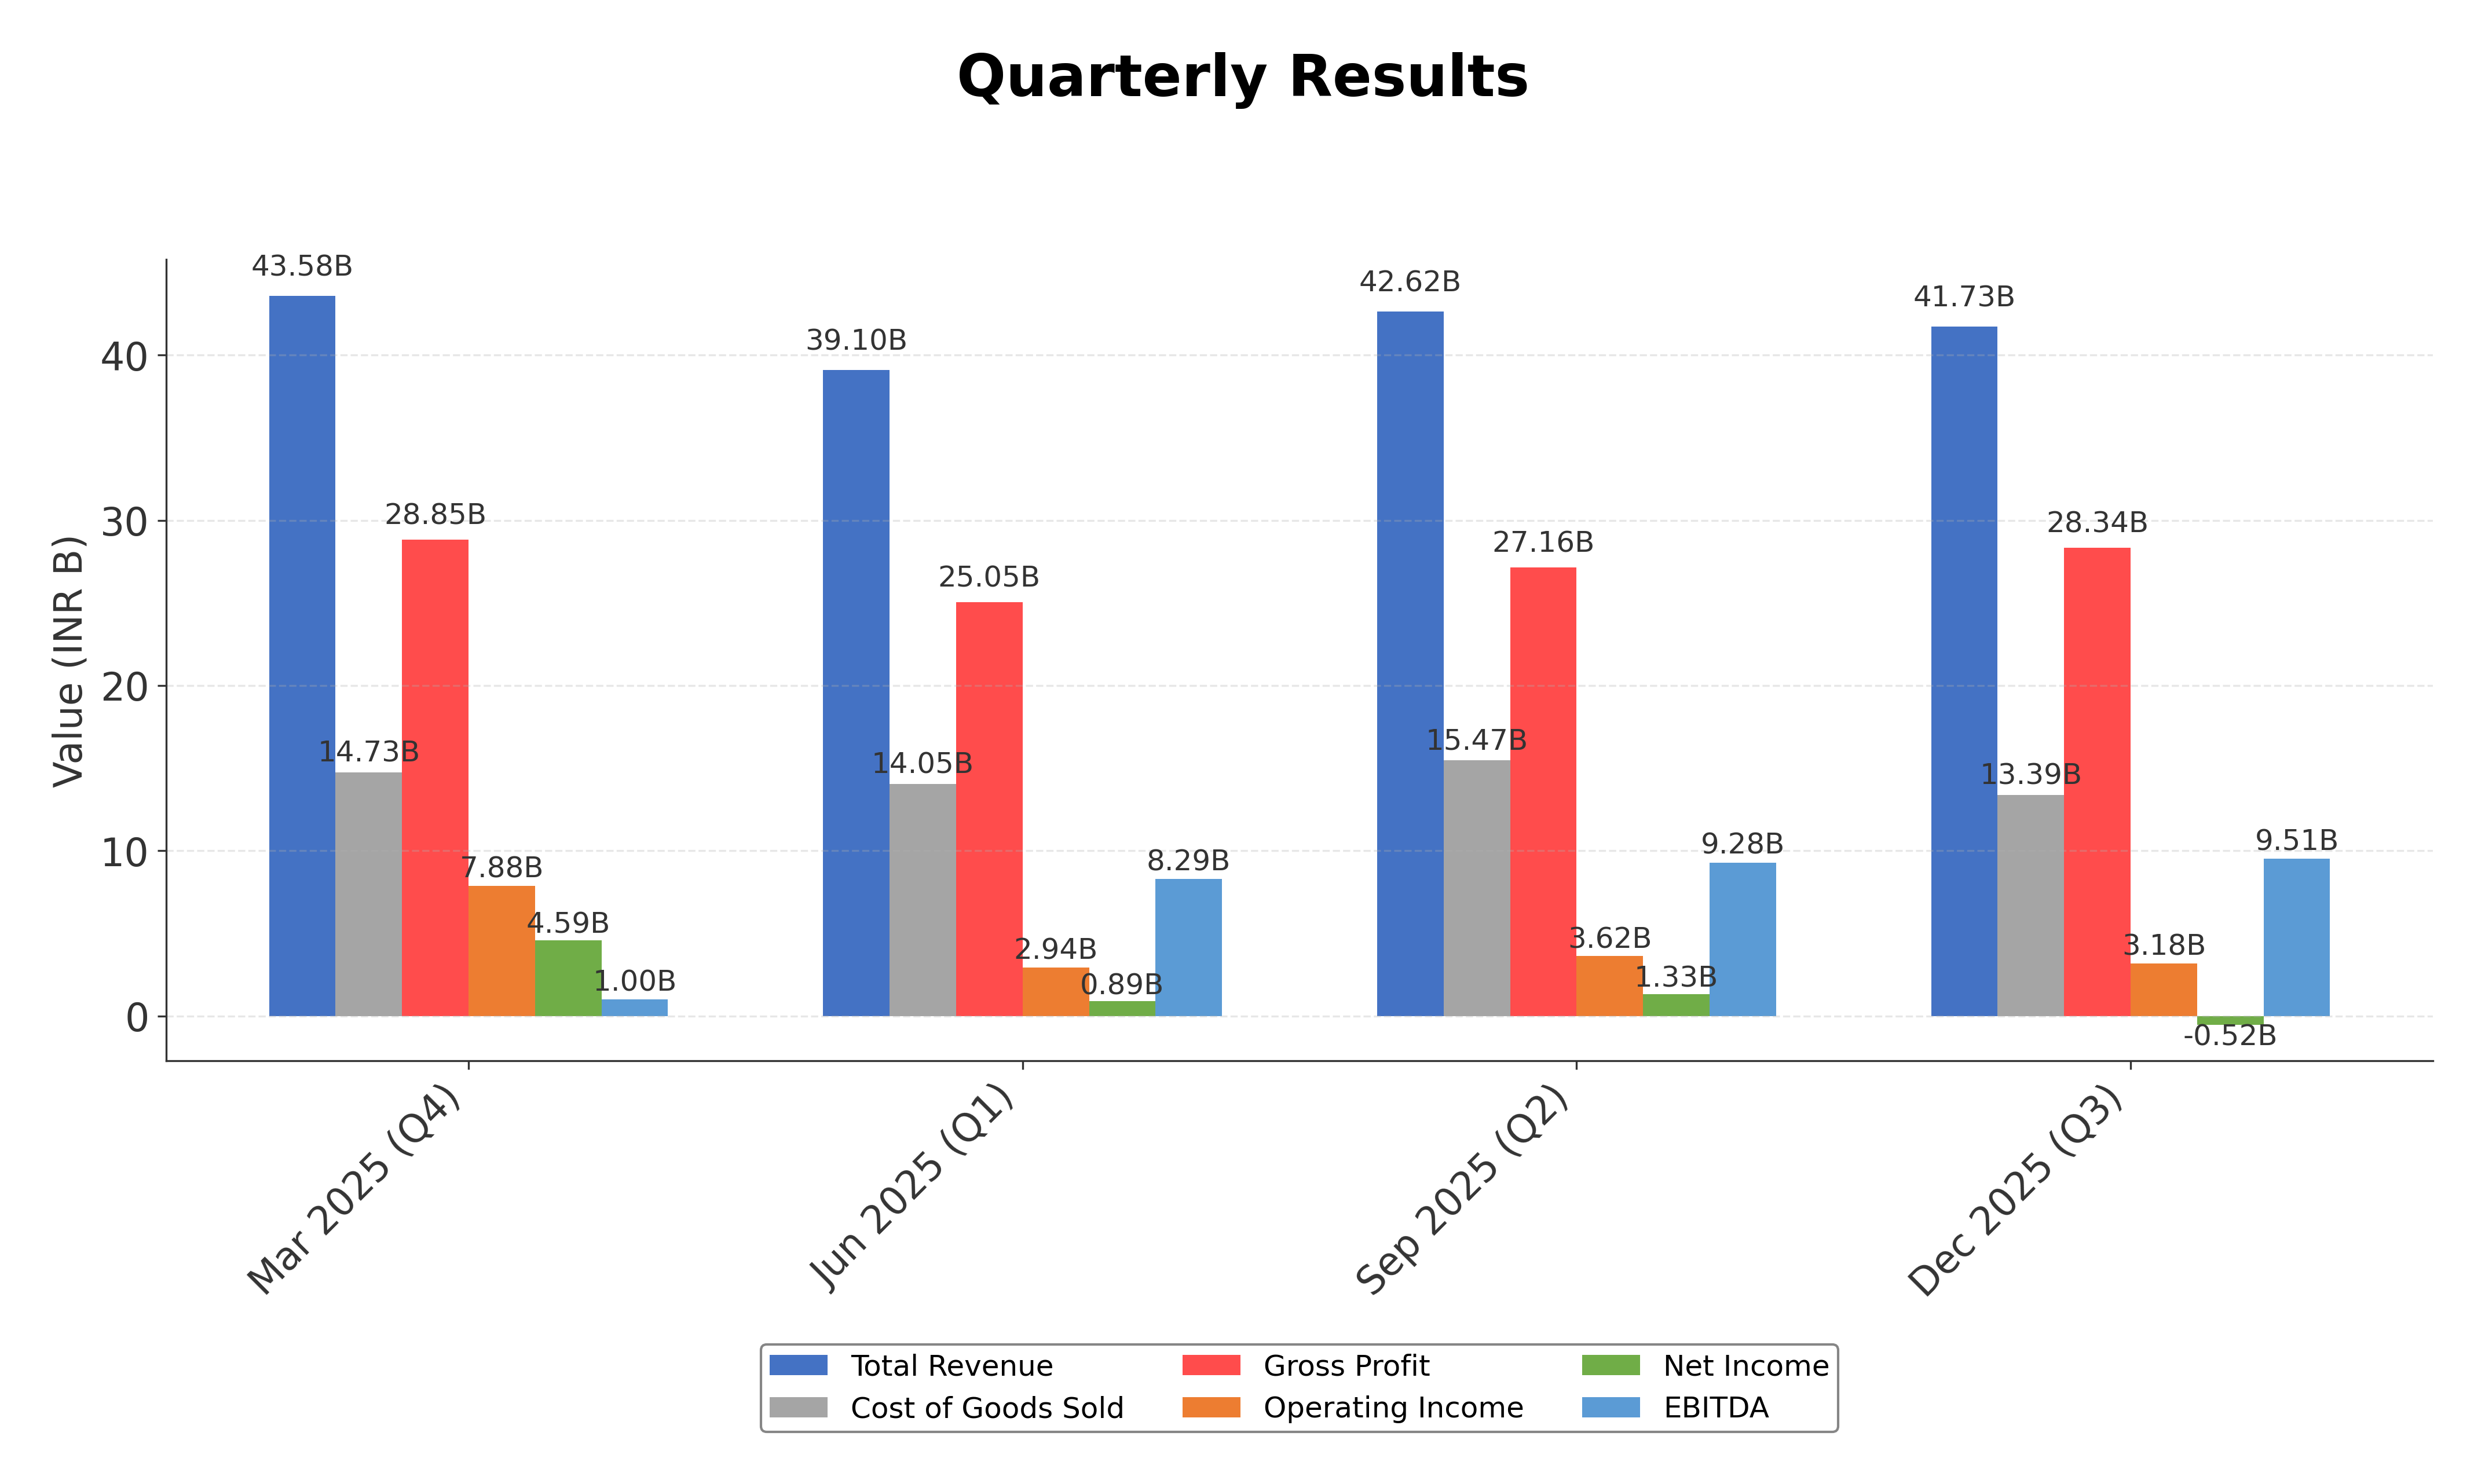
As of 2025-08-07. Biocon Limited announced its consolidated financial results for the fiscal first quarter ended June 30, 2025, reporting operating revenue of INR 39.42 billion, a 15% increase year-over-year, and EBITDA of INR 8.29 billion, up 19%. The company continues to demonstrate robust operational performance with sustained investor confidence, as evidenced by cumulative capital raised through two Qualified Institutional Placements (QIPs) totaling approximately USD 1 billion within eight months. Recent disclosures and investor communications emphasize ongoing corporate governance, shareholding transparency, and strategic financial management. These developments underscore Biocon's commitment to growth and operational excellence amid a dynamic biopharmaceutical landscape.
News Sentiment
The overall sentiment from recent updates is predominantly neutral with a slight positive tilt driven by strong quarterly financial performance and successful capital raising activities. There is no indication of adverse regulatory or operational issues, and leadership continuity plans have been communicated clearly, supporting market confidence. The absence of negative news and steady financial disclosures contribute to a stable outlook, although cautious monitoring of execution risks remains prudent. This balanced sentiment reflects a company focused on consolidating gains while navigating sectoral challenges.
Source List
- https://www.biocon.com/biocon-q1fy26-revenue/
- https://www.biocon.com/biocon-q3fy26-revenue/
- https://www.biocon.com/news-biocon/press-releases/
Analytical Overview
Analysis Summary
Biocon's valuation metrics, including a trailing P/E of 73.34 and forward P/E of 39.53, are elevated relative to the biotechnology industry average P/E of approximately 73.34, indicating the market's premium pricing based on growth expectations. The company's revenue growth rate of 9.2% quarterly and positive cash flow trends, with operating cash flow of INR 17.78 billion and free cash flow of INR 10.13 billion, suggest a stable growth trajectory supported by operational efficiency. Financial health shows a moderate debt-to-equity ratio of 0.50 and a current ratio of 1.16, reflecting manageable leverage and adequate liquidity. Sector-specific challenges include regulatory scrutiny and competitive pressures in biopharmaceuticals, while opportunities arise from expanding biosimilar markets and innovation pipelines. Considering India's regulatory environment and evolving healthcare demands, Biocon's strategic positioning benefits from its strong R&D and market presence.
Overall Business and Market Assessment
Supporting Factors: Key supporting factors include Biocon's robust revenue growth and cash flow generation, a clear succession plan providing leadership stability, and a strong market position in biotechnology. Risks to monitor involve the company's relatively high valuation multiples, moderate profitability margins, and financial leverage levels. The appropriate investment timeframe is medium to long-term, allowing for the realization of strategic initiatives and operational improvements. Overall, Biocon presents a balanced profile with growth potential tempered by valuation and execution considerations.
Risk Factors: No data
SWOT Analysis
Strengths
- Strong R&D capabilities driving innovative biopharmaceutical products.
- Robust cash flow generation with operating cash flow of INR 17.78 billion.
- Established global presence and strategic partnerships enhancing market reach.
- Clear succession plan ensuring leadership continuity.
Weaknesses
- Relatively low net profit margin of 3.6% indicating limited profitability.
- High trailing P/E ratio of 73.34 reflecting premium valuation.
- Moderate return on equity at 3.7% suggesting room for improved capital efficiency.
- Significant debt level with a debt-to-equity ratio of 0.50.
Opportunities
- Growing global demand for biosimilars and affordable biologics.
- Expansion into new therapeutic areas and emerging markets.
- Potential benefits from strategic collaborations and acquisitions.
- Favorable demographic trends increasing healthcare consumption in India.
Threats
- Regulatory challenges and compliance risks in global markets.
- Intense competition from global and domestic biopharmaceutical firms.
- Execution risks related to growth initiatives and product launches.
- Economic volatility impacting healthcare spending and investment.
Company Description
Biocon Ltd. is a prominent biopharmaceutical company based in India, specializing in the development and production of innovative and cost-effective medical therapies. The company's primary focus lies in biopharmaceuticals, including biologics, biosimilars, complex active pharmaceutical ingredients (APIs), and branded formulations. Serving various sectors, Biocon operates in oncology, diabetes, and autoimmune diseases, where it delivers health solutions through its research-driven approach and state-of-the-art manufacturing facilities. As an integral player in the global pharmaceuticals market, Biocon emphasizes leveraging its robust R&D capabilities to drive product innovation and affordability across multiple healthcare systems worldwide. The company's strategic collaborations and partnerships reinforce its role in advancing accessible healthcare, contributing significantly to the biopharmaceutical industry's growth and evolution. Founded in 1978, Biocon Ltd. has expanded its footprint beyond the Indian market, establishing a significant international presence and playing a crucial role in enhancing global healthcare outcomes.