
Biocon Ltd (BIOCON)
Stock Analysis Report
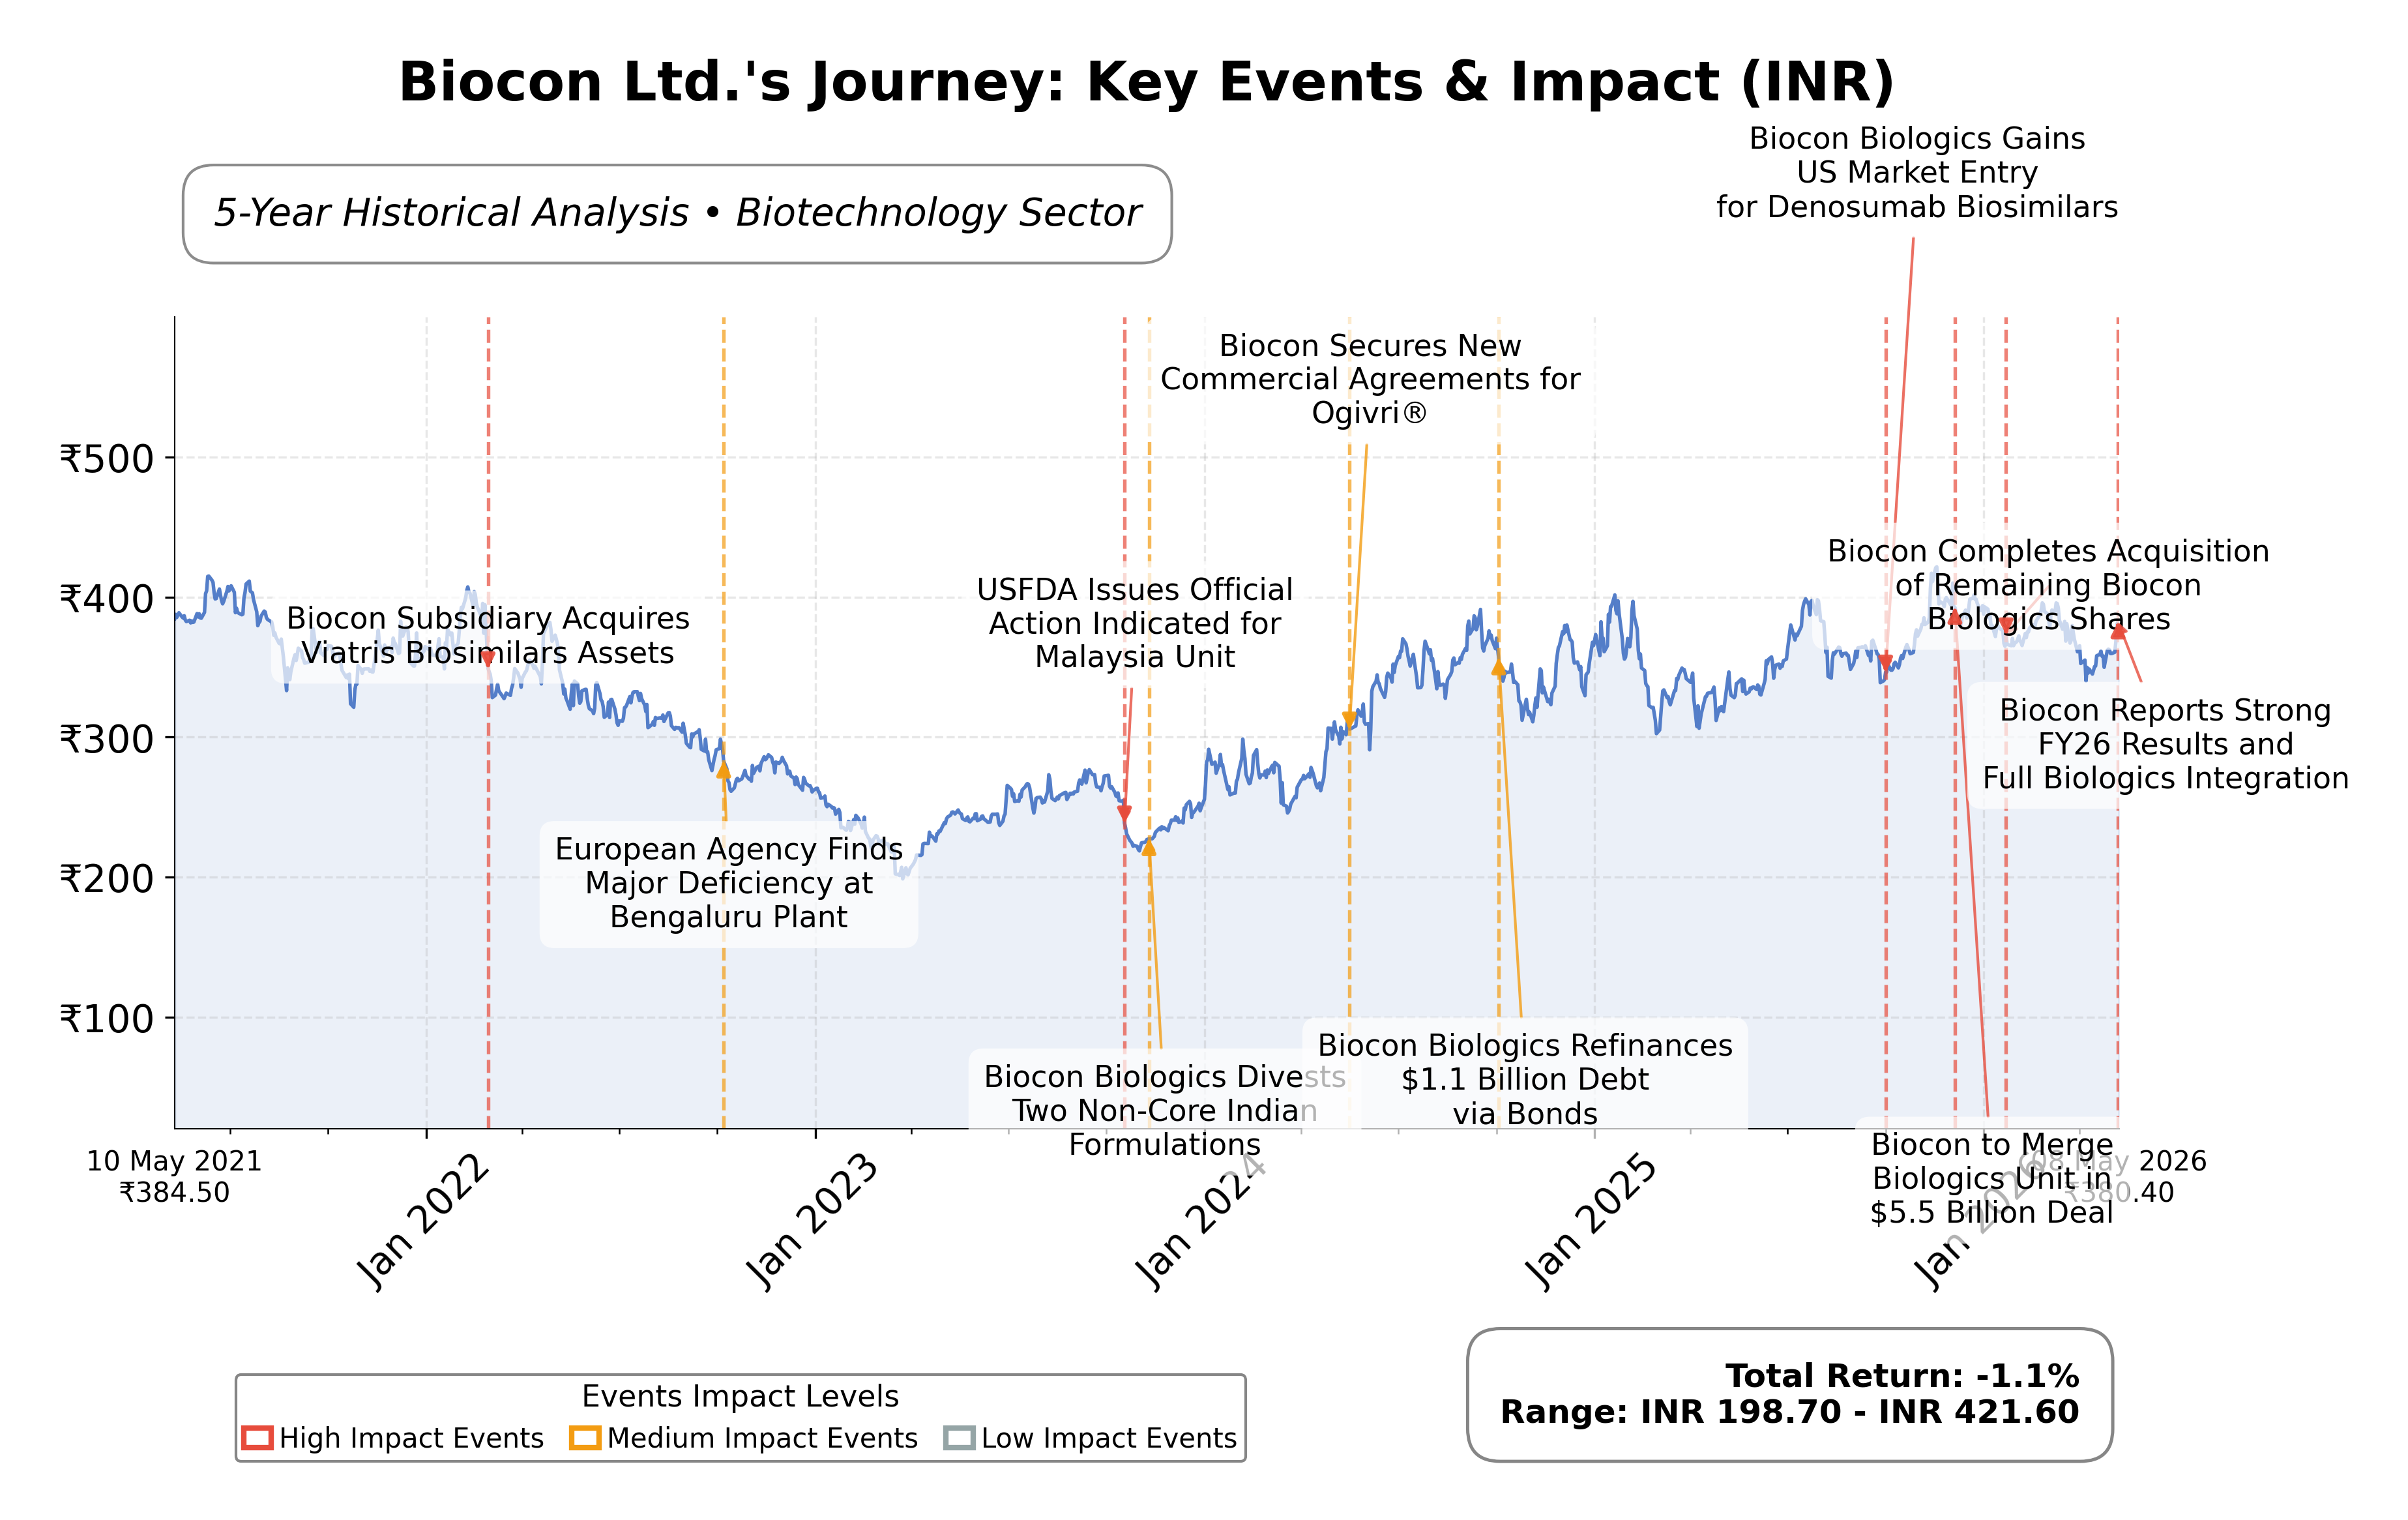
Stock Journey
Key Positives and Key Risks
Pros
- Revenue growth of 9.2% quarterly and 13% annually indicates strong top-line momentum.
- Robust cash reserves of INR 61 billion support financial flexibility and operational needs.
- PEG ratio of 0.18 suggests attractive valuation relative to earnings growth potential.
Cons
- Net profit margin of 3.6% and a 63% year-on-year Q4 profit decline highlight profitability challenges.
- High trailing P/E ratio of 73.34 reflects premium pricing and potential valuation risk.
- Total debt to equity ratio of 50.02% indicates moderate leverage that could impact financial stability.
Disclosure: This information is for general awareness and does not constitute investment advice
Report Summary
Biocon Ltd. is a leading Indian biopharmaceutical company listed on the NSE, operating within the healthcare sector, specifically the biotechnology industry. The company focuses on developing and manufacturing innovative and affordable medical therapies, including biologics, biosimilars, complex APIs, and branded formulations. Its key therapeutic areas include oncology, diabetes, and autoimmune diseases. Biocon has a significant international presence and leverages robust R&D capabilities to maintain its competitive position in the global pharmaceuticals market.
Financially, Biocon reported trailing twelve months (TTM) revenue of approximately INR 168.27 billion, with a gross margin of 67.9%, operating margin of 7.6%, and a net profit margin of 3.6%. The return on equity (ROE) and return on assets (ROA) stand at 3.66% and 1.72%, respectively, indicating moderate profitability and asset efficiency. The company generated an EBITDA of INR 28.08 billion and operating cash flow of INR 17.78 billion over the TTM period, reflecting operational cash generation capacity.
Valuation metrics show a trailing P/E ratio of 73.34 and a forward P/E of 39.53, with a price-to-book ratio of 1.72 and an EV/EBITDA multiple of 19.29. The market capitalization is approximately INR 582.39 billion. The stock price currently trades near INR 378.70, within a 52-week range of INR 317.90 to INR 424.95, suggesting it is positioned closer to the upper end of its recent trading range. The PEG ratio of 0.18 indicates the stock’s price relative to its earnings growth rate.
Biocon’s strengths include its strong cash position of over INR 61 billion, a current ratio above 1.15 indicating adequate liquidity, and a diversified product portfolio with leadership in biosimilars and generics. The company has recently integrated its biosimilars and generics businesses to enhance scale and operational efficiency. Key risks include regulatory challenges, competitive pressures in the biotechnology sector, and the impact of exceptional charges on profitability. Recent strategic actions include leadership appointments and a focus on profitability enhancement.
Technically, the stock is trading near its 50-day and 200-day moving averages, with moderate momentum indicators suggesting a consolidative phase. Recent news highlights mixed financial results with revenue growth but profit declines due to exceptional costs. Overall, the data suggests a cautious stance with potential for accumulation as the company navigates integration and market challenges, warranting close monitoring of upcoming financial performance and operational execution.
Company and Industry Overview
Company Basics
Price Performance
Company Size
Shareholding Pattern
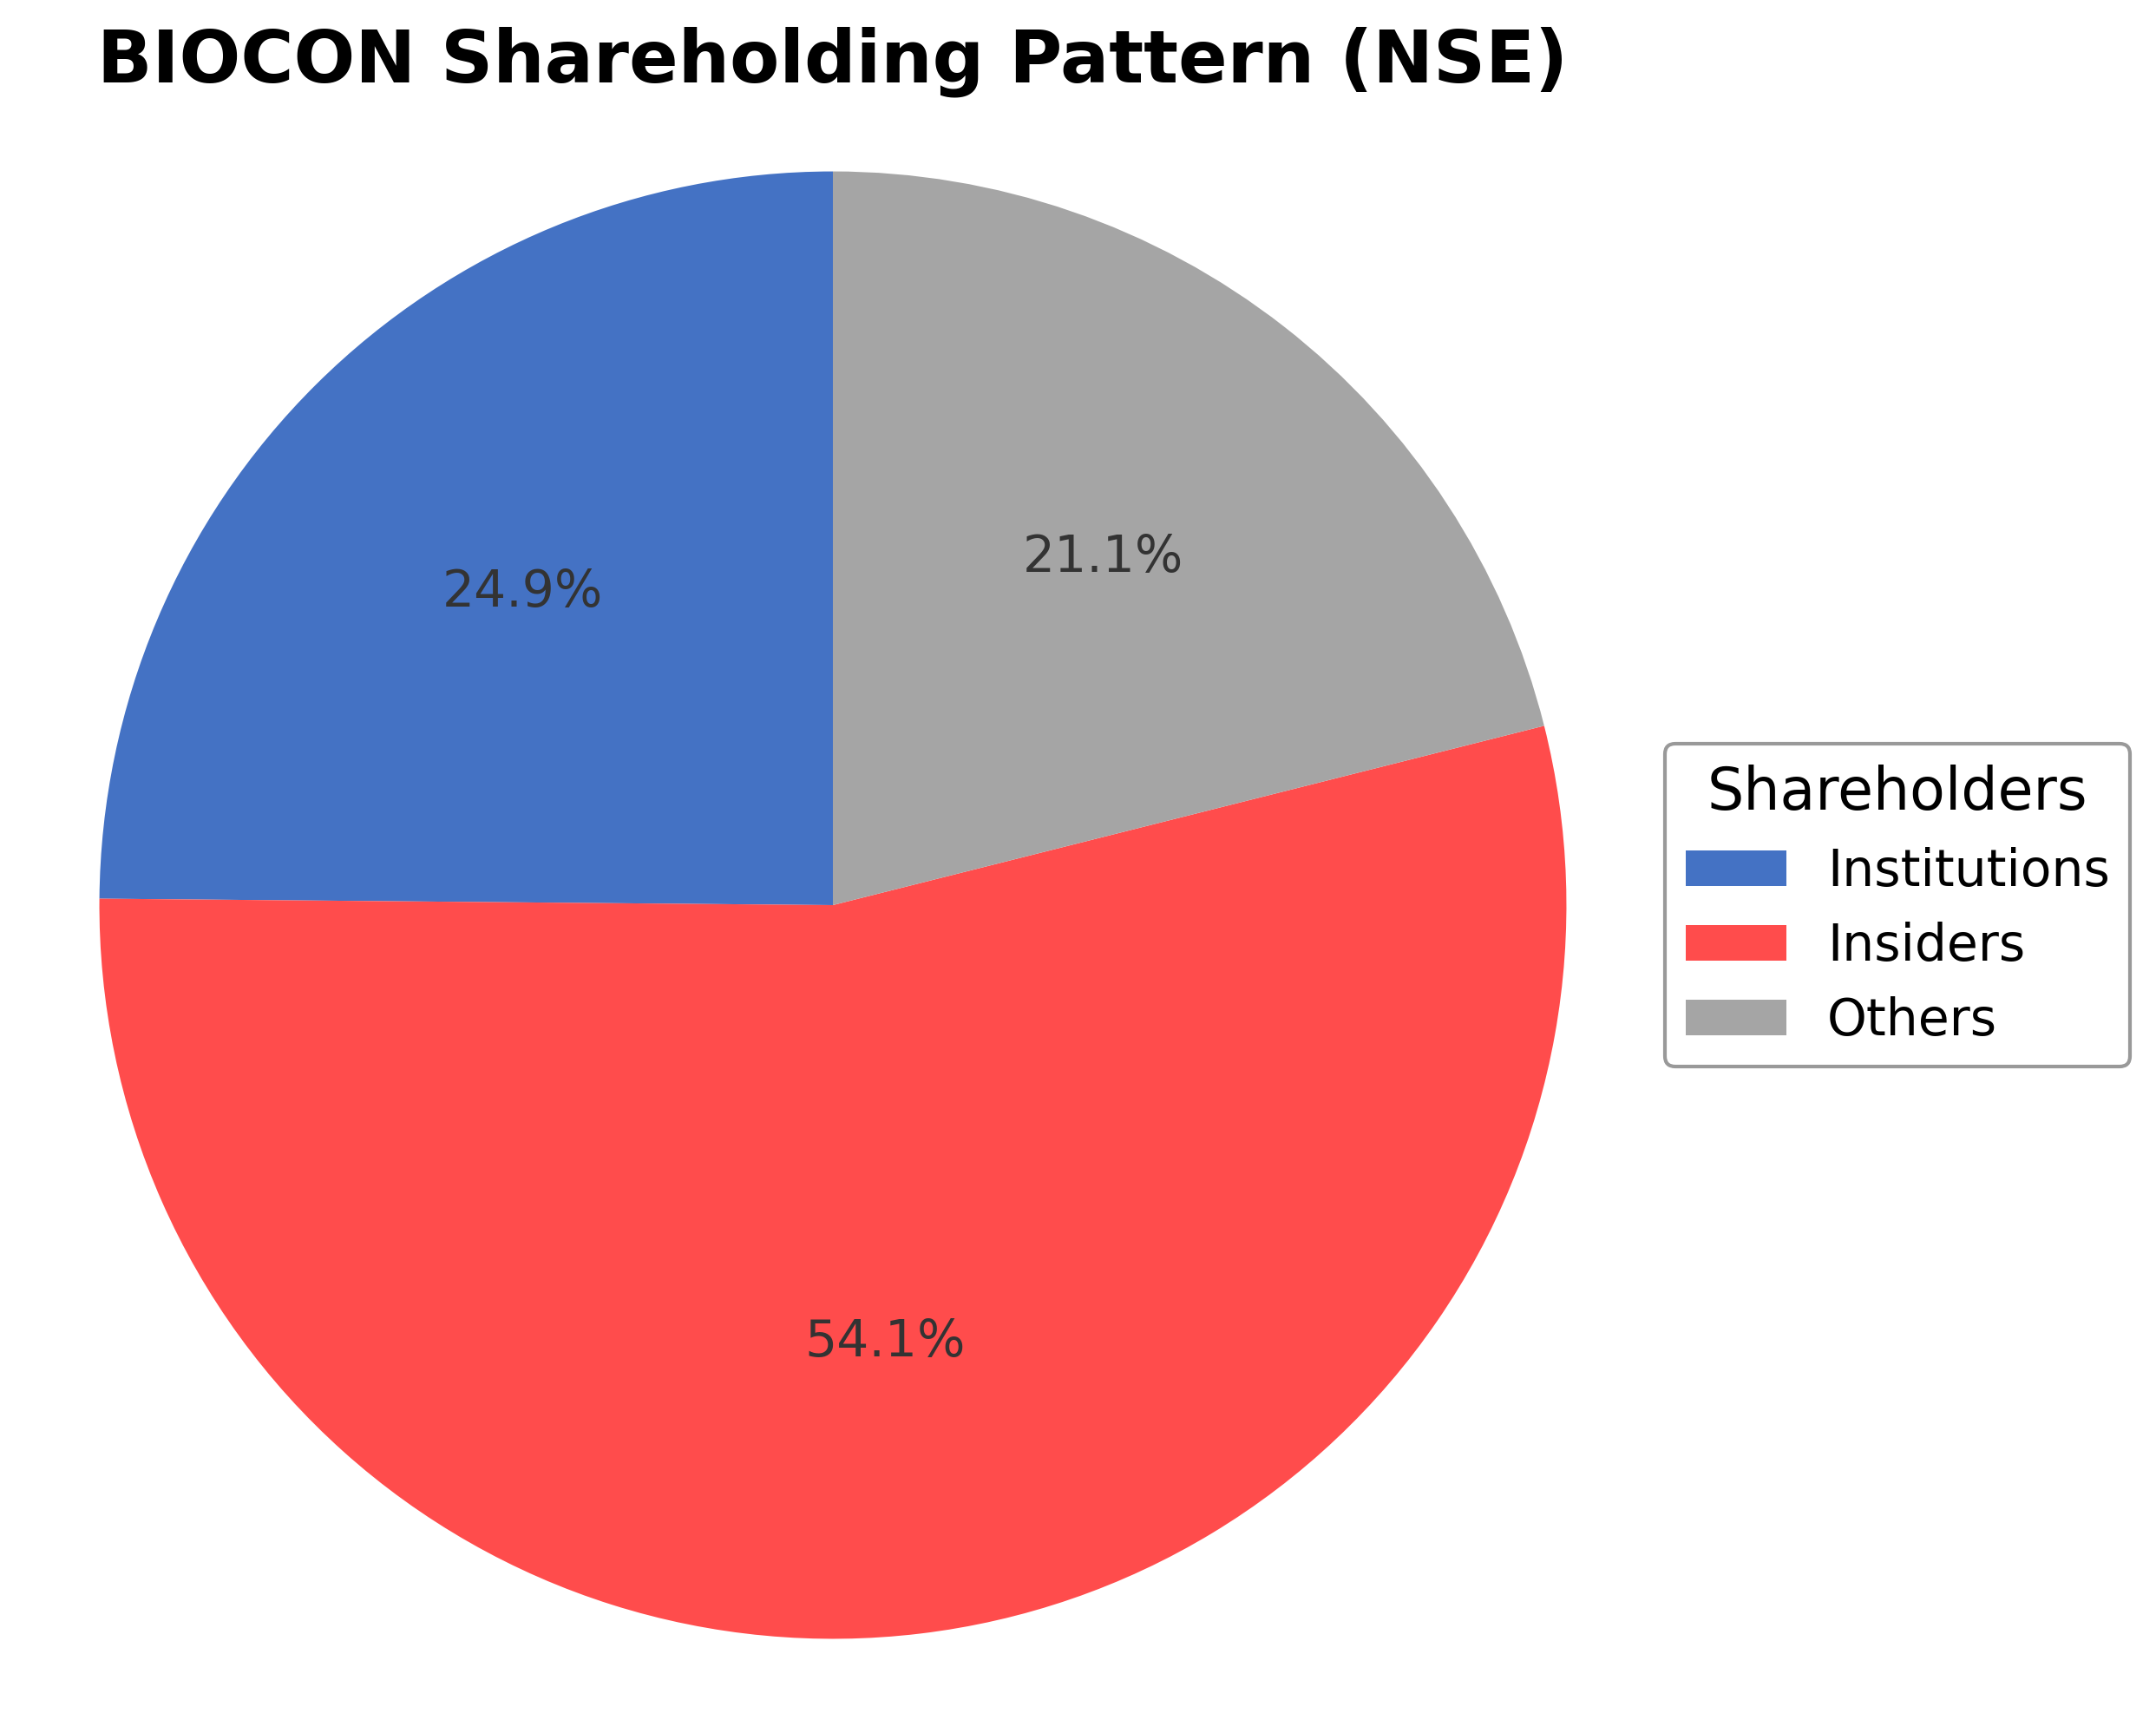
Biocon Ltd.'s ownership structure is predominantly held by insiders, including executives and board members, accounting for approximately 54.07% of shares. Institutional investors hold a significant 24.86%, comprising mutual funds, pension funds, and asset managers, while the remaining 21.07% is held by public shareholders, including retail investors and employee stock plans. Over the past 12-24 months, institutional holdings have shown moderate accumulation, reflecting growing confidence from major funds. This shareholding pattern indicates stable governance with strong promoter control and active institutional participation, which supports strategic decision-making and long-term corporate initiatives within the biotechnology industry.
Sector and Industry Analysis
The global biopharmaceutical sector, encompassing biosimilars, biologics, and specialty pharmaceuticals, continues to expand driven by rising demand for cost-effective therapies and an aging population. Market size is projected to grow steadily, with companies like Biocon, Roche, Merck & Co., Lupin, and Cipla leading the competitive landscape. Biocon’s trailing twelve-month revenue stands at approximately $1.9 billion, reflecting its significant presence in the biosimilars segment, which is expected to increase from 50% in FY23 to 58% in FY25.
Industry trends highlight a shift towards biosimilars development across therapeutic areas such as diabetology, oncology, and immunology, with innovation and patenting activity intensifying. Competitive dynamics are marked by increasing price erosion risks and regulatory scrutiny, which act as barriers to entry for smaller players. Strategic alliances, mergers and acquisitions, and capital raising are common as companies seek scale and diversification, while execution risks related to large deals, such as Biocon’s partnership with Viatris, remain critical factors.
The regulatory environment is stringent, with ongoing challenges related to price controls, intellectual property rights, and compliance with evolving standards under the Companies Act, 2013, and related frameworks. Regulatory issues contribute to margin sensitivity and affect market access, particularly in biosimilars and specialty drugs. Despite these challenges, moderate growth is anticipated as firms adapt to regulatory demands and leverage innovation to sustain valuation stability.
Note: Analysis synthesized from industry research, market reports, and regulatory filings. Information is subject to change based on market conditions.
Financial Ratios Dashboard
Illustrative Scenario Analysis
DCF Assumptions:
Method: Two-Stage EPS-Priority Model
Financials
Peer Analysis
| Company Name | Market Cap | P/E Ratio | P/B Ratio | EV/EBITDA | Price to CFO |
|---|---|---|---|---|---|
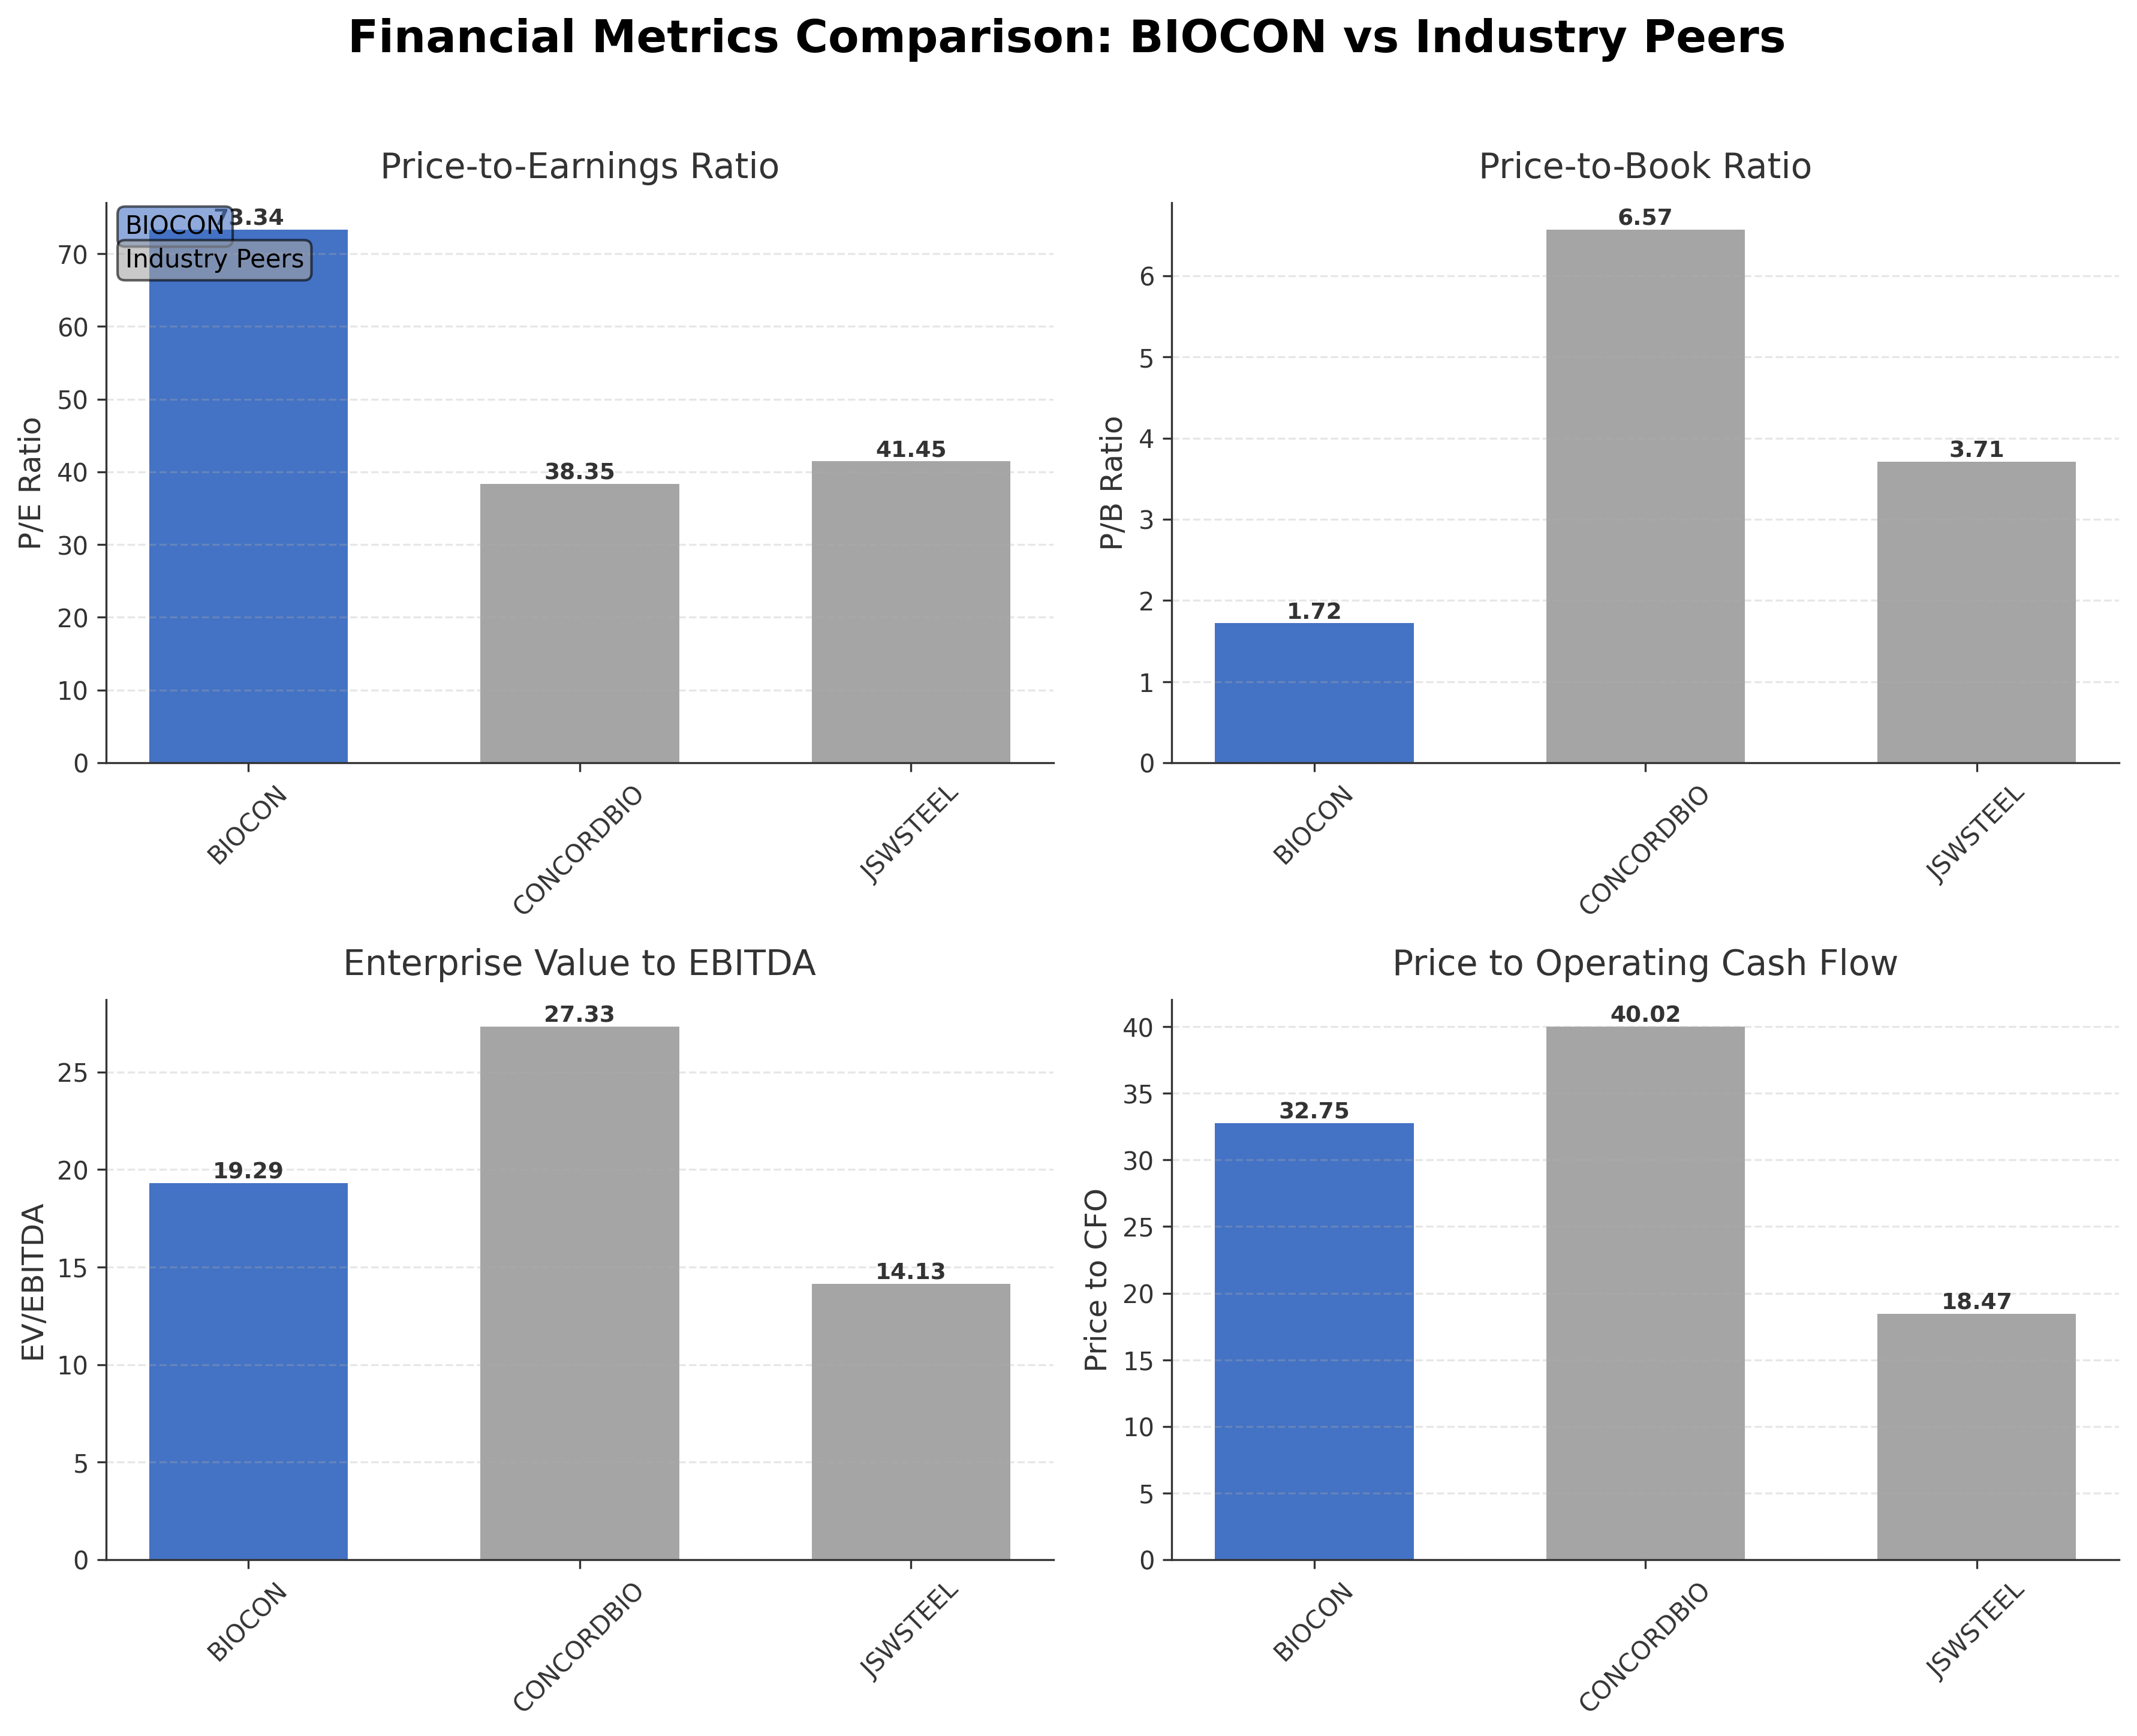
| Biocon Ltd. | ₹582.39B | 73.34 | 1.72 | 19.29 | 32.75 |
| Concord Biotech Ltd. | ₹119.47B | 38.35 | 6.57 | 27.33 | 40.02 |
| JSW Steel Ltd. | ₹3.09T | 41.45 | 3.71 | 14.13 | 18.47 |
Comparison Analysis: Biocon Ltd. exhibits a higher P/E ratio of 73.34 relative to its peers Concord Biotech and JSW Steel, which trade at 38.35 and 41.45 respectively, indicating a premium valuation possibly due to growth expectations. Its price-to-book ratio of 1.72 is lower than Concord Biotech's 6.57, suggesting a more conservative book valuation. The EV/EBITDA multiple of 19.29 is moderate compared to Concord Biotech's 27.33 and JSW Steel's 14.13, reflecting balanced operational profitability. Biocon's price to CFO ratio at 32.75 is higher than JSW Steel's 18.47 but lower than Concord Biotech's 40.02, indicating mixed cash flow valuation metrics. Return on equity at 0.04 is comparable to JSW Steel but lower than Concord Biotech, highlighting room for improvement in shareholder returns.
Financial Metrics Comparison with Peers
Financial Statements
Comprehensive financial data including income, balance sheet, and cash flow metrics
Income Statement
| fiscal_date | 2025-03-31 | 2024-03-31 | 2023-03-31 | 2022-03-31 | 2021-03-31 |
|---|---|---|---|---|---|
| Sales | 150.52B | 141.96B | 109.34B | 80.25B | 70.07B |
| Cost Of Goods | 51.98B | 49.07B | 36.67B | 27.24B | 22.45B |
| Gross Profit | 98.54B | 92.89B | 72.67B | 53.01B | 47.62B |
| Operating Expense Research And Development | 6.34B | 7.96B | 8.82B | 3.10B | 5.31B |
| Operating Expense Selling General And Administrative | 12.72B | 8.86B | 4.87B | 4.31B | 4.89B |
| Operating Expense Other Operating Expenses | 16.58B | 22.13B | 15.92B | 9.40B | 8.03B |
| Operating Income | 16.26B | 13.51B | 12.35B | 10.68B | 6.05B |
| Non Operating Interest Income | 1.09B | 1.61B | 1.12B | 1.12B | 770.00M |
| Non Operating Interest Expense | 8.88B | 9.74B | 4.19B | 676.00M | 577.00M |
| Pretax Income | 18.87B | 15.25B | 8.97B | 9.83B | 10.68B |
| Income Tax | 4.57B | 2.27B | 2.54B | 2.12B | 2.21B |
| Net Income | 14.29B | 12.98B | 6.43B | 7.72B | 8.46B |
| Eps Basic | 8.46 | 8.55 | 3.88 | 5.44 | 6.24 |
| Eps Diluted | 8.46 | 8.54 | 3.87 | 5.42 | 6.19 |
| Basic Shares Outstanding | 1.20B | 1.20B | 1.19B | 1.19B | 1.19B |
| Diluted Shares Outstanding | 1.20B | 1.20B | 1.19B | 1.19B | 1.19B |
| Ebit | 27.74B | 25.00B | 13.16B | 10.51B | 11.25B |
| Ebitda | 33.60B | 30.32B | 25.29B | 19.64B | 16.66B |
| Net Income Continuous Operations | 14.29B | 12.98B | 6.43B | 7.72B | 8.46B |
| Minority Interests | -4.16B | -2.75B | -1.80B | -1.23B | -1.06B |
| Preferred Stock Dividends | 0.00 | 0.00 | 0.00 | 0.00 | 0.00 |
Source: Financial statements and regulatory filings
Balance Sheet
| fiscal_date | 2025-03-31 | 2024-03-31 | 2023-03-31 | 2022-03-31 | 2021-03-31 |
|---|---|---|---|---|---|
| Cash And Cash Equivalents | 32.27B | 12.33B | 13.23B | 6.63B | 9.53B |
| Accounts Receivable | 54.88B | 62.31B | 35.73B | 20.58B | 15.03B |
| Total Assets | 587.97B | 560.71B | 520.43B | 203.94B | 185.22B |
| Total Liabilities | 310.85B | 307.96B | 295.54B | 109.24B | 100.15B |
| Long Term Debt | 129.44B | 134.25B | 155.00B | 42.20B | 30.76B |
| Shareholders Equity | 277.12B | 252.75B | 224.89B | 94.70B | 85.08B |
Source: Financial statements and regulatory filings
Cash Flow Statement
| fiscal_date | 2025-03-31 | 2024-03-31 | 2023-03-31 | 2022-03-31 | 2021-03-31 |
|---|---|---|---|---|---|
| Operating Activities Net Income | 14.29B | 12.98B | 6.43B | 7.72B | 8.46B |
| Operating Activities Stock Based Compensation | 1.37B | 1.01B | 1.38B | 1.26B | 1.06B |
| Operating Activities Other Non Cash Items | -1.30B | 14.25B | 3.56B | 771.00M | -298.00M |
| Operating Activities Accounts Receivable | 5.48B | -24.17B | 15.90B | -4.74B | -2.79B |
| Operating Activities Other Assets Liabilities | -2.06B | -11.54B | 16.44B | -4.78B | -4.55B |
| Operating Activities Operating Cash Flow | 17.78B | -7.49B | 43.72B | 231.00M | 1.88B |
| Investing Activities Capital Expenditures | -21.36B | -16.57B | -15.93B | -16.96B | -15.07B |
| Investing Activities Net Intangibles | -2.07B | -2.51B | -1.30B | -2.27B | -2.29B |
| Investing Activities Net Acquisitions | 18.25B | -5.53B | -122.17B | 0.00 | -1.02B |
| Investing Activities Purchase Of Investments | -102.42B | -53.34B | -187.14B | -77.94B | -96.99B |
| Investing Activities Sale Of Investments | 104.08B | 66.46B | 182.50B | 80.25B | 78.48B |
| Investing Activities Investing Cash Flow | -1.45B | -8.98B | -142.75B | -14.64B | -35.62B |
| Financing Activities Long Term Debt Issuance | 96.58B | 13.72B | 109.40B | 10.70B | 26.57B |
| Financing Activities Long Term Debt Payments | -97.70B | -27.68B | -281.00M | -10.95B | -7.34B |
| Financing Activities Short Term Debt Issuance | 6.85B | 1.25B | 15.04B | 3.46B | -345.00M |
| Financing Activities Common Stock Issuance | 104.00M | 307.00M | 12.66B | 428.00M | 8.07B |
| Financing Activities Common Dividends | -829.00M | -2.03B | -718.00M | N/A | N/A |
| Financing Activities Other Financing Charges | -15.81B | N/A | N/A | N/A | N/A |
| Financing Activities Financing Cash Flow | -10.81B | -14.44B | 135.46B | 3.64B | 26.86B |
| End Cash Position | 29.24B | 9.20B | 12.95B | 6.54B | 8.97B |
| Free Cash Flow | 17.18B | 10.22B | 1.26B | -7.48B | -5.87B |
| Financing Activities Common Stock Repurchase | N/A | 0.00 | -647.00M | -3.00M | -93.00M |
| Investing Activities Other Investing Activity | N/A | N/A | N/A | N/A | -1.02B |
Source: Financial statements and regulatory filings
Technical Analysis
Key Insights
- The current trend shows consolidation with the stock trading near the 50-day (₹369.94) and 200-day (₹372.89) moving averages, indicating a neutral price action pattern.
- Key support levels are observed near ₹318, the 52-week low, while resistance is noted around ₹425, the 52-week high.
- The stock price is slightly above the 50-day and 200-day moving averages, suggesting a potential for stability but limited upward momentum currently.
- Momentum indicators show RSI in a neutral range, MACD near the signal line, and stochastic oscillators indicating no strong directional bias.
- Across daily, weekly, and monthly timeframes, the stock exhibits sideways movement with no clear breakout or breakdown signals.
- Potential market scenarios include a range-bound phase with possible volatility near support and resistance levels, pending catalyst-driven moves.
Trending News
1. Headline: Biosimilar ramp-up to drive growth for Biocon in FY27 | Company Business News
Summary: Recently launched biosimilars across markets have begun scaling up and will gather momentum through the year, particularly in the second half of FY27, the company's top executive said
Sentiment: positive
2. Headline: Biocon reports 63% YoY fall in Q4 profit, final dividend of Rs. 0.50 recommended - The Economic Times
Summary: Biocon's fourth-quarter net profit saw a significant drop of 63 percent year-on-year. This decline was attributed to exceptional charges impacting the company's financials. However, core businesses demonstrated growth. The company successfully integrated its biosimilars and generics operations.
Sentiment: negative
3. Headline: Biocon Shares Rise 4% Despite 57% Drop in Net Profit; Full Q4 Numbers Reviewed | Meyka
Summary: Stock NewsBusinessExecutive TradesInsights & GuidesInvestingEducationMarketMarket NewsTechnical IndicatorsTechnology ... On May 8, 2026, Biocon Ltd shares rose nearly 4% in early trade after its Q4 FY26 results for the quarter ended March 2026 surprised the market.
Sentiment: positive
4. Headline: Biocon posts PAT of Rs 126 crore in Q4 FY26; EBIDTA margin stands at 23% | Capital Market News - Business Standard
Summary: Biocon is a global biopharma company dedicated to improving affordable access to therapies for chronic conditions such as diabetes, cancer, and autoimmune diseases. The scrip advanced 2.43% to currently trade at Rs 391.90 on the BSE. ... Don't miss the most important news and views of the day. Get them on our Telegram channel ... Stock ...
Sentiment: positive
5. Headline: Biocon Q4: Net profit slumps 57% to Rs 198 crore amid higher costs in FY26.
Summary: Biocon profit: Biocon posted a 56.8% fall in Q4 net profit to Rs 198.6 crore after exceptional costs linked to labour code changes. Revenue rose to Rs 4,516 crore, while Kiran Mazumdar-Shaw flagged resilient growth despite global headwinds. in Q4
Sentiment: negative
Recent Updates
News Summary
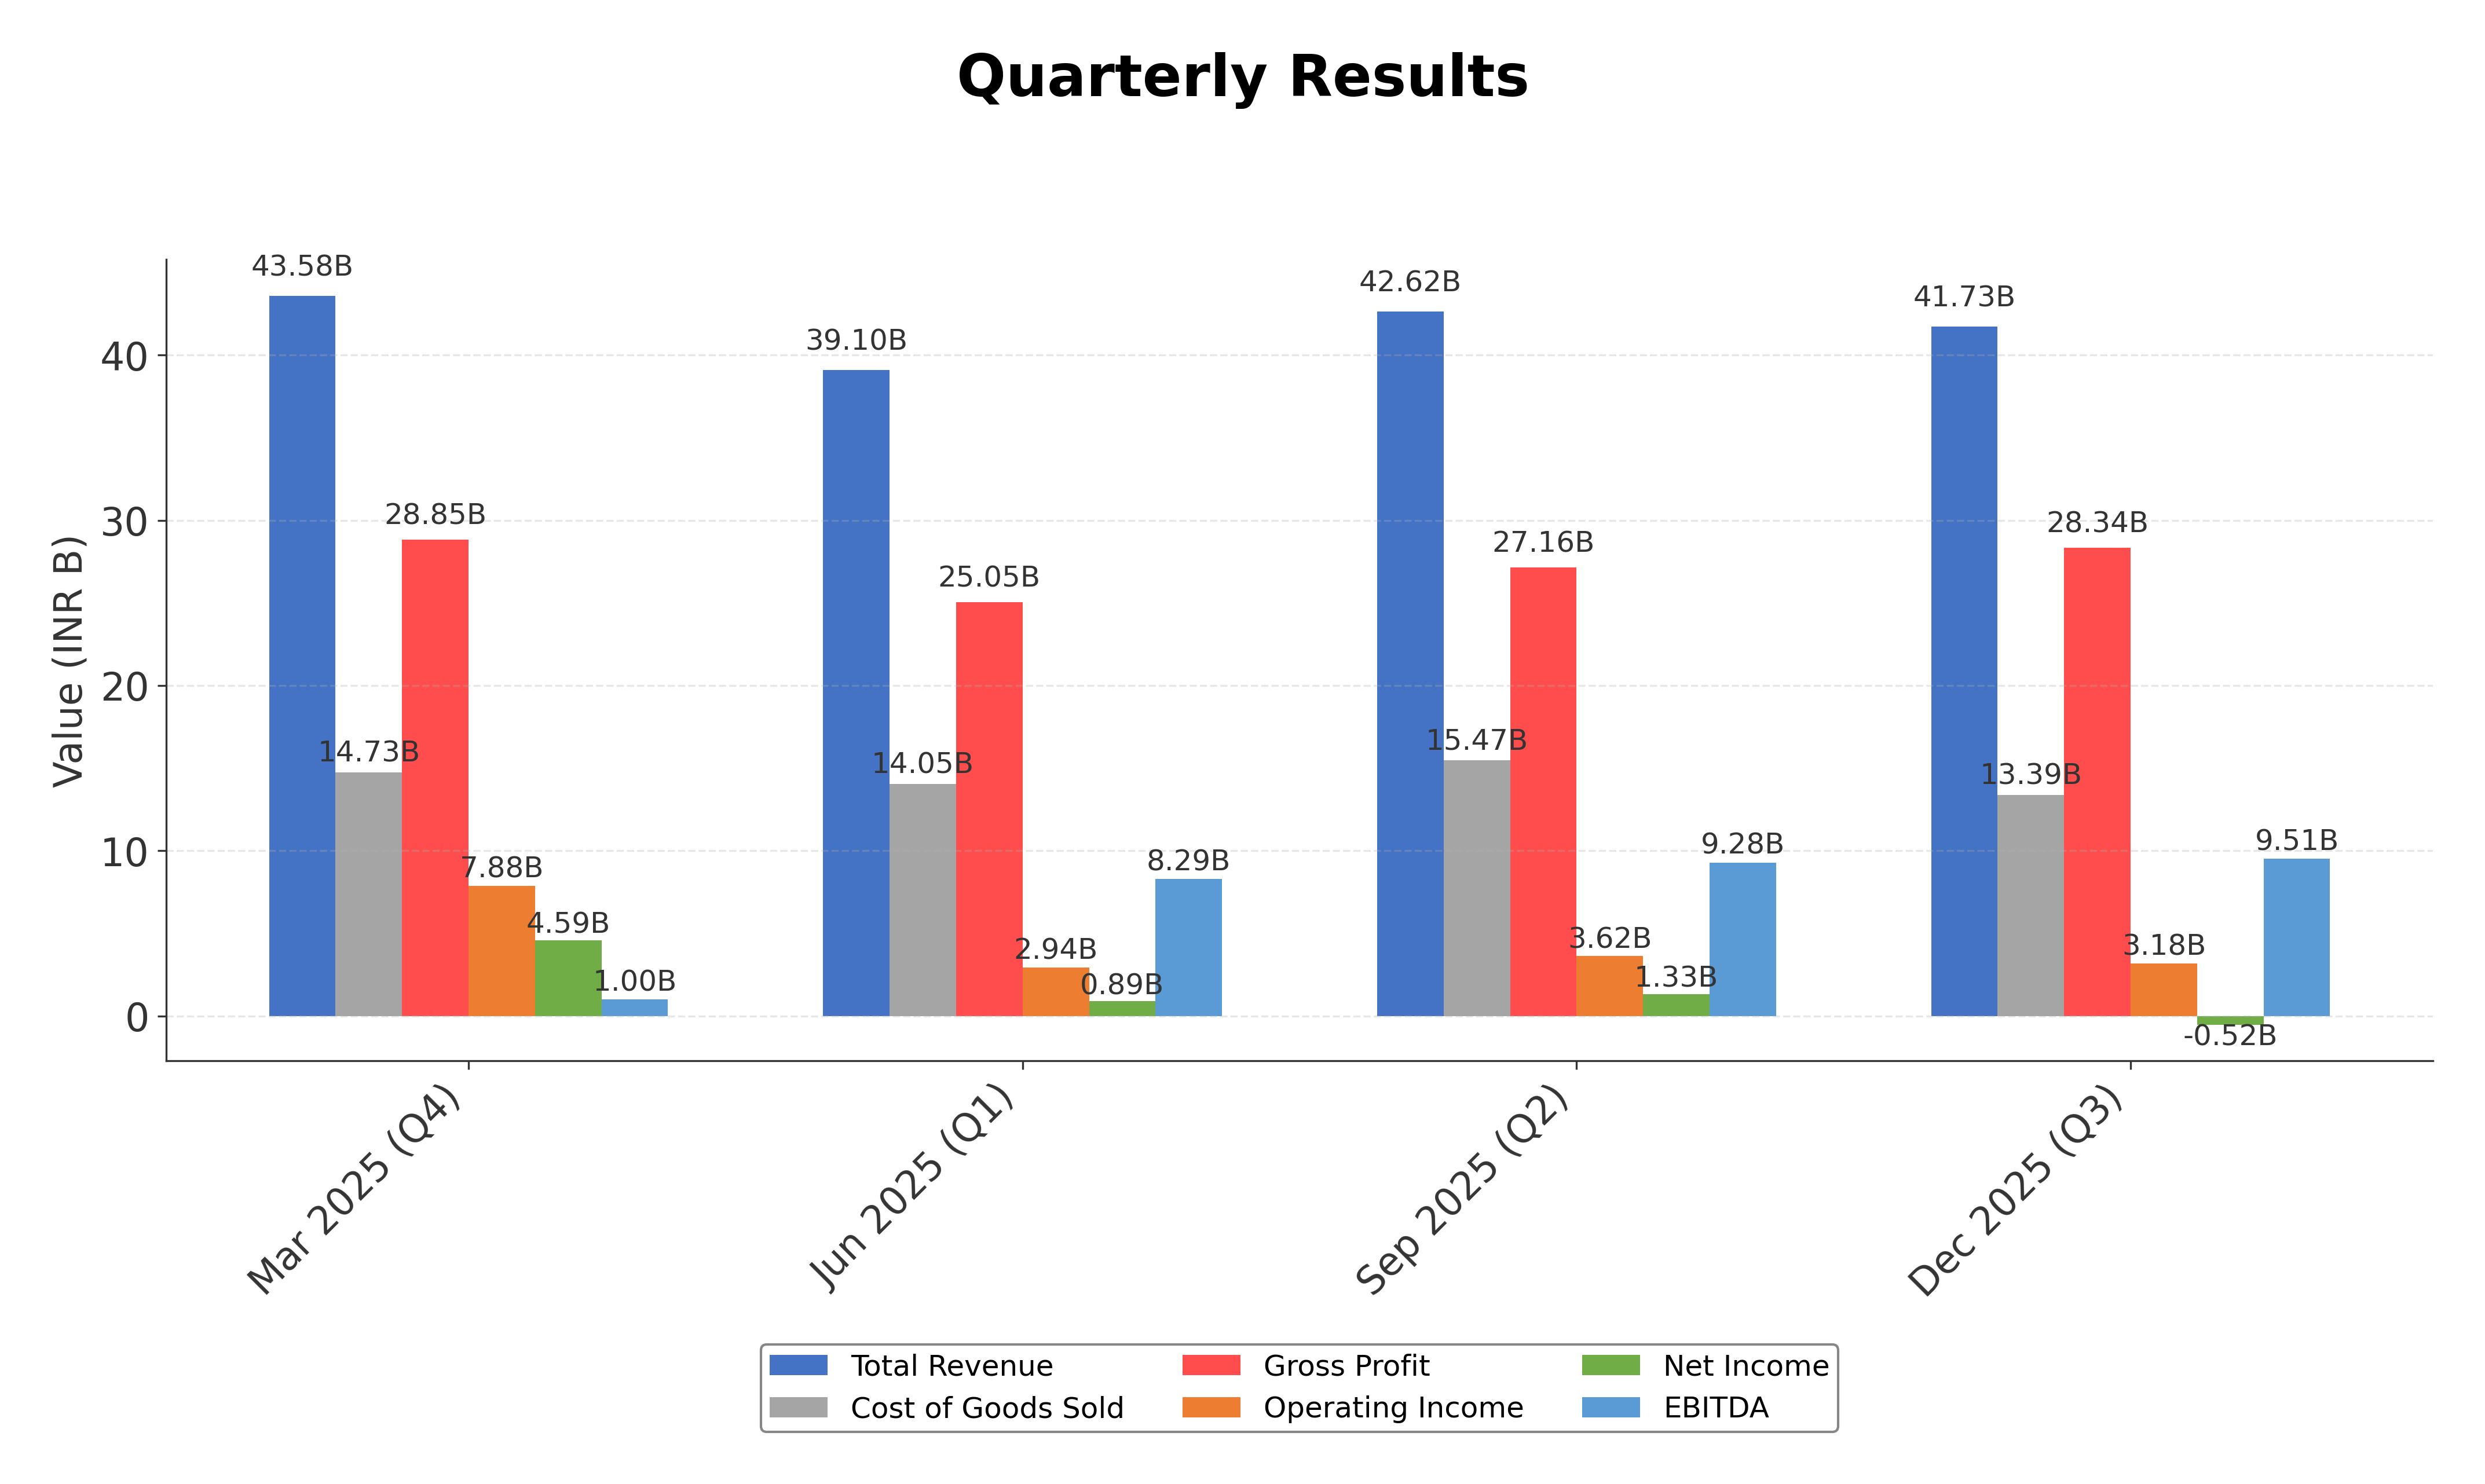
As of May 8, 2026. Biocon Ltd reported a significant 63% year-on-year decline in Q4 net profit, primarily due to exceptional charges, while revenue grew 10% to Rs 4,517 crore after adjusting for one-time sales. The company successfully integrated its biosimilars and generics businesses, aiming to enhance scale and profitability. EBITDA margin expanded by 200 basis points to 23% on a like-to-like basis, reflecting operational improvements. For the full fiscal year FY26, revenue increased by 13% to Rs 16,927 crore, although net profit slipped 74% to Rs 369 crore amid cost pressures. Leadership emphasized resilience and disciplined execution despite geopolitical and regulatory challenges, with a focus on long-term value creation and profitability enhancement. The company also announced a final dividend of Rs 0.50 per share and maintained its commitment to sustainable growth, as recognized by inclusion in the S&P Global Sustainability Yearbook 2026.
News Sentiment
The overall sentiment from recent updates is mixed with a tilt towards cautious optimism. Positive momentum is driven by revenue growth, successful business integration, and margin expansion, highlighting operational resilience. However, significant profit declines due to exceptional and regulatory costs temper the outlook. Dividend declaration and sustainability recognition contribute positively to sentiment, while the impact of higher costs and geopolitical complexities present challenges. The balanced sentiment reflects a company navigating transitional phases with strategic focus on long-term value.
Source List
- https://economictimes.indiatimes.com/markets/stocks/earnings/biocon-reports-63-yoy-fall-in-q4-profit-final-dividend-of-rs-0-50-recommended/articleshow/130946485.cms
- https://www.deccanherald.com/business/companies/biocon-q4-net-profit-down-568-at-rs-1986-crore-3995334
- https://biocon.com/biocon-q4fy26-revenue
- https://whalesbook.com/corporate-news/English/healthcarebiotech/Biocon-FY26-Profit-Slips-74percent-to-indian-rupee369-Cr-Revenue-Grows-109percent/69fcdb02f2f73a615a0b3774
Analytical Overview
Analysis Summary
Biocon's valuation metrics, including a trailing P/E of 73.34 and forward P/E of 39.53, are elevated compared to industry averages, reflecting high growth expectations but also indicating premium pricing. The PEG ratio of 0.18 suggests the stock price is relatively low compared to earnings growth potential, which may appeal to growth-focused assessments. Revenue growth of 9.2% quarterly and 13% annually, alongside positive operating cash flow trends, signal a solid growth trajectory despite recent profit pressures. Financial health shows a total debt to equity ratio of 50.02%, which is moderate, supported by a strong cash position of over INR 61 billion and positive free cash flow of INR 10.13 billion. Sector-specific challenges include regulatory scrutiny and competitive dynamics in biotechnology, while opportunities arise from expanding biosimilar markets and strategic integrations. Considering India-specific factors, Biocon benefits from a growing domestic pharmaceutical market and supportive regulatory frameworks, though macroeconomic uncertainties remain.
Overall Business and Market Assessment
Supporting Factors: Biocon’s robust revenue growth, operational cash flow generation, and strategic integration of biosimilars and generics enhancing scale
Risk Factors: the impact of exceptional costs on profitability and regulatory challenges that could affect margins
SWOT Analysis
Strengths
- Strong R&D capabilities driving product innovation in biopharmaceuticals.
- Robust cash position with INR 61 billion in cash and equivalents.
- Diverse product portfolio including biosimilars, biologics, and APIs.
- Successful integration of biosimilars and generics businesses enhancing scale.
Weaknesses
- High trailing P/E ratio indicating premium valuation and profit pressure.
- Moderate net profit margin of 3.6% limiting overall profitability.
- Total debt to equity ratio of 50.02% reflecting leverage concerns.
- Relatively low return on equity at 3.66% compared to industry peers.
Opportunities
- Growing global demand for affordable biosimilars and biologics.
- Expansion into advanced markets with key tender wins.
- Potential margin improvement through operational efficiencies.
- Favorable regulatory environment supporting pharmaceutical innovation.
Threats
- Regulatory and compliance risks impacting product approvals and costs.
- Intense competition in biotechnology and pharmaceutical sectors.
- Exceptional charges and operational costs affecting profitability.
- Geopolitical and macroeconomic uncertainties influencing market dynamics.
Company Description
Biocon Ltd. is a prominent biopharmaceutical company based in India, specializing in the development and production of innovative and cost-effective medical therapies. The company's primary focus lies in biopharmaceuticals, including biologics, biosimilars, complex active pharmaceutical ingredients (APIs), and branded formulations. Serving various sectors, Biocon operates in oncology, diabetes, and autoimmune diseases, where it delivers health solutions through its research-driven approach and state-of-the-art manufacturing facilities. As an integral player in the global pharmaceuticals market, Biocon emphasizes leveraging its robust R&D capabilities to drive product innovation and affordability across multiple healthcare systems worldwide. The company's strategic collaborations and partnerships reinforce its role in advancing accessible healthcare, contributing significantly to the biopharmaceutical industry's growth and evolution. Founded in 1978, Biocon Ltd. has expanded its footprint beyond the Indian market, establishing a significant international presence and playing a crucial role in enhancing global healthcare outcomes.