


Bharat Heavy Electricals Ltd (BHEL)
Stock Analysis Report
Stock Journey
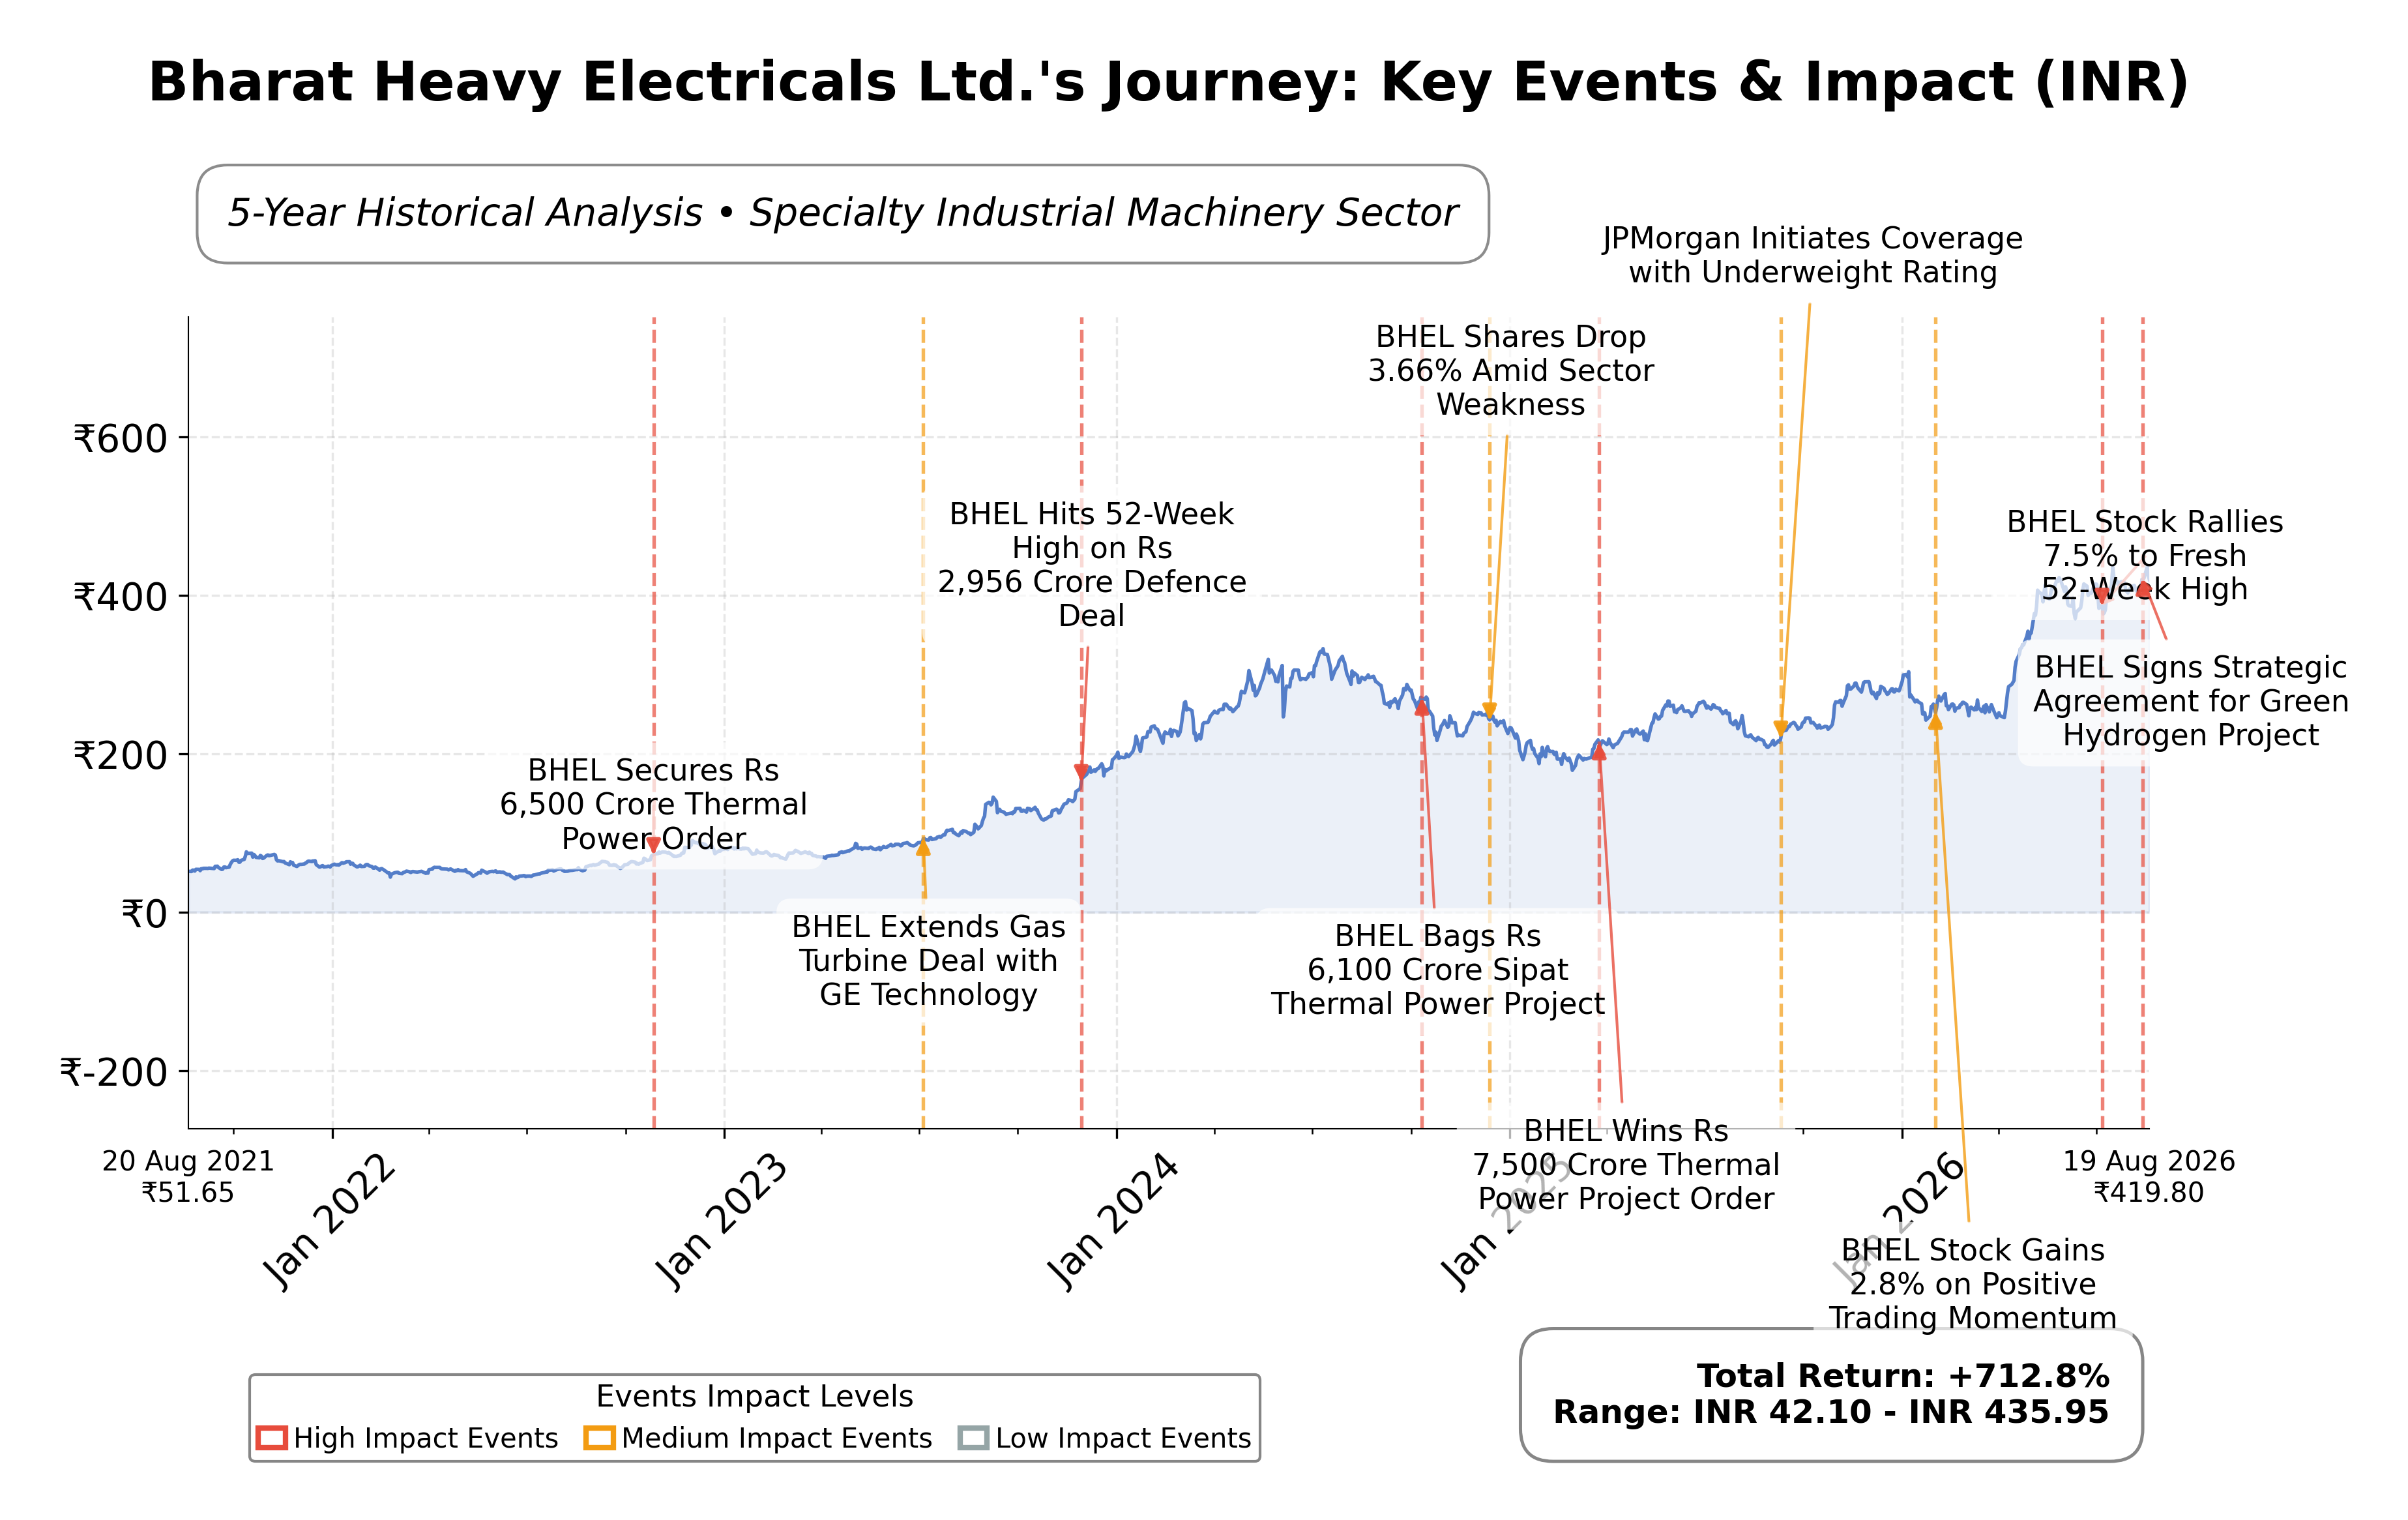
Key Positives and Key Risks
Pros
- Revenue growth of 40.3% year-over-year in the latest quarter indicates strong top-line momentum.
- Robust cash position of INR 112 billion and a low debt-to-equity ratio of 0.31 reflect financial strength and liquidity.
- Strategic partnerships in green hydrogen technology enhance future growth potential and technological capabilities.
Cons
- High trailing P/E ratio of 59.5 and forward P/E of 30.3 suggest valuation premiums relative to earnings.
- Return on equity at 6.12% is significantly lower than industry peers, indicating modest profitability efficiency.
- Dependence on cyclical infrastructure spending and government projects introduces execution and regulatory risks.
Disclosure: This information is for general awareness and does not constitute investment advice
Report Summary
Bharat Heavy Electricals Ltd. (BHEL) is a leading Indian engineering and manufacturing company specializing in heavy electrical equipment and systems for core infrastructure sectors. Listed on the NSE under the Industrials sector, BHEL serves diverse markets including power generation, transmission, renewable energy, transportation, oil and gas, defence, and aerospace. The company’s extensive product and service portfolio encompasses design, engineering, construction, testing, commissioning, and servicing of equipment critical to large-scale infrastructure projects. Headquartered in New Delhi, BHEL holds a significant position in India’s domestic heavy electrical equipment market and plays a pivotal role in the country’s industrial ecosystem.
Financially, BHEL reported trailing twelve months (TTM) revenue of approximately INR 360 billion with a gross margin of 31.2%, operating margin of 5.5%, and net profit margin of 6.8%. The company’s return on equity (ROE) stands at 6.12%, return on assets (ROA) at 2.1%, and return on invested capital (ROIC) at around 9.14%, reflecting moderate profitability and operational efficiency. Quarterly revenue growth was robust at 40.3%, though quarterly earnings declined by 14.4% year-over-year. Operating cash flow totaled INR 60.3 billion TTM, with levered free cash flow at INR 16 billion, indicating positive cash generation.
Valuation metrics show a trailing price-to-earnings (P/E) ratio of 59.5 and a forward P/E of 30.3, with a price-to-book (P/B) ratio of 5.56 and an enterprise value to EBITDA (EV/EBITDA) multiple of 49.7. The market capitalization is approximately INR 1.45 trillion. The stock trades near INR 413.5, within a 52-week range of INR 205.12 to INR 446.5, indicating a current price closer to the upper end of its annual trading band. These multiples suggest the stock is priced at a premium relative to earnings and book value, reflecting market expectations for growth or strategic positioning.
BHEL’s strengths include a strong cash position of over INR 112 billion, relatively low debt with a debt-to-equity ratio of 0.31, and a diversified order book across power and emerging sectors such as green hydrogen. Recent strategic initiatives include partnerships to develop advanced electrolyser technologies for green hydrogen, enhancing its clean energy portfolio. Key risks involve competitive pressures in the specialty industrial machinery sector, regulatory challenges, and exposure to cyclical infrastructure spending. The company’s leadership remains stable with ongoing focus on technology and diversification.
Technically, the stock shows a positive trend supported by trading above its 200-day moving average and near its 50-day moving average, with momentum indicators reflecting moderate strength. Recent news highlights strategic collaborations and improving financial performance, suggesting a cautiously optimistic environment. Overall, the data indicates conditions that may favor monitoring and selective accumulation, balanced by valuation considerations and sector dynamics.
Company and Industry Overview
Company Basics
Price Performance
Company Size
Shareholding Pattern
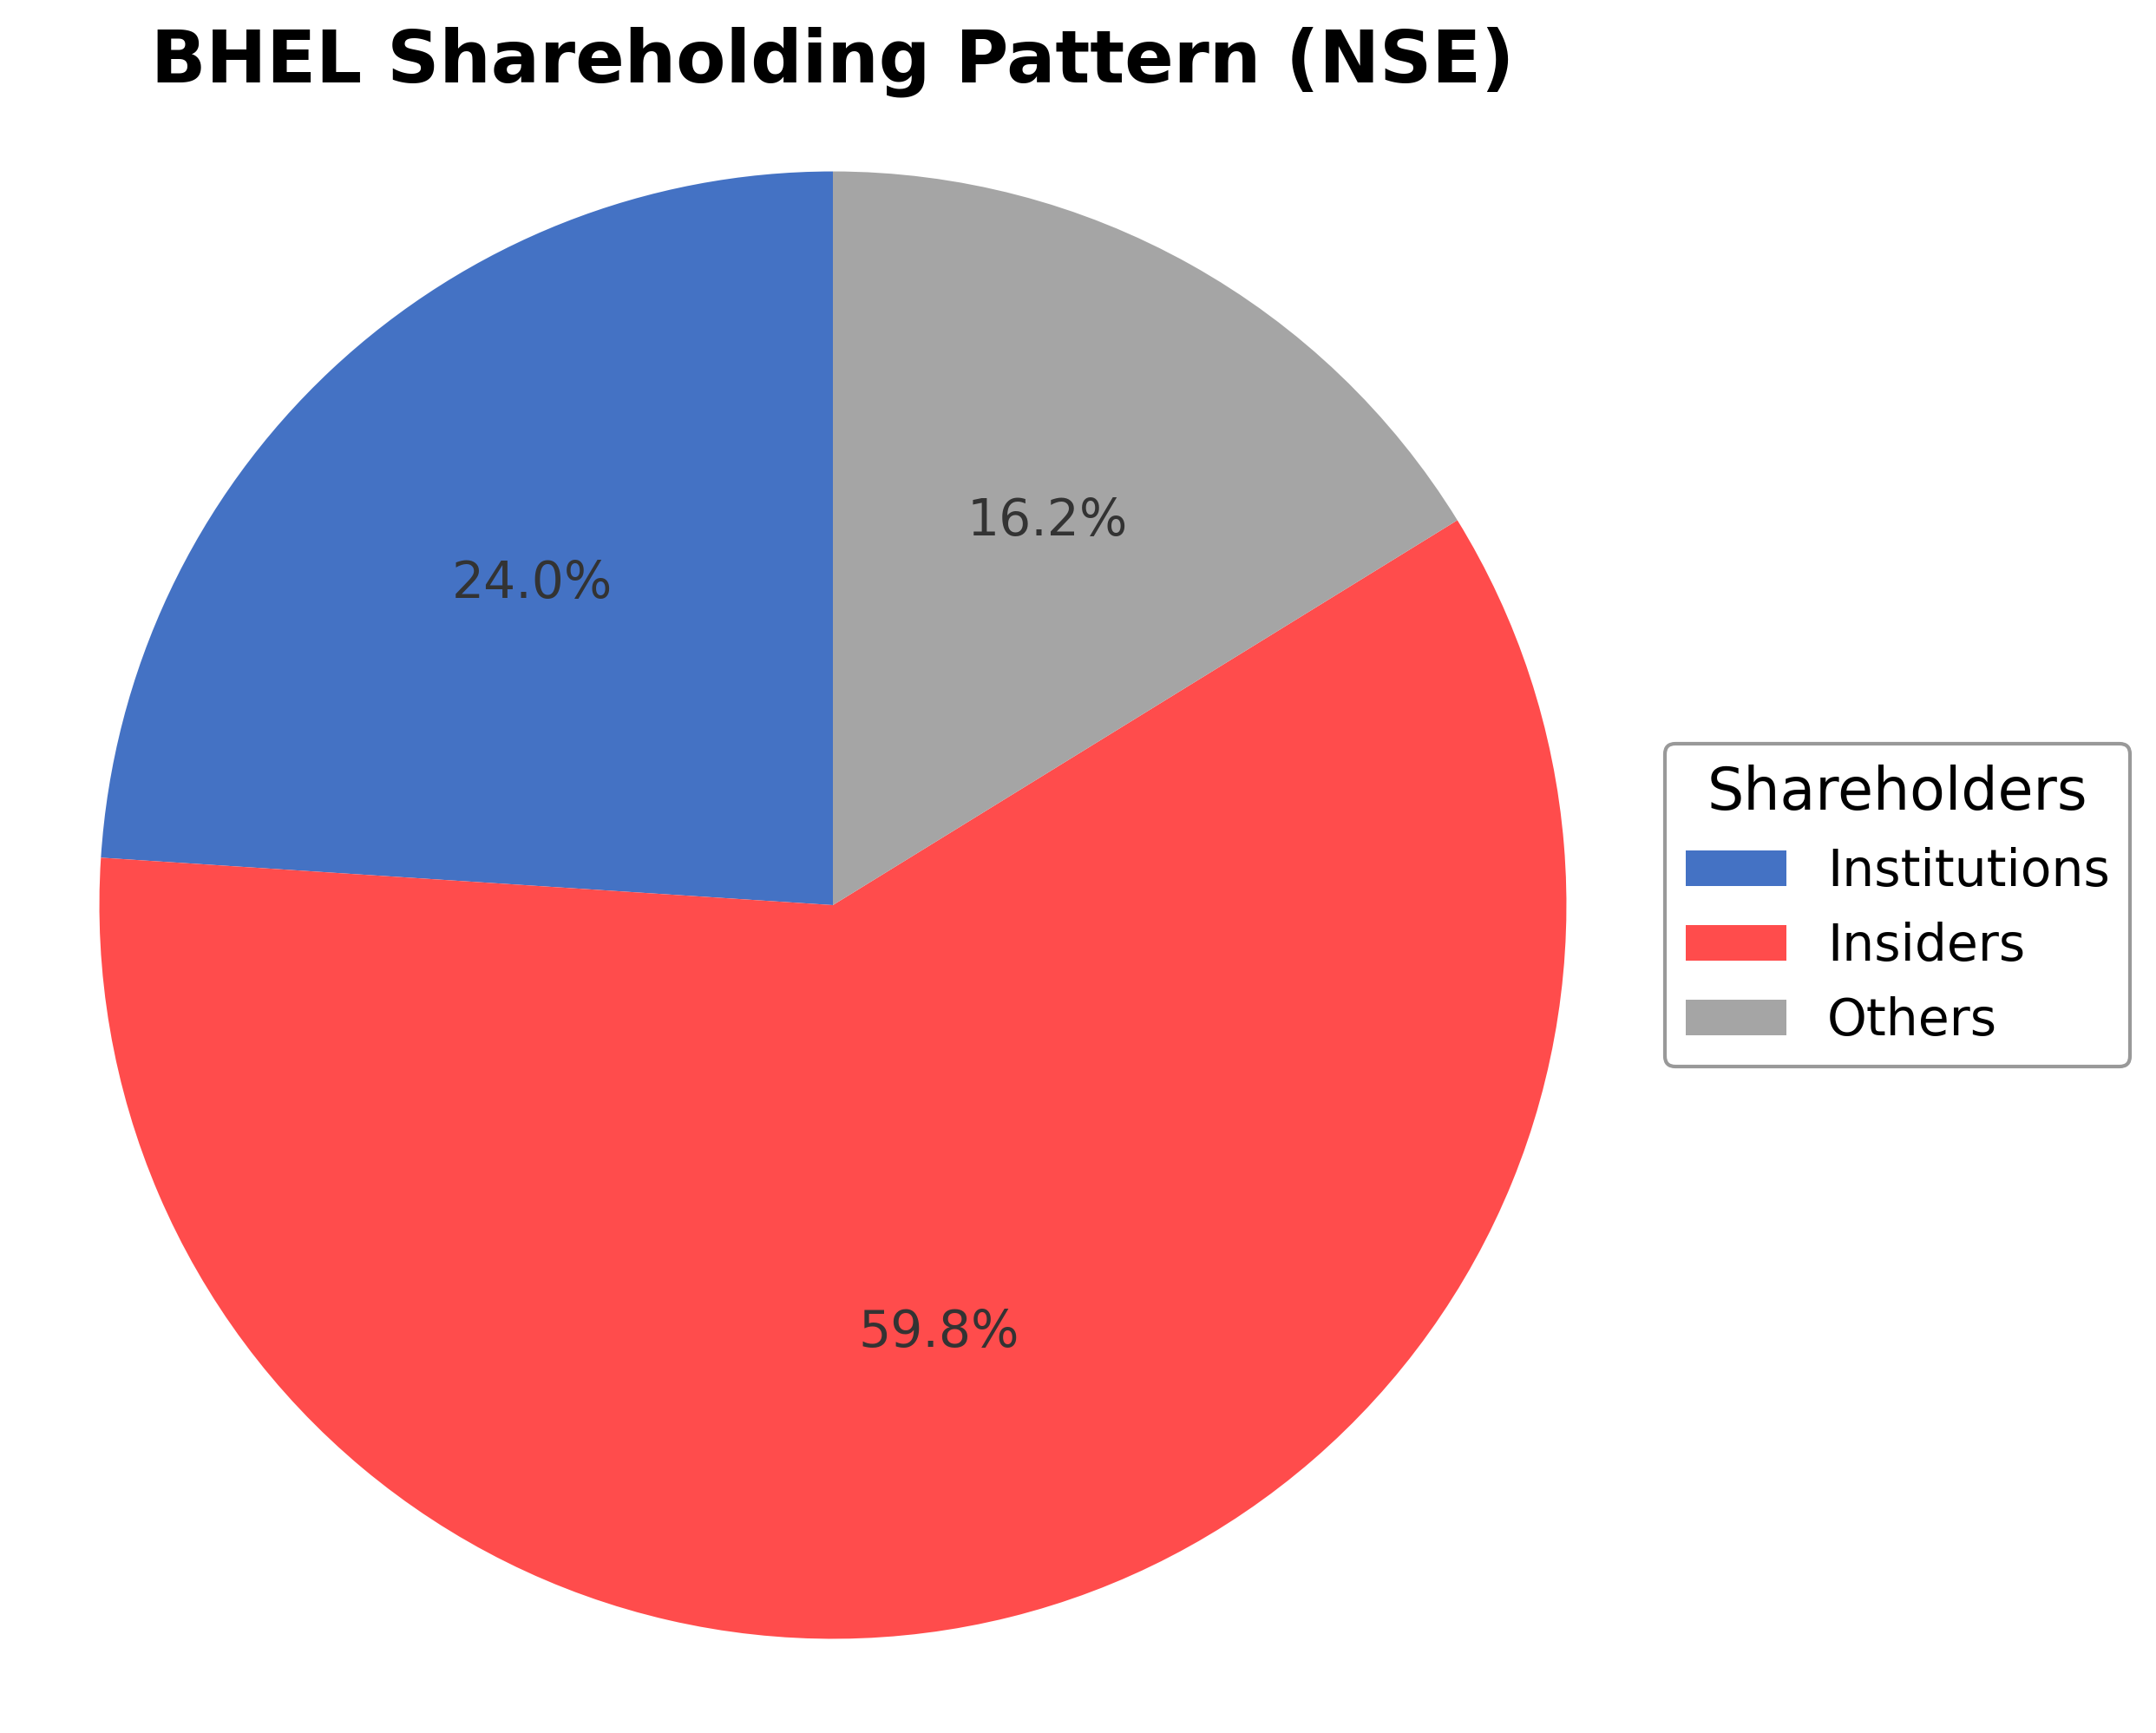
Bharat Heavy Electricals Ltd. exhibits a shareholding structure dominated by insiders holding approximately 59.82%, institutional investors accounting for 23.97%, and other shareholders comprising 16.21% of total equity. Over the past 12 to 24 months, promoter holding has seen a slight decrease, reflecting modest changes in insider ownership. Institutional investors have maintained a stable presence with no significant accumulation or distribution trends noted recently. Major funds and asset managers continue to hold steady positions, indicating a balanced market sentiment. This ownership distribution suggests a governance framework with strong promoter control complemented by institutional oversight, which may influence strategic decisions and corporate actions in alignment with long-term industrial and infrastructure objectives.
Sector and Industry Analysis
The power equipment manufacturing sector in India is a critical component of the country’s infrastructure development, encompassing power generation, transmission, and renewable energy segments. The market has witnessed steady growth driven by rising electricity demand, government initiatives for expanding power capacity, and a shift towards cleaner energy sources. Major players include Bharat Heavy Electricals Ltd (BHEL), along with other large engineering firms specializing in coal, hydro, gas, and nuclear power plant equipment.
Industry trends highlight an increasing focus on renewable energy and diversification beyond traditional coal-based power equipment, with companies expanding into segments like coal-to-chemicals and services for oil & gas and defense sectors. Competitive dynamics are shaped by high capital intensity, technological expertise, and long project cycles, creating significant barriers to entry. BHEL maintains a strong market position with a broad product portfolio and a dominant share in the power sector, though it faces competition from both domestic and international firms.
The regulatory environment is influenced by government policies promoting energy security, environmental standards, and renewable energy targets. Regulations under SEBI and other bodies ensure transparency and governance for listed companies like BHEL. Ongoing reforms in power tariffs, environmental clearances, and incentives for clean energy investments are expected to impact industry growth and operational strategies in the medium term.
Note: Analysis synthesized from industry research, market reports, and regulatory filings. Information is subject to change based on market conditions.
Financial Ratios Dashboard
Illustrative Scenario Analysis
DCF Assumptions:
Method: Two-Stage EPS-Priority Model
Financials
Peer Analysis
| Company Name | Market Cap | P/E Ratio | P/B Ratio | EV/EBITDA | Price to CFO |
|---|---|---|---|---|---|
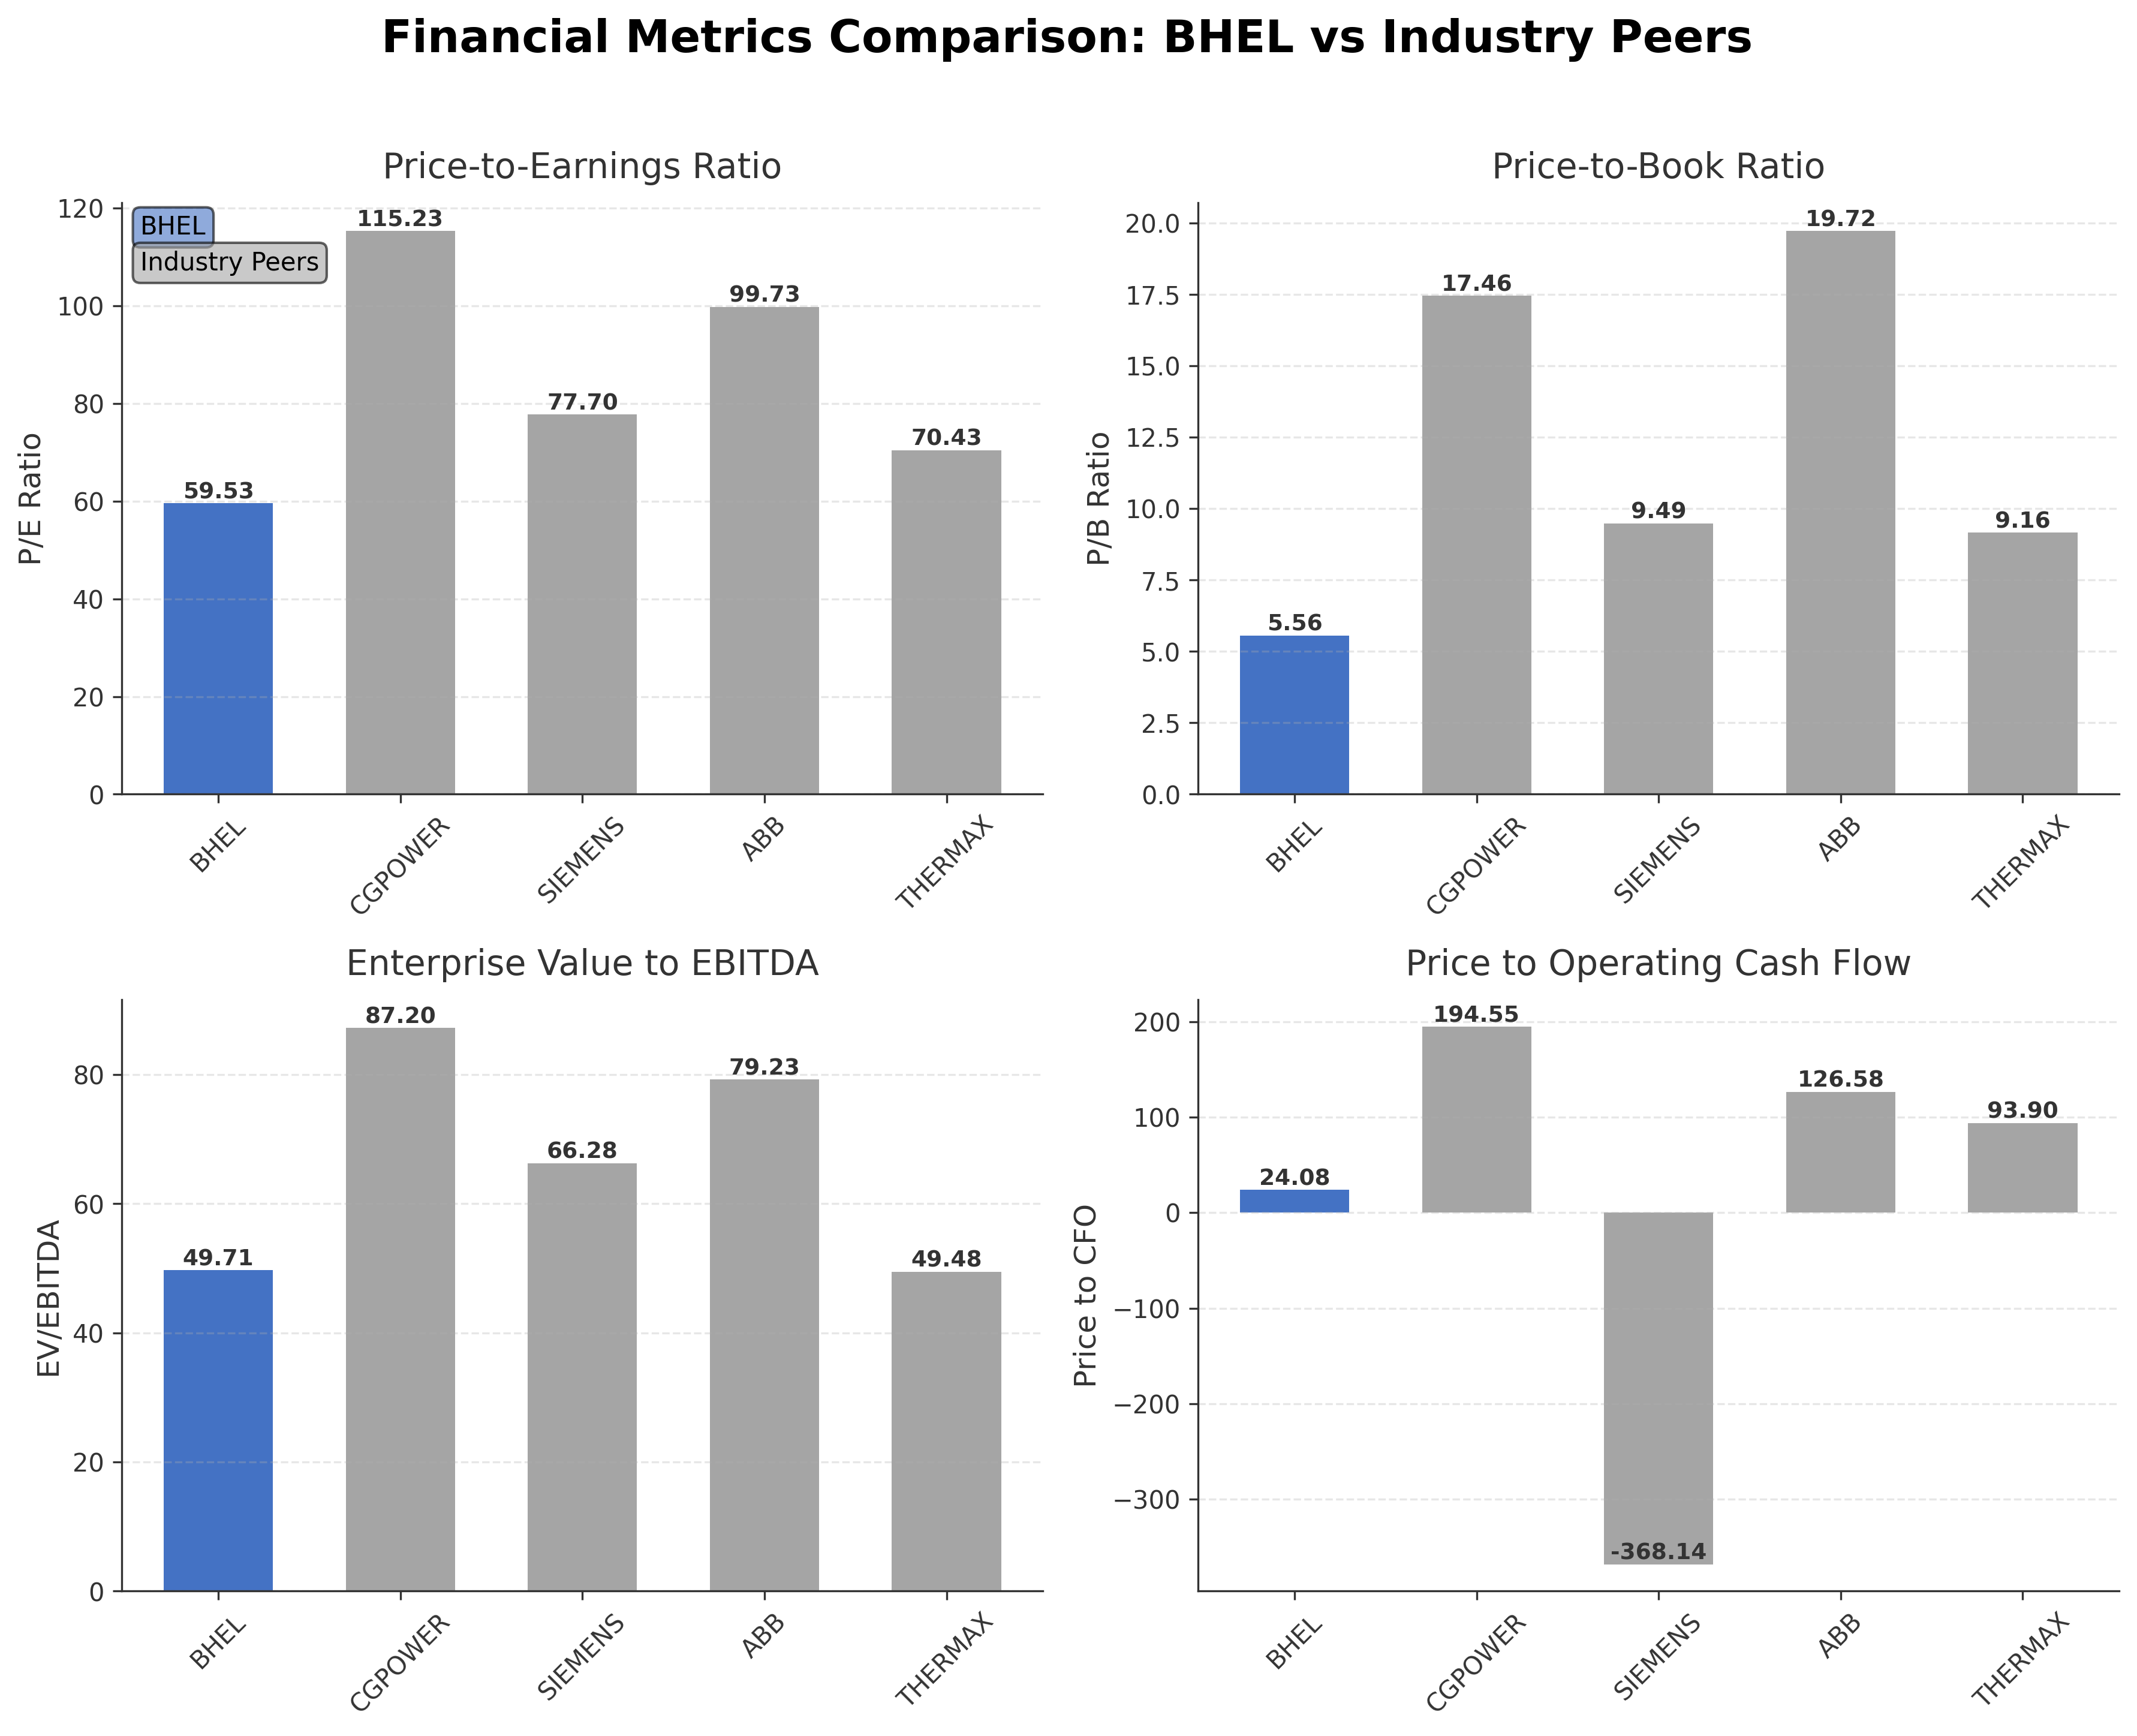
| Bharat Heavy Electricals Ltd. | ₹1.45T | 59.53 | 5.56 | 49.71 | 24.08 |
| CG Power and Industrial Solutions Limited | ₹1.37T | 115.23 | 17.46 | 87.20 | 194.55 |
| Siemens Ltd. | ₹1.31T | 77.70 | 9.49 | 66.28 | -368.14 |
| ABB India Ltd. | ₹1.54T | 99.73 | 19.72 | 79.23 | 126.58 |
| Thermax Ltd. | ₹508.50B | 70.43 | 9.16 | 49.48 | 93.90 |
Comparison Analysis: Bharat Heavy Electricals Ltd. trades at a lower P/E ratio of 59.53 compared to its peers such as CG Power and ABB India, which have P/E ratios exceeding 90, indicating relatively more conservative earnings valuation. Its P/B ratio of 5.56 is also significantly lower than peers like ABB and CG Power, suggesting a more moderate premium on book value. The EV/EBITDA multiple of 49.71 is comparable to Thermax but lower than Siemens and ABB, reflecting relative operational valuation. Return on equity at 6.12% is notably below peer averages, which range from 13.7% to 21.3%, indicating lower profitability efficiency. Overall, BHEL appears more moderately valued but with comparatively lower profitability metrics within the specialty industrial machinery sector.
Financial Metrics Comparison with Peers
Financial Statements
Comprehensive financial data including income, balance sheet, and cash flow metrics
Income Statement
| fiscal_date | 2026-03-31 | 2025-03-31 | 2024-03-31 | 2023-03-31 | 2022-03-31 |
|---|---|---|---|---|---|
| Sales | 323.60B | 273.55B | 229.21B | 221.36B | 201.53B |
| Cost Of Goods | 229.83B | 188.45B | 168.07B | 163.01B | 147.94B |
| Gross Profit | 93.77B | 85.10B | 61.13B | 58.36B | 53.60B |
| Operating Expense Research And Development | 363.40M | 273.20M | 234.40M | 242.80M | 249.30M |
| Operating Expense Selling General And Administrative | 5.89B | 5.14B | 3.98B | 4.09B | 3.71B |
| Operating Expense Other Operating Expenses | 15.04B | 17.03B | 3.72B | 2.86B | 1.63B |
| Operating Income | 16.03B | 8.08B | 1.80B | 965.00M | 4.21B |
| Non Operating Interest Income | 7.40B | 4.03B | 4.94B | 4.21B | 3.03B |
| Non Operating Interest Expense | 7.56B | 7.48B | 7.31B | 5.21B | 3.56B |
| Pretax Income | 21.39B | 7.46B | 2.43B | 7.16B | 4.70B |
| Income Tax | 5.38B | 2.12B | -395.60M | 614.90M | -257.50M |
| Net Income | 16.00B | 5.34B | 2.82B | 6.54B | 4.45B |
| Eps Basic | 4.60 | 1.53 | 0.81 | 1.88 | 0.12 |
| Eps Diluted | 4.60 | 1.53 | 0.81 | 1.88 | 0.12 |
| Basic Shares Outstanding | 3.48B | 3.48B | 3.48B | 3.48B | 3.48B |
| Diluted Shares Outstanding | 3.48B | 3.48B | 3.48B | 3.48B | 3.48B |
| Ebit | 28.94B | 14.94B | 9.74B | 12.37B | 8.26B |
| Ebitda | 29.75B | 15.54B | 10.22B | 12.28B | 11.41B |
| Net Income Continuous Operations | 21.39B | 7.46B | 2.43B | 7.16B | 4.70B |
| Minority Interests | 0.00 | 0.00 | -825.50M | -166.80M | 13.20M |
| Preferred Stock Dividends | 0.00 | 0.00 | 0.00 | 0.00 | 0.00 |
Data provided by Twelve Data
Balance Sheet
| fiscal_date | 2026-03-31 | 2025-03-31 | 2024-03-31 | 2023-03-31 | 2022-03-31 |
|---|---|---|---|---|---|
| Cash And Cash Equivalents | 10.83B | 3.90B | 17.19B | 14.49B | 7.33B |
| Accounts Receivable | 67.96B | 58.84B | 47.85B | 31.28B | 30.25B |
| Total Assets | 761.86B | 680.83B | 590.05B | 569.20B | 536.17B |
| Total Liabilities | 500.39B | 433.61B | 345.67B | 325.42B | 297.37B |
| Long Term Debt | 1.68B | 1.62B | 235.50M | 337.50M | 351.20M |
| Shareholders Equity | 261.47B | 247.22B | 244.39B | 243.78B | 238.80B |
Data provided by Twelve Data
Cash Flow Statement
| fiscal_date | 2026-03-31 | 2025-03-31 | 2024-03-31 | 2023-03-31 | 2022-03-31 |
|---|---|---|---|---|---|
| Operating Activities Net Income | 21.39B | 7.46B | 2.43B | 7.16B | 4.70B |
| Operating Activities Other Non Cash Items | -56.10M | 3.19B | 2.14B | 583.90M | 403.60M |
| Operating Activities Accounts Receivable | -482.70M | -44.12B | -32.24B | -24.85B | -5.70B |
| Operating Activities Other Assets Liabilities | 39.50B | 52.95B | 7.42B | -2.87B | 2.22B |
| Operating Activities Operating Cash Flow | 58.37B | 19.47B | -20.25B | -19.98B | 1.63B |
| Investing Activities Net Acquisitions | -48.70M | 0.00 | N/A | N/A | N/A |
| Investing Activities Purchase Of Investments | -31.48B | -28.78B | N/A | N/A | -12.51B |
| Investing Activities Sale Of Investments | 800.00K | 57.60M | 11.13B | 13.84B | 0.00 |
| Investing Activities Other Investing Activity | 60.90M | 222.50M | N/A | N/A | N/A |
| Investing Activities Investing Cash Flow | -31.47B | -31.41B | 8.90B | 12.04B | -14.14B |
| Financing Activities Long Term Debt Payments | -8.45B | -130.00M | N/A | N/A | -875.30M |
| Financing Activities Short Term Debt Issuance | -8.45B | -130.00M | 34.23B | 6.40B | -875.30M |
| Financing Activities Common Dividends | -1.75B | -874.40M | -1.39B | -1.39B | -3.00M |
| Financing Activities Financing Cash Flow | -18.65B | -1.06B | 32.84B | 5.01B | -1.75B |
| End Cash Position | 14.35B | 4.39B | 18.35B | 15.61B | 7.33B |
| Free Cash Flow | 52.48B | 18.88B | -39.45B | -9.29B | 4.91B |
| Investing Activities Capital Expenditures | N/A | -2.91B | -2.24B | -1.81B | -1.62B |
| Financing Activities Other Financing Charges | N/A | 72.40M | N/A | N/A | 100.00K |
Data provided by Twelve Data
Technical Analysis
Key Insights
- The stock is currently in an upward trend, trading near its 50-day moving average of INR 402.7 and well above the 200-day moving average of INR 311.8, indicating medium to long-term bullish momentum.
- Key support levels are identified near INR 310 and INR 205, while resistance is observed around the 52-week high of INR 446.5, which may act as a psychological barrier.
- Price is positioned above the 10-day, 50-day, and 200-day moving averages, suggesting sustained positive price action across short, medium, and long-term timeframes.
- Momentum indicators show the Relative Strength Index (RSI) in a moderate range, MACD trending positively, and stochastic oscillators indicating potential continuation of upward momentum without overbought conditions.
- Analysis across daily, weekly, and monthly charts confirms a consistent bullish trend with no major reversal signals detected, supporting stable price appreciation over multiple time horizons.
- Current technical setup suggests potential consolidation near resistance levels with possible breakout scenarios if volume supports, while failure to breach resistance could lead to a retracement toward support zones.
Trending News
Summary: Bharti Airtel Share Price: Find the latest news on Bharti Airtel Stock Price. Get all the information on Bharti Airtel with historic price charts for NSE / BSE. Experts & Broker view also get the Bharti Airtel Ltd. buy/sell tips detailed news, announcements, Forecasts, Analysts, Valuation, ...
Sentiment: neutral
2. Headline: Long Island Power Solutions Clarifies the Federal Solar Tax Credit for New York Homeowners – EIN News | Solar Now
Summary: Long Island Power Solutions Clarifies the Federal Solar Tax Credit for New York Homeowners EIN Newssource
Sentiment: neutral
Summary: Bharat Heavy Electricals Ltd. sits at the bottom of the four-stock comparison, with Jefferies retaining an ‘Underperform’ rating and raising its target price to Rs 270 from Rs 220.
Sentiment: positive
4. Headline: Capital Goods In Focus After Sixth Positive Defence Indigenisation List; BEL, HAL Among Key Stocks — Full List Inside
Summary: Bharat Electronics Ltd. ... Hindustan Aeronautics Ltd. ... Larsen & Toubro Ltd. ... ABB India Ltd. ... Apar Industries Ltd. ... Kalpataru Projects International Ltd. ... Carborundum Universal Ltd. ... Bharat Heavy Electricals Ltd.
Sentiment: neutral
5. Headline: Nexamp’s ‘Solar Grazing Program’ uses sheep to maintain Maine solar farms – WABI | Solar Now
Summary: Bharat Petroleum Corporation Ltd. ... Bokaro Power Supply Company Pvt. Ltd. ... Cambridge Energy Resources Pvt. Ltd. ... Central Electricity Regulatory Commission (Terms and Conditions for Tariff determination from Renewable Energy Sources
Sentiment: neutral
Powered by Brave
Recent Updates
News Summary
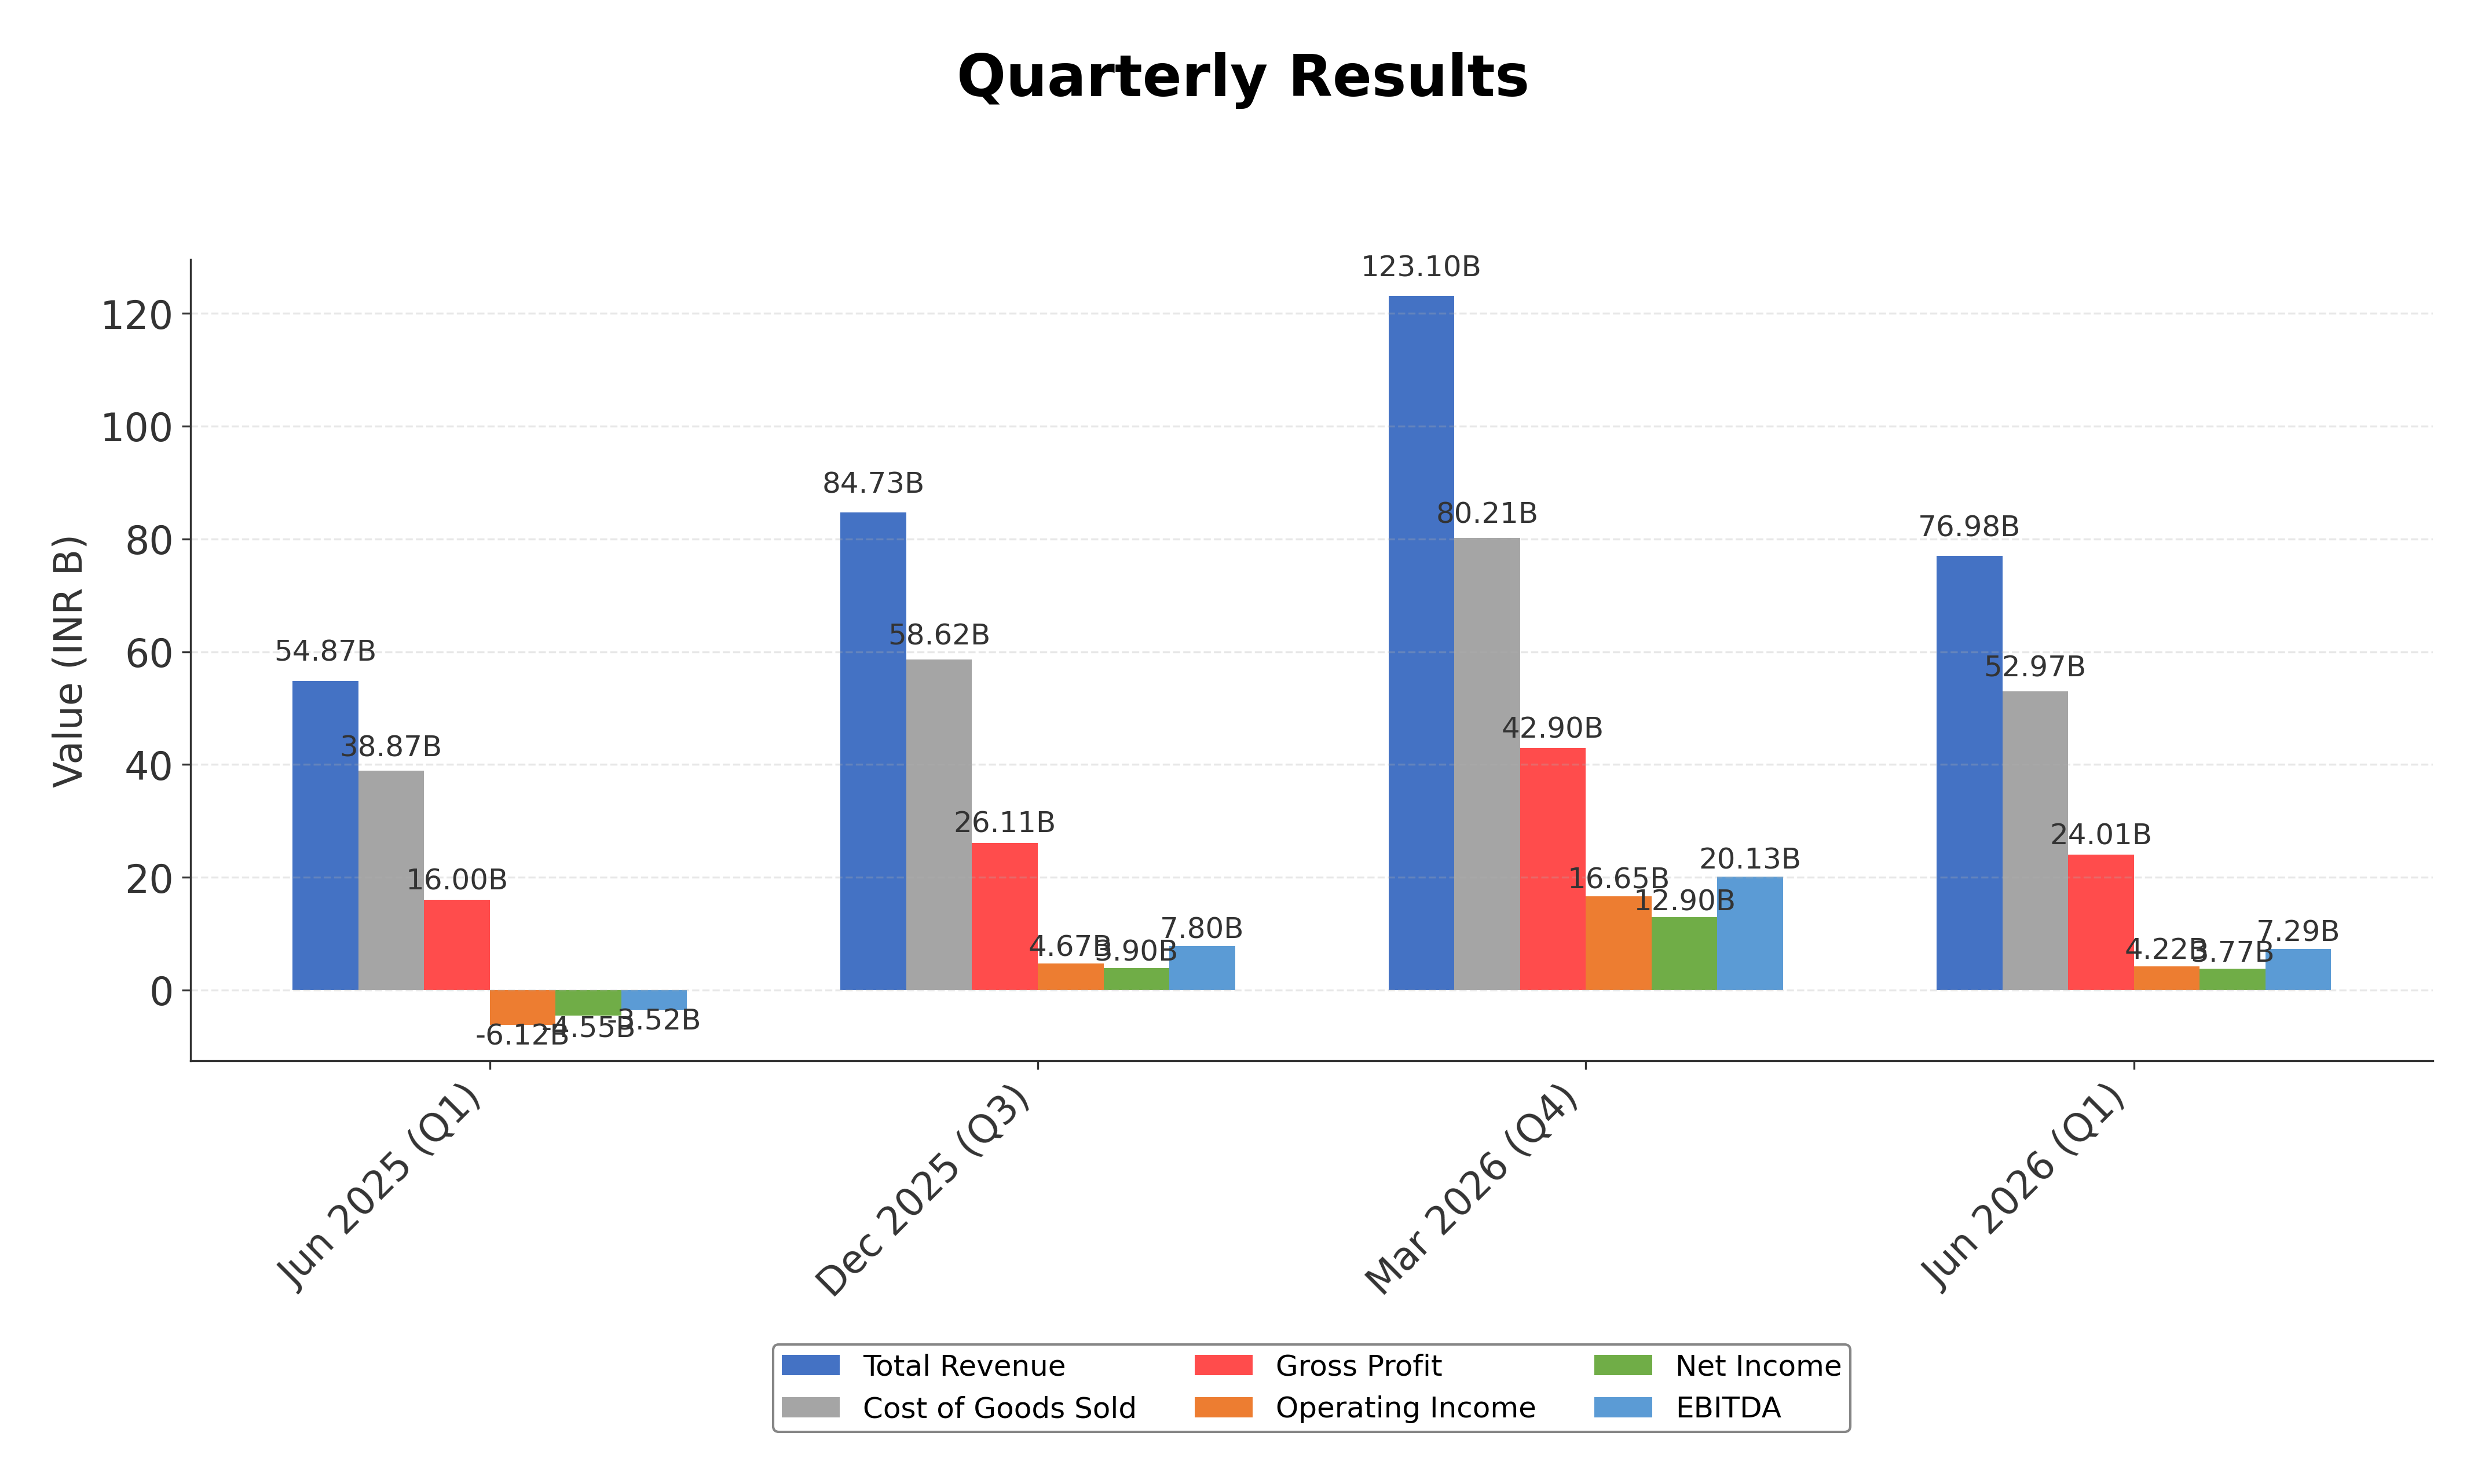
As of 2026-08-18. Bharat Heavy Electricals Limited (BHEL) has entered a strategic collaboration with Norway-based Hystar AS to develop Proton Exchange Membrane (PEM) electrolyser technology for green hydrogen projects, complementing its existing partnership for alkaline electrolyser systems. This initiative supports the Indian government's National Green Hydrogen Mission and Make in India program by promoting domestic manufacturing and technology development. Financial results for Q1 FY27 indicate a strong recovery with revenue growth of 40% year-over-year to ₹7,698 crore, EBITDA turning positive at ₹735 crore, and net profit reaching ₹382 crore, reversing prior losses. The company maintains robust liquidity with no outstanding commercial paper and a strong order book, underpinning its multi-year growth phase. These developments highlight BHEL’s focus on diversification into clean energy and sustained operational improvement.
News Sentiment
The overall sentiment from recent updates is cautiously positive, driven by strategic partnerships in green hydrogen technology and a significant turnaround in quarterly financial performance. The collaboration with Hystar AS and prior agreements enhance BHEL’s technological capabilities and market positioning in emerging energy sectors. Financial results showing a return to profitability and strong revenue growth reinforce confidence in the company’s operational execution. However, cautiousness remains due to competitive pressures and valuation considerations. The balanced sentiment reflects optimism about growth prospects tempered by ongoing sector challenges.
Source List
- https://solarquarter.com/2026/08/18/bhel-partners-with-hystar-to-advance-pem-electrolyzers-technology-for-green-hydrogen
- https://www.alphaspread.com/security/nse/bhel/investor-relations
- https://quartr.com/companies/bharat-heavy-electricals-limited_20137
Analytical Overview
Analysis Summary
BHEL’s valuation metrics reveal a trailing P/E of 59.5 and forward P/E of 30.3, which are elevated compared to industry averages, indicating the market prices in growth expectations despite moderate profitability. Revenue growth of 40.3% year-over-year and positive operating cash flow trends demonstrate an improving growth trajectory supported by a robust order book and diversification into green hydrogen and other sectors. The company’s financial health is solid with a debt-to-equity ratio of 0.31 and positive free cash flow of INR 16 billion, reflecting manageable leverage and liquidity. Sector-specific opportunities include India’s infrastructure expansion and green energy initiatives, while challenges encompass competitive intensity and regulatory dynamics. Considering India’s regulatory environment and economic outlook, BHEL’s strategic focus aligns well with national priorities, potentially supporting sustainable growth.
Overall Business and Market Assessment
Supporting Factors: strong revenue growth, positive cash flow generation, and strategic diversification into emerging technologies such as green hydrogen
Risk Factors: valuation premiums relative to earnings, competitive pressures in the heavy electrical equipment sector, and execution risks associated with large infrastructure projects
SWOT Analysis
Strengths
- Strong market position in India’s heavy electrical equipment sector.
- Robust cash position and manageable debt levels.
- Diversified product portfolio across power, renewable energy, and defence sectors.
- Strategic partnerships enhancing technology capabilities in green hydrogen.
Weaknesses
- Relatively low return on equity compared to industry peers.
- High valuation multiples relative to earnings and book value.
- Dependence on cyclical infrastructure spending and government projects.
- Moderate operating margins limiting profitability expansion.
Opportunities
- Growing demand for green hydrogen and renewable energy solutions.
- India’s infrastructure development and energy transition initiatives.
- Potential to expand exports and international market presence.
- Technological advancements through strategic collaborations.
Threats
- Intense competition from domestic and international players.
- Regulatory and policy uncertainties impacting project execution.
- Volatility in raw material costs affecting margins.
- Delays or cancellations in large infrastructure projects.
Company Description
Bharat Heavy Electricals Ltd. is an Indian engineering and manufacturing company focused on supplying equipment, systems, and services for core infrastructure sectors. The company serves power generation, transmission, industry, transportation, renewable energy, oil and gas, defence, and aerospace through activities that include design, engineering, construction, testing, commissioning, and servicing. Its product and service portfolio covers major power-plant and industrial applications, along with rail and transport electrification, transmission equipment, and specialized systems for heavy engineering needs. Bharat Heavy Electricals Ltd. plays an important role in India’s industrial ecosystem as a provider of large-scale technology and manufacturing solutions for utilities, public infrastructure, and strategic sectors. Headquartered in New Delhi, India, the company remains a key name in the domestic heavy electrical equipment market.