
Bharat Electronics Limited (BEL)
Stock Analysis Report
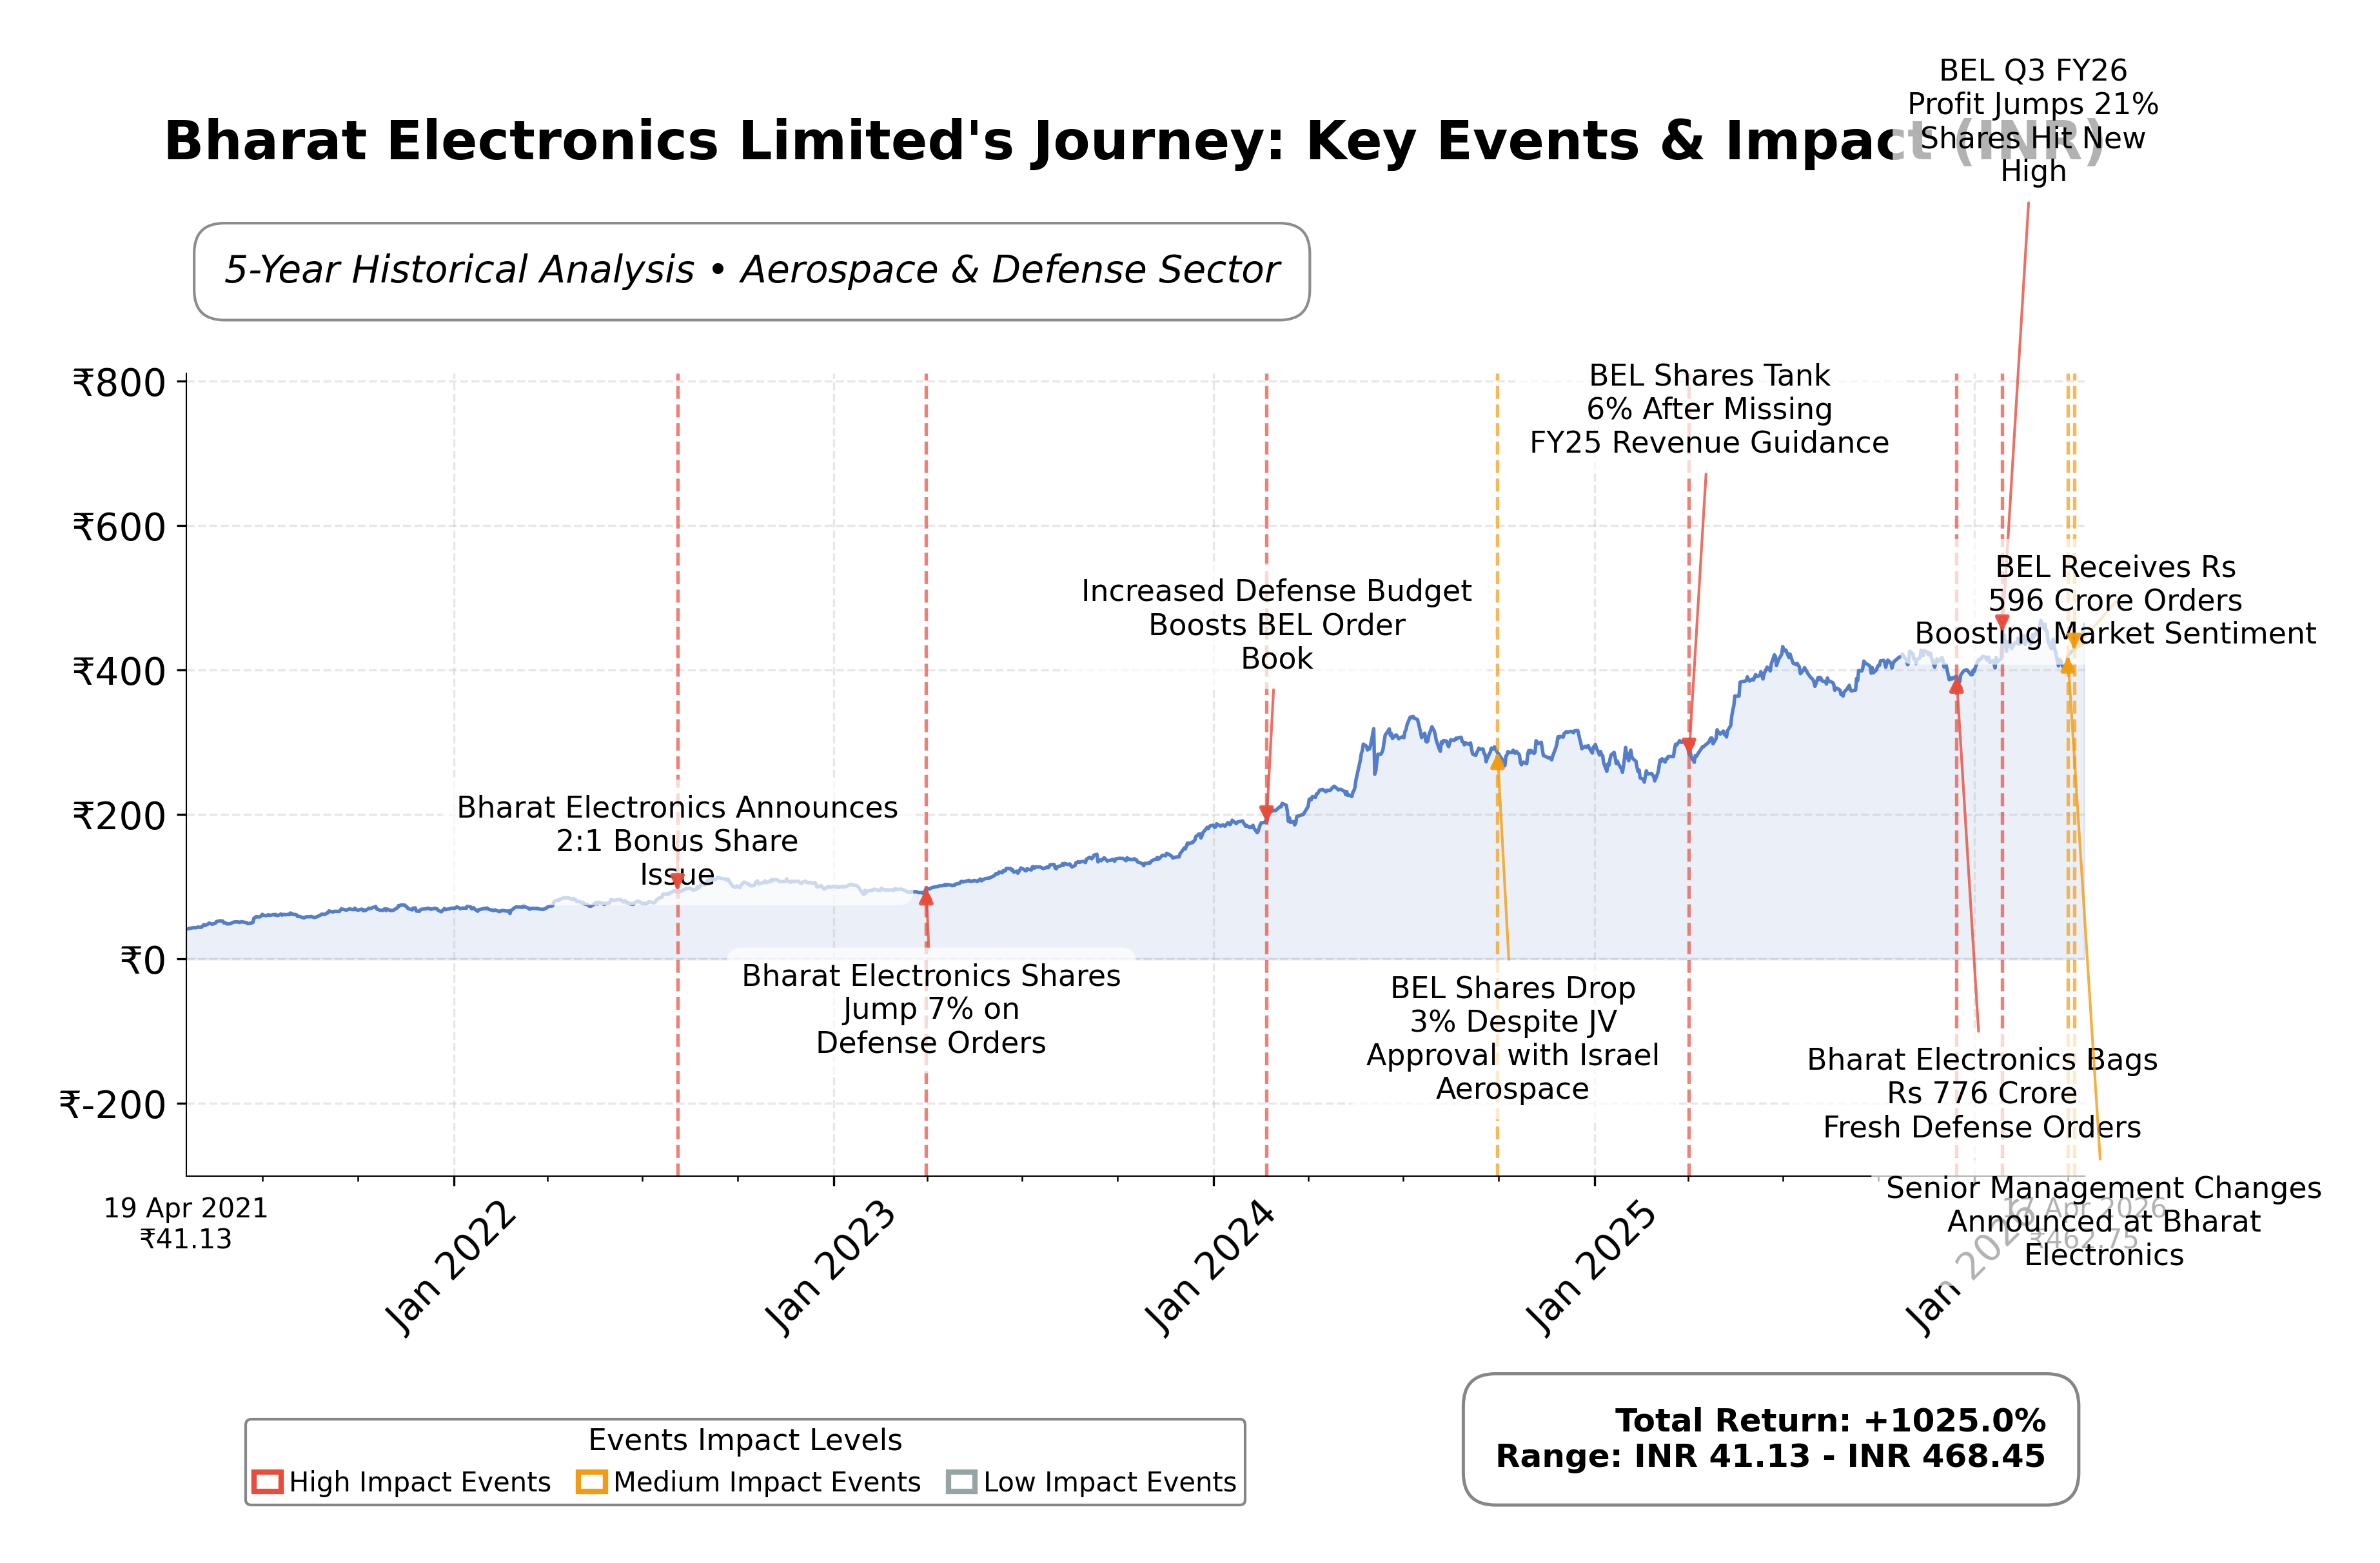
Stock Journey
Key Positives and Key Risks
Pros
- Bharat Electronics Limited exhibits strong profitability with a net profit margin of 22.48% and return on equity of 26.62%, indicating efficient operations and shareholder value creation.
- The company maintains a low debt-to-equity ratio of 0.273 and a current ratio of 1.76, reflecting solid financial health and liquidity.
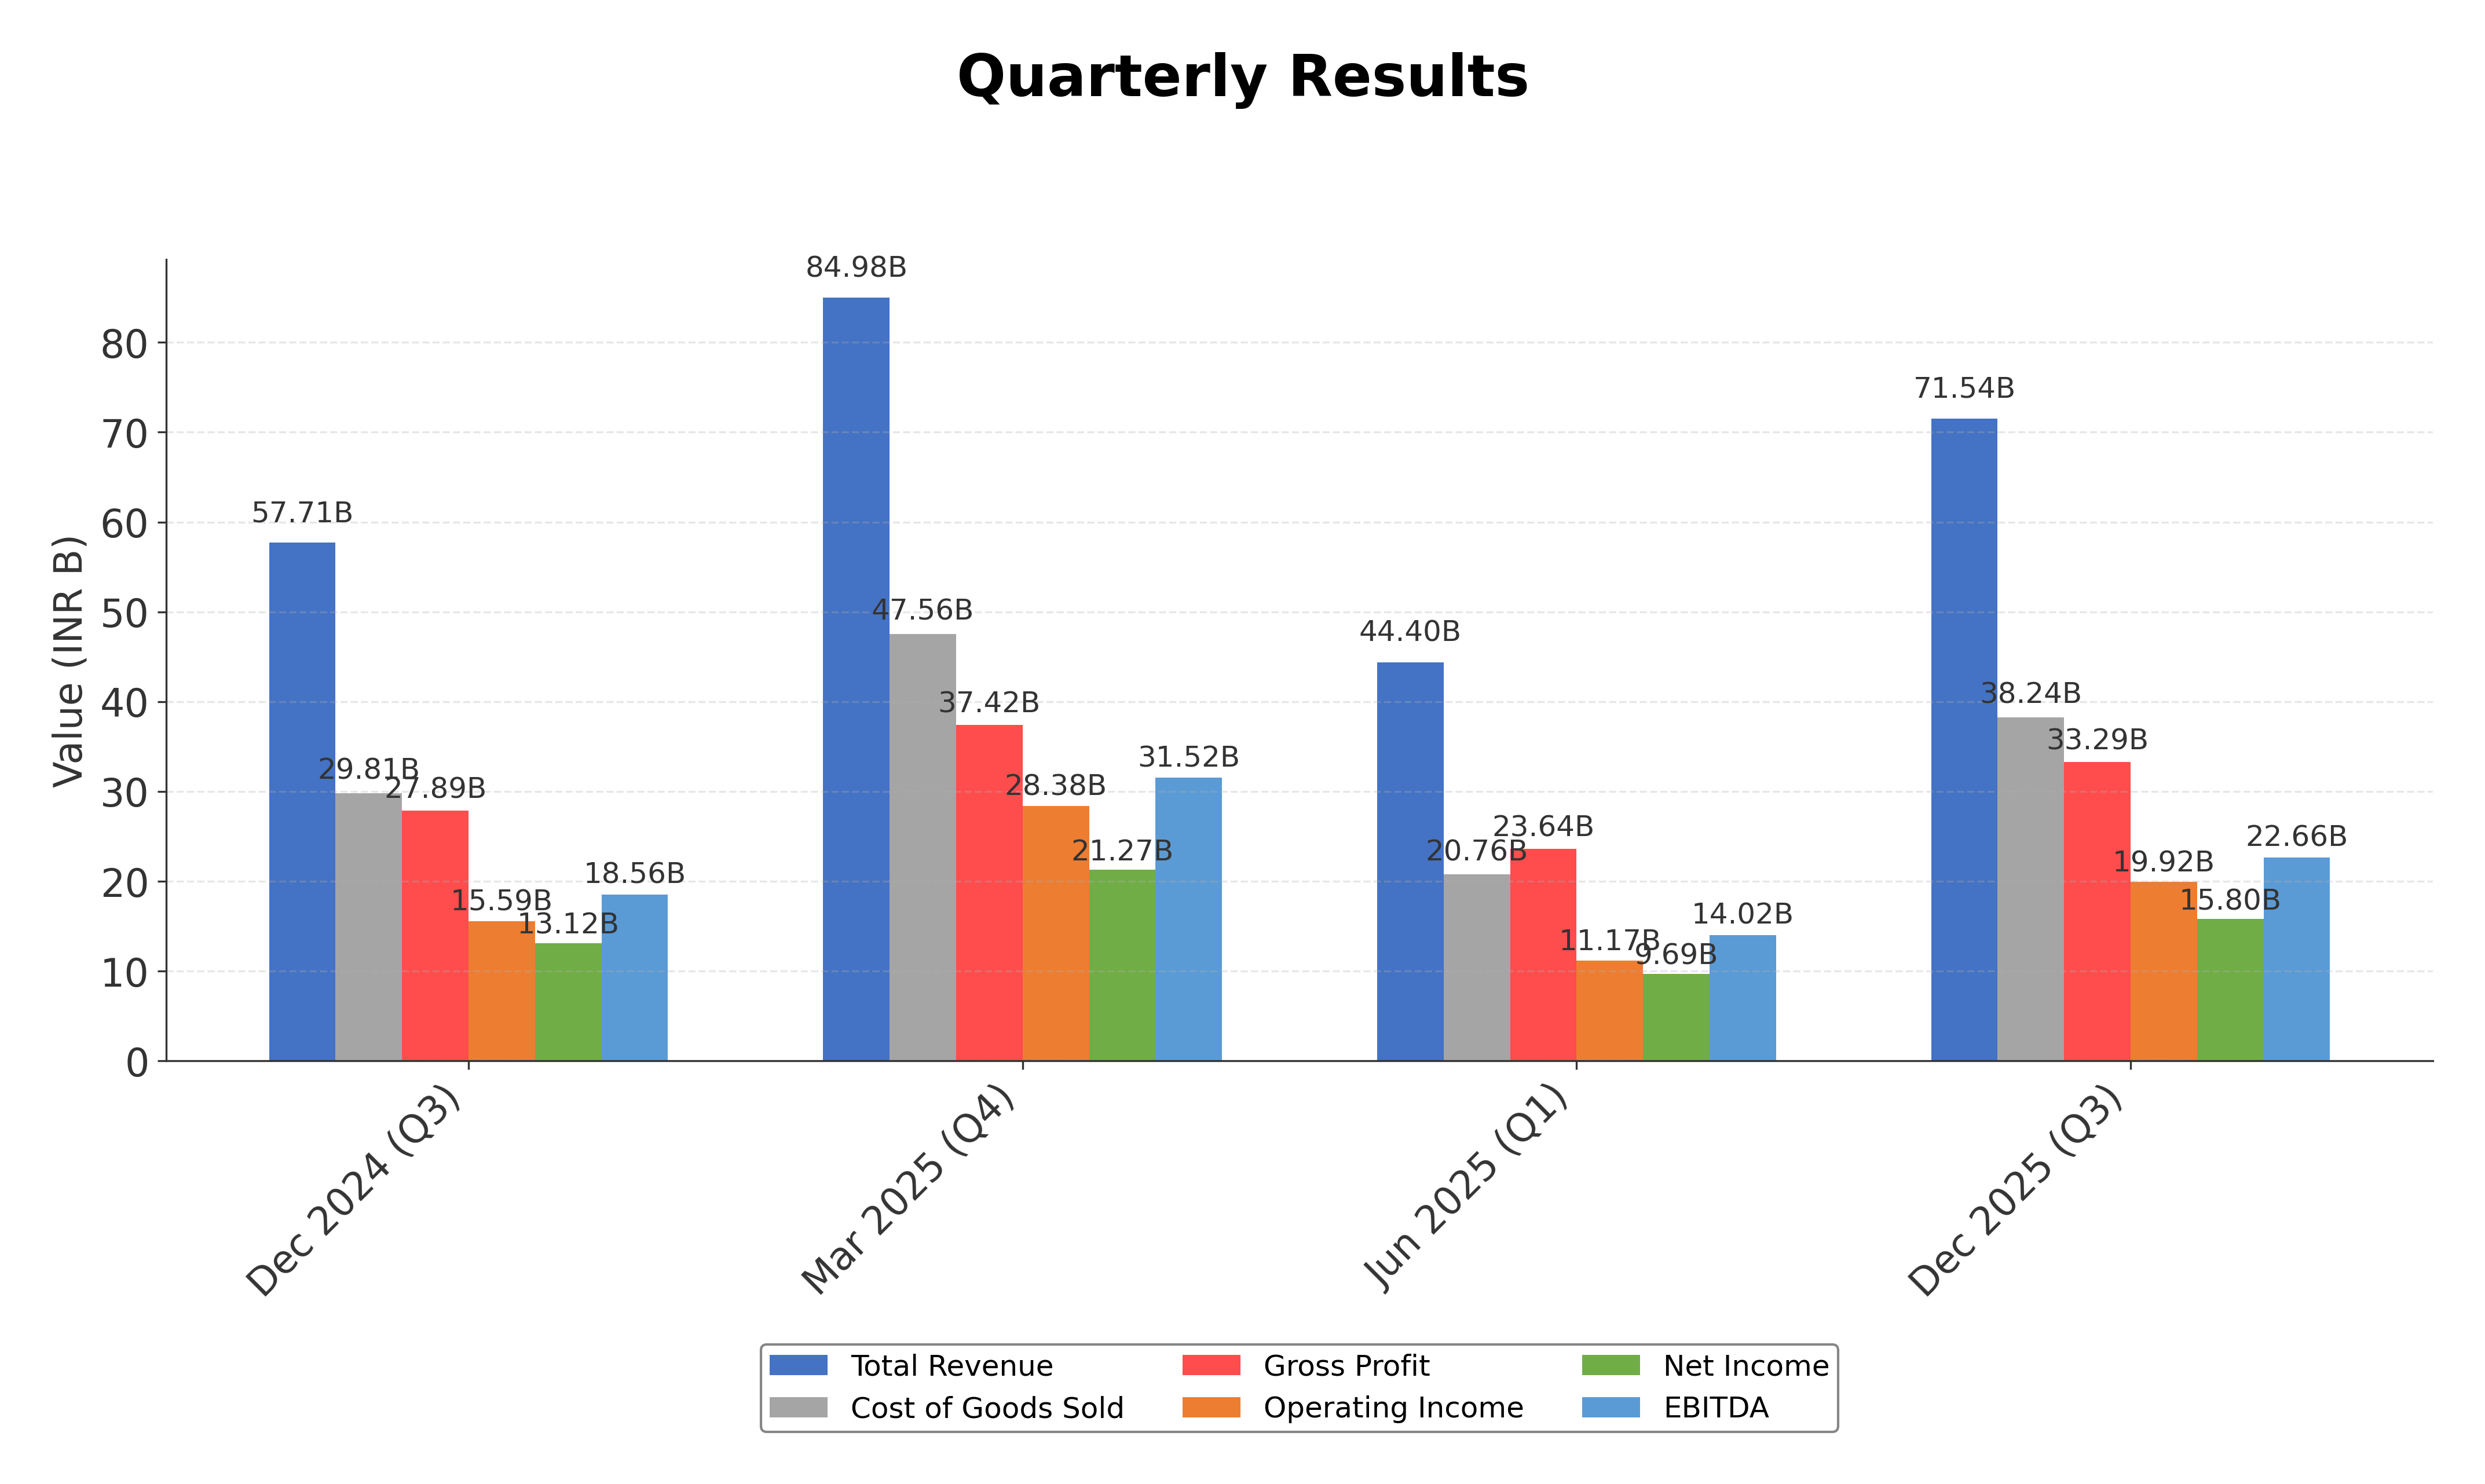
- Robust revenue growth of 24% quarterly and significant defense order wins worth over Rs 11,000 crore support a positive growth trajectory.
Cons
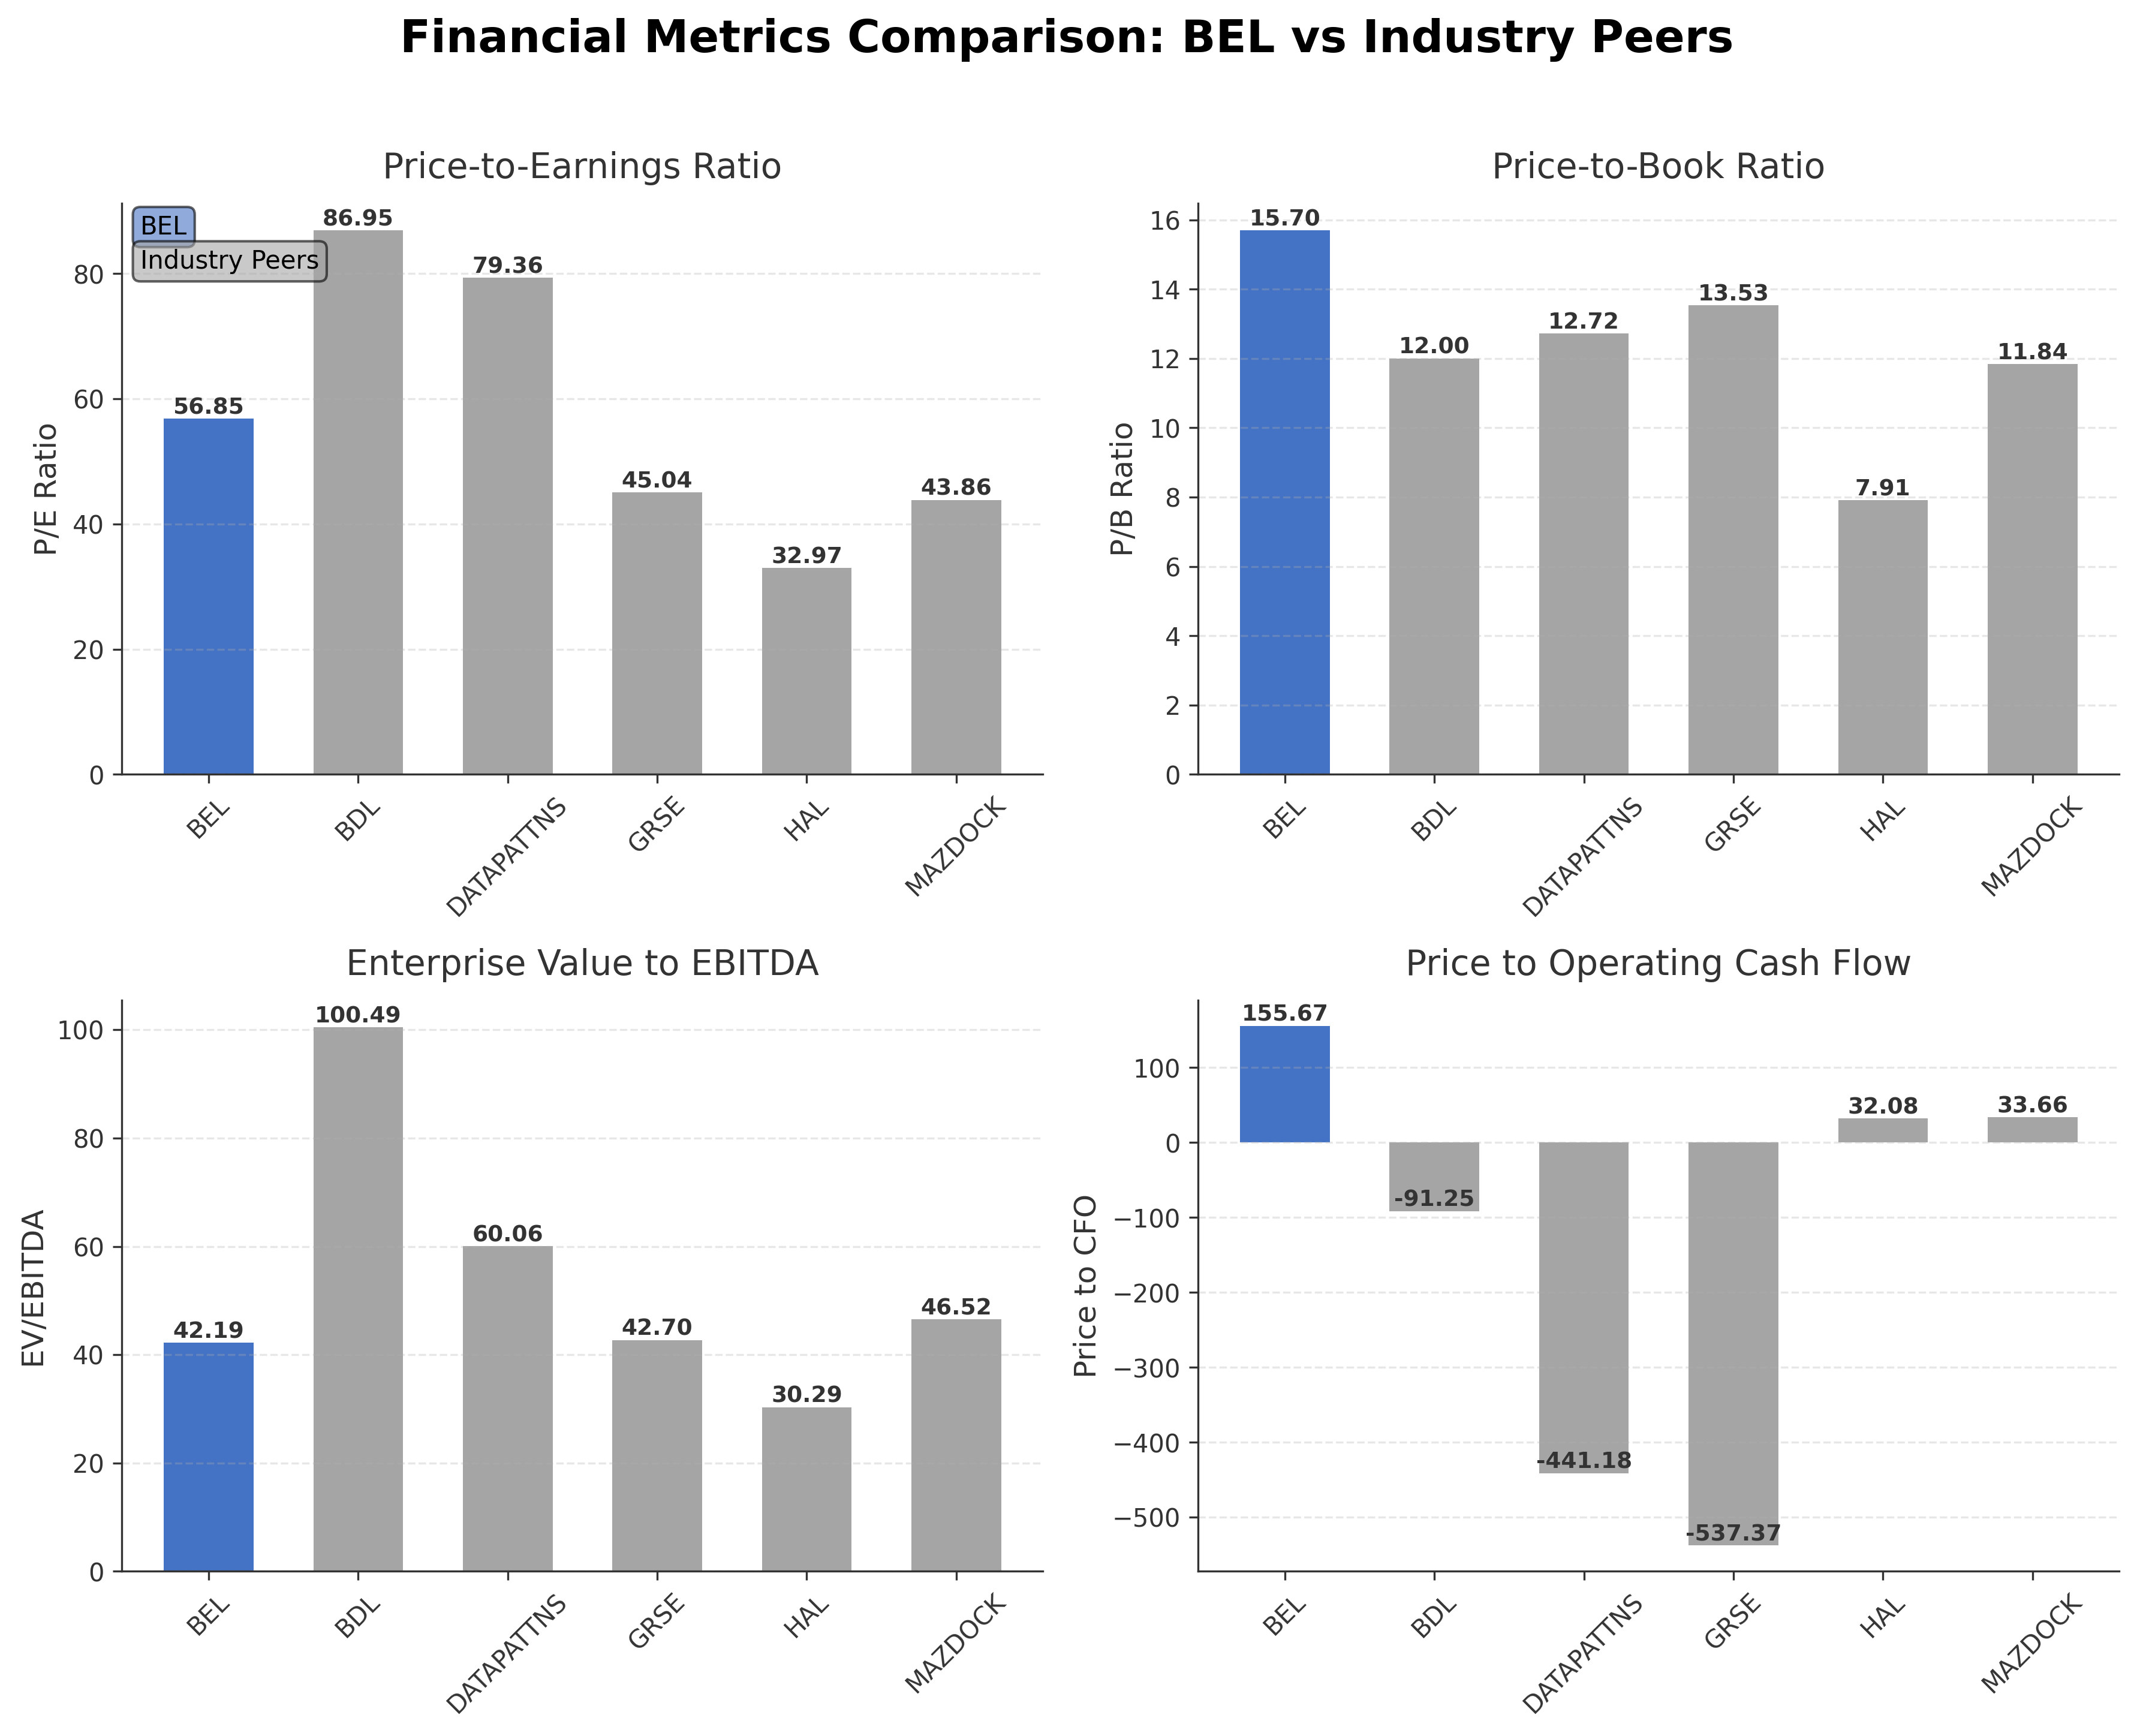
- Valuation metrics are elevated, with a trailing P/E ratio of 56.85 and price-to-book ratio of 15.70, suggesting a premium that may constrain near-term upside.
- Price to cash flow ratio is high at 155.67, indicating stretched valuation relative to cash generation capacity.
- Dependence on government defense contracts exposes the company to regulatory risks and potential fluctuations in defense spending.
Disclosure: This information is for general awareness and does not constitute investment advice
Report Summary
Bharat Electronics Limited (BEL) is a prominent Indian state-owned aerospace and defense company listed on the NSE under the Industrials sector. Established in 1954, BEL specializes in designing and manufacturing electronic products for defense applications, including radar systems, communication equipment, and electronic warfare systems. The company serves the Indian Armed Forces with solutions for land, naval, and airborne platforms and also participates in civilian markets such as railway signaling and solar photovoltaic systems. BEL holds a significant market position as a key contributor to India's defense technology self-reliance and electronics manufacturing capabilities.
Financially, BEL reported trailing twelve months (TTM) revenue of approximately INR 265.35 billion with a gross margin of 46.54%, operating margin of 27.84%, and net profit margin of 22.48%. The company’s return on equity (ROE) stands at 26.62%, and return on assets (ROA) at 13.03%, indicating strong profitability and efficient asset utilization. Operating cash flow for the TTM period was INR 21.73 billion, with levered free cash flow at INR 53.21 billion, reflecting robust cash generation. The company maintains a healthy balance sheet with a low debt-to-equity ratio of 0.273 and a current ratio of 1.76, underscoring solid liquidity and financial stability.
BEL’s valuation metrics show a trailing P/E ratio of 56.85 and a forward P/E of 47.13, with a price-to-book ratio of 15.70 and an enterprise value to EBITDA multiple of 42.19. The market capitalization is approximately INR 3.38 trillion. The stock trades near its 52-week high of INR 473.45, currently priced at INR 462.75, representing an upside potential of about 2.3% relative to the high. These valuation levels suggest a premium pricing relative to earnings and book value, consistent with its market leadership and growth prospects.
The company’s strengths include strong cash flow generation, low leverage, and a dominant position in the Indian defense electronics sector. Key risks involve regulatory changes, competitive pressures from both domestic and international defense suppliers, and macroeconomic factors impacting defense budgets. Recent strategic actions include a partnership with Infotek Software and Systems Pvt Ltd to accelerate digital transformation using RFID and IoT technologies, enhancing BEL’s diversification beyond traditional defense products. Additionally, the company secured defense orders worth over INR 11,000 crore, reinforcing its robust order book.
Technically, BEL’s stock is trading above its 50-day and 200-day moving averages, with momentum indicators reflecting positive trends across daily, weekly, and monthly timeframes. Recent news and market activity suggest increased investor interest amid geopolitical developments affecting the defense sector. Overall, the data indicates a market environment that may favor accumulation or monitoring for further confirmation, with valuation and sector dynamics warranting close observation.
Company and Industry Overview
Company Basics
Price Performance
Company Size
Shareholding Pattern
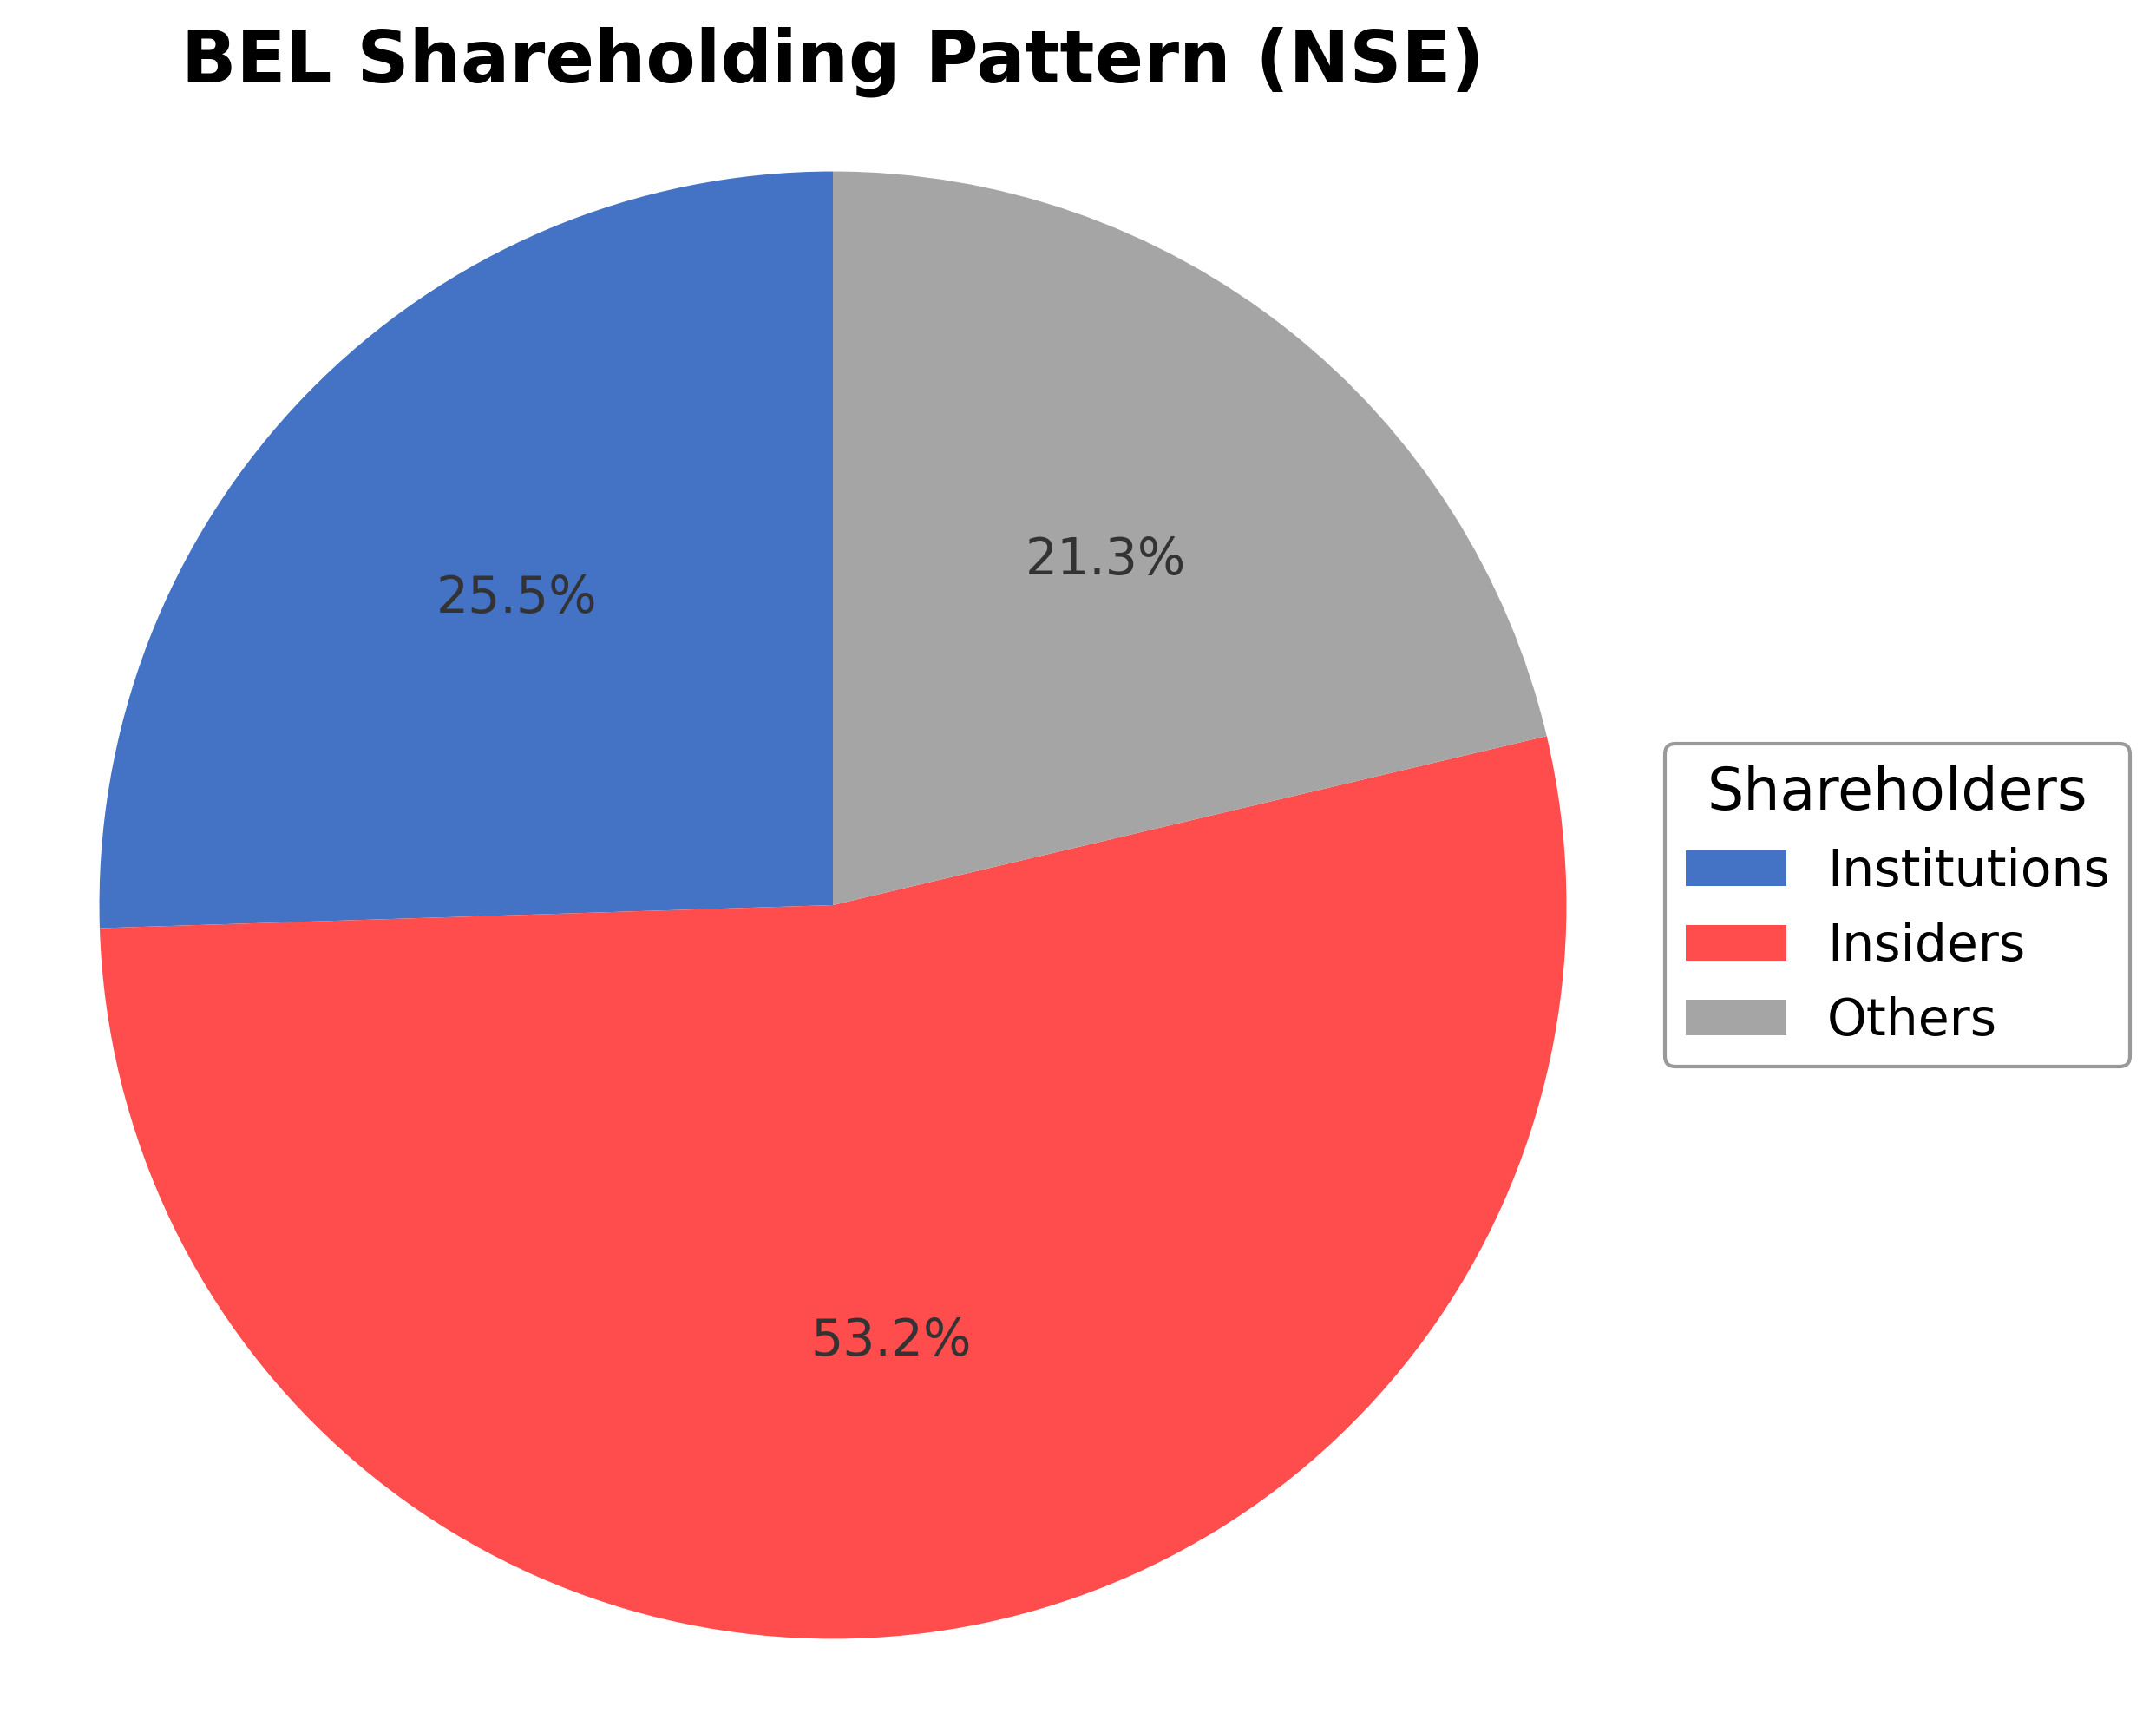
Bharat Electronics Limited’s ownership structure comprises approximately 53.20% held by insiders including executives and government-affiliated entities, 25.50% by institutional investors such as mutual funds and pension funds, and the remaining 21.30% by public shareholders and other retail investors. Over the past 12 to 24 months, institutional investors have shown moderate accumulation, reflecting confidence in the company’s strategic direction and growth prospects. Major funds have increased their stakes in line with the company’s robust order book and diversification initiatives. This shareholding pattern indicates a stable governance framework with significant government backing, supporting strategic decisions and long-term investments in defense technology and related sectors.
Sector and Industry Analysis
The defense electronics sector, where Bharat Electronics Limited (BEL) operates, is a significant component of the broader defense industry, characterized by substantial government spending and strategic importance. The market size is expanding steadily, driven by increasing defense budgets globally and rising demand for advanced electronic systems such as radar, communication, and surveillance equipment. Key players include state-owned enterprises and private firms specializing in defense electronics, with BEL recognized as a leading Indian public sector company in this space.
Industry trends highlight a shift towards modernization and integration of cutting-edge technologies like artificial intelligence, cybersecurity, and network-centric warfare capabilities. Competitive dynamics are influenced by high barriers to entry due to the need for specialized technology, long development cycles, and stringent quality standards. Companies with strong government ties, robust R&D capabilities, and established supply chains, such as BEL, maintain a competitive edge in securing defense contracts and expanding their product portfolios.
The regulatory landscape is dominated by national security considerations and government procurement policies, which heavily influence market access and operational scope. In India, defense production is subject to strict licensing, offset obligations, and indigenous content requirements under initiatives like "Make in India." These regulations aim to boost domestic manufacturing and reduce dependence on imports, benefiting established local players while posing compliance challenges for new entrants and foreign firms.
Note: Analysis synthesized from industry research, market reports, and regulatory filings. Information is subject to change based on market conditions.
Financial Ratios Dashboard
Illustrative Scenario Analysis
DCF Assumptions:
Method: Two-Stage EPS-Priority Model
Financials
Peer Analysis
| Company Name | Market Cap | P/E Ratio | P/B Ratio | EV/EBITDA | Price to CFO |
|---|---|---|---|---|---|
| Bharat Electronics Limited | ₹3.38T | 56.85 | 15.70 | 42.19 | 155.67 |
| Bharat Dynamics Ltd. | ₹506.11B | 86.95 | 12.00 | 100.49 | -91.25 |
| Data Patterns (India) Ltd. | ₹195.62B | 79.36 | 12.72 | 60.06 | -441.18 |
| Garden Reach Shipbuilders & Engineers Ltd. | ₹310.67B | 45.04 | 13.53 | 42.70 | -537.37 |
| Hindustan Aeronautics Ltd. | ₹2.93T | 32.97 | 7.91 | 30.29 | 32.08 |
| Mazagon Dock Shipbuilders Limited | ₹1.06T | 43.86 | 11.84 | 46.52 | 33.66 |
Comparison Analysis: Bharat Electronics Limited commands the largest market capitalization among its peers at ₹3.38 trillion, with a higher P/E ratio of 56.85 compared to most competitors, reflecting premium valuation. Its price-to-book ratio of 15.70 is also the highest, indicating a market premium on its book value. BEL’s EV/EBITDA multiple of 42.19 is in line with Garden Reach Shipbuilders but above Hindustan Aeronautics and Mazagon Dock, suggesting relatively higher valuation multiples. The company’s return on equity of 26.62% is competitive, exceeding most peers except Mazagon Dock. However, BEL’s price to cash flow ratio is significantly higher, indicating a stretched valuation relative to cash generation compared to peers. Overall, BEL stands out for its market leadership and profitability but trades at a notable premium.
Financial Metrics Comparison with Peers
Financial Statements
Comprehensive financial data including income, balance sheet, and cash flow metrics
Income Statement
| fiscal_date | 2025-03-31 | 2024-03-31 | 2023-03-31 | 2022-03-31 | 2021-03-31 |
|---|---|---|---|---|---|
| Sales | 231.17B | 199.05B | 174.04B | 150.85B | 138.50B |
| Cost Of Goods | 121.95B | 105.80B | 98.37B | 89.11B | 80.01B |
| Gross Profit | 109.23B | 93.26B | 75.67B | 61.74B | 58.49B |
| Operating Expense Selling General And Administrative | 638.00M | 640.80M | 582.50M | 483.40M | 417.70M |
| Operating Expense Other Operating Expenses | 15.39B | 17.21B | 11.85B | 8.22B | 7.20B |
| Operating Income | 65.26B | 48.78B | 37.73B | 29.59B | 28.64B |
| Non Operating Interest Income | 6.48B | 5.87B | 2.63B | 1.80B | 638.80M |
| Non Operating Interest Expense | 93.90M | 68.60M | 145.90M | 46.60M | 58.10M |
| Pretax Income | 70.99B | 52.66B | 39.23B | 31.66B | 29.42B |
| Income Tax | 18.12B | 13.23B | 9.83B | 8.12B | 8.72B |
| Net Income | 53.23B | 39.85B | 29.86B | 24.00B | 21.00B |
| Eps Basic | 7.28 | 5.45 | 4.09 | 3.28 | 2.87 |
| Eps Diluted | 7.28 | 5.45 | 4.09 | 3.28 | 2.87 |
| Basic Shares Outstanding | 7.31B | 7.31B | 7.31B | 7.31B | 7.31B |
| Diluted Shares Outstanding | 7.31B | 7.31B | 7.31B | 7.31B | 7.31B |
| Ebit | 71.08B | 52.73B | 39.38B | 31.71B | 29.48B |
| Ebitda | 77.17B | 59.67B | 44.78B | 35.88B | 33.78B |
| Net Income Continuous Operations | 71.35B | 53.08B | 39.69B | 32.12B | 29.72B |
| Minority Interests | -12.40M | -7.20M | -18.20M | -13.50M | -8.20M |
| Preferred Stock Dividends | 0.00 | 0.00 | 0.00 | 0.00 | 0.00 |
Data provided by Twelve Data
Balance Sheet
| fiscal_date | 2025-03-31 | 2024-03-31 | 2023-03-31 | 2022-03-31 | 2021-03-31 |
|---|---|---|---|---|---|
| Cash And Cash Equivalents | 7.13B | 12.06B | 39.46B | 13.01B | 30.43B |
| Accounts Receivable | 91.16B | 73.92B | 70.33B | 61.08B | 65.62B |
| Total Assets | 408.32B | 395.27B | 354.91B | 339.11B | 294.90B |
| Total Liabilities | 208.39B | 231.82B | 216.12B | 216.08B | 184.15B |
| Long Term Debt | 586.90M | 602.50M | 594.20M | 515.10M | 11.70M |
| Shareholders Equity | 199.93B | 163.44B | 138.79B | 123.02B | 110.75B |
Data provided by Twelve Data
Cash Flow Statement
| fiscal_date | 2025-03-31 | 2024-03-31 | 2023-03-31 | 2022-03-31 | 2021-03-31 |
|---|---|---|---|---|---|
| Operating Activities Net Income | 71.35B | 53.08B | 39.69B | 32.12B | 29.72B |
| Operating Activities Other Non Cash Items | -6.29B | -5.81B | -2.63B | -1.35B | -243.80M |
| Operating Activities Accounts Receivable | -17.24B | -11.90B | -13.00B | 3.30B | 798.30M |
| Operating Activities Other Assets Liabilities | -26.09B | 5.97B | -1.66B | 8.66B | 11.30B |
| Operating Activities Operating Cash Flow | 21.73B | 41.34B | 22.40B | 42.73B | 41.57B |
| Investing Activities Capital Expenditures | -10.08B | -6.44B | -5.89B | -5.47B | -4.68B |
| Investing Activities Other Investing Activity | 700.00K | 1.00M | 22.80M | N/A | N/A |
| Investing Activities Investing Cash Flow | -10.08B | -6.44B | -5.86B | -50.48B | -26.56B |
| Financing Activities Common Dividends | -16.81B | -14.62B | -12.43B | -10.23B | -10.23B |
| Financing Activities Financing Cash Flow | -16.81B | -14.62B | -12.94B | -10.71B | -10.59B |
| End Cash Position | 7.13B | 12.06B | 39.46B | 13.01B | 30.43B |
| Free Cash Flow | -4.25B | 40.07B | 6.09B | 36.53B | 46.24B |
| Financing Activities Other Financing Charges | N/A | N/A | -507.90M | -475.70M | -367.00M |
| Investing Activities Purchase Of Investments | N/A | N/A | N/A | -45.01B | -21.88B |
| Investing Activities Sale Of Investments | N/A | N/A | N/A | N/A | N/A |
Data provided by Twelve Data
Technical Analysis
Key Insights
- Bharat Electronics Limited’s stock is currently in a sustained uptrend, trading near its 52-week high with strong price momentum observed over recent months.
- Key support levels are identified near INR 430 and INR 410, while resistance is observed close to the 52-week high at INR 473.45.
- The stock price is above its 10-day, 50-day (INR 437.24), and 200-day (INR 411.72) moving averages, indicating bullish momentum across short and long-term timeframes.
- Momentum indicators show a Relative Strength Index (RSI) near 70, suggesting the stock is approaching overbought conditions; MACD remains positive with a widening gap between signal and MACD lines; Stochastic oscillator is also elevated.
- Analysis across daily, weekly, and monthly charts confirms consistent upward momentum with no major reversal signals currently evident.
- Given the current technical setup, the stock may experience consolidation near resistance levels or a minor pullback before potential continuation of the upward trend.
Trending News
1. Headline: Bharti Airtel Share Price Highlights: Bharti Airtel Stock Price History - The Economic Times
Summary: Discover the Bharti Airtel Stock Liveblog, your go-to destination for real-time updates and comprehensive analysis of a top-performing stock. Keep track of Bharti Airtel's latest details, including: Last traded price 1846.9, Market capitalization: 1125573.44, Volume: 7344777, Price-to-earnings ...
Sentiment: neutral
Summary: BHEL Share Price: Find the latest news on BHEL Stock Price. Get all the information on BHEL with historic price charts for NSE / BSE. Experts & Broker view also get the BHEL Ltd. buy/sell tips detailed news, announcements, Forecasts, Analysts, Valuation, Earning forecasts, Estimates, ...
Sentiment: neutral
3. Headline: BHARAT HEAVY ELECTRICALS LTD. - Share Price | Ratios | BSE/NSE Performance | Live Stock Quote
Summary: Get Bharat Heavy Electricals Ltd. live share price, historical charts, volume, market capitalisation, market performance, reports and other company details.
Sentiment: neutral
4. Headline: BEL Partners i-TEK RFID to Accelerate Smart Digital Transformation Across Industries - The Financial World
Summary: Bengaluru: In a significant step toward advancing India’s digital and industrial ecosystem, Navratna Defence PSU Bharat Electronics Limited (BEL) has entered into a strategic partnership with Infotek Software and Systems Pvt Ltd, a leading player in RFID and IoT-based solutions.
Sentiment: positive
Summary: MTAR Technologies emerged as the top gainer on the Nifty India Defence index, with over 10% rally. Paras Defence and Space Technologies, Data Patterns (India), AXISCADES Technologies and Mishra Dhatu Nigam rallied 3-5%.
Sentiment: positive
Powered by Brave
Recent Updates
News Summary
As of April 2026. Bharat Electronics Limited has recently entered into a strategic partnership with Infotek Software and Systems Pvt Ltd to accelerate digital transformation through RFID and IoT technologies, aligning with its diversification strategy beyond traditional defense products. The company also benefited from a rally in defense stocks amid geopolitical ceasefire hopes between the US and Iran, reflecting increased investor interest in the sector. Additionally, BEL secured defense contracts worth over Rs 11,000 crore, reinforcing its strong order book and supporting expected revenue growth. These developments underscore BEL’s strategic initiatives to enhance technological capabilities and maintain its leadership in the defense manufacturing ecosystem.
News Sentiment
The overall sentiment from recent updates is predominantly positive, driven by strategic partnerships and significant defense order wins that strengthen BEL’s market position and growth outlook. The rally in defense stocks amid geopolitical developments further supports investor confidence. However, some caution is noted due to expectations of moderating momentum in new large-ticket orders, reflecting a balanced view on near-term growth dynamics. The combination of robust contract wins and diversification efforts contributes to a constructive but measured outlook.
Source List
- https://www.thefinancialworld.com/bel-partners-i-tek-rfid-to-accelerate-smart-digital-transformation-across-industries/
- https://www.livemint.com/market/stock-market-news/hal-bel-bdl-to-mazagon-dock-shipbuilders-defence-stocks-rise-up-to-10-amid-ceasefire-hopes-in-us-iran-war-11776233033173.html
- https://www.financialexpress.com/business/industry-order-wins-bharat-electronics-nbcc-gr-infraprojects-railtel-hcc-wabag-hec-infra-projects-4179246/
Analytical Overview
Analysis Summary
Bharat Electronics Limited’s valuation metrics, including a trailing P/E of 56.85 and forward P/E of 47.13, are elevated relative to the industry average P/E of 56.85 but reflect the company’s premium market position and growth expectations. The company demonstrates a strong growth trajectory with 24% quarterly revenue growth and positive quarterly earnings growth of 20.5%, supported by a robust order book and diversification into digital technologies. Financial health is solid, with a low debt-to-equity ratio of 0.273, a current ratio of 1.76, and strong free cash flow generation of INR 53.21 billion, indicating good liquidity and financial stability. Sector-specific opportunities arise from increasing defense spending in India amid regional tensions, while challenges include potential regulatory changes and competitive pressures. The company benefits from India’s regulatory environment favoring domestic defense manufacturing and growing government focus on technological self-reliance.
Overall Business and Market Assessment
Supporting Factors: Key supporting factors include BEL’s strong profitability with a 22.48% net margin, robust cash flow generation, and strategic diversification into digital transformation technologies. Risks to monitor involve valuation premium levels, potential moderation in new large-ticket defense orders, and geopolitical uncertainties affecting defense budgets. The appropriate investment timeframe is medium to long-term, given the company’s stable fundamentals and exposure to secular growth trends in defense and technology sectors. Overall, the analysis suggests a balanced outlook with strengths in financial performance and market position tempered by valuation considerations and sector-specific risks.
Risk Factors: No data
SWOT Analysis
Strengths
- Bharat Electronics Limited has a strong market position as a leading defense electronics manufacturer in India.
- The company maintains robust profitability with a net profit margin of 22.48% and return on equity of 26.62%.
- Low debt-to-equity ratio of 0.273 supports financial stability and liquidity.
- Strategic partnerships and diversification into digital and IoT technologies enhance growth potential.
Weaknesses
- High valuation multiples including a P/E ratio of 56.85 and price-to-book ratio of 15.70 may limit near-term upside.
- Dependence on government defense contracts exposes the company to regulatory and budgetary risks.
- Price to cash flow ratio is elevated at 155.67, indicating stretched valuation relative to cash generation.
Opportunities
- Increasing defense spending in India amid regional geopolitical tensions supports demand growth.
- Expansion into civilian sectors such as solar power and railway signaling offers diversification benefits.
- Digital transformation initiatives and IoT partnerships can unlock new revenue streams.
Threats
- Potential regulatory changes or delays in defense procurement could impact order inflows.
- Intense competition from domestic and international defense suppliers may pressure margins.
- Macroeconomic uncertainties and geopolitical risks could affect defense budgets and investor sentiment.
Company Description
Bharat Electronics Limited is a leading Indian state-owned aerospace and defense company specializing in designing and manufacturing electronic products for the defense sector. Established in 1954 under the Ministry of Defence of India, it plays a critical role in ensuring technological self-reliance by producing a wide array of radar systems, communication equipment, and electronic warfare systems. Bharat Electronics Limited serves various sectors, such as the Indian Armed Forces, with solutions tailored for land, naval, and airborne deployments. Its products include advanced radars, avionics, missile systems, and sonar systems, making it a linchpin in India's defense readiness. Additionally, the company is involved in non-defense electronics and civic infrastructure, contributing to national development projects through electronics for railway signaling, solar photovoltaic systems, and electronic voting machines. As a significant player in the defense and civilian market segments, Bharat Electronics Limited is key to India's electronics manufacturing prowess and technological advancement, enhancing domestic capabilities while supporting national security measures.