


Bharat Electronics Limited (BEL)
Stock Analysis Report
Stock Journey
Key Positives and Key Risks
Pros
- High return on equity of 27.56% demonstrates efficient capital utilization and strong profitability.
- Robust order book exceeding ₹74,000 crore provides revenue visibility and operational momentum.
- Low debt-to-equity ratio of 0.27 and substantial cash reserves of ₹85.7 billion indicate financial strength.
Cons
- Elevated valuation multiples with a trailing P/E of 49.05 and price-to-book of 12.41 may constrain upside.
- Negative free cash flow of approximately ₹-3.91 billion suggests potential liquidity management concerns.
- Geopolitical and supply chain risks could impact contract execution and margins.
Disclosure: This information is for general awareness and does not constitute investment advice
Report Summary
Bharat Electronics Limited (BEL) is a prominent Indian state-owned aerospace and defense company listed on the NSE, operating within the Industrials sector. Established in 1954 under the Ministry of Defence, BEL specializes in designing and manufacturing advanced electronic products including radar systems, communication equipment, and electronic warfare systems for defense applications. The company serves various branches of the Indian Armed Forces and also contributes to civilian infrastructure projects such as railway signaling and electronic voting machines. Its market positioning as a critical supplier to India's defense sector underscores its strategic importance and technological expertise.
Financially, BEL reported trailing twelve months (TTM) revenue of approximately ₹276.1 billion with a gross margin of 48.2%, operating margin of 27.5%, and a net profit margin of 21.96%, indicating robust profitability and operational efficiency. The company’s return on equity (ROE) stands at 27.56%, and return on assets (ROA) at 10.97%, reflecting effective capital utilization and asset management. These metrics demonstrate BEL’s strong financial health and its ability to generate significant returns for shareholders while maintaining solid operational performance.
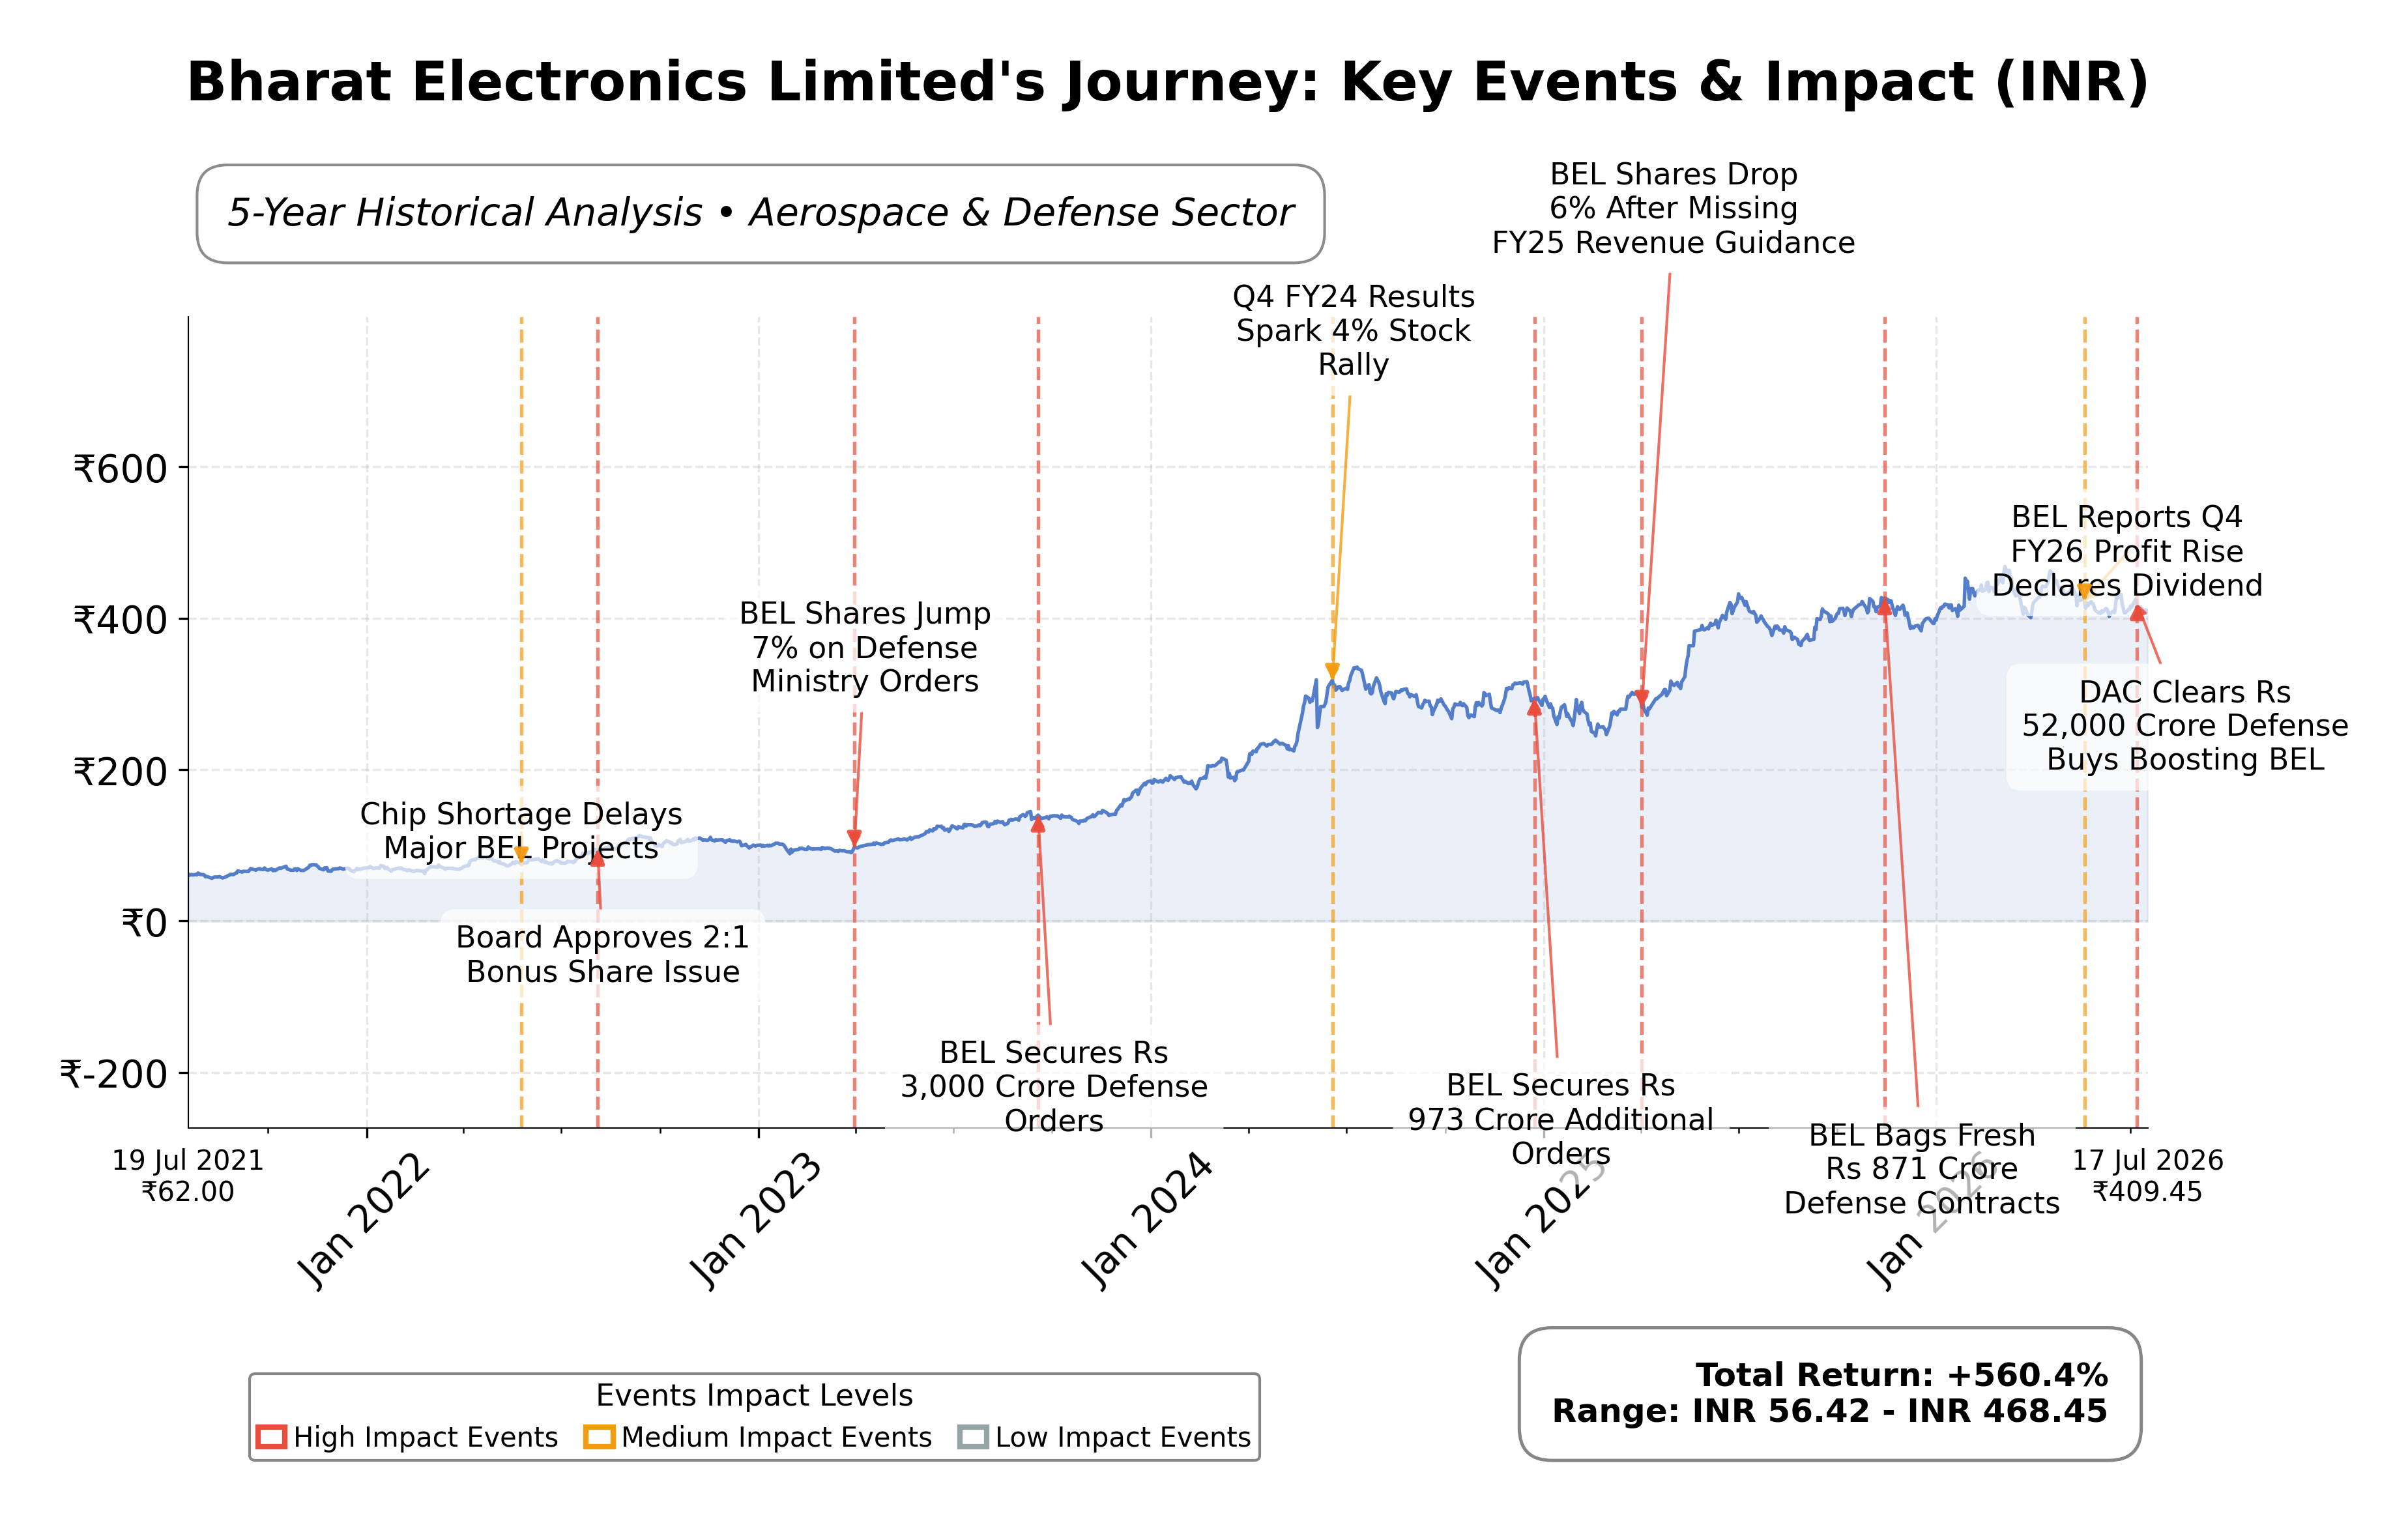
From a valuation perspective, BEL trades at a trailing P/E ratio of 49.05 and a forward P/E of 35.77, with a price-to-book ratio of 12.41 and an EV/EBITDA multiple of 35.91. The market capitalization is approximately ₹2.99 trillion. The stock’s 52-week price range is ₹361.20 to ₹473.45, with the current price near ₹408.65, positioning it below its recent high but above the low, suggesting a moderate valuation premium relative to its fundamentals and peers. The PEG ratio of 0.70 indicates growth expectations are factored into the current price.
BEL’s strengths include a strong cash position of ₹85.7 billion against a low total debt of ₹654.6 million, a healthy current ratio of 1.98, and a diversified order book with recent fresh orders worth ₹572 crore. Key risks involve regulatory and geopolitical uncertainties impacting defense procurement, competitive pressures within the aerospace and defense industry, and supply chain challenges. Recent strategic developments include sustained order inflows and management focus on ramping up non-defense and export business segments, reflecting proactive growth initiatives.
Technically, the stock is trading near its 50-day and 200-day moving averages, with a beta of 0.25 indicating low volatility relative to the market. Momentum indicators suggest a stable trend with moderate strength across daily, weekly, and monthly timeframes. Market conditions appear balanced with key support near ₹361 and resistance around ₹473. Overall, the data suggests a cautious stance with potential for accumulation under favorable conditions, warranting continued observation of operational and market developments.
Company and Industry Overview
Company Basics
Price Performance
Company Size
Shareholding Pattern
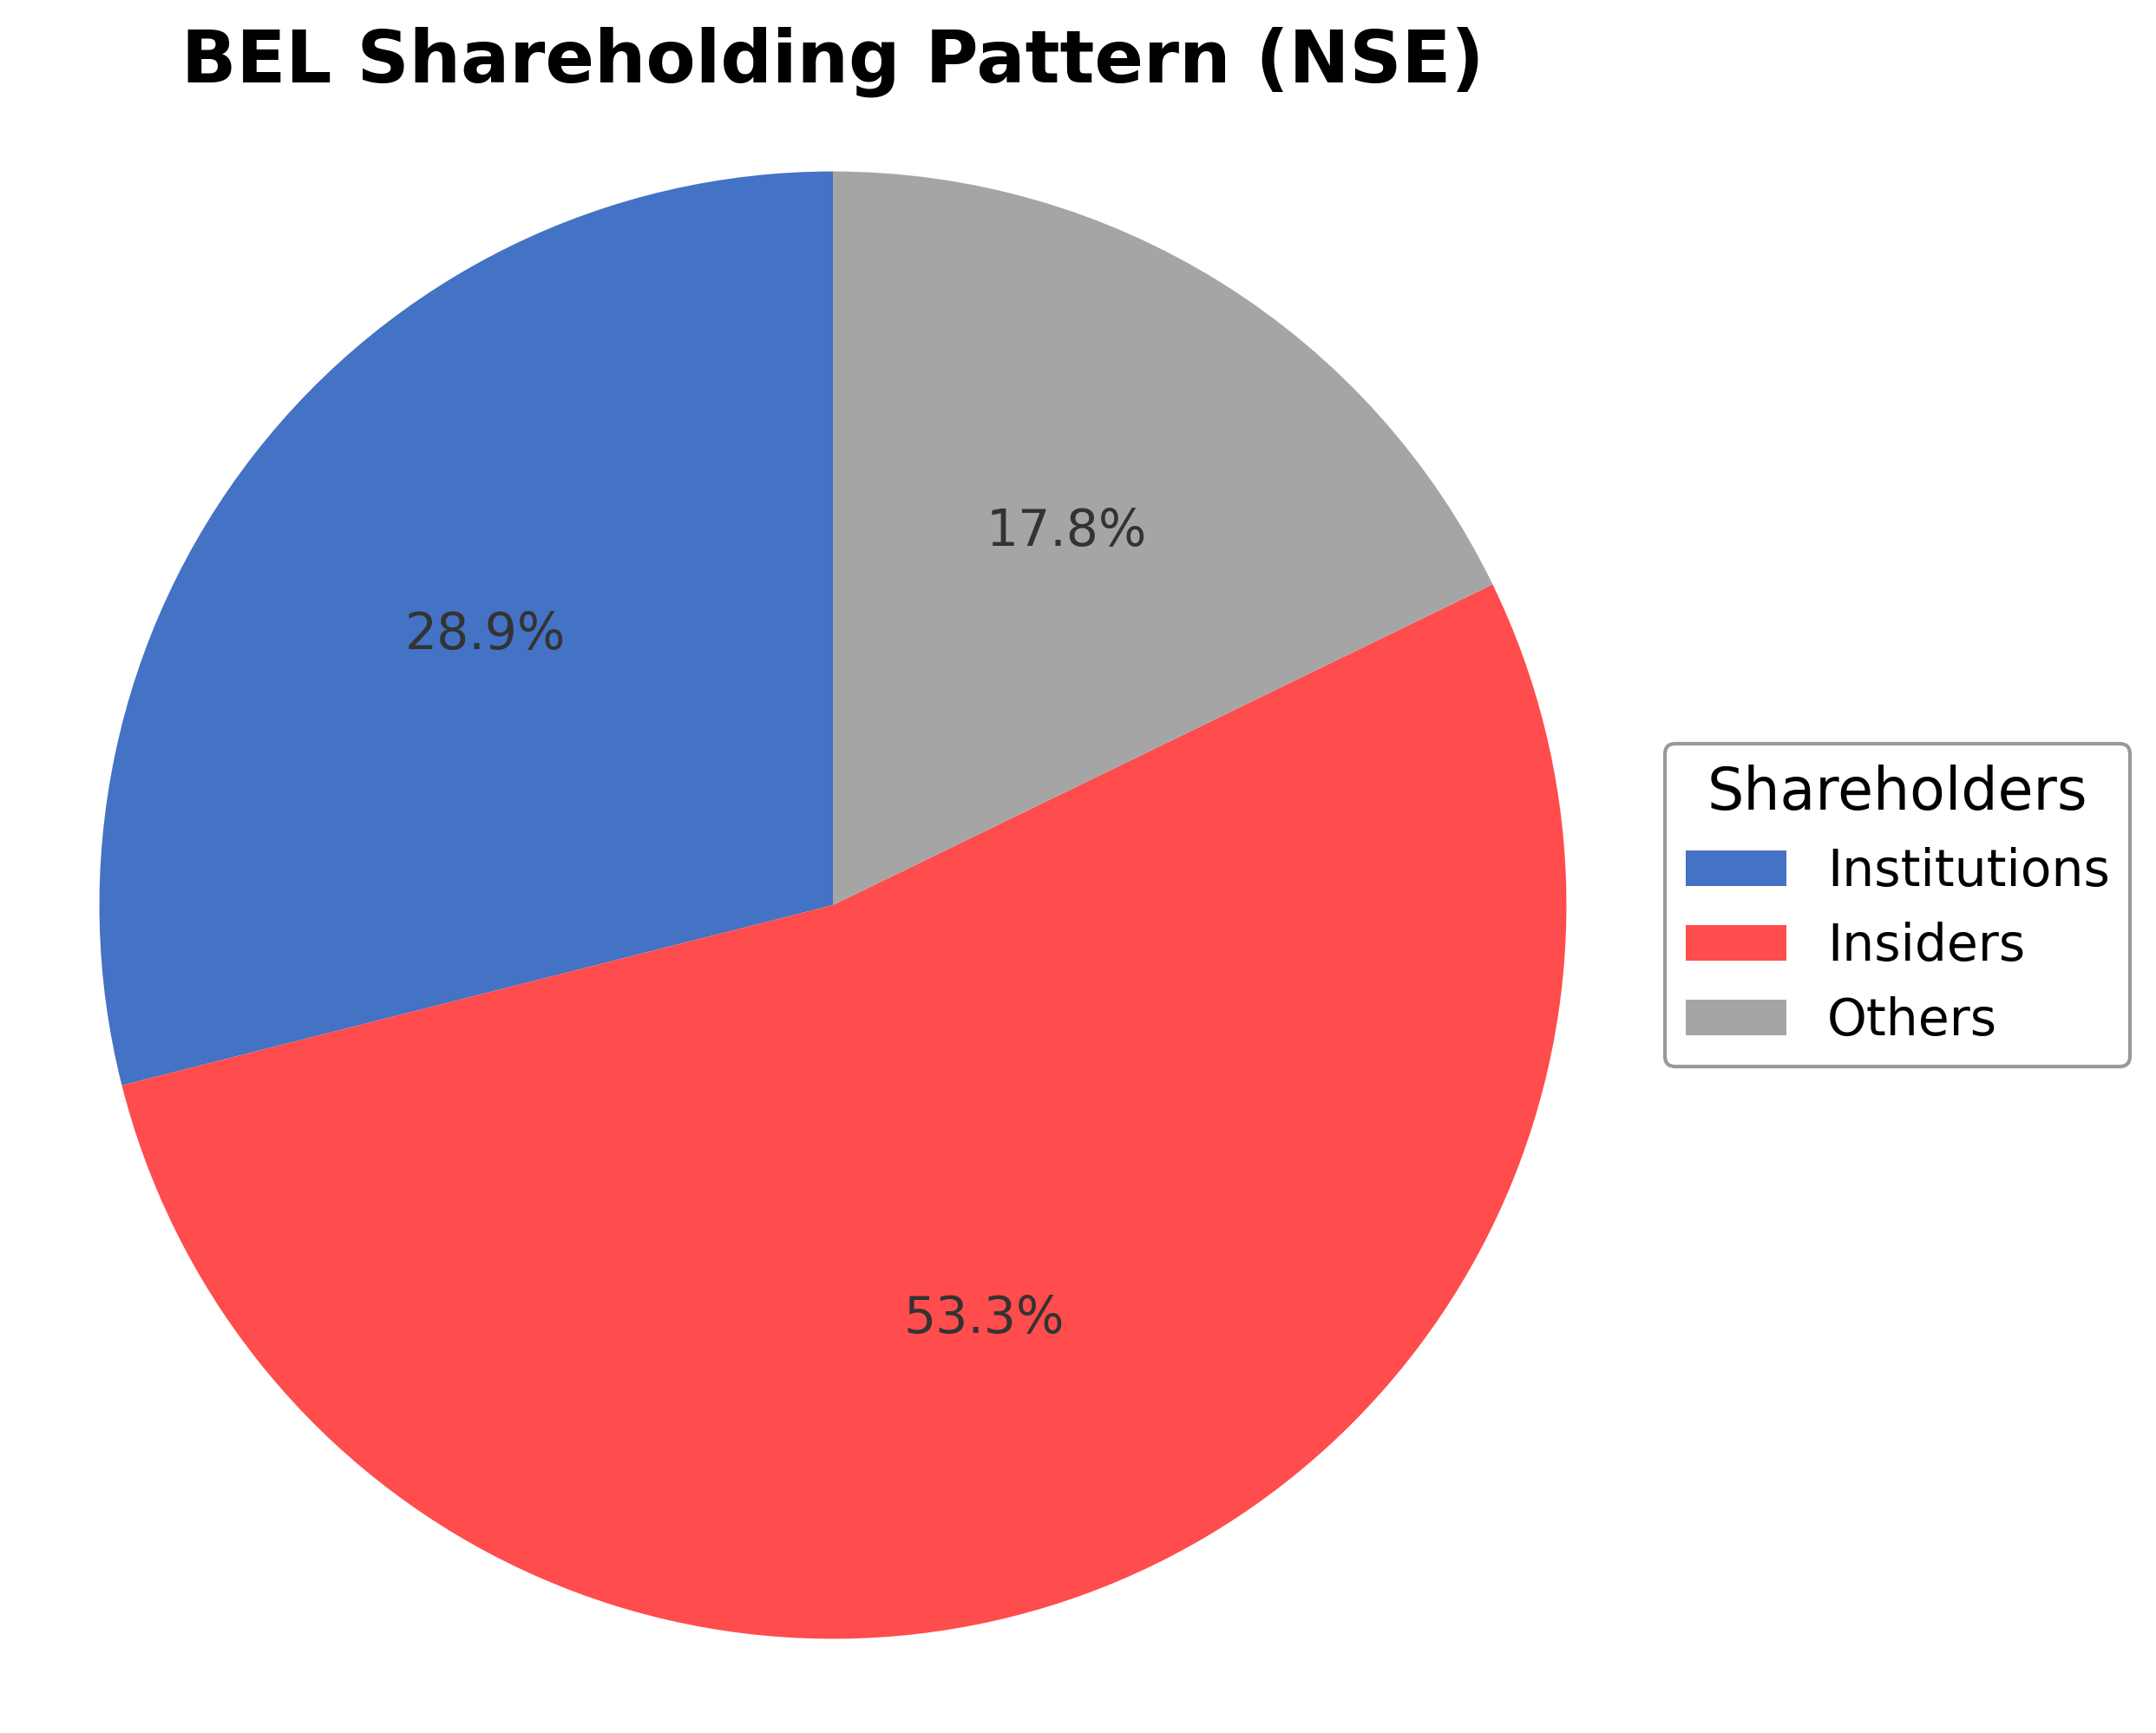
Bharat Electronics Limited's ownership structure is dominated by insiders, who hold approximately 53.25% of shares, reflecting significant control by executives, board members, and government-affiliated individuals. Institutional investors own about 28.95%, comprising mutual funds, pension funds, and asset managers, indicating moderate institutional interest and confidence. The remaining 17.80% is held by public shareholders including retail investors and employee stock plans. Over the past 12-24 months, institutional accumulation has been steady with no major shifts reported, suggesting stable market sentiment. This ownership pattern supports strong governance aligned with strategic national defense objectives and positions the company for continued focus on technological advancement and market leadership within the aerospace and defense sector.
Sector and Industry Analysis
The defense electronics sector in India is a significant component of the broader defense industry, characterized by steady growth driven by increasing government defense expenditure and modernization efforts. The market size has expanded consistently, supported by rising demand for advanced electronic systems in military applications. Key players include Bharat Electronics Limited (BEL), which dominates the domestic market, alongside other public and private sector entities contributing to the supply chain.
Industry trends highlight a shift towards indigenous development and self-reliance, with companies focusing on innovation in radar, communication, and electronic warfare systems. Competitive dynamics are shaped by high entry barriers due to technological complexity, stringent quality standards, and long gestation periods for product development. Firms like BEL benefit from established government relationships and a robust order book, while expanding efforts into international and civilian markets to diversify revenue streams.
The regulatory environment is governed by the Indian Ministry of Defence and associated bodies, emphasizing Make in India initiatives and stringent compliance with defense procurement policies. Export controls and technology transfer restrictions also influence operational strategies. Ongoing reforms aim to enhance transparency and encourage private sector participation, which could reshape competitive positioning and market access in the medium term.
Note: Analysis synthesized from industry research, market reports, and regulatory filings. Information is subject to change based on market conditions.
Financial Ratios Dashboard
Illustrative Scenario Analysis
DCF Assumptions:
Method: Two-Stage EPS-Priority Model
Financials
Peer Analysis
| Company Name | Market Cap | P/E Ratio | P/B Ratio | EV/EBITDA | Price to CFO |
|---|---|---|---|---|---|
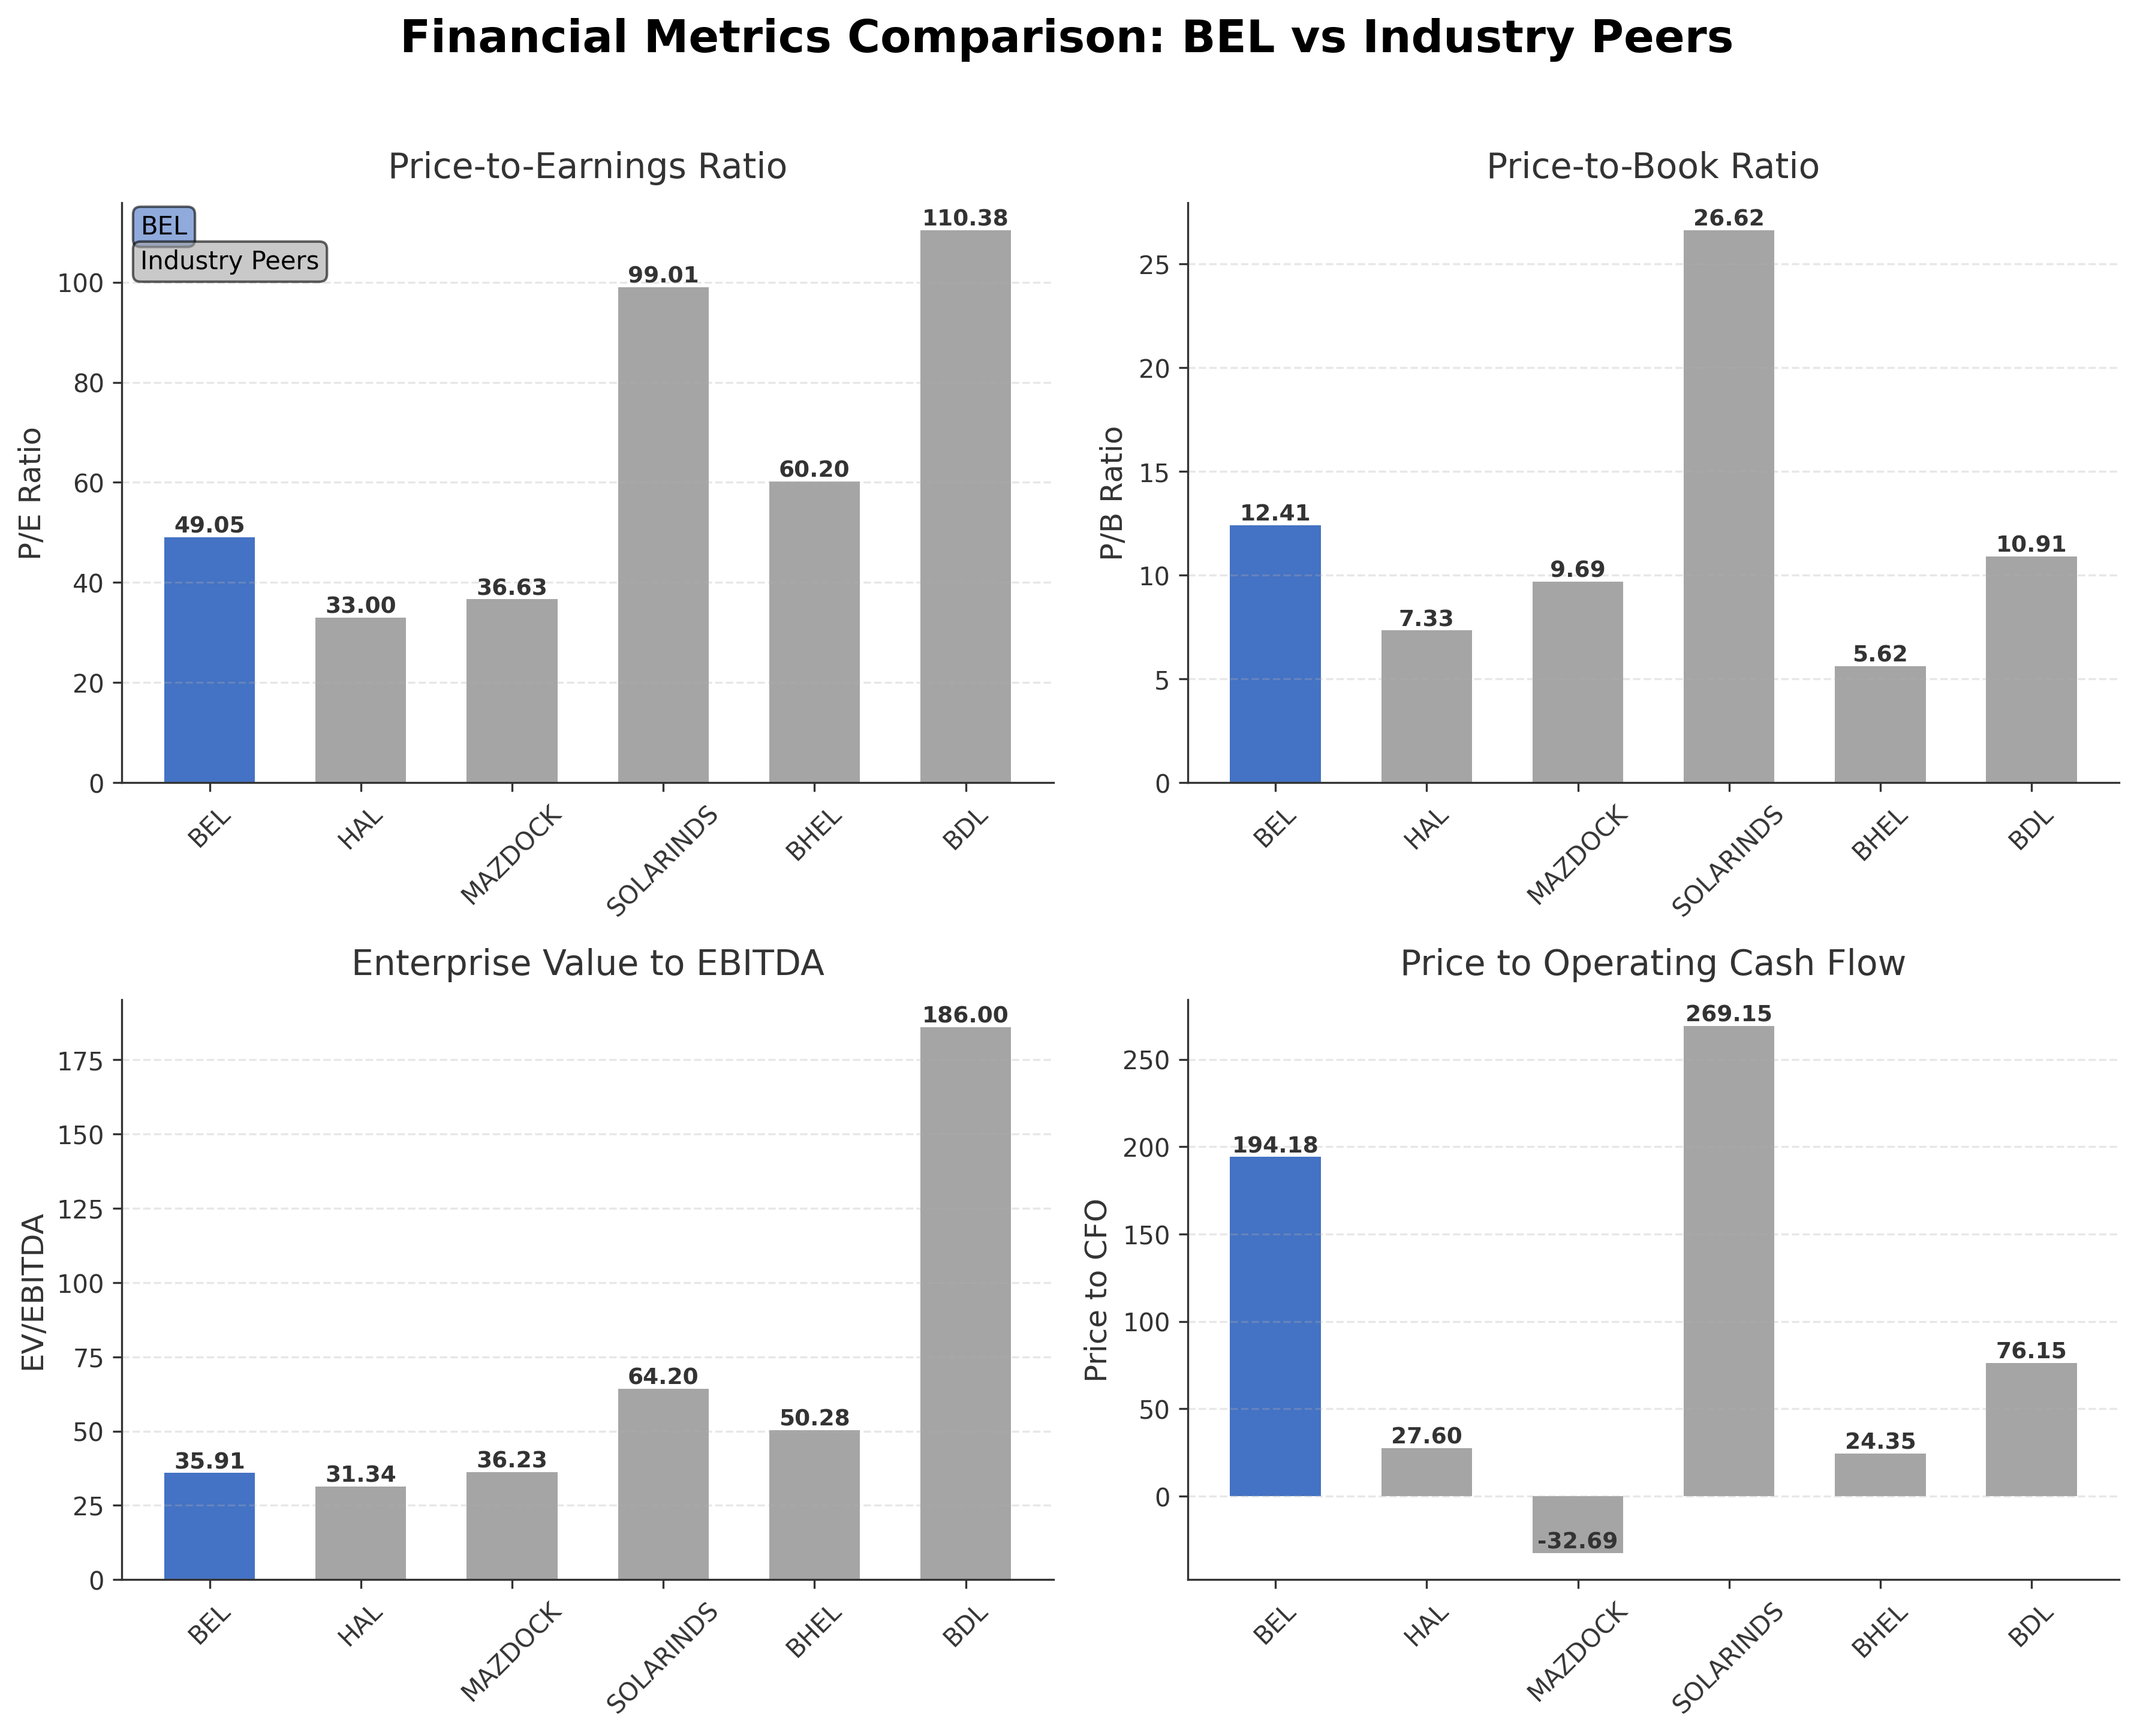
| Bharat Electronics Limited | ₹2.99T | 49.05 | 12.41 | 35.91 | 194.18 |
| Hindustan Aeronautics Ltd. | ₹3.01T | 33.00 | 7.33 | 31.34 | 27.60 |
| Mazagon Dock Shipbuilders Limited | ₹945.04B | 36.63 | 9.69 | 36.23 | -32.69 |
| Solar Industries India Ltd. | ₹1.67T | 99.01 | 26.62 | 64.20 | 269.15 |
| Bharat Heavy Electricals Ltd. | ₹1.47T | 60.20 | 5.62 | 50.28 | 24.35 |
| Bharat Dynamics Ltd. | ₹459.96B | 110.38 | 10.91 | 186.00 | 76.15 |
Comparison Analysis: Bharat Electronics Limited (BEL) holds a market capitalization comparable to its largest peer Hindustan Aeronautics Ltd. but trades at a higher P/E ratio of 49.05 versus HAL’s 33.00, indicating a premium valuation. BEL’s price-to-book ratio of 12.41 is significantly higher than HAL’s 7.33 and BHEL’s 5.62, reflecting strong market expectations for growth and profitability. Its EV/EBITDA multiple of 35.91 is in line with industry peers like Mazagon Dock and lower than Solar Industries, which trades at a much higher multiple. BEL’s return on equity at 27.56% is among the highest in the peer group, demonstrating efficient capital use. However, its price to cash flow ratio is notably elevated at 194.18, suggesting cautious scrutiny of cash flow sustainability relative to peers.
Financial Metrics Comparison with Peers
Financial Statements
Comprehensive financial data including income, balance sheet, and cash flow metrics
Income Statement
| fiscal_date | 2026-03-31 | 2025-03-31 | 2024-03-31 | 2023-03-31 | 2022-03-31 |
|---|---|---|---|---|---|
| Sales | 276.10B | 237.69B | 199.05B | 174.04B | 150.85B |
| Cost Of Goods | 140.33B | 121.87B | 105.80B | 98.37B | 89.11B |
| Gross Profit | 135.77B | 115.82B | 93.26B | 75.67B | 61.74B |
| Operating Expense Other Operating Expenses | 24.12B | 19.87B | 17.21B | 11.85B | 8.22B |
| Operating Income | 74.94B | 63.66B | 48.78B | 37.73B | 29.59B |
| Non Operating Interest Expense | 67.30M | 96.80M | 68.60M | 145.90M | 46.60M |
| Pretax Income | 80.53B | 70.99B | 52.66B | 39.23B | 31.66B |
| Income Tax | 20.29B | 18.12B | 13.23B | 9.83B | 8.12B |
| Net Income | 60.62B | 53.23B | 39.85B | 29.86B | 24.00B |
| Ebit | 80.60B | 71.09B | 52.73B | 39.38B | 31.71B |
| Ebitda | 86.15B | 75.76B | 59.67B | 44.78B | 35.88B |
| Net Income Continuous Operations | 80.92B | 71.35B | 53.08B | 39.69B | 32.12B |
| Minority Interests | -2.60M | -12.40M | -7.20M | -18.20M | -13.50M |
| Preferred Stock Dividends | 0.00 | 0.00 | 0.00 | 0.00 | 0.00 |
| Operating Expense Selling General And Administrative | N/A | 638.00M | 640.80M | 582.50M | 483.40M |
| Non Operating Interest Income | N/A | 6.48B | 5.87B | 2.63B | 1.80B |
| Eps Basic | N/A | 7.28 | 5.45 | 4.09 | 3.28 |
| Eps Diluted | N/A | 7.28 | 5.45 | 4.09 | 3.28 |
| Basic Shares Outstanding | N/A | 7.31B | 7.31B | 7.31B | 7.31B |
| Diluted Shares Outstanding | N/A | 7.31B | 7.31B | 7.31B | 7.31B |
Data provided by Twelve Data
Balance Sheet
| fiscal_date | 2026-03-31 | 2025-03-31 | 2024-03-31 | 2023-03-31 | 2022-03-31 |
|---|---|---|---|---|---|
| Cash And Cash Equivalents | 18.88B | 7.13B | 12.06B | 39.46B | 13.01B |
| Accounts Receivable | 128.76B | 91.16B | 73.92B | 70.33B | 61.08B |
| Total Assets | 445.38B | 408.32B | 395.27B | 354.91B | 339.11B |
| Total Liabilities | 205.30B | 208.39B | 231.82B | 216.12B | 216.08B |
| Long Term Debt | 624.30M | 586.90M | 602.50M | 594.20M | 515.10M |
| Shareholders Equity | 240.07B | 199.93B | 163.44B | 138.79B | 123.02B |
Data provided by Twelve Data
Cash Flow Statement
| fiscal_date | 2026-03-31 | 2025-03-31 | 2024-03-31 | 2023-03-31 | 2022-03-31 |
|---|---|---|---|---|---|
| Operating Activities Net Income | 80.92B | 71.35B | 53.08B | 39.69B | 32.12B |
| Operating Activities Other Non Cash Items | -5.52B | -6.31B | -5.81B | -2.63B | -1.35B |
| Operating Activities Accounts Receivable | -37.61B | -17.24B | -11.90B | -13.00B | 3.30B |
| Operating Activities Other Assets Liabilities | -13.86B | -26.09B | 5.97B | -1.66B | 8.66B |
| Operating Activities Operating Cash Flow | 23.92B | 21.71B | 41.34B | 22.40B | 42.73B |
| Investing Activities Capital Expenditures | -9.81B | -10.08B | -6.44B | -5.89B | -5.47B |
| Investing Activities Other Investing Activity | 139.30M | 18.90M | 1.00M | 22.80M | N/A |
| Investing Activities Investing Cash Flow | -9.68B | -10.06B | -6.44B | -5.86B | -50.48B |
| Financing Activities Common Dividends | -20.83B | -16.81B | -14.62B | -12.43B | -10.23B |
| Financing Activities Financing Cash Flow | -20.83B | -16.81B | -14.62B | -12.94B | -10.71B |
| End Cash Position | 18.88B | 7.13B | 12.06B | 39.46B | 13.01B |
| Free Cash Flow | 5.56B | -4.47B | 40.07B | 6.09B | 36.53B |
| Financing Activities Other Financing Charges | N/A | N/A | N/A | -507.90M | -475.70M |
| Investing Activities Purchase Of Investments | N/A | N/A | N/A | N/A | -45.01B |
Data provided by Twelve Data
Technical Analysis
Key Insights
- The current trend shows a consolidation phase with price hovering near the 50-day (₹416.62) and 200-day (₹421.48) moving averages, indicating a neutral to slightly bullish price action pattern.
- Key support levels are identified near the 52-week low of ₹361.20, while resistance is observed near the 52-week high of ₹473.45, marking the critical price boundaries for the stock.
- The stock price is slightly below both the 50-day and 200-day moving averages, suggesting limited upward momentum in the short term.
- Momentum indicators show RSI in a moderate range, MACD near the signal line indicating a neutral momentum, and stochastic oscillators reflecting neither overbought nor oversold conditions.
- Multi-timeframe analysis reveals stable price action across daily, weekly, and monthly charts without significant breakout or breakdown signals.
- Potential market scenarios include a range-bound movement between support and resistance levels, with possible volatility triggered by upcoming earnings or order announcements.
Trending News
Summary: AMFI's latest market-cap review has reshuffled several stocks across the large, mid and small-cap categories. While companies such as BSE, BHEL and Vodafone Idea moved up, others including Hero MotoCorp and Dr. Reddy's Laboratories slipped to lower categories based on average market capitalisation.
Sentiment: positive
Summary: Bharti Airtel Share Price: Find the latest news on Bharti Airtel Stock Price. Get all the information on Bharti Airtel with historic price charts for NSE / BSE. Experts & Broker view also get the Bharti Airtel Ltd. buy/sell tips detailed news, announcements, Forecasts, Analysts, Valuation, ...
Sentiment: neutral
Summary: BHEL Share Price: Find the latest news on BHEL Stock Price. Get all the information on BHEL with historic price charts for NSE / BSE. Experts & Broker view also get the BHEL Ltd. buy/sell tips detailed news, announcements, Forecasts, Analysts, Valuation, Earning forecasts, Estimates, ...
Sentiment: neutral
Summary: Stocks to Watch, 17 July: Stocks like Wipro, Tech Mahindra, Ceat, WeWork India Management, 5paisa Capital, Piramal Finance, Hathway Cable and Datacom, Borosil Renewables, PC Jeweller, Coal India, Servotech Renewable Power System, Laser Power and Infra, and Nilkamal will be in focus on July 17.
Sentiment: neutral
5. Headline: Stock Markets Close Flat Amid Geopolitical Uncertainties, Fluctuating Oil Prices
Summary: The 30-share BSE Sensex edged up 1.44 points to settle at 77,186.87 while the 50-share NSE Nifty dipped 5.75 points to end at 24,072.75.
Sentiment: neutral
Powered by Brave
Recent Updates
News Summary
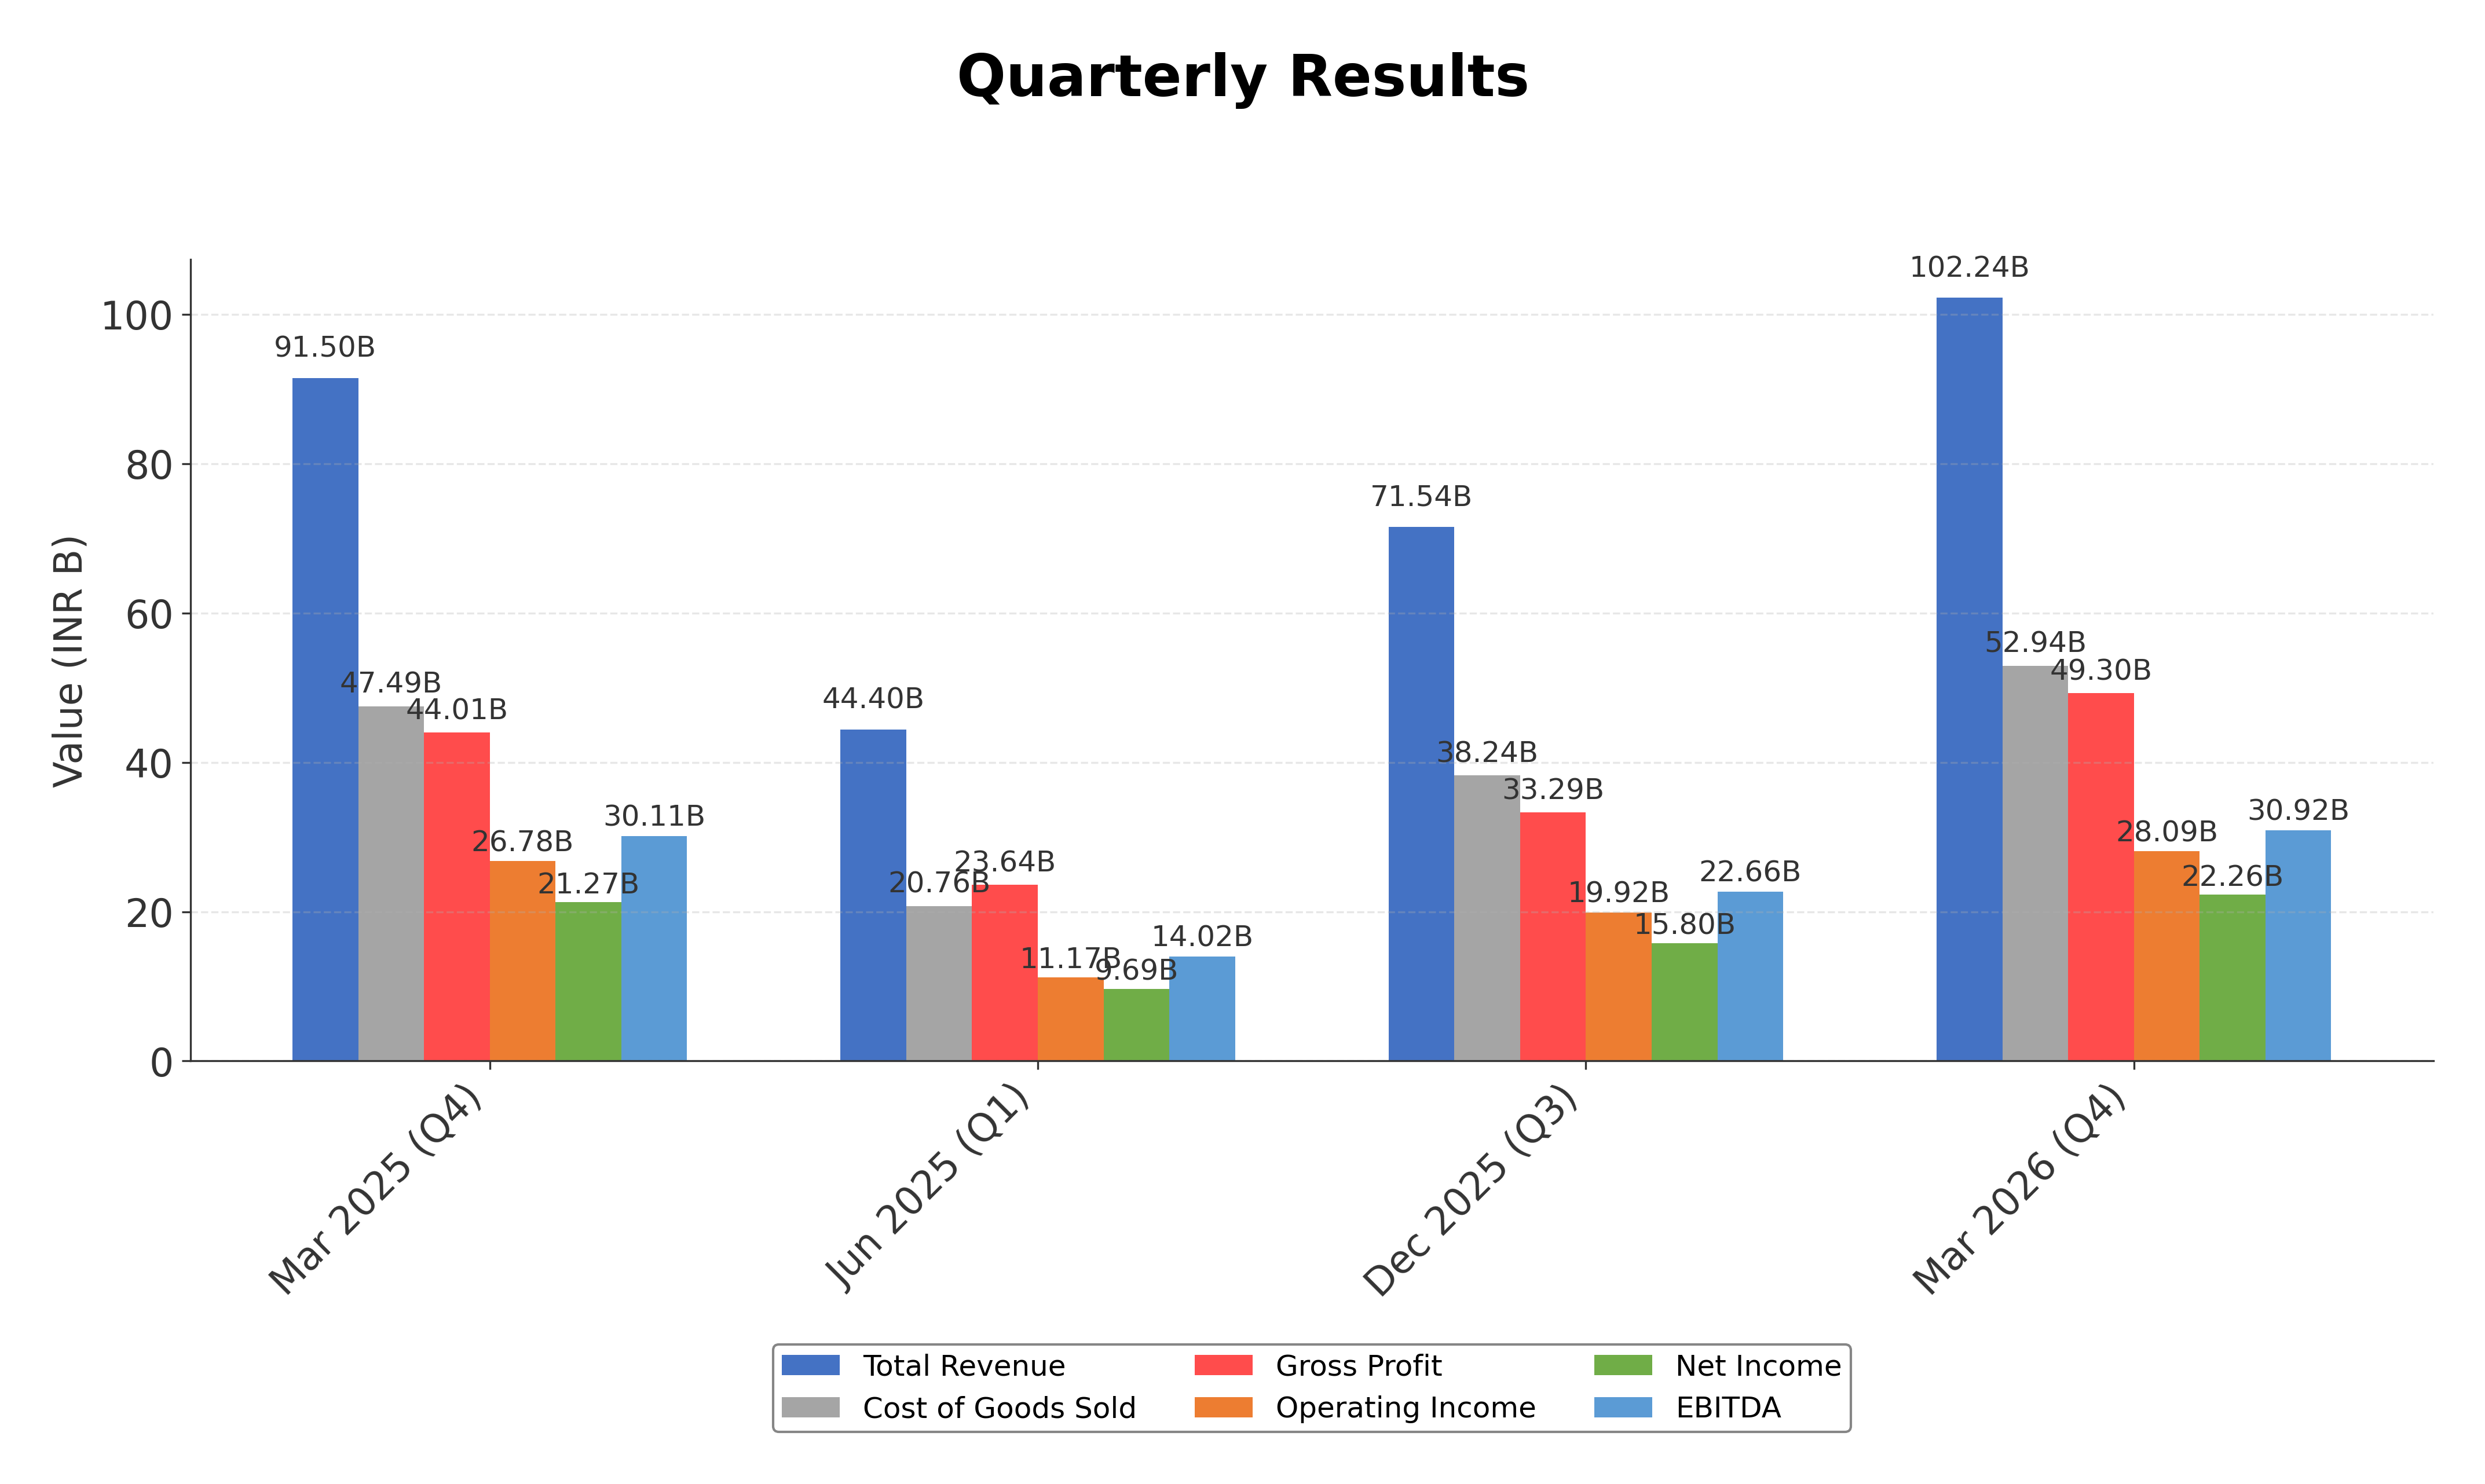
As of July 13, 2026. Bharat Electronics Limited (BEL) secured fresh defense orders worth ₹572 crore, encompassing communication equipment, avionics, encryptors, tank subsystems, electronic voting machines, batteries, components, upgrades, spares, and services. This order inflow adds to previous contracts totaling over ₹1,081 crore received since May 2026, reflecting sustained demand and a robust order book. The company reported a net profit of ₹2,203 crore for the fourth quarter, exceeding market expectations, with revenue growth of 11.6% year-over-year to ₹10,177 crore. EBITDA increased by 6% to ₹2,962 crore, although margins narrowed slightly due to a high base effect. Management highlighted ongoing developments including the AMCA Expression of Interest, expansion of non-defense and export business, and supply chain impacts from geopolitical tensions. These updates underscore BEL’s operational momentum and strategic positioning in the defense electronics sector.
News Sentiment
The overall sentiment from recent updates is cautiously positive, driven by strong order inflows and better-than-expected quarterly financial results. The fresh ₹572 crore orders and consistent revenue growth reinforce confidence in BEL’s core defense business. However, margin contraction and geopolitical supply chain concerns temper the outlook slightly. Market reaction has been mixed, with some price volatility despite positive fundamentals. The sentiment reflects a balance between operational strength and external risks, suggesting measured optimism around the company’s near-term prospects.
Source List
- https://www.cnbctv18.com/market/stocks/bharat-electronics-bel-share-price-bags-rs-572-crore-additional-orders-across-defence-equipment-segments-19944355.htm
- https://www.alphaspread.com/security/nse/bel/investor-relations
- https://economictimes.indiatimes.com/bharat-electronics-ltd/quarterly/companyid-11945.cms
- https://www.icicidirect.com/research/equity/rapid-results/bharat-electronics-ltd
Analytical Overview
Analysis Summary
Bharat Electronics Limited’s valuation metrics, including a trailing P/E of 49.05 and forward P/E of 35.77, are elevated compared to the industry average P/E of approximately 49.05, reflecting premium pricing consistent with its growth profile. The company’s revenue growth of 11.7% year-over-year and positive quarterly earnings growth of 4.6% indicate a solid growth trajectory supported by a strong order book and expanding non-defense segments. Financial health is robust, with a low debt-to-equity ratio of 0.27, substantial cash reserves of ₹85.7 billion, and a current ratio near 1.98, underscoring liquidity and balance sheet strength. Sector-specific challenges include geopolitical risks and supply chain constraints, while opportunities arise from increased defense spending and export potential. Considering India’s regulatory environment and increasing focus on indigenous defense manufacturing, BEL is well-positioned to benefit from favorable government policies and growing domestic demand.
Overall Business and Market Assessment
Supporting Factors: BEL’s strong profitability with a net margin near 22%, high return on equity of 27.56%, and a diversified order pipeline exceeding ₹74,000 crore
Risk Factors: No data
SWOT Analysis
Strengths
- Strong market position as a leading Indian defense electronics manufacturer.
- Robust profitability with a net profit margin of 21.96% and ROE of 27.56%.
- Healthy balance sheet featuring low debt-to-equity ratio of 0.27 and substantial cash reserves.
- Diverse product portfolio serving multiple defense and civilian sectors.
Weaknesses
- High valuation multiples relative to industry peers may limit near-term upside.
- Free cash flow is negative, indicating potential liquidity management challenges.
- Dependence on government defense contracts exposes revenue to regulatory risks.
- Moderate operating cash flow relative to net income suggests working capital intensity.
Opportunities
- Increasing Indian defense budget and focus on indigenization support growth.
- Expansion in non-defense electronics and export markets offers diversification.
- Technological advancements in radar and communication systems can drive innovation.
- Strategic partnerships and order inflows enhance revenue visibility.
Threats
- Geopolitical tensions and supply chain disruptions may impact operations.
- Competitive pressures from domestic and international defense suppliers.
- Regulatory changes could affect contract awards and pricing.
- Macroeconomic volatility may influence government spending priorities.
Company Description
Bharat Electronics Limited is a leading Indian state-owned aerospace and defense company specializing in designing and manufacturing electronic products for the defense sector. Established in 1954 under the Ministry of Defence of India, it plays a critical role in ensuring technological self-reliance by producing a wide array of radar systems, communication equipment, and electronic warfare systems. Bharat Electronics Limited serves various sectors, such as the Indian Armed Forces, with solutions tailored for land, naval, and airborne deployments. Its products include advanced radars, avionics, missile systems, and sonar systems, making it a linchpin in India's defense readiness. Additionally, the company is involved in non-defense electronics and civic infrastructure, contributing to national development projects through electronics for railway signaling, solar photovoltaic systems, and electronic voting machines. As a significant player in the defense and civilian market segments, Bharat Electronics Limited is key to India's electronics manufacturing prowess and technological advancement, enhancing domestic capabilities while supporting national security measures.