


Bharat Electronics Limited (BEL)
Stock Analysis Report
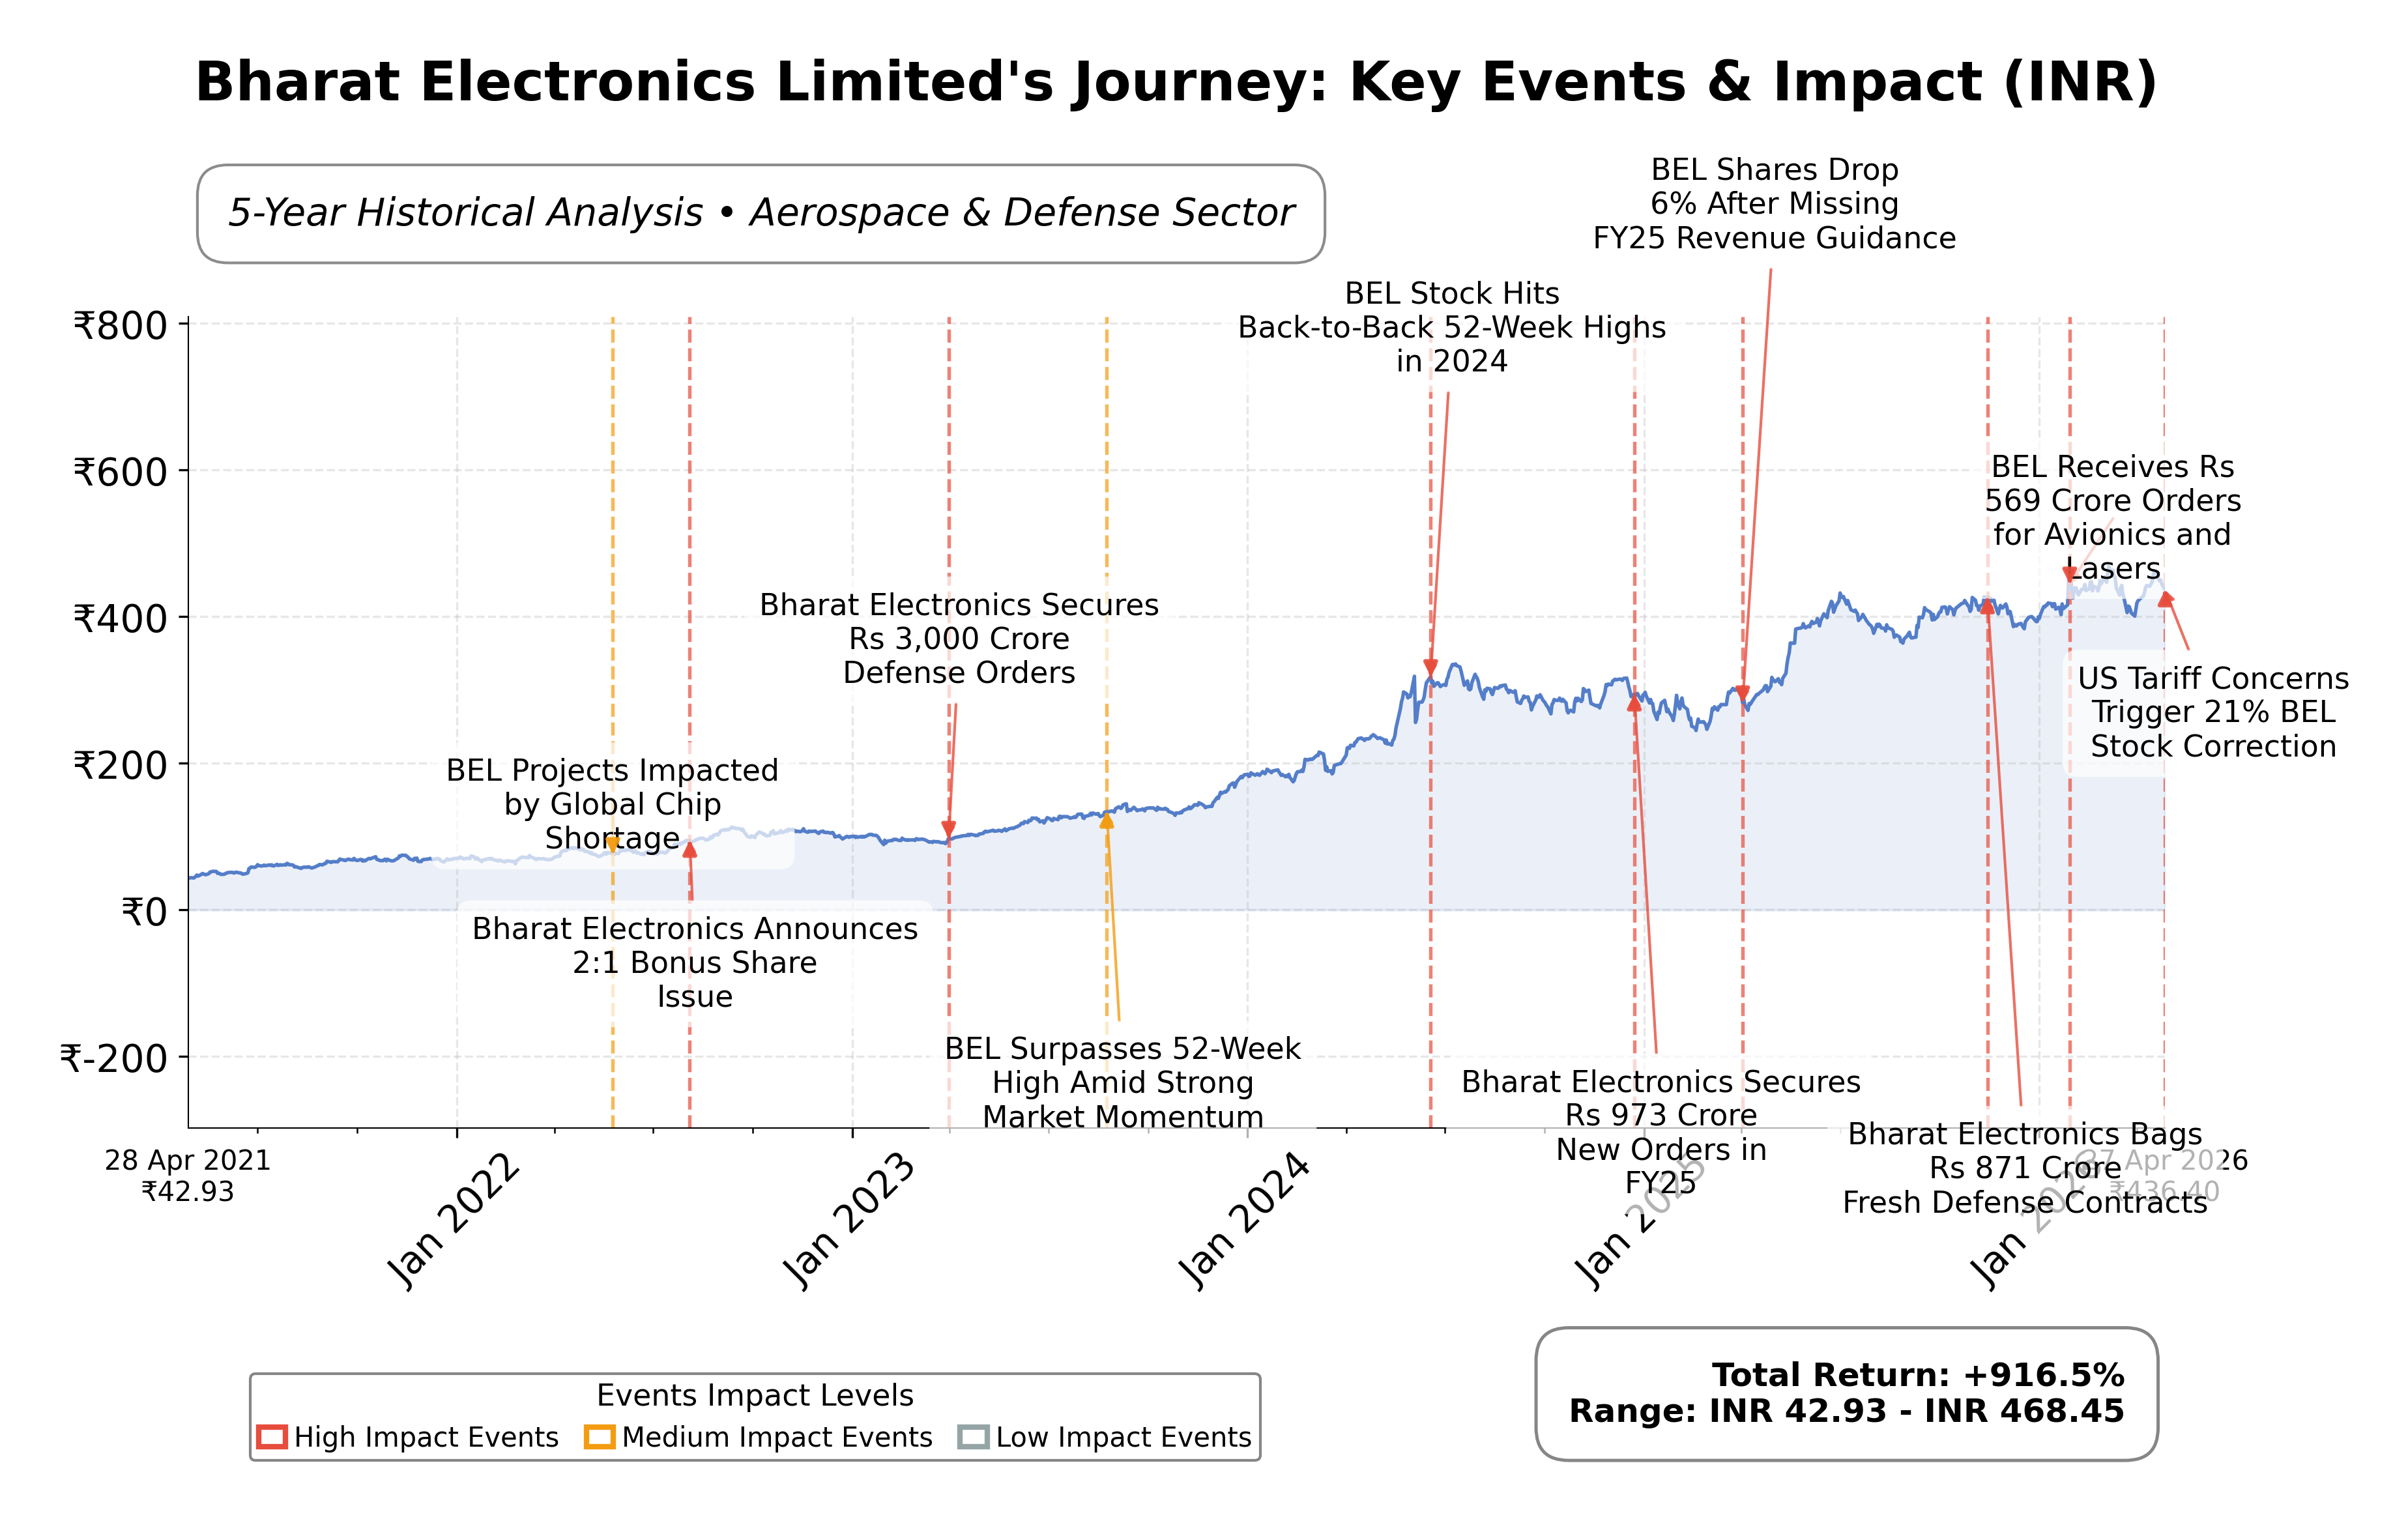
Stock Journey
Key Positives and Key Risks
Pros
- Bharat Electronics Limited’s net profit margin of 22.48% demonstrates strong profitability within the defense sector.
- The company’s low debt-to-equity ratio of 0.0273 and robust free cash flow of ₹53.21 billion indicate solid financial health and liquidity.
- BEL’s return on equity of 26.62% reflects efficient use of shareholder capital and operational effectiveness.
Cons
- The stock trades at a high trailing P/E of 54.6 and price-to-book ratio of 15.08, suggesting a premium valuation that may constrain upside.
- Working capital days have increased, potentially impacting operational efficiency and cash conversion cycles.
- Dependence on government defense contracts exposes revenue to regulatory and budgetary risks that could affect order visibility.
Disclosure: This information is for general awareness and does not constitute investment advice
Report Summary
Bharat Electronics Limited (BEL) is a prominent Indian state-owned enterprise specializing in aerospace and defense electronics. Listed on the NSE under the Industrials sector, BEL designs and manufactures a broad range of electronic products including radar systems, communication equipment, and electronic warfare systems primarily for the Indian Armed Forces. The company also serves non-defense sectors with products for civic infrastructure such as railway signaling and solar photovoltaic systems. Its strategic positioning as a key contributor to India’s defense self-reliance and technological advancement underscores its importance in the Aerospace & Defense industry.
Financially, BEL reported trailing twelve months (TTM) revenue of approximately ₹265.35 billion with a gross margin of 46.54%, operating margin of 27.84%, and net profit margin of 22.48%, reflecting strong profitability. Return on equity (ROE) stands at 26.62% and return on assets (ROA) at 13.03%, indicating efficient utilization of equity and assets. The company’s operating cash flow for the TTM is ₹21.73 billion, and levered free cash flow is ₹53.21 billion, demonstrating robust cash generation capabilities alongside a low debt-to-equity ratio of 0.0273, which supports financial stability.
From a valuation perspective, BEL’s trailing P/E ratio is 54.6, with a forward P/E of 45.27, and a price-to-book ratio of 15.08, suggesting a premium valuation relative to its book value. The enterprise value to EBITDA ratio is elevated at 41.0, indicating a high market valuation relative to earnings. The stock trades at ₹439.45, within a 52-week range of ₹473.45 (high) to ₹295.85 (low), currently closer to its upper range, reflecting strong market interest. Market capitalization stands at approximately ₹3.25 trillion, underscoring its large-cap status in the Indian market.
BEL’s strengths include strong cash flows, minimal debt, and leadership in defense electronics with a diversified product portfolio. Key risks involve regulatory changes, competitive pressures in defense procurement, and macroeconomic factors impacting government spending. Recent strategic developments include securing orders worth ₹569 crore across defense segments and maintaining a steady dividend payout with a forward yield of 1.76%. The company’s governance structure is well-established with experienced leadership and active board committees supporting operational oversight.
Technically, the stock exhibits an upward trend supported by its position above the 50-day and 200-day moving averages, with momentum indicators showing moderate strength. Recent news highlights steady order inflows and positive earnings growth, balanced by some short-term market volatility. Overall, the data suggests a stable trajectory with conditions that may favor accumulation or monitoring for further developments, reflecting a balanced market stance.
Company and Industry Overview
Company Basics
Price Performance
Company Size
Shareholding Pattern
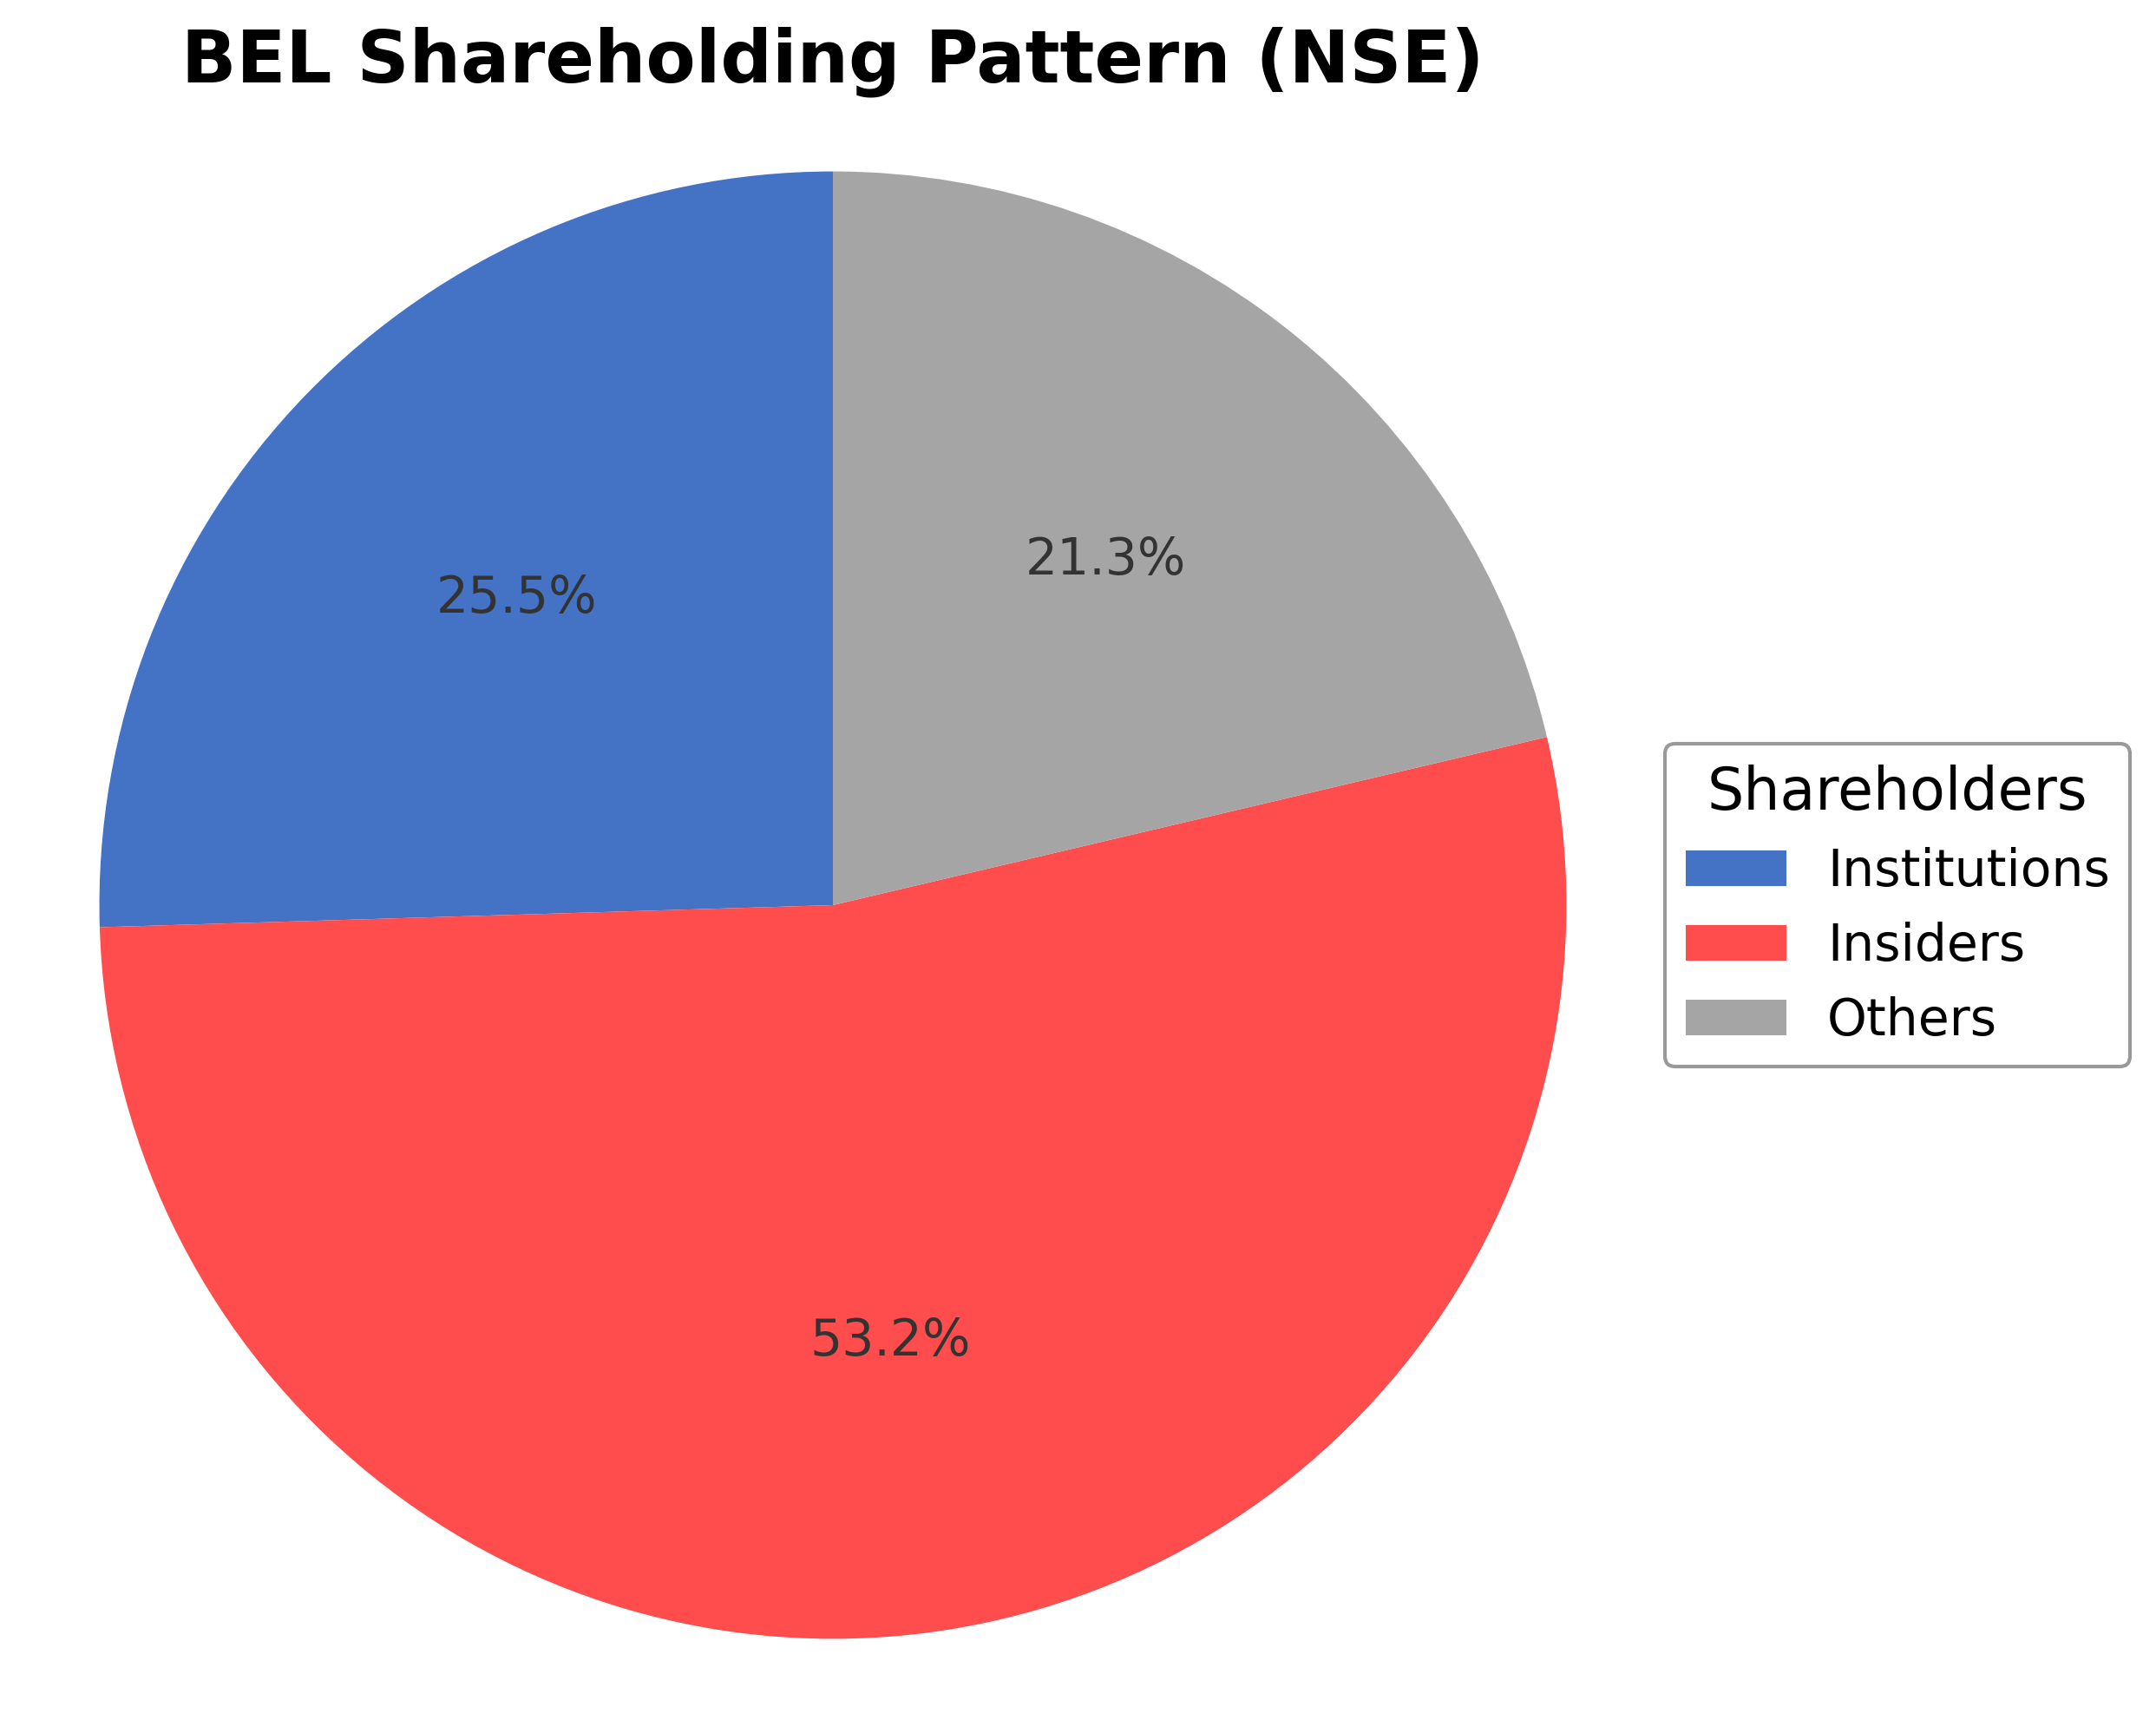
Bharat Electronics Limited’s ownership structure is dominated by insiders, including executives and board members, holding approximately 53.20% of shares, reflecting significant government and promoter control. Institutional investors hold about 25.48%, comprising mutual funds, pension funds, and asset managers, indicating moderate institutional interest. The remaining 21.32% is held by public shareholders and other retail investors. Over the past 12-24 months, institutional holdings have shown stable accumulation with no significant large-scale distribution reported. Major funds have maintained or slightly increased positions, signaling steady market confidence. This shareholding pattern suggests strong promoter influence with balanced institutional participation, supporting governance continuity and strategic direction aligned with national defense priorities.
Sector and Industry Analysis
The defense electronics sector in India is a significant and growing market driven by increasing government expenditure on modernization and indigenization of defense capabilities. The market encompasses a broad range of products including communication systems, radars, electronic warfare, and avionics, with Bharat Electronics Limited (BEL) being a prominent player alongside other domestic and international firms. Growth is supported by rising geopolitical tensions, technological advancements, and government initiatives aimed at boosting self-reliance in defense manufacturing.
Industry trends highlight a shift towards integration of advanced digital technologies, such as AI and IoT, to enhance system capabilities and operational efficiency. Competitive dynamics are shaped by high barriers to entry due to the need for specialized technology, security clearances, and long development cycles. BEL maintains a strong market position through its diversified product portfolio, government backing, and export presence, while competition intensifies with private sector entrants and foreign collaborations.
The regulatory landscape is characterized by stringent government controls and policies promoting indigenous production under the "Make in India" initiative, which mandates local content requirements and offsets in defense procurement. Export regulations and international compliance standards also influence operational strategies. These regulations aim to foster domestic industry growth, reduce dependence on imports, and enhance technological self-sufficiency, shaping the sector’s long-term outlook.
Note: Analysis synthesized from industry research, market reports, and regulatory filings. Information is subject to change based on market conditions.
Financial Ratios Dashboard
Illustrative Scenario Analysis
DCF Assumptions:
Method: Two-Stage EPS-Priority Model
Financials
Peer Analysis
| Company Name | Market Cap | P/E Ratio | P/B Ratio | EV/EBITDA | Price to CFO |
|---|---|---|---|---|---|
| Bharat Electronics Limited | ₹3.25T | 54.60 | 15.08 | 41.00 | 149.51 |
| Bharat Dynamics Ltd. | ₹513.33B | 88.63 | 12.17 | 103.87 | -92.55 |
| Data Patterns (India) Ltd. | ₹228.29B | 88.95 | 14.32 | 71.26 | -514.85 |
| Hindustan Aeronautics Ltd. | ₹2.85T | 32.75 | 7.84 | 30.00 | 31.19 |
| Garden Reach Shipbuilders & Engineers Ltd. | ₹329.76B | 47.83 | 14.36 | 45.64 | -570.41 |
| Cochin Shipyard Limited | ₹437.95B | 60.08 | 7.68 | 46.11 | -49.56 |
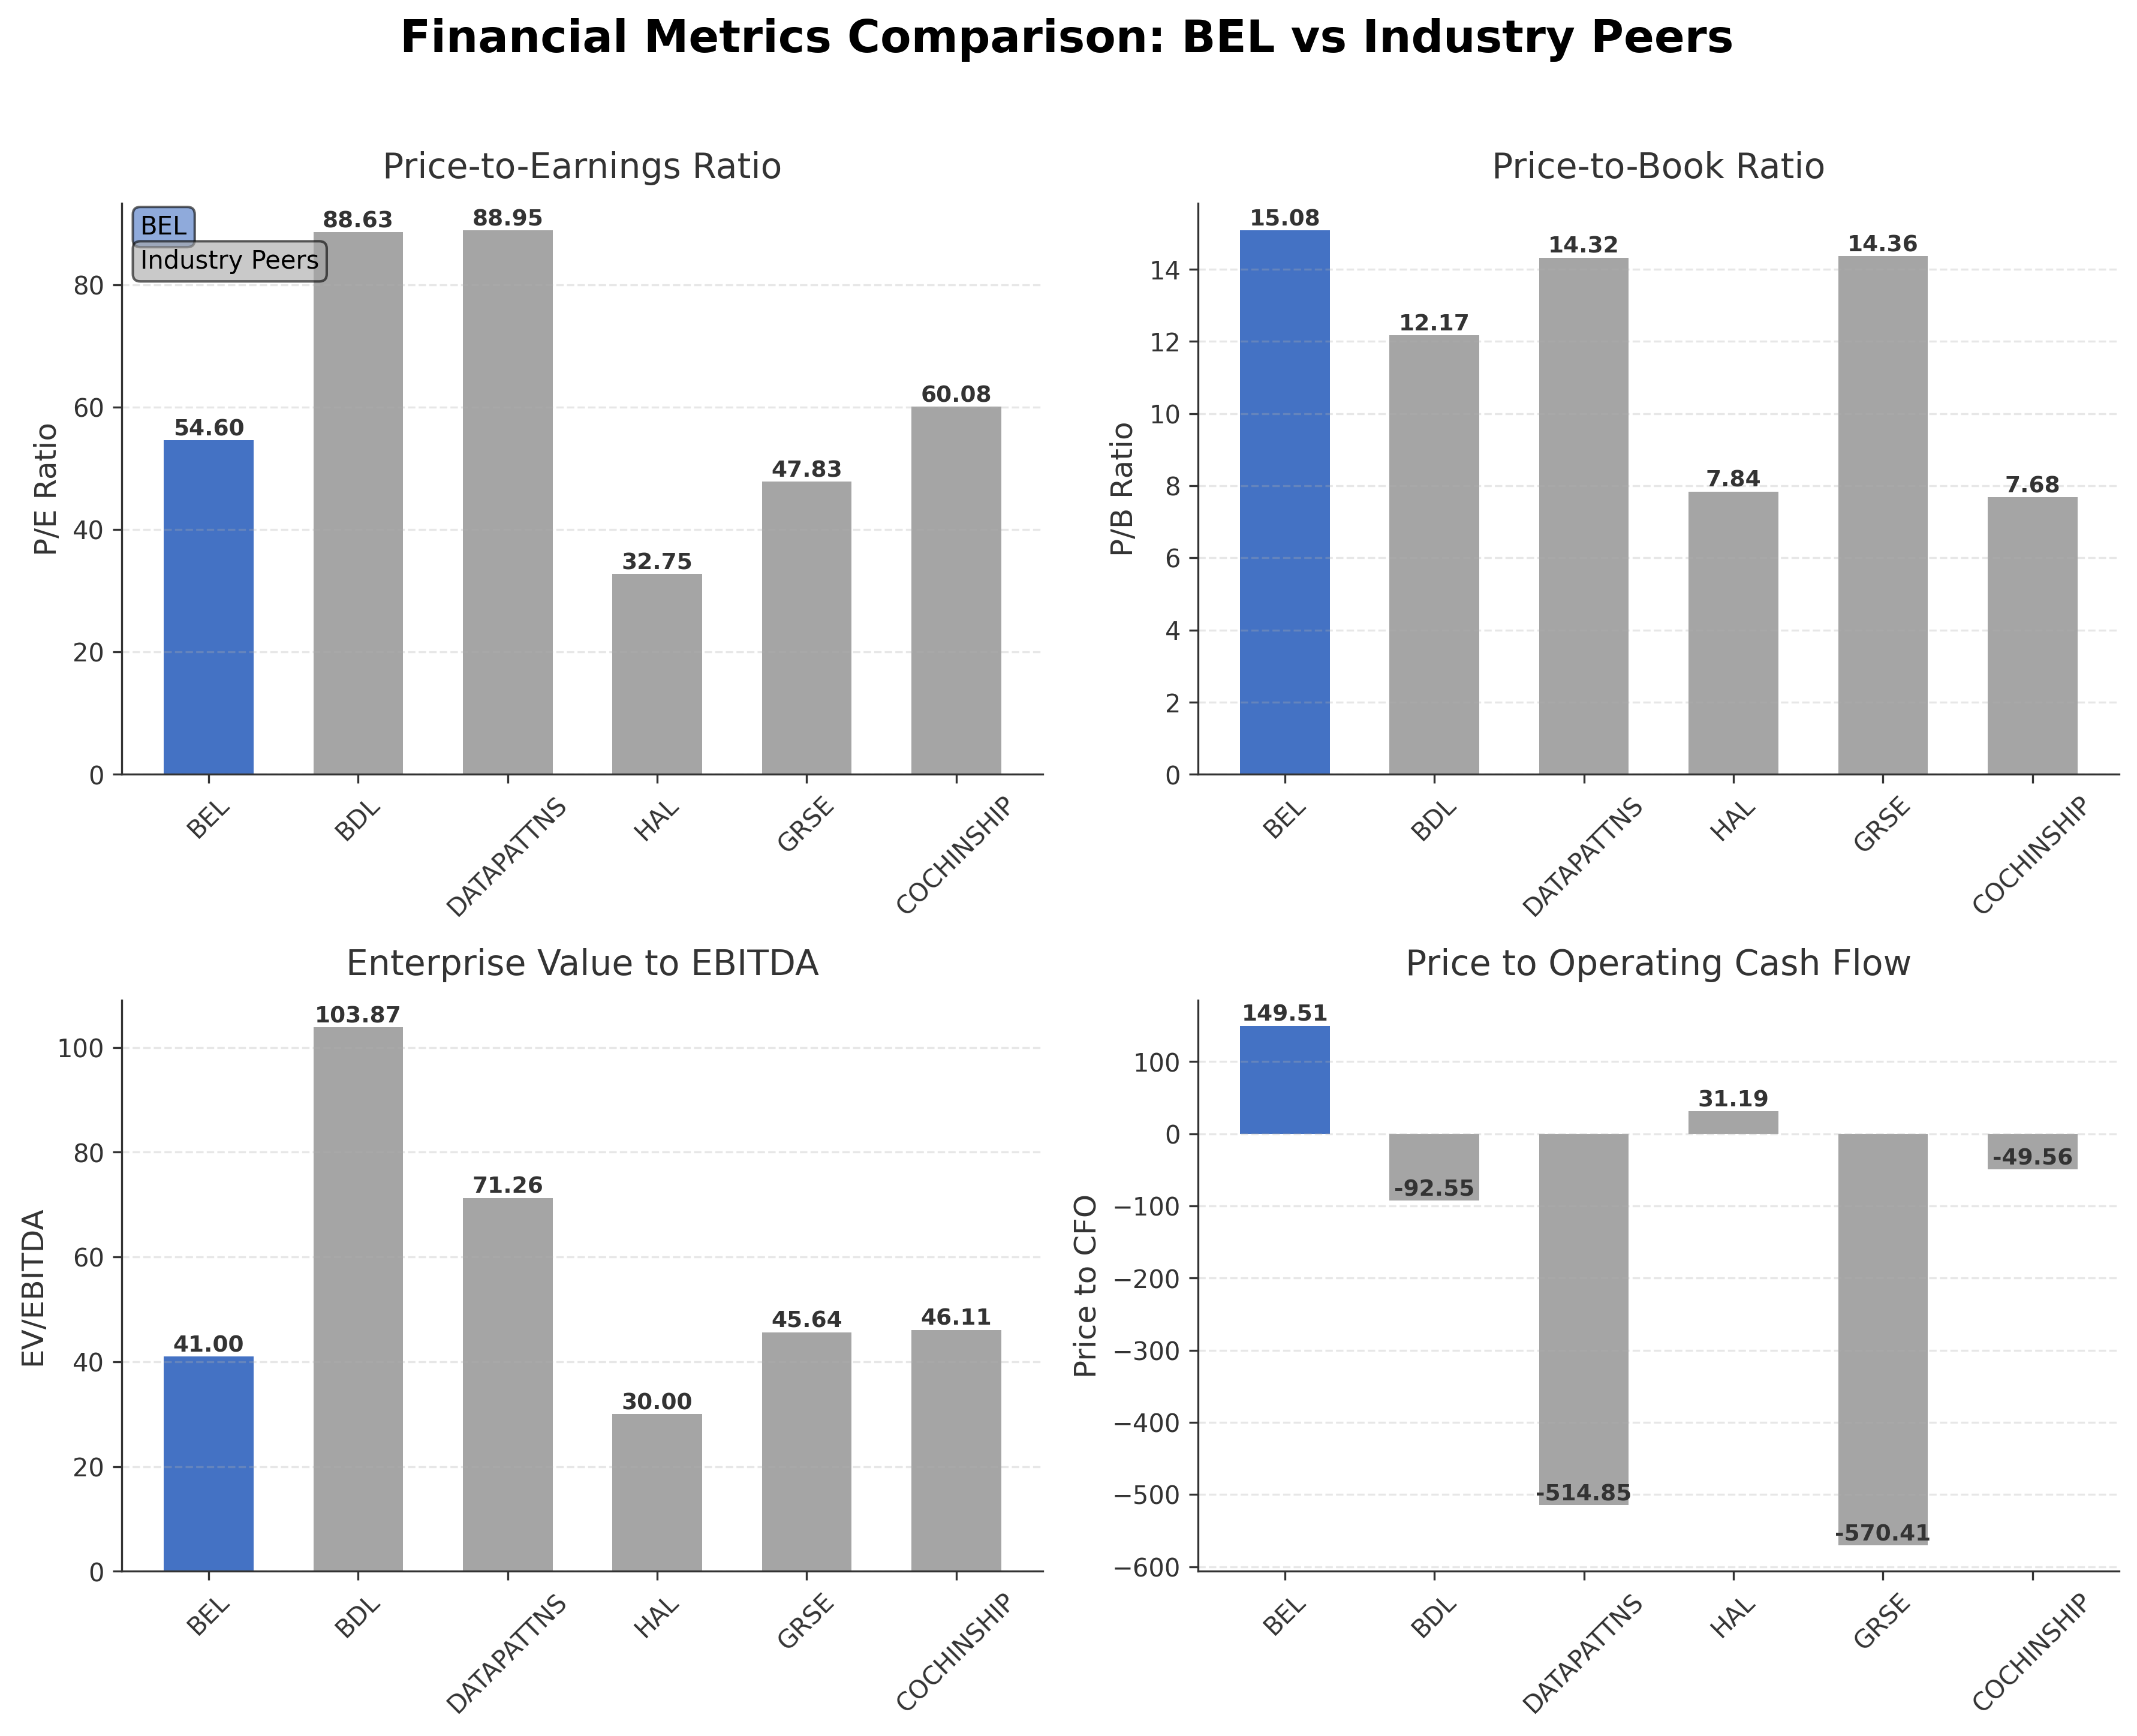
Comparison Analysis: Bharat Electronics Limited (BEL) stands out among its Indian aerospace and defense peers with a market capitalization of ₹3.25 trillion, making it one of the largest in the sector. Its trailing P/E ratio of 54.60 is lower than peers like Bharat Dynamics Ltd. and Data Patterns, which trade above 88, but higher than Hindustan Aeronautics Ltd. at 32.75, reflecting a premium valuation relative to some competitors. BEL’s price-to-book ratio of 15.08 is among the highest, indicating a rich valuation compared to book value. The enterprise value to EBITDA ratio at 41.00 is elevated, suggesting the market prices BEL at a premium relative to earnings. Return on equity at 26.62% is competitive, slightly above HAL’s 24% and comparable to Garden Reach Shipbuilders. Overall, BEL exhibits strong profitability metrics but trades at a premium valuation relative to most peers.
Financial Metrics Comparison with Peers
Financial Statements
Comprehensive financial data including income, balance sheet, and cash flow metrics
Income Statement
| fiscal_date | 2025-03-31 | 2024-03-31 | 2023-03-31 | 2022-03-31 | 2021-03-31 |
|---|---|---|---|---|---|
| Sales | 231.17B | 199.05B | 174.04B | 150.85B | 138.50B |
| Cost Of Goods | 121.95B | 105.80B | 98.37B | 89.11B | 80.01B |
| Gross Profit | 109.23B | 93.26B | 75.67B | 61.74B | 58.49B |
| Operating Expense Selling General And Administrative | 638.00M | 640.80M | 582.50M | 483.40M | 417.70M |
| Operating Expense Other Operating Expenses | 15.39B | 17.21B | 11.85B | 8.22B | 7.20B |
| Operating Income | 65.26B | 48.78B | 37.73B | 29.59B | 28.64B |
| Non Operating Interest Income | 6.48B | 5.87B | 2.63B | 1.80B | 638.80M |
| Non Operating Interest Expense | 93.90M | 68.60M | 145.90M | 46.60M | 58.10M |
| Pretax Income | 70.99B | 52.66B | 39.23B | 31.66B | 29.42B |
| Income Tax | 18.12B | 13.23B | 9.83B | 8.12B | 8.72B |
| Net Income | 53.23B | 39.85B | 29.86B | 24.00B | 21.00B |
| Eps Basic | 7.28 | 5.45 | 4.09 | 3.28 | 2.87 |
| Eps Diluted | 7.28 | 5.45 | 4.09 | 3.28 | 2.87 |
| Basic Shares Outstanding | 7.31B | 7.31B | 7.31B | 7.31B | 7.31B |
| Diluted Shares Outstanding | 7.31B | 7.31B | 7.31B | 7.31B | 7.31B |
| Ebit | 71.08B | 52.73B | 39.38B | 31.71B | 29.48B |
| Ebitda | 77.17B | 59.67B | 44.78B | 35.88B | 33.78B |
| Net Income Continuous Operations | 71.35B | 53.08B | 39.69B | 32.12B | 29.72B |
| Minority Interests | -12.40M | -7.20M | -18.20M | -13.50M | -8.20M |
| Preferred Stock Dividends | 0.00 | 0.00 | 0.00 | 0.00 | 0.00 |
Source: Financial statements and regulatory filings
Balance Sheet
| fiscal_date | 2025-03-31 | 2024-03-31 | 2023-03-31 | 2022-03-31 | 2021-03-31 |
|---|---|---|---|---|---|
| Cash And Cash Equivalents | 7.13B | 12.06B | 39.46B | 13.01B | 30.43B |
| Accounts Receivable | 91.16B | 73.92B | 70.33B | 61.08B | 65.62B |
| Total Assets | 408.32B | 395.27B | 354.91B | 339.11B | 294.90B |
| Total Liabilities | 208.39B | 231.82B | 216.12B | 216.08B | 184.15B |
| Long Term Debt | 586.90M | 602.50M | 594.20M | 515.10M | 11.70M |
| Shareholders Equity | 199.93B | 163.44B | 138.79B | 123.02B | 110.75B |
Source: Financial statements and regulatory filings
Cash Flow Statement
| fiscal_date | 2025-03-31 | 2024-03-31 | 2023-03-31 | 2022-03-31 | 2021-03-31 |
|---|---|---|---|---|---|
| Operating Activities Net Income | 71.35B | 53.08B | 39.69B | 32.12B | 29.72B |
| Operating Activities Other Non Cash Items | -6.29B | -5.81B | -2.63B | -1.35B | -243.80M |
| Operating Activities Accounts Receivable | -17.24B | -11.90B | -13.00B | 3.30B | 798.30M |
| Operating Activities Other Assets Liabilities | -26.09B | 5.97B | -1.66B | 8.66B | 11.30B |
| Operating Activities Operating Cash Flow | 21.73B | 41.34B | 22.40B | 42.73B | 41.57B |
| Investing Activities Capital Expenditures | -10.08B | -6.44B | -5.89B | -5.47B | -4.68B |
| Investing Activities Other Investing Activity | 700.00K | 1.00M | 22.80M | N/A | N/A |
| Investing Activities Investing Cash Flow | -10.08B | -6.44B | -5.86B | -50.48B | -26.56B |
| Financing Activities Common Dividends | -16.81B | -14.62B | -12.43B | -10.23B | -10.23B |
| Financing Activities Financing Cash Flow | -16.81B | -14.62B | -12.94B | -10.71B | -10.59B |
| End Cash Position | 7.13B | 12.06B | 39.46B | 13.01B | 30.43B |
| Free Cash Flow | -4.25B | 40.07B | 6.09B | 36.53B | 46.24B |
| Financing Activities Other Financing Charges | N/A | N/A | -507.90M | -475.70M | -367.00M |
| Investing Activities Purchase Of Investments | N/A | N/A | N/A | -45.01B | -21.88B |
| Investing Activities Sale Of Investments | N/A | N/A | N/A | N/A | N/A |
Source: Financial statements and regulatory filings
Technical Analysis
Key Insights
- Bharat Electronics Limited is currently in an upward trend, with price action showing higher highs and higher lows over recent weeks.
- Key support levels are identified near ₹420 and ₹400, while resistance is observed around the 52-week high near ₹473.
- The stock price is trading above its 10-day (approx. ₹439), 50-day (₹438.27), and 200-day (₹412.69) moving averages, indicating bullish momentum across short to long-term timeframes.
- Momentum indicators show the RSI near 60, suggesting moderate strength without overbought conditions; MACD is positive with a recent bullish crossover; Stochastic oscillator indicates upward momentum but not yet overextended.
- Analysis across daily, weekly, and monthly charts confirms a consistent bullish trend with no significant reversal signals currently evident.
- Potential market scenarios include continuation of the uptrend supported by strong technicals or a consolidation phase near resistance levels before further directional movement.
Trending News
Summary: Gaya (Bihar) [India], April 27: The Sansad Jan Udhyam Sports & Cultural Mahotsav 2026, organized under the guidance of Hon'ble Member of Parliament Shri Jitan Ram Manjhi, concluded on a grand and inspiring note today at Gandhi Maidan, Gaya. Held from April 20 to April 25, the six-day mega event ...
Sentiment: neutral
Summary: Optimized Electrotech is moving into space-based sensing. The company is building a sovereign sensing stack for India. It has secured initial orders for a satellite platform. This expansion follows proven defence deployments. A recent funding round will accelerate satellite development and ...
Sentiment: positive
Summary: Stock Market Today Highlights: Which way are Sensex, Nifty50 headed this week? Indian benchmark equity indices, Nifty50 and BSE Sensex, staged a stro
Sentiment: positive
Summary: Thomson Reuters proprietary rating of stock on scale of 1 to 10 · Industry ranking and detailed sector analysis of recent happening in sector · Analyst rating like Buy/Sell/Hold with Earnings estimates with 1 year price target ... No Data For Bulk Deals. *A bulk deal is a trade where total quantity of shares bought or sold is more than 0.5% of the equity shares of a company listed on the exchange. ... Bharat Electronics Limited ...
Sentiment: neutral
5. Headline: Bharat Electronics Ltd is Rated Buy
Summary: The company’s strong fundamentals, ... stock. While valuation remains elevated, the overall outlook supports a constructive investment stance. Investors are encouraged to monitor ongoing financial results and market conditions but can consider Bharat Electronics Ltd a core holding in the Aerospace & Defense space based on the current analysis. Limited Period ...
Sentiment: positive
Recent Updates
News Summary
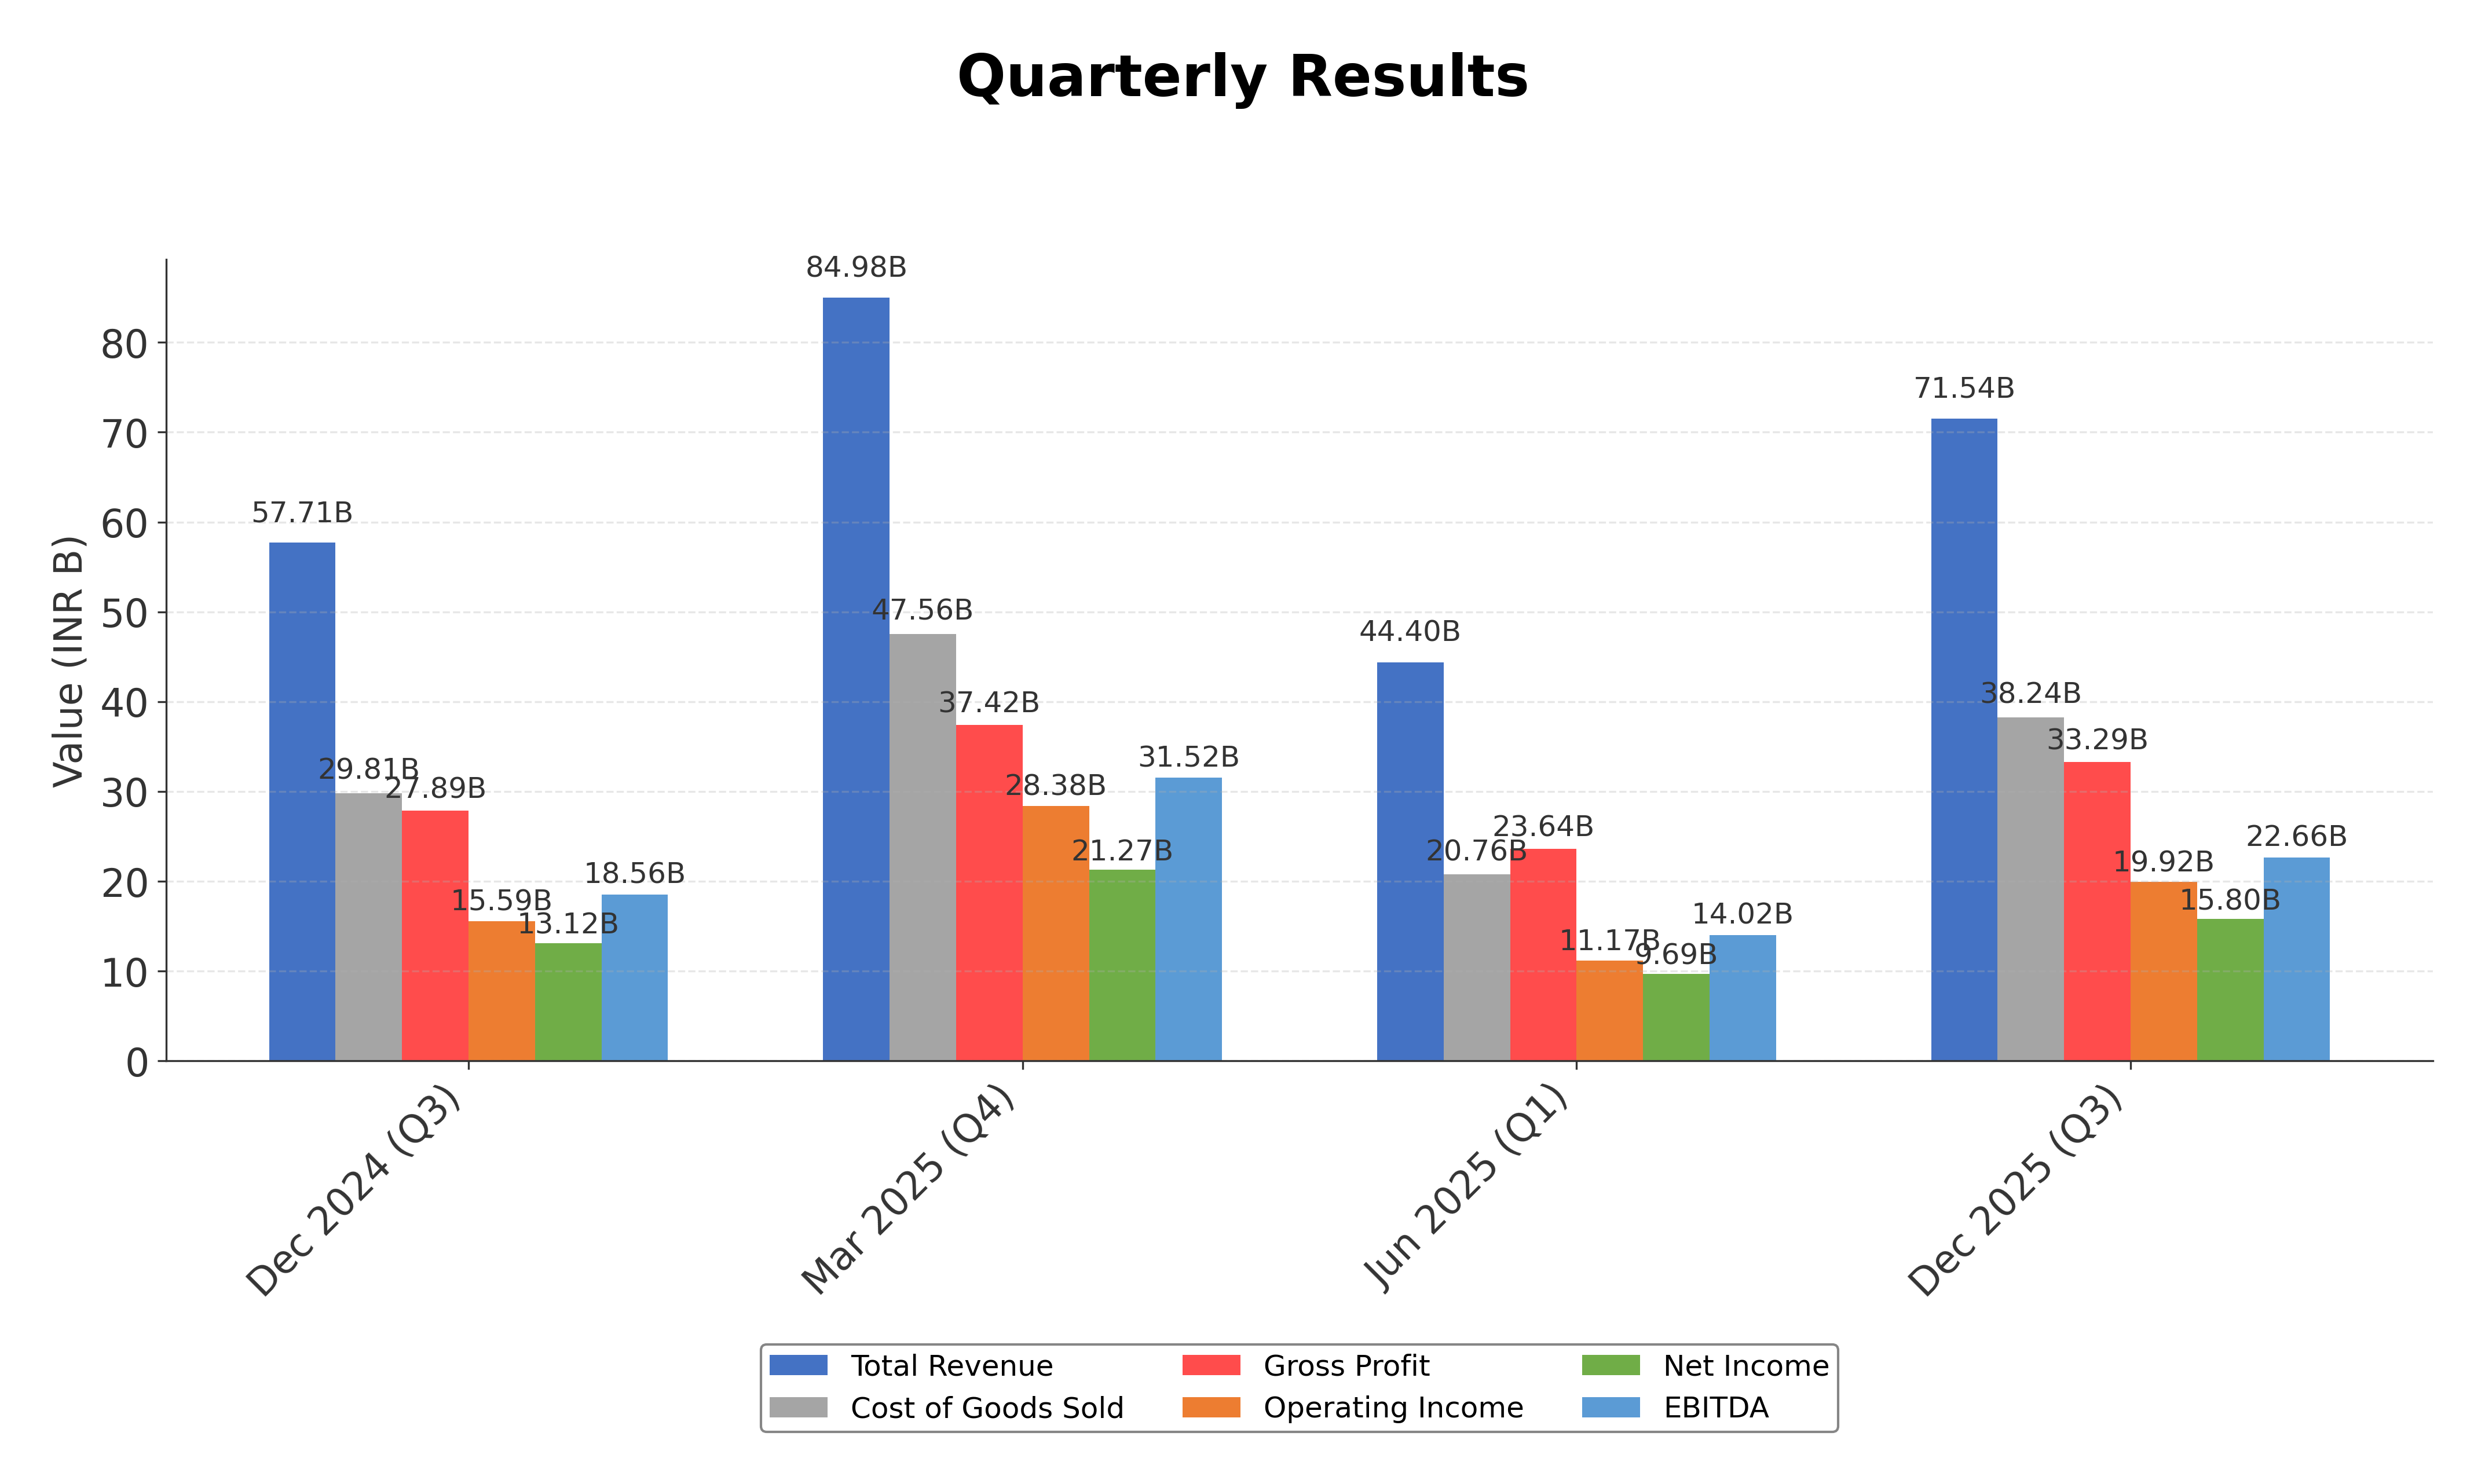
As of April 28, 2026. Bharat Electronics Limited continues to demonstrate strong operational and financial performance with recent quarterly results showing a 23.73% year-over-year revenue increase and a 21% rise in net profit for Q3 FY 2025-26. The company secured fresh defense orders worth Rs 569 crore, reinforcing its market position and revenue visibility for the new fiscal year. Corporate governance remains robust with an experienced board of directors overseeing strategic and operational functions. The annual report analysis for FY 2023-24 highlighted a 14.3% increase in operating income and a 34.1% growth in net profit, with improved profit margins and controlled finance costs. Overall, BEL maintains a strong balance sheet with increasing current assets and manageable liabilities, supporting its growth trajectory.
News Sentiment
The overall sentiment from recent updates is cautiously positive, driven by strong earnings growth, significant new order wins, and steady operational execution. The increase in revenues and profitability, coupled with a solid order book, underpins confidence in BEL’s core defense business. Neutral tones arise from routine corporate filings and governance disclosures, while no significant negative developments were reported. The balance of positive financial results and stable governance suggests a favorable outlook, tempered by the need to monitor macroeconomic and sector-specific risks.
Source List
- https://www.livemint.com/market/stock-market-news/bel-q3-results-2026-live-bharat-electronics-q3-results-today-bel-share-price-earnings-psu-defence-stock-28-january-2026-11769574157225.html
- https://bel-india.in/investors/
- https://economictimes.indiatimes.com/bharat-electronics-ltd/quarterly/companyid-11945.cms
- https://www.equitymaster.com/research-it/annual-results-analysis/BHEC/BHARAT-ELECTRONICS-2023-24-Annual-Report-Analysis/10930
Analytical Overview
Analysis Summary
Bharat Electronics Limited’s valuation metrics show a trailing P/E of 54.6 and forward P/E of 45.27, which are elevated compared to the industry average P/E of 54.6 but lower than some peers, indicating a relatively premium but not excessive valuation. The company’s revenue growth of 24% quarterly and consistent cash flow generation, with operating cash flow of ₹21.73 billion and free cash flow of ₹53.21 billion, reflect a strong growth trajectory and financial robustness. Financial health is supported by a low debt-to-equity ratio of 0.0273 and a current ratio of 1.76, indicating solid liquidity and minimal leverage. Sector-specific challenges include regulatory scrutiny and dependency on government defense spending, while opportunities arise from expanding defense budgets and diversification into civilian electronics. Considering India-specific factors, BEL benefits from government support as a Navratna PSU, favorable defense procurement policies, and increasing emphasis on indigenous manufacturing under the Atmanirbhar Bharat initiative.
Overall Business and Market Assessment
Supporting Factors: Key supporting factors include BEL’s strong profitability with a net margin of 22.48%, robust cash flow generation, and leadership in the Indian defense electronics sector. Risks to monitor involve valuation premium levels, potential delays or reductions in government defense contracts, and macroeconomic uncertainties impacting capital expenditure. The appropriate investment timeframe is medium to long-term, given the company’s strategic role and steady order inflows. Overall, BEL presents a balanced profile with solid fundamentals tempered by valuation considerations and sector-specific risks.
Risk Factors: No data
SWOT Analysis
Strengths
- Bharat Electronics Limited has a strong market position as a leading defense electronics manufacturer in India.
- The company maintains robust profitability with a net profit margin exceeding 22%.
- Low debt levels and strong cash flow generation support financial stability.
- Experienced leadership and comprehensive governance structures enhance operational oversight.
Weaknesses
- High valuation multiples such as P/E and price-to-book ratios may limit near-term upside.
- Working capital days have increased, indicating potential efficiency challenges.
- Heavy reliance on government defense contracts exposes revenue to policy changes.
- Limited diversification outside defense sector constrains growth avenues.
Opportunities
- Expansion into international defense and civilian markets offers growth potential.
- Increasing Indian defense budget and emphasis on indigenous manufacturing favor BEL.
- Growth in non-defense electronics such as solar and civic infrastructure can diversify revenue.
- Technological advancements in aerospace and electronic warfare systems present innovation opportunities.
Threats
- Regulatory changes and procurement delays could impact order inflows.
- Competitive pressures from domestic and international defense suppliers may intensify.
- Macroeconomic volatility and budgetary constraints pose risks to government spending.
- Geopolitical tensions could affect supply chains and operational continuity.
Company Description
Bharat Electronics Limited is a leading Indian state-owned aerospace and defense company specializing in designing and manufacturing electronic products for the defense sector. Established in 1954 under the Ministry of Defence of India, it plays a critical role in ensuring technological self-reliance by producing a wide array of radar systems, communication equipment, and electronic warfare systems. Bharat Electronics Limited serves various sectors, such as the Indian Armed Forces, with solutions tailored for land, naval, and airborne deployments. Its products include advanced radars, avionics, missile systems, and sonar systems, making it a linchpin in India's defense readiness. Additionally, the company is involved in non-defense electronics and civic infrastructure, contributing to national development projects through electronics for railway signaling, solar photovoltaic systems, and electronic voting machines. As a significant player in the defense and civilian market segments, Bharat Electronics Limited is key to India's electronics manufacturing prowess and technological advancement, enhancing domestic capabilities while supporting national security measures.