

Bella Casa Fashion & Retail Limited (BELLACASA)
Stock Analysis Report
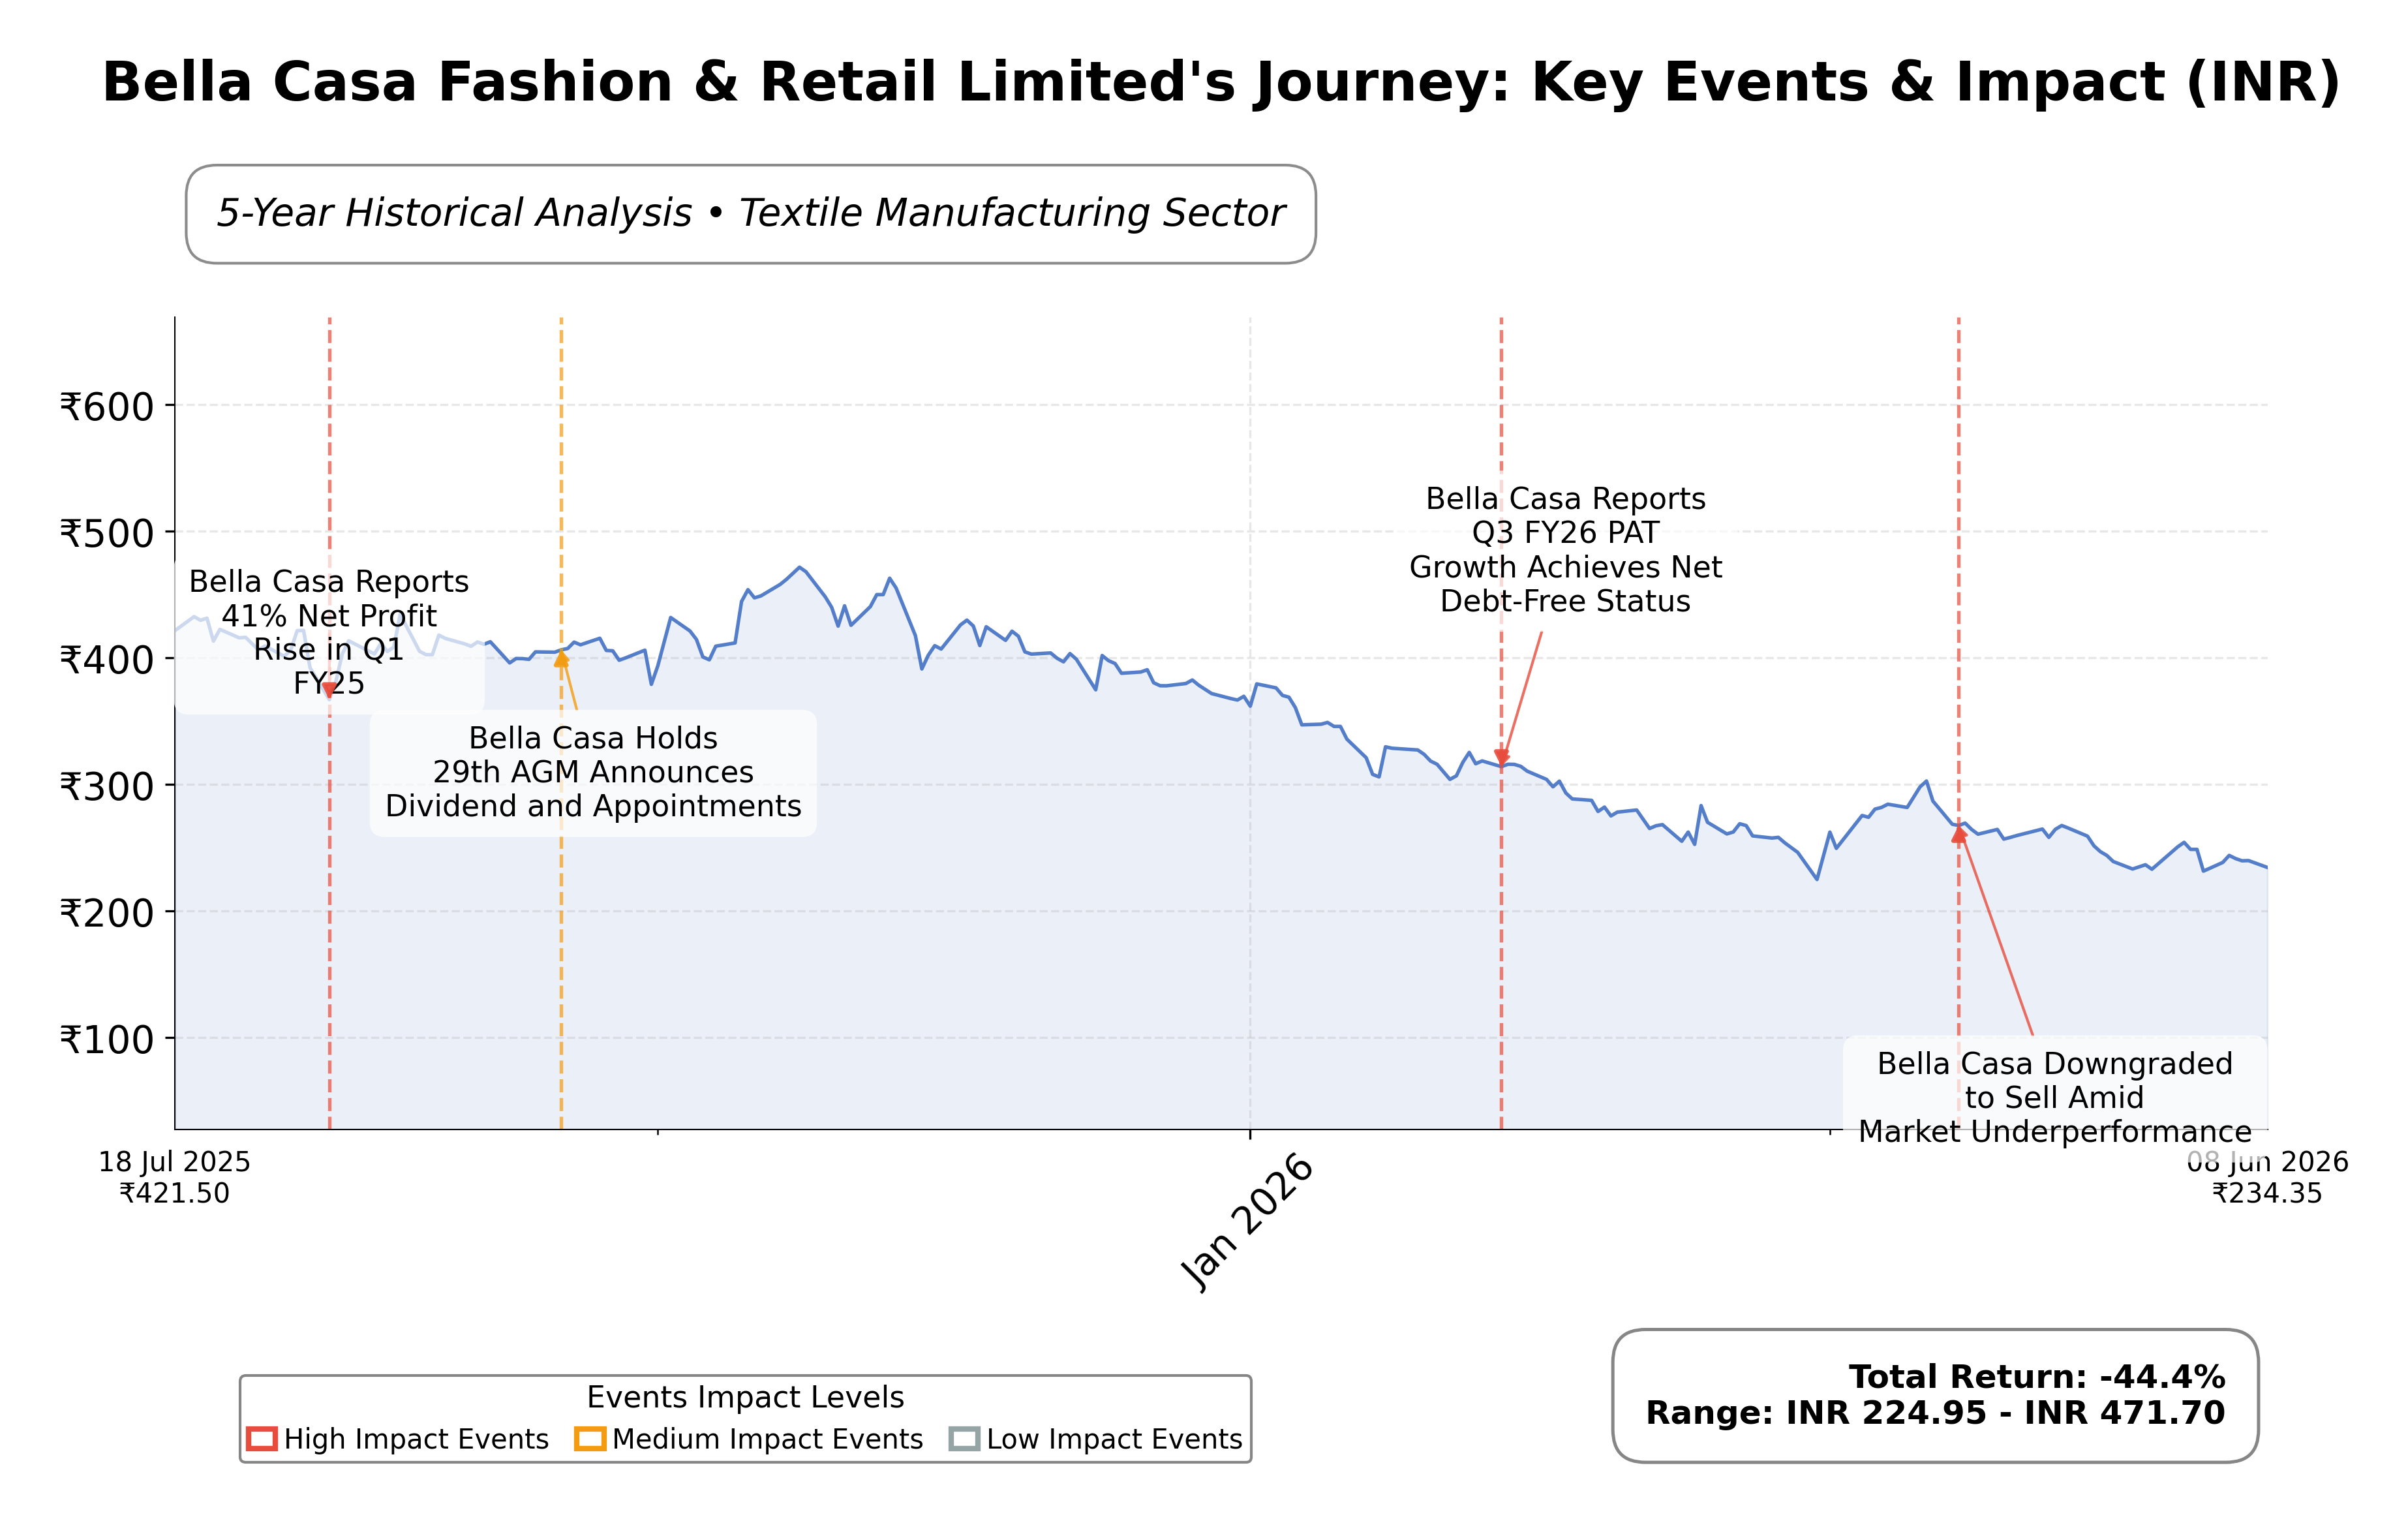
Stock Journey
Key Positives and Key Risks
Pros
- Bella Casa’s trailing P/E ratio of 15.62 is below many peers, indicating relatively attractive earnings valuation.
- The apparel ODM segment contributes 94% of revenue, driving strong quarterly revenue growth of 27.1%.
- The company maintains a healthy current ratio of 1.91, reflecting solid short-term liquidity.
Cons
- Negative levered free cash flow of INR -214.71 million suggests cash flow constraints.
- Debt-to-equity ratio of 47.05% indicates moderate leverage that may limit financial flexibility.
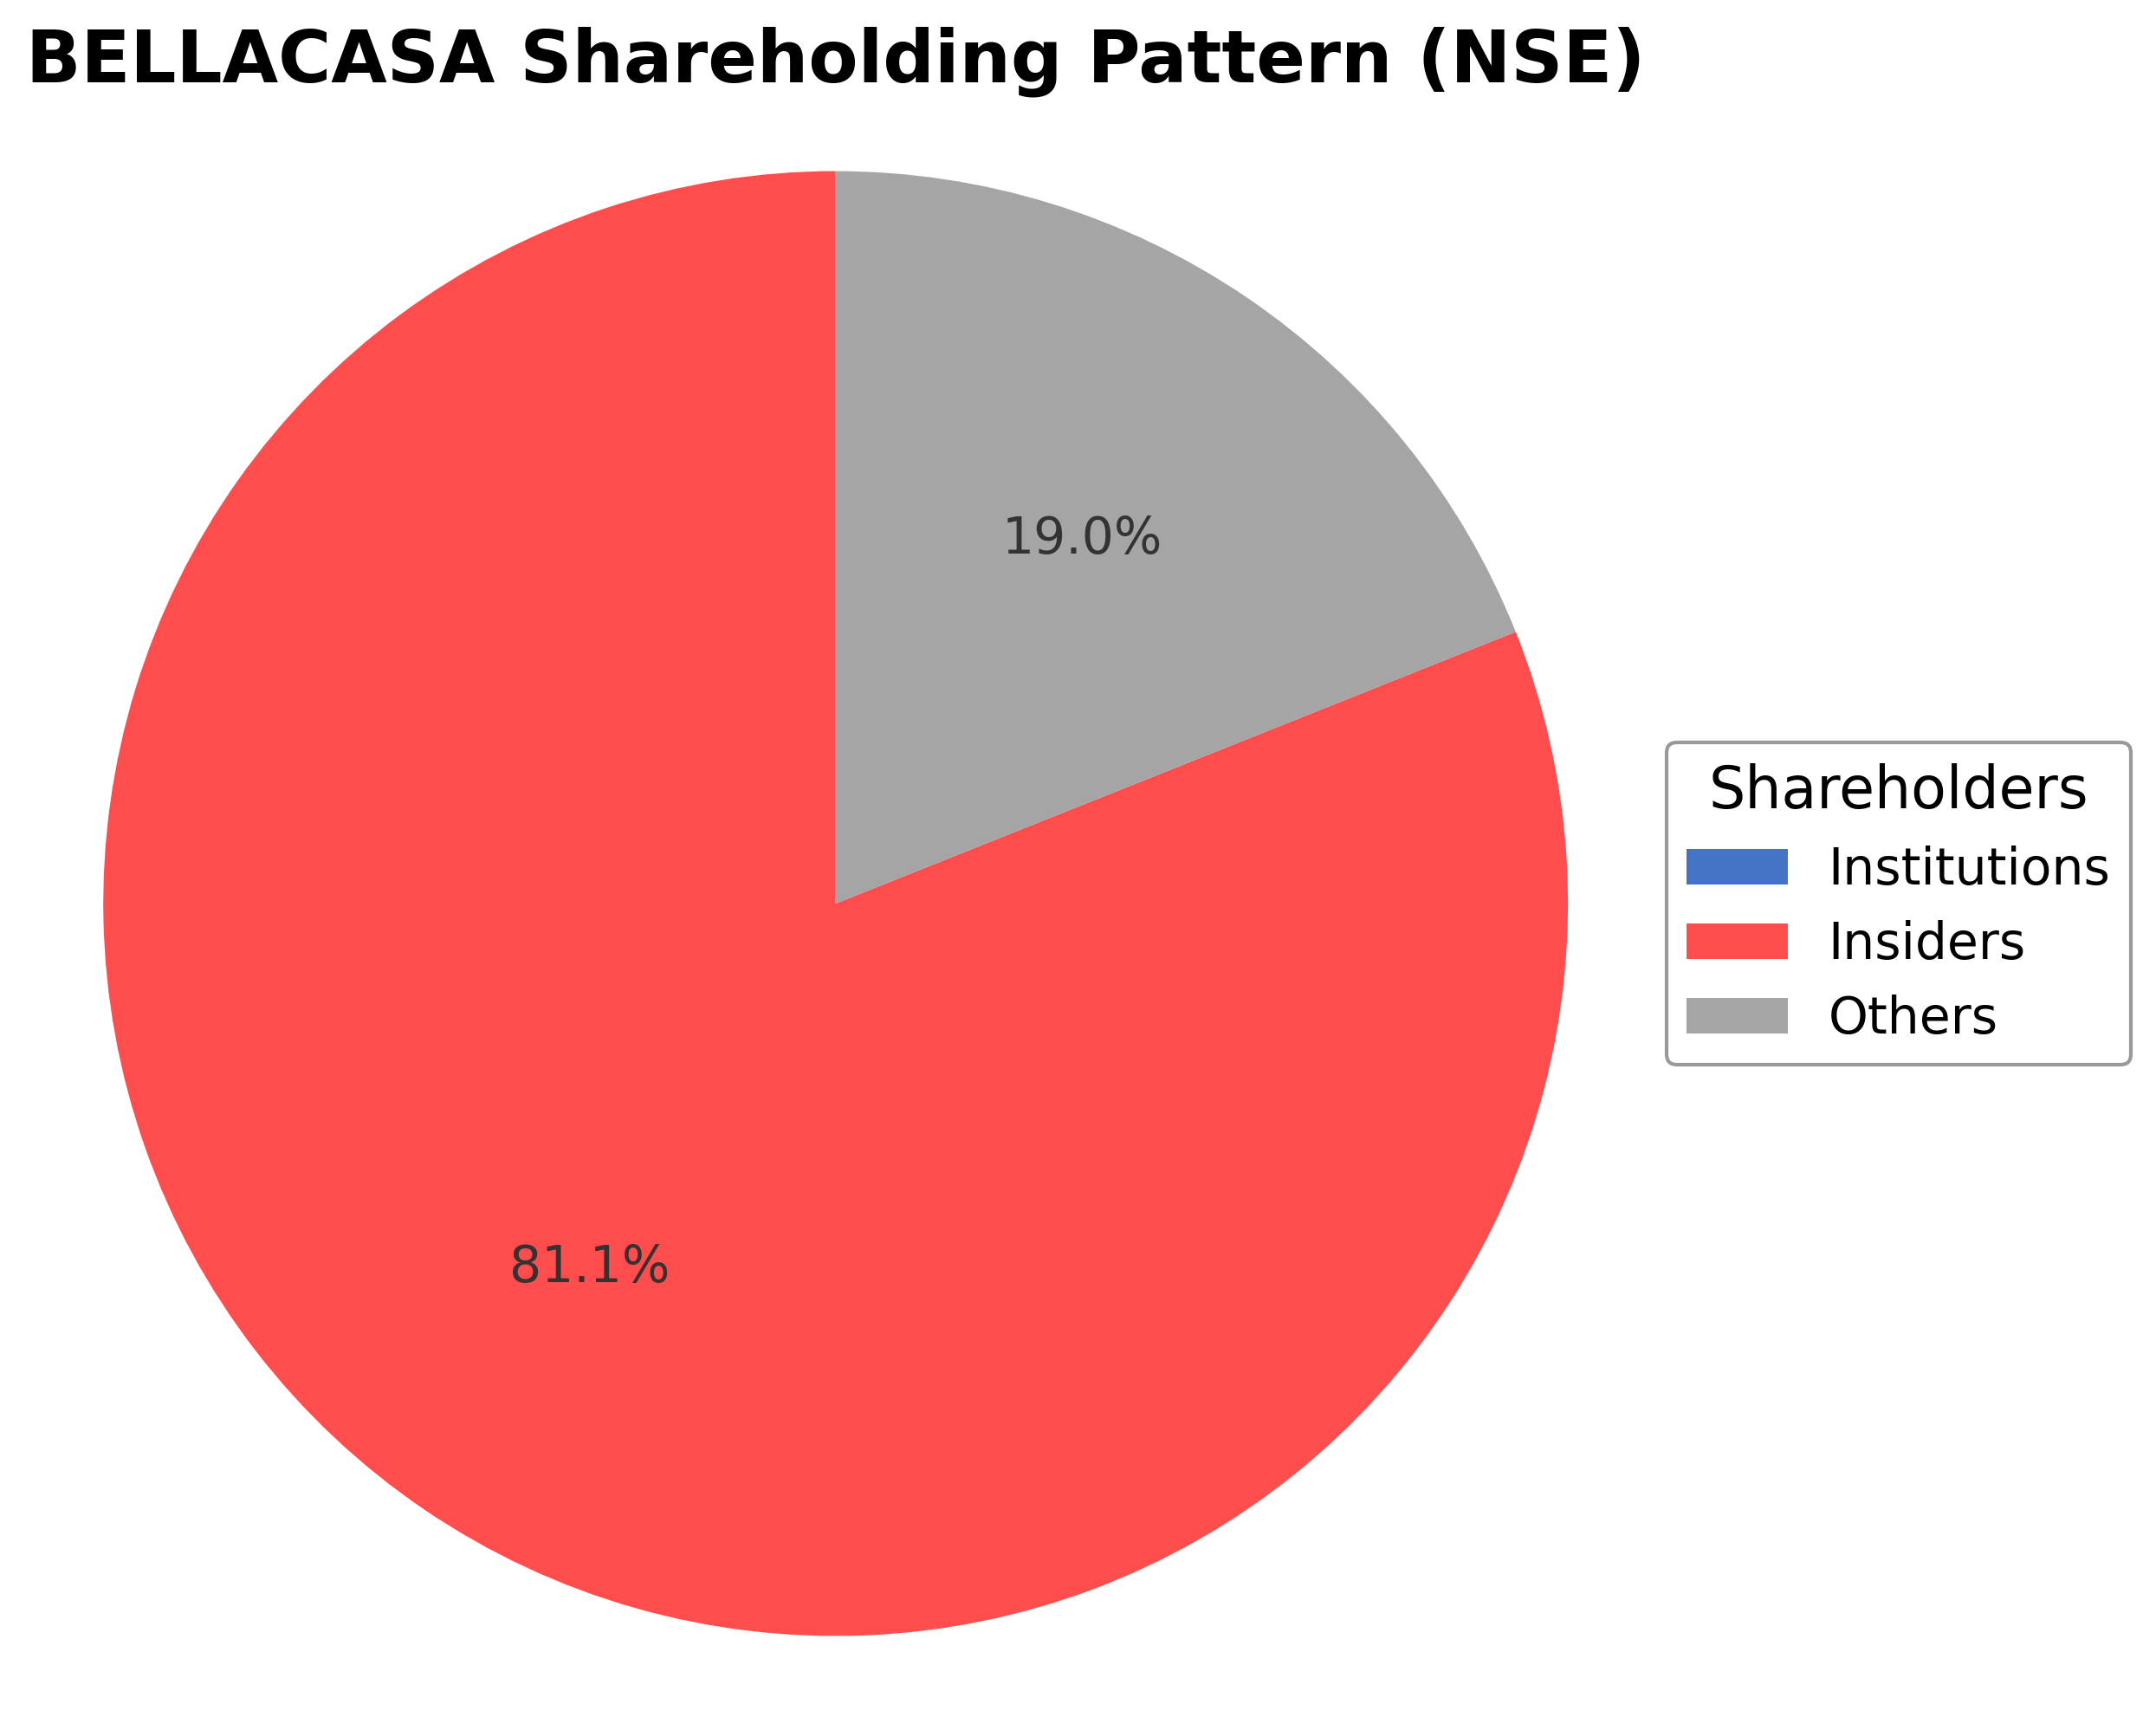
- Limited institutional ownership at 0% reduces market liquidity and broader investor support.
Disclosure: This information is for general awareness and does not constitute investment advice
Report Summary
Bella Casa Fashion & Retail Limited operates primarily in the textile manufacturing and consumer cyclical sector, listed on the NSE in India. The company specializes in manufacturing and retailing home furnishings and apparel, including bed sheets, quilts, and garments under the Bella Casa brand. It serves both branded retail customers and B2B clients, offering original design manufacturing services to over 50 domestic brands. Headquartered in Jaipur, the company has a significant presence in India’s fashion and home textile markets, with a focus on quality and diverse product lines.
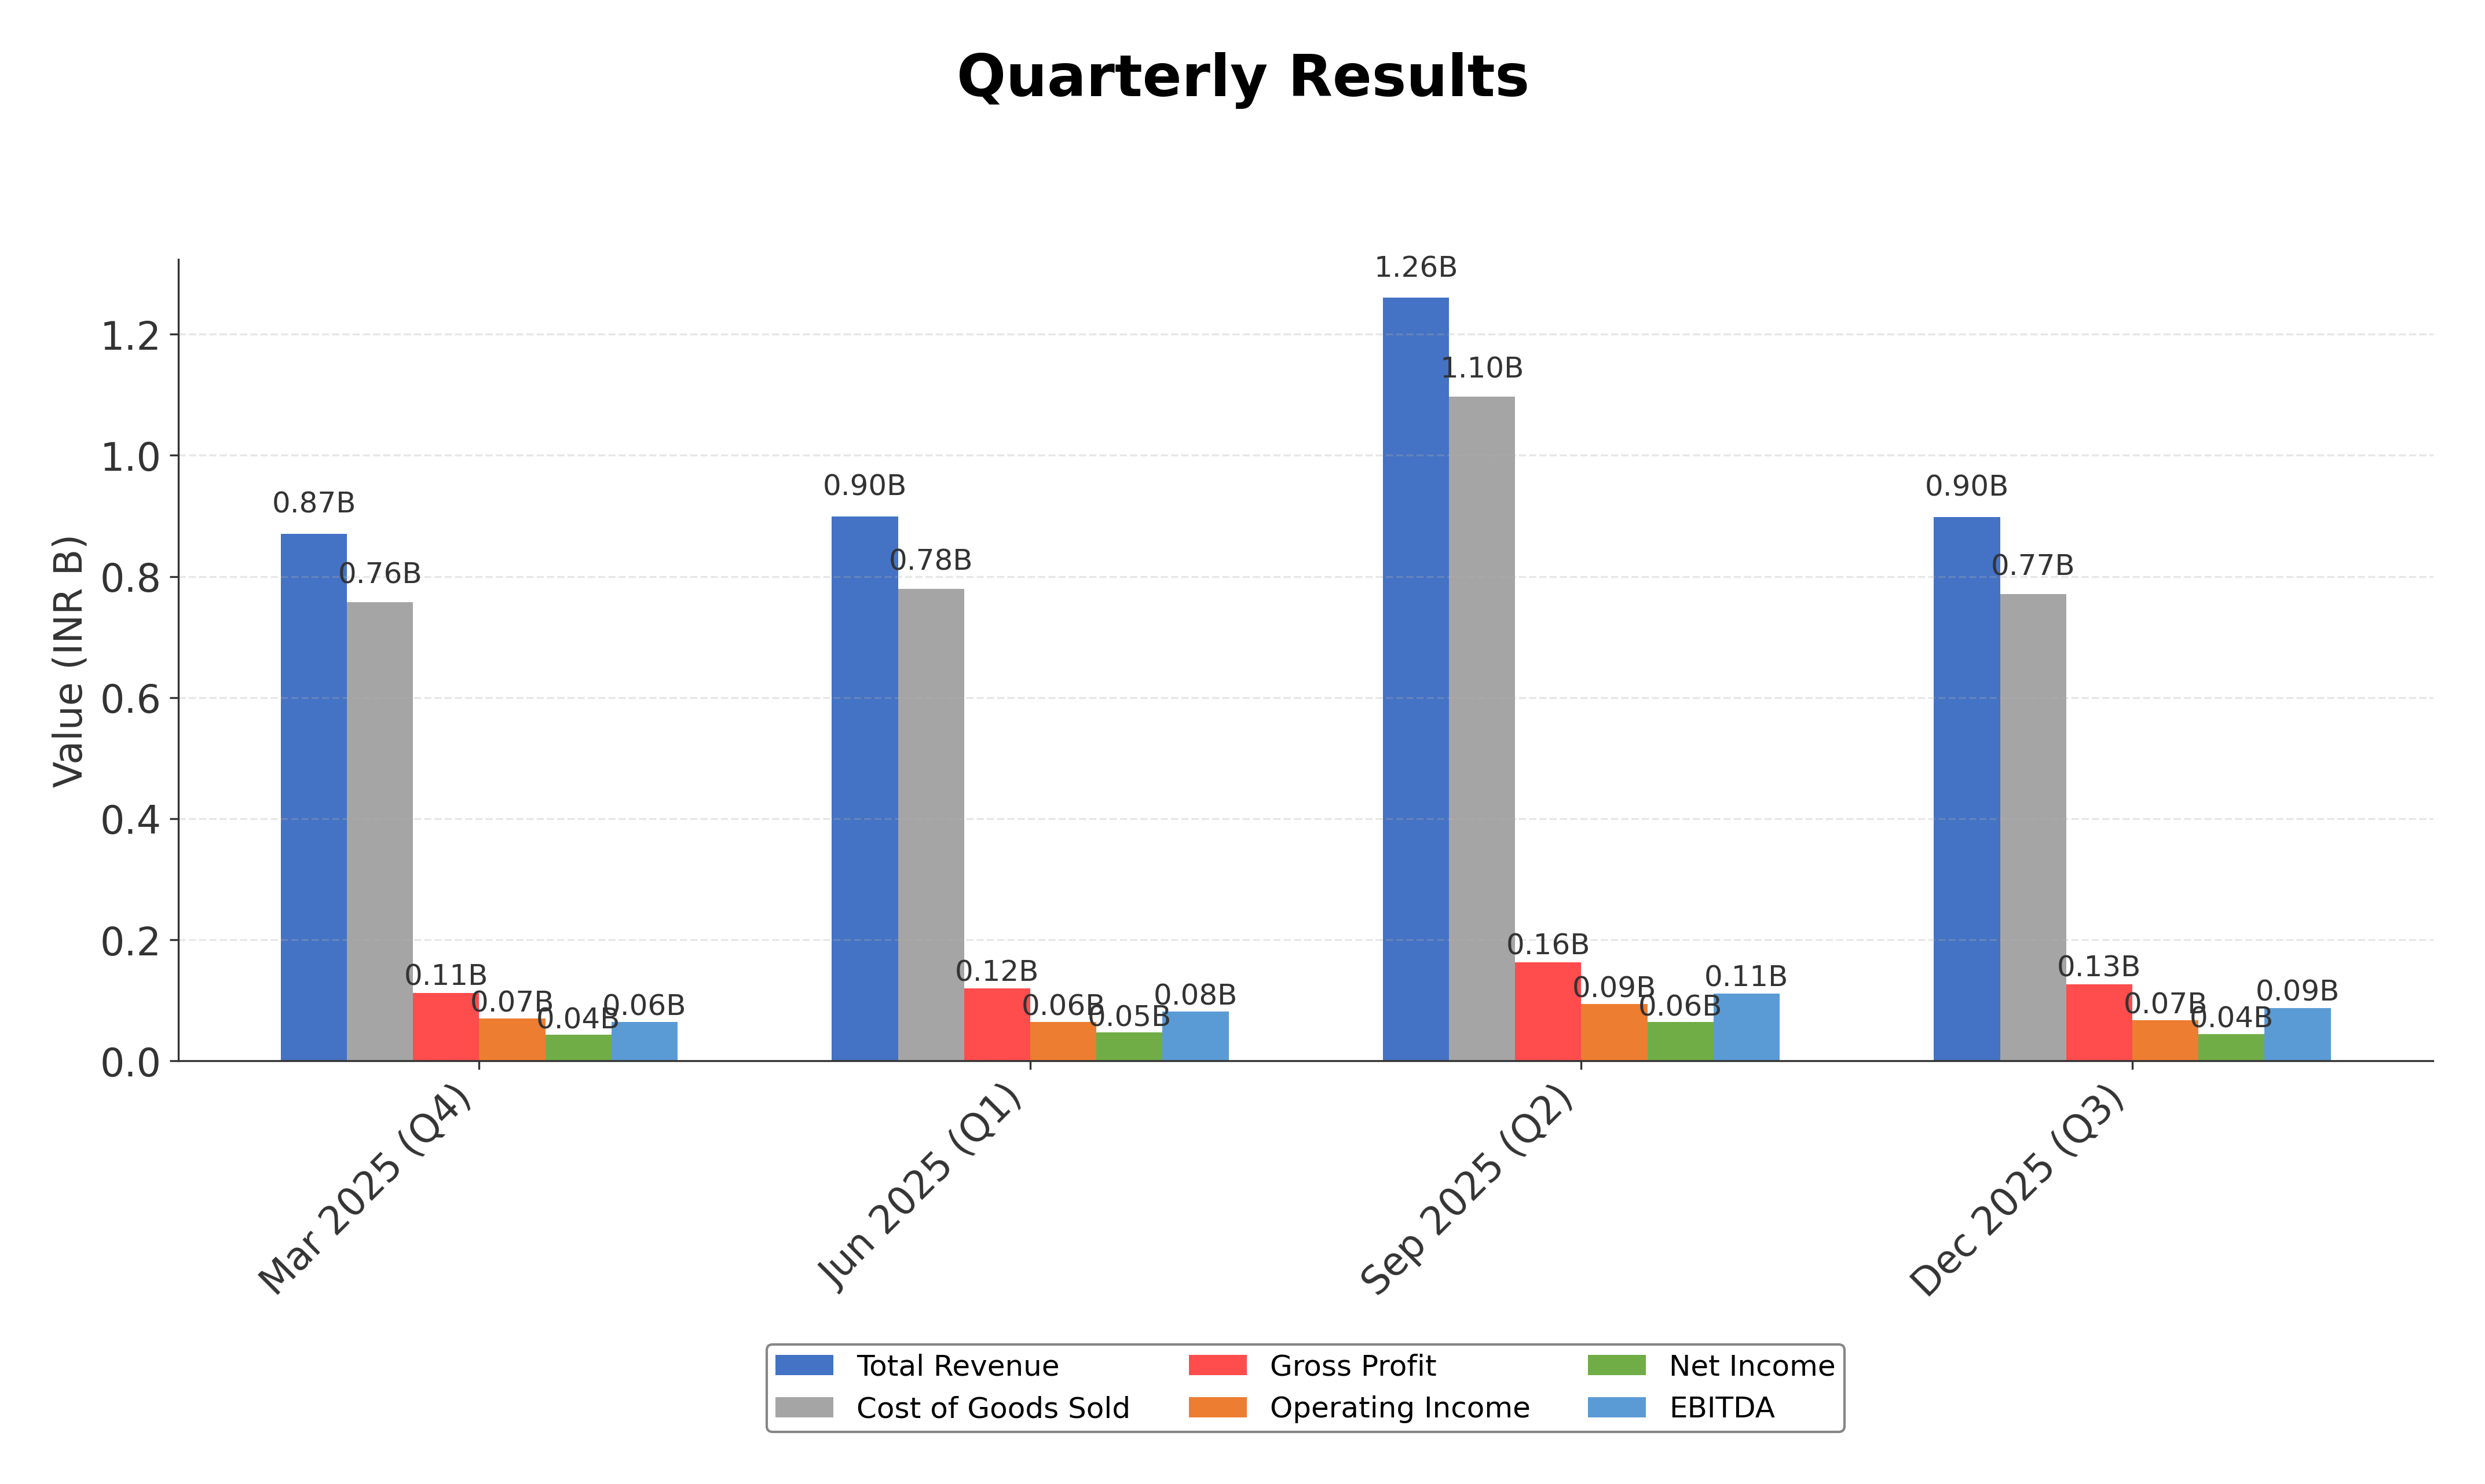
Financially, Bella Casa reported trailing twelve months (TTM) revenue of approximately INR 4.16 billion, with a gross margin of 14.13%, operating margin of 5.93%, and net profit margin of 4.83%. The company’s return on equity (ROE) stands at 12.71%, and return on assets (ROA) at 7.09%, indicating moderate profitability and efficient asset utilization. EBITDA for the period was INR 344.58 million, reflecting operational earnings strength, while net income attributable to common shareholders was INR 201.27 million. The company’s operating cash flow was INR 313.77 million, though levered free cash flow was negative at INR -214.71 million, suggesting capital expenditure or financing activities impacting free cash flow.
From a valuation perspective, Bella Casa’s trailing price-to-earnings (P/E) ratio is 15.62, closely aligned with the industry average, while its price-to-book (P/B) ratio is 1.83, indicating the stock trades at a premium to book value. The enterprise value to EBITDA (EV/EBITDA) ratio is 10.73, reflecting moderate valuation relative to earnings before interest, taxes, depreciation, and amortization. The market capitalization is approximately INR 3.12 billion. The stock’s 52-week range spans INR 220.25 to INR 497.35, with the current price near the lower end at INR 232.97, suggesting recent price weakness relative to its annual high.
Bella Casa’s strengths include a strong market position in apparel original design manufacturing (ODM), which now contributes 94% of total revenue, and a healthy current ratio of 1.91, indicating solid short-term liquidity. The company maintains moderate debt levels with a debt-to-equity ratio of 47.05%. Key risks involve competitive pressures in the textile and apparel sector, potential regulatory challenges in India, and macroeconomic factors affecting consumer discretionary spending. Recent strategic actions include the constitution of a new management committee and reappointment of internal auditors, reflecting governance enhancements.
Technically, the stock is trading below its 200-day moving average of INR 340.86 and near the 50-day moving average of INR 256.14, indicating a bearish to neutral trend. Momentum indicators such as RSI and MACD suggest subdued momentum with potential support near INR 220. The overall technical setup and recent news flow imply a cautious stance, with market participants likely monitoring operational performance and sector dynamics before adjusting positions.
Company and Industry Overview
Company Basics
Price Performance
Company Size
Shareholding Pattern
Sector and Industry Analysis
The textile and apparel sector in India is a significant contributor to the economy, with a market size valued in hundreds of billions of dollars and a steady growth trajectory driven by rising domestic consumption and export demand. Key players include established manufacturers and retailers such as Nahar Industrial Enterprises, Raghuvir Synthetics, and Bella Casa Fashion & Retail Ltd, which operate across various segments from fabric production to fashion retail. The sector benefits from a large skilled workforce and extensive raw material availability, supporting both organized and unorganized market segments.
Industry trends highlight a shift towards branded apparel and fast fashion, with companies increasingly leveraging e-commerce platforms and digital marketing to enhance reach and customer engagement. Competitive dynamics are marked by intense rivalry among mid-sized firms and emerging brands, with barriers to entry including capital intensity, supply chain management, and brand differentiation. Firms like Bella Casa face pressure to innovate in product offerings and maintain cost efficiencies to sustain market share amid fluctuating consumer preferences and economic cycles.
The regulatory environment for the textile and retail sector is shaped by policies from the Securities and Exchange Board of India (SEBI) and other government bodies, focusing on transparency, corporate governance, and investor protection. Compliance with SEBI’s listing obligations and disclosure requirements ensures accountability and market discipline for publicly listed companies such as Bella Casa. Additionally, government initiatives promoting textile exports and Make in India policies aim to bolster sector growth, while labor and environmental regulations continue to influence operational practices and cost structures.
Note: Analysis synthesized from industry research, market reports, and regulatory filings. Information is subject to change based on market conditions.
Financial Ratios Dashboard
Illustrative Scenario Analysis
DCF Assumptions:
Method: Two-Stage EPS-Priority Model
Financials
Peer Analysis
| Company Name | Market Cap | P/E Ratio | P/B Ratio | EV/EBITDA | Price to CFO |
|---|---|---|---|---|---|
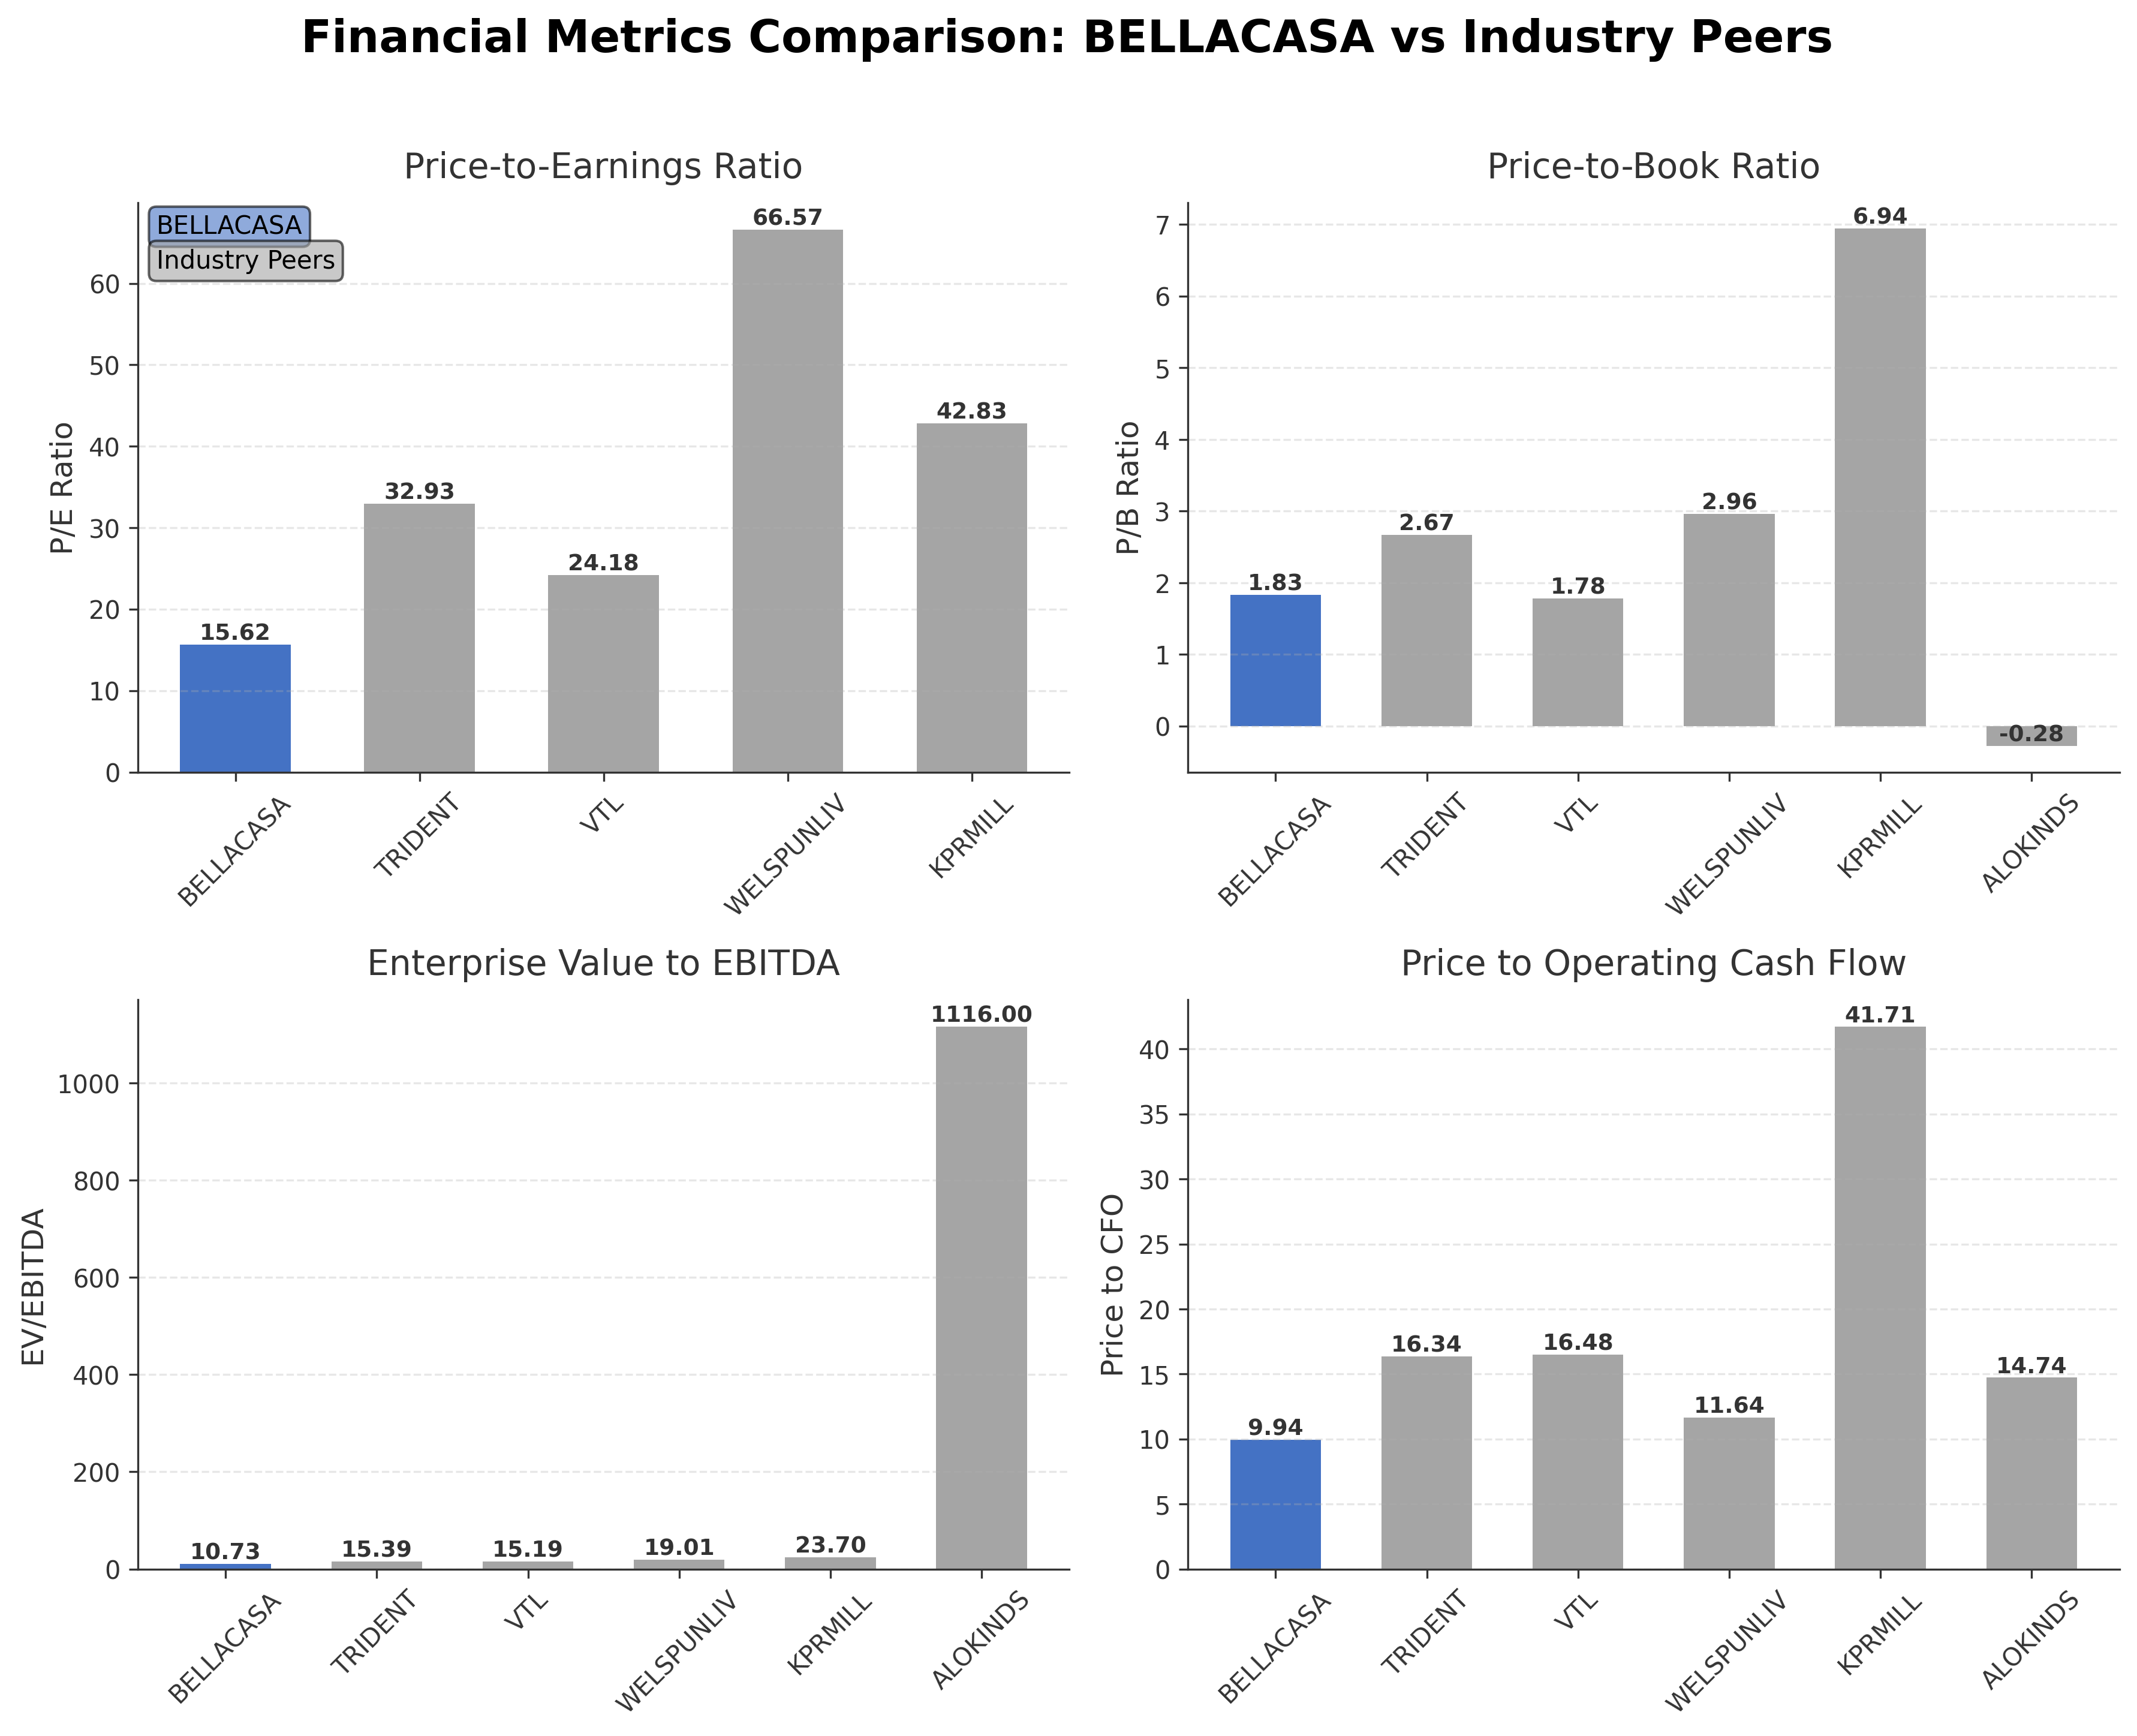
| Bella Casa Fashion & Retail Limited | ₹3.12B | 15.62 | 1.83 | 10.73 | 9.94 |
| Trident Ltd. | ₹124.18B | 32.93 | 2.67 | 15.39 | 16.34 |
| Vardhman Textiles Ltd. | ₹182.65B | 24.18 | 1.78 | 15.19 | 16.48 |
| Welspun Living Ltd. | ₹136.81B | 66.57 | 2.96 | 19.01 | 11.64 |
| KPR Mill Ltd. | ₹372.17B | 42.83 | 6.94 | 23.70 | 41.71 |
| Alok Industries Ltd. | ₹61.82B | N/A | -0.28 | 1116.00 | 14.74 |
Comparison Analysis: Bella Casa Fashion & Retail Limited trades at a lower P/E ratio of 15.62 compared to most of its regional textile peers, which range from approximately 24 to 66, indicating relatively more attractive earnings valuation. Its P/B ratio of 1.83 is moderate, lower than KPR Mill’s 6.94 but slightly higher than Vardhman Textiles at 1.78, reflecting balanced market valuation relative to book value. The company’s EV/EBITDA ratio of 10.73 is also below many peers, suggesting a more conservative enterprise valuation. Return on equity at 12.71% is competitive within the peer group, outperforming several larger firms. Overall, Bella Casa presents a valuation profile that is more conservative and potentially less expensive relative to its larger, more established textile industry competitors.
Financial Metrics Comparison with Peers
Financial Statements
Comprehensive financial data including income, balance sheet, and cash flow metrics
Income Statement
| fiscal_date | 2025-03-31 |
|---|---|
| Sales | 3.49B |
| Cost Of Goods | 2.95B |
| Gross Profit | 532.59M |
| Operating Expense Selling General And Administrative | 52.13M |
| Operating Expense Other Operating Expenses | 86.44M |
| Operating Income | 273.57M |
| Non Operating Interest Income | 5.88M |
| Non Operating Interest Expense | 50.78M |
| Pretax Income | 212.89M |
| Income Tax | 54.94M |
| Net Income | 157.95M |
| Eps Basic | 12.39 |
| Eps Diluted | 12.39 |
| Basic Shares Outstanding | 12.75M |
| Diluted Shares Outstanding | 12.75M |
| Ebit | 263.67M |
| Ebitda | 306.69M |
| Net Income Continuous Operations | 212.89M |
| Preferred Stock Dividends | 0.00 |
Data provided by Twelve Data
Balance Sheet
| fiscal_date | 2025-03-31 |
|---|---|
| Cash And Cash Equivalents | 1.42M |
| Accounts Receivable | 492.90M |
| Total Assets | 2.13B |
| Total Liabilities | 634.76M |
| Long Term Debt | 119.47M |
| Shareholders Equity | 1.50B |
Data provided by Twelve Data
Cash Flow Statement
| fiscal_date | 2025-03-31 |
|---|---|
| Operating Activities Net Income | 212.89M |
| Operating Activities Other Non Cash Items | 44.21M |
| Operating Activities Accounts Receivable | -110.98M |
| Operating Activities Other Assets Liabilities | 1.26M |
| Operating Activities Operating Cash Flow | 147.38M |
| Investing Activities Capital Expenditures | -102.63M |
| Investing Activities Net Acquisitions | 0.00 |
| Investing Activities Purchase Of Investments | -210.00M |
| Investing Activities Sale Of Investments | 82.00K |
| Investing Activities Other Investing Activity | -4.12M |
| Investing Activities Investing Cash Flow | -316.67M |
| Financing Activities Long Term Debt Issuance | 52.39M |
| Financing Activities Long Term Debt Payments | -288.33M |
| Financing Activities Common Stock Issuance | 499.16M |
| Financing Activities Common Dividends | -11.13M |
| Financing Activities Other Financing Charges | -1.00K |
| Financing Activities Financing Cash Flow | 252.09M |
| End Cash Position | 1.42M |
| Free Cash Flow | 14.10M |
Data provided by Twelve Data
Technical Analysis
Key Insights
- Bella Casa’s current trend shows a downward price movement with the stock trading below its 200-day moving average of INR 340.86 and near the 50-day moving average of INR 256.14, indicating a bearish to neutral trend.
- Key support levels are observed near INR 220, which aligns with the 52-week low, while resistance is noted around INR 256 and INR 340, corresponding to the 50-day and 200-day moving averages respectively.
- The stock is trading below the 200-day moving average but close to the 50-day moving average, suggesting short-term consolidation within a longer-term downtrend.
- Momentum indicators such as RSI are subdued, indicating limited buying pressure, while MACD shows a bearish crossover, reflecting weakening momentum; stochastic oscillators confirm oversold conditions in the short term.
- Across daily, weekly, and monthly timeframes, the stock exhibits consistent downward pressure with occasional short-term rebounds, highlighting cautious investor sentiment.
- Potential market scenarios include a test of support near INR 220 with possible sideways consolidation or a rebound if momentum indicators improve; failure to hold support could lead to further declines.
Trending News
1. Headline: Who Is Still Doing Deals in Fashion? | BoF
Summary: In a muted deal market, investors are prioritising predictable demand, proven brand strength or heritage brands with turnaround potential.
Sentiment: positive
2. Headline: Trex, Bel Fuse, and Rivian Stocks Trade Up, What You Need To Know - StockStory
Summary: What Happened? A number of stocks jumped in the morning session after the industrial sector recovered, carried by the broad market rebound and a read-through...
Sentiment: positive
Summary: Stock Market Highlights Today: With fresh US-Israel-Iran tensions, BSE Sensex and Nifty50 plunged in trade on Monday to close almost 1% down. Equitie
Sentiment: negative
4. Headline: After Versace Sale, Capri Focuses on Improving Brand Health of Michael Kors and Jimmy Choo | Morningstar
Summary: Morningstar is an investment research company offering mutual fund, ETF, and stock analysis, ratings, and data, and portfolio tools. Discover actionable insights today.
Sentiment: positive
5. Headline: La Bella Moda, a 45-year-old Conshohocken bridal shop, has closed
Summary: Recently, more customers were browsing in store and then buying elsewhere online, the owner said. “I would start hearing, ‘Oh, I can get this on Amazon’ or ‘Oh, I can get this on Shein.'"
Sentiment: neutral
Powered by Brave
Recent Updates
News Summary
As of June 9, 2026. Bella Casa Fashion & Retail Limited reported strong fiscal year 2026 growth driven predominantly by its apparel Original Design Manufacturer (ODM) segment, which now contributes 94% of total revenue, marking a significant strategic shift. The company has enhanced governance by constituting a new management committee and reappointing its internal auditor for the 2026-27 financial year. Audited financial results for the quarter and year ended March 31, 2026, were published, confirming operational and financial transparency. Investor presentations released at the AGM provided detailed insights into the company’s performance and strategic direction. Overall, these developments underscore Bella Casa's focus on apparel manufacturing and retail expansion, supported by governance improvements and investor communication.
News Sentiment
The overall sentiment from recent updates is positive, driven by robust revenue growth in the apparel ODM segment and proactive governance measures such as management committee formation and auditor reappointment. Transparency through audited results and investor presentations further supports confidence in the company’s strategic execution. Neutral tones are observed in routine regulatory disclosures and market commentary, while external geopolitical tensions introduce a cautious backdrop. The balance of positive operational news and governance actions suggests a constructive outlook grounded in fundamental progress.
Source List
- https://bellacasa.in/pages/investor-relations
Analytical Overview
Analysis Summary
Bella Casa’s valuation metrics, including a trailing P/E of 15.62, align closely with the textile manufacturing industry average, suggesting fair market pricing relative to earnings. The company’s PEG ratio of 0.62 indicates potential undervaluation relative to expected growth, supporting a positive valuation perspective. Revenue growth of 27.1% quarterly and consistent operating cash flow of approximately INR 313.77 million demonstrate a solid growth trajectory and operational cash generation. However, the negative levered free cash flow of INR -214.71 million highlights capital expenditure or financing costs that may impact liquidity. The debt-to-equity ratio of 47.05% reflects moderate leverage, manageable within the sector context. Sector-specific challenges include competitive pressures in India’s apparel and textile markets, while opportunities arise from the expanding apparel ODM segment and growing domestic consumption. India’s regulatory environment and consumer trends favor companies with strong design and manufacturing capabilities, positioning Bella Casa advantageously.
Overall Business and Market Assessment
Supporting Factors: Key supporting factors include Bella Casa’s robust revenue growth driven by the apparel ODM segment, a reasonable valuation relative to peers, and solid return on equity of 12.7%. Risks to monitor encompass the company’s negative free cash flow, moderate debt levels, and sector competition. The company’s governance improvements and strategic focus on apparel manufacturing support medium-term operational stability. A medium-term investment horizon is appropriate to observe how the company manages cash flow and competitive dynamics. Overall, Bella Casa presents a balanced profile with growth potential tempered by financial and market risks.
Risk Factors: No data
SWOT Analysis
Strengths
- Bella Casa has a strong market position in apparel original design manufacturing contributing 94% of revenue.
- The company maintains a healthy current ratio of 1.91, indicating good short-term liquidity.
- Return on equity of 12.71% reflects efficient use of shareholder capital.
- Robust quarterly revenue growth of 27.1% demonstrates strong operational momentum.
Weaknesses
- Negative levered free cash flow of INR -214.71 million indicates cash flow challenges.
- Moderate debt-to-equity ratio of 47.05% may constrain financial flexibility.
- Limited institutional investor presence reduces market liquidity and broader investor support.
- Gross margin of 14.13% is relatively low, impacting profitability potential.
Opportunities
- Expanding apparel ODM segment offers significant revenue growth potential.
- Growing domestic demand for branded home textiles and apparel in India.
- Governance enhancements may improve operational efficiency and investor confidence.
- Potential to increase institutional investor participation and market visibility.
Threats
- Intense competition in the textile and apparel manufacturing sector.
- Regulatory changes in India could impact operational costs and compliance.
- Macroeconomic factors affecting consumer discretionary spending may reduce demand.
- Geopolitical tensions and market volatility could affect investor sentiment.
Company Description
Bella Casa Fashion & Retail Limited is a manufacturer and retailer specializing in home furnishings and apparel. The company produces bed sheets, quilts, home furnishing textile items, printed and dyed furnishing fabrics, and garments under its 'Bella Casa' brand, offering high-quality home textile products for consumers. In its apparel segment, it provides original design manufacturing services to over 50 major domestic brands and retailers, creating diverse clothing lines including Western and Indian attire for women, as well as traditional Indian wear for men and kids. Operating in the textiles and garments industry, Bella Casa Fashion & Retail Limited focuses on both branded retail distribution and B2B manufacturing partnerships, serving the consumer durables and apparel markets. Its production facilities support a range of home-made-ups and ethnic wear, positioning it as a key player in India's fashion and home textiles sector. Headquartered in Jaipur, Rajasthan, and founded in 1996, the company emphasizes comprehensive design, manufacturing, branding, and distribution services today.