
Balrampur Chini Mills Ltd (BALRAMCHIN)
Stock Analysis Report
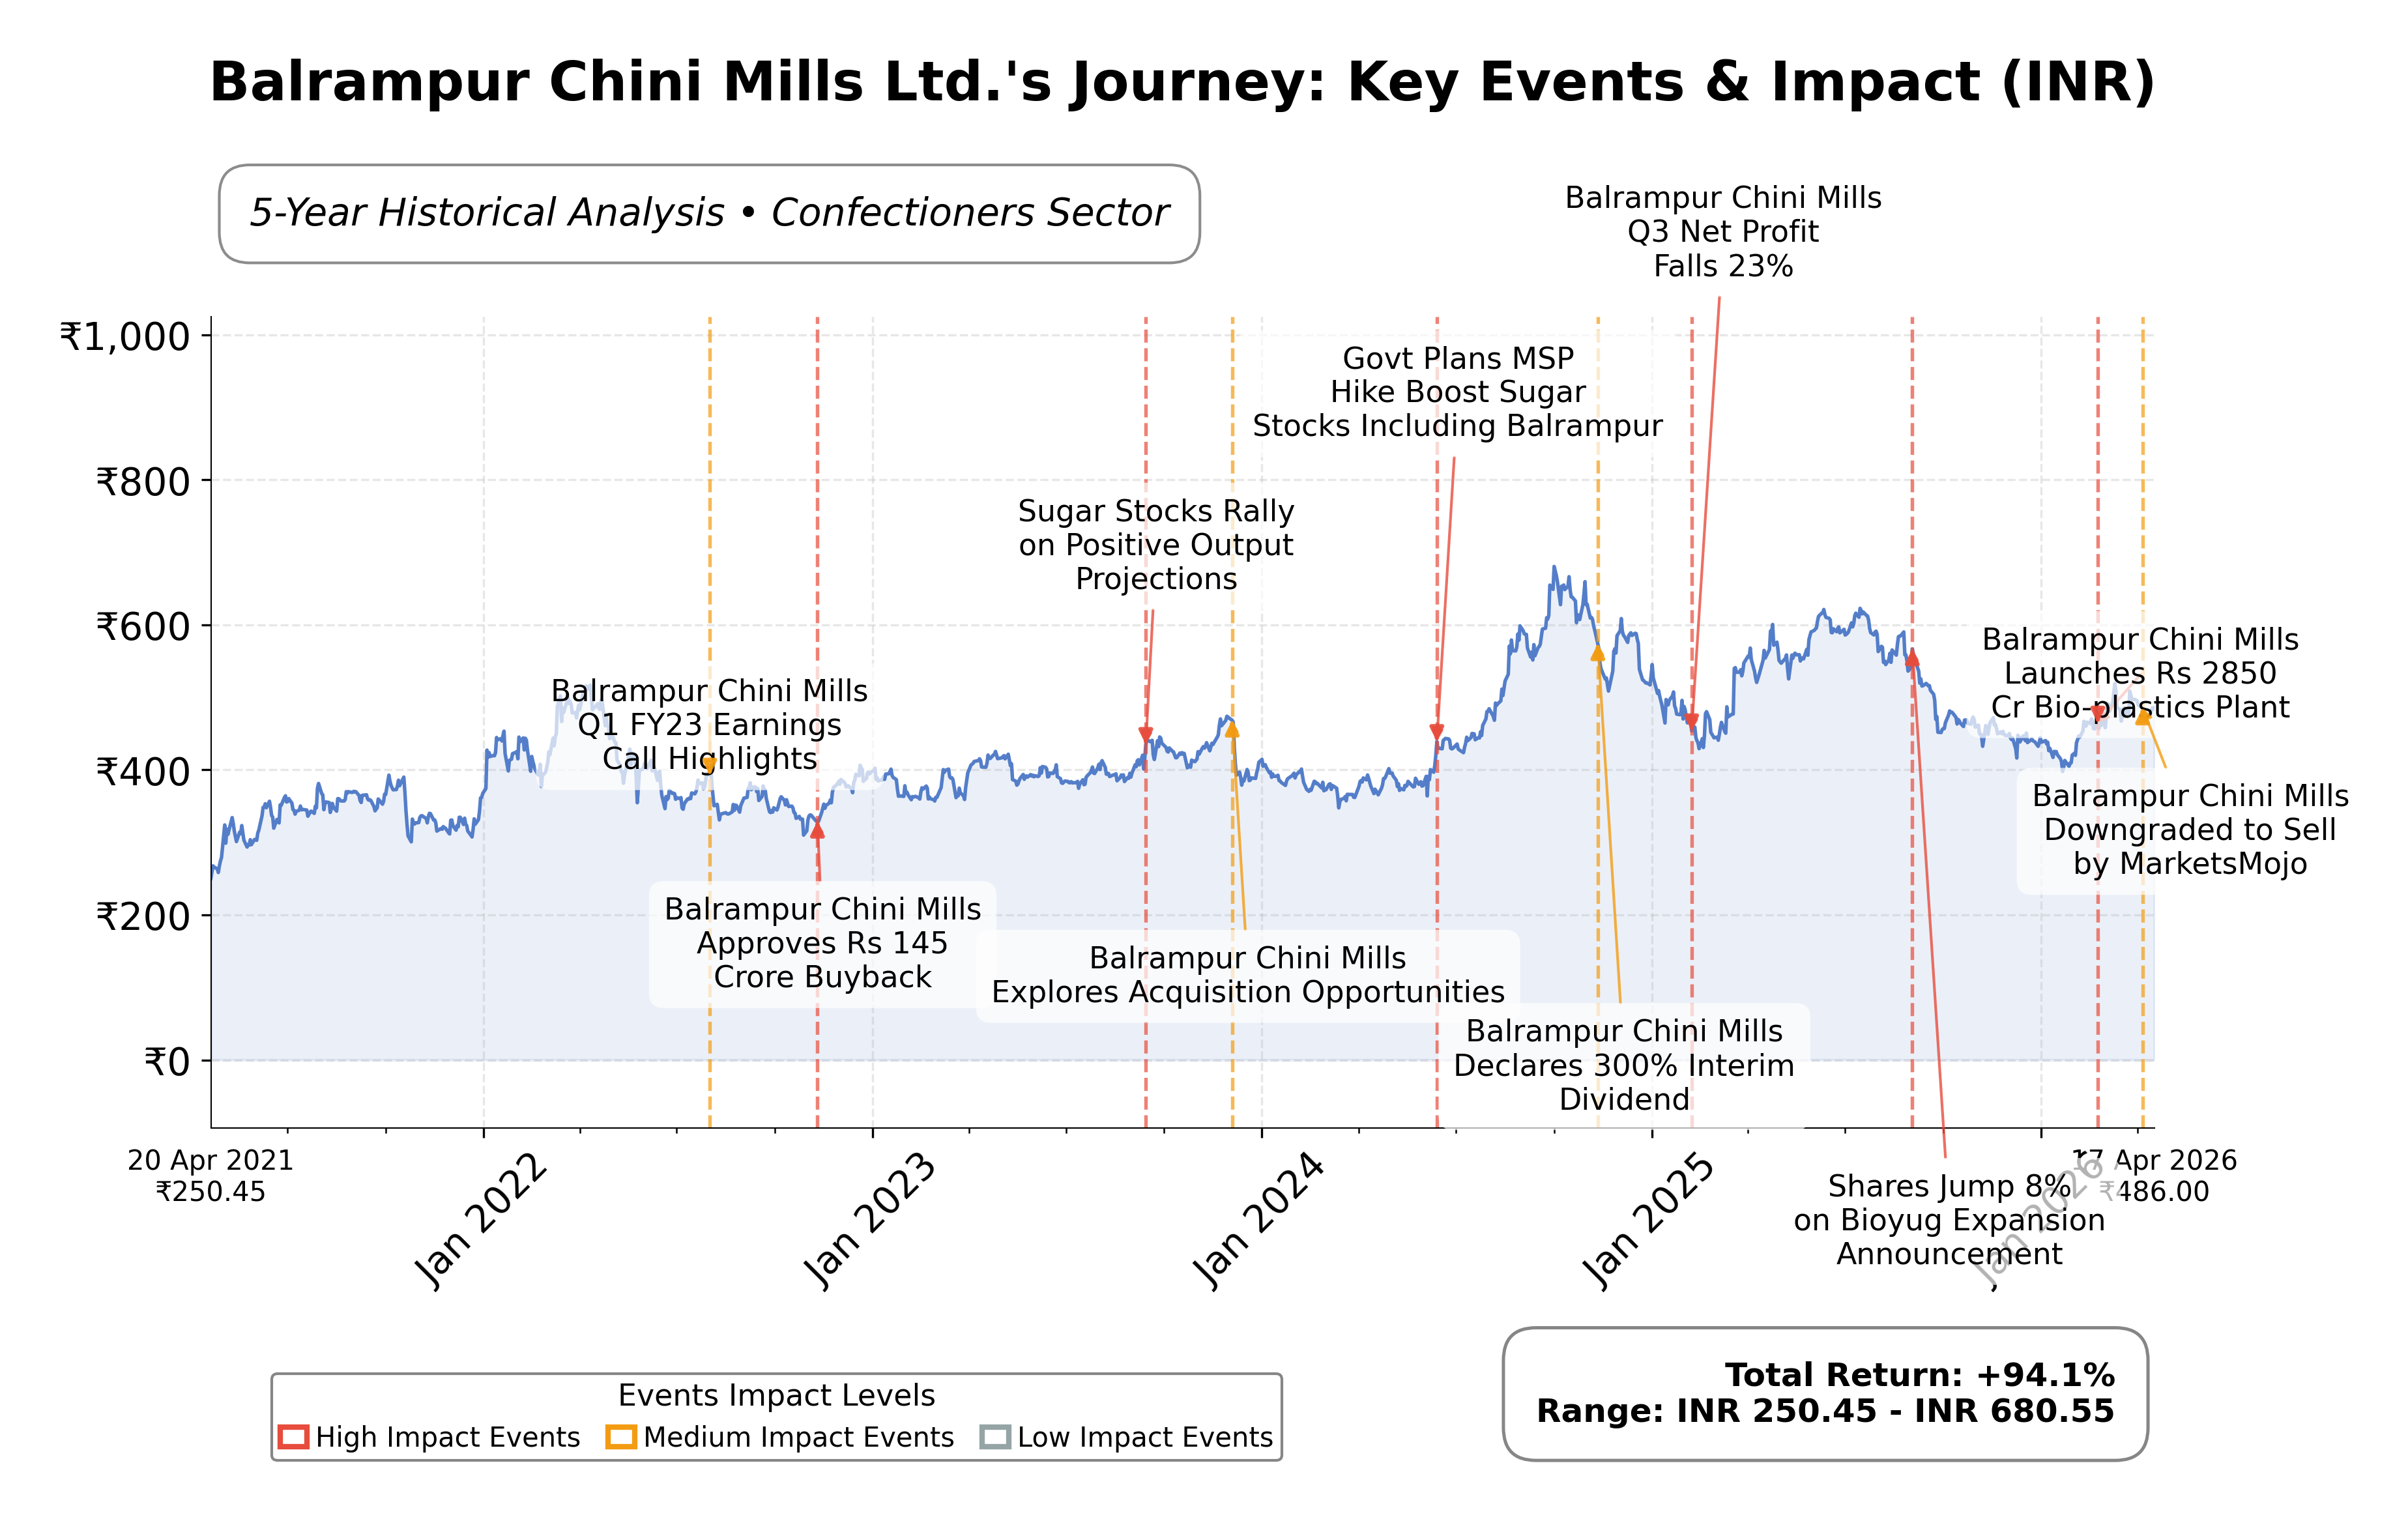
Stock Journey
Key Positives and Key Risks
Pros
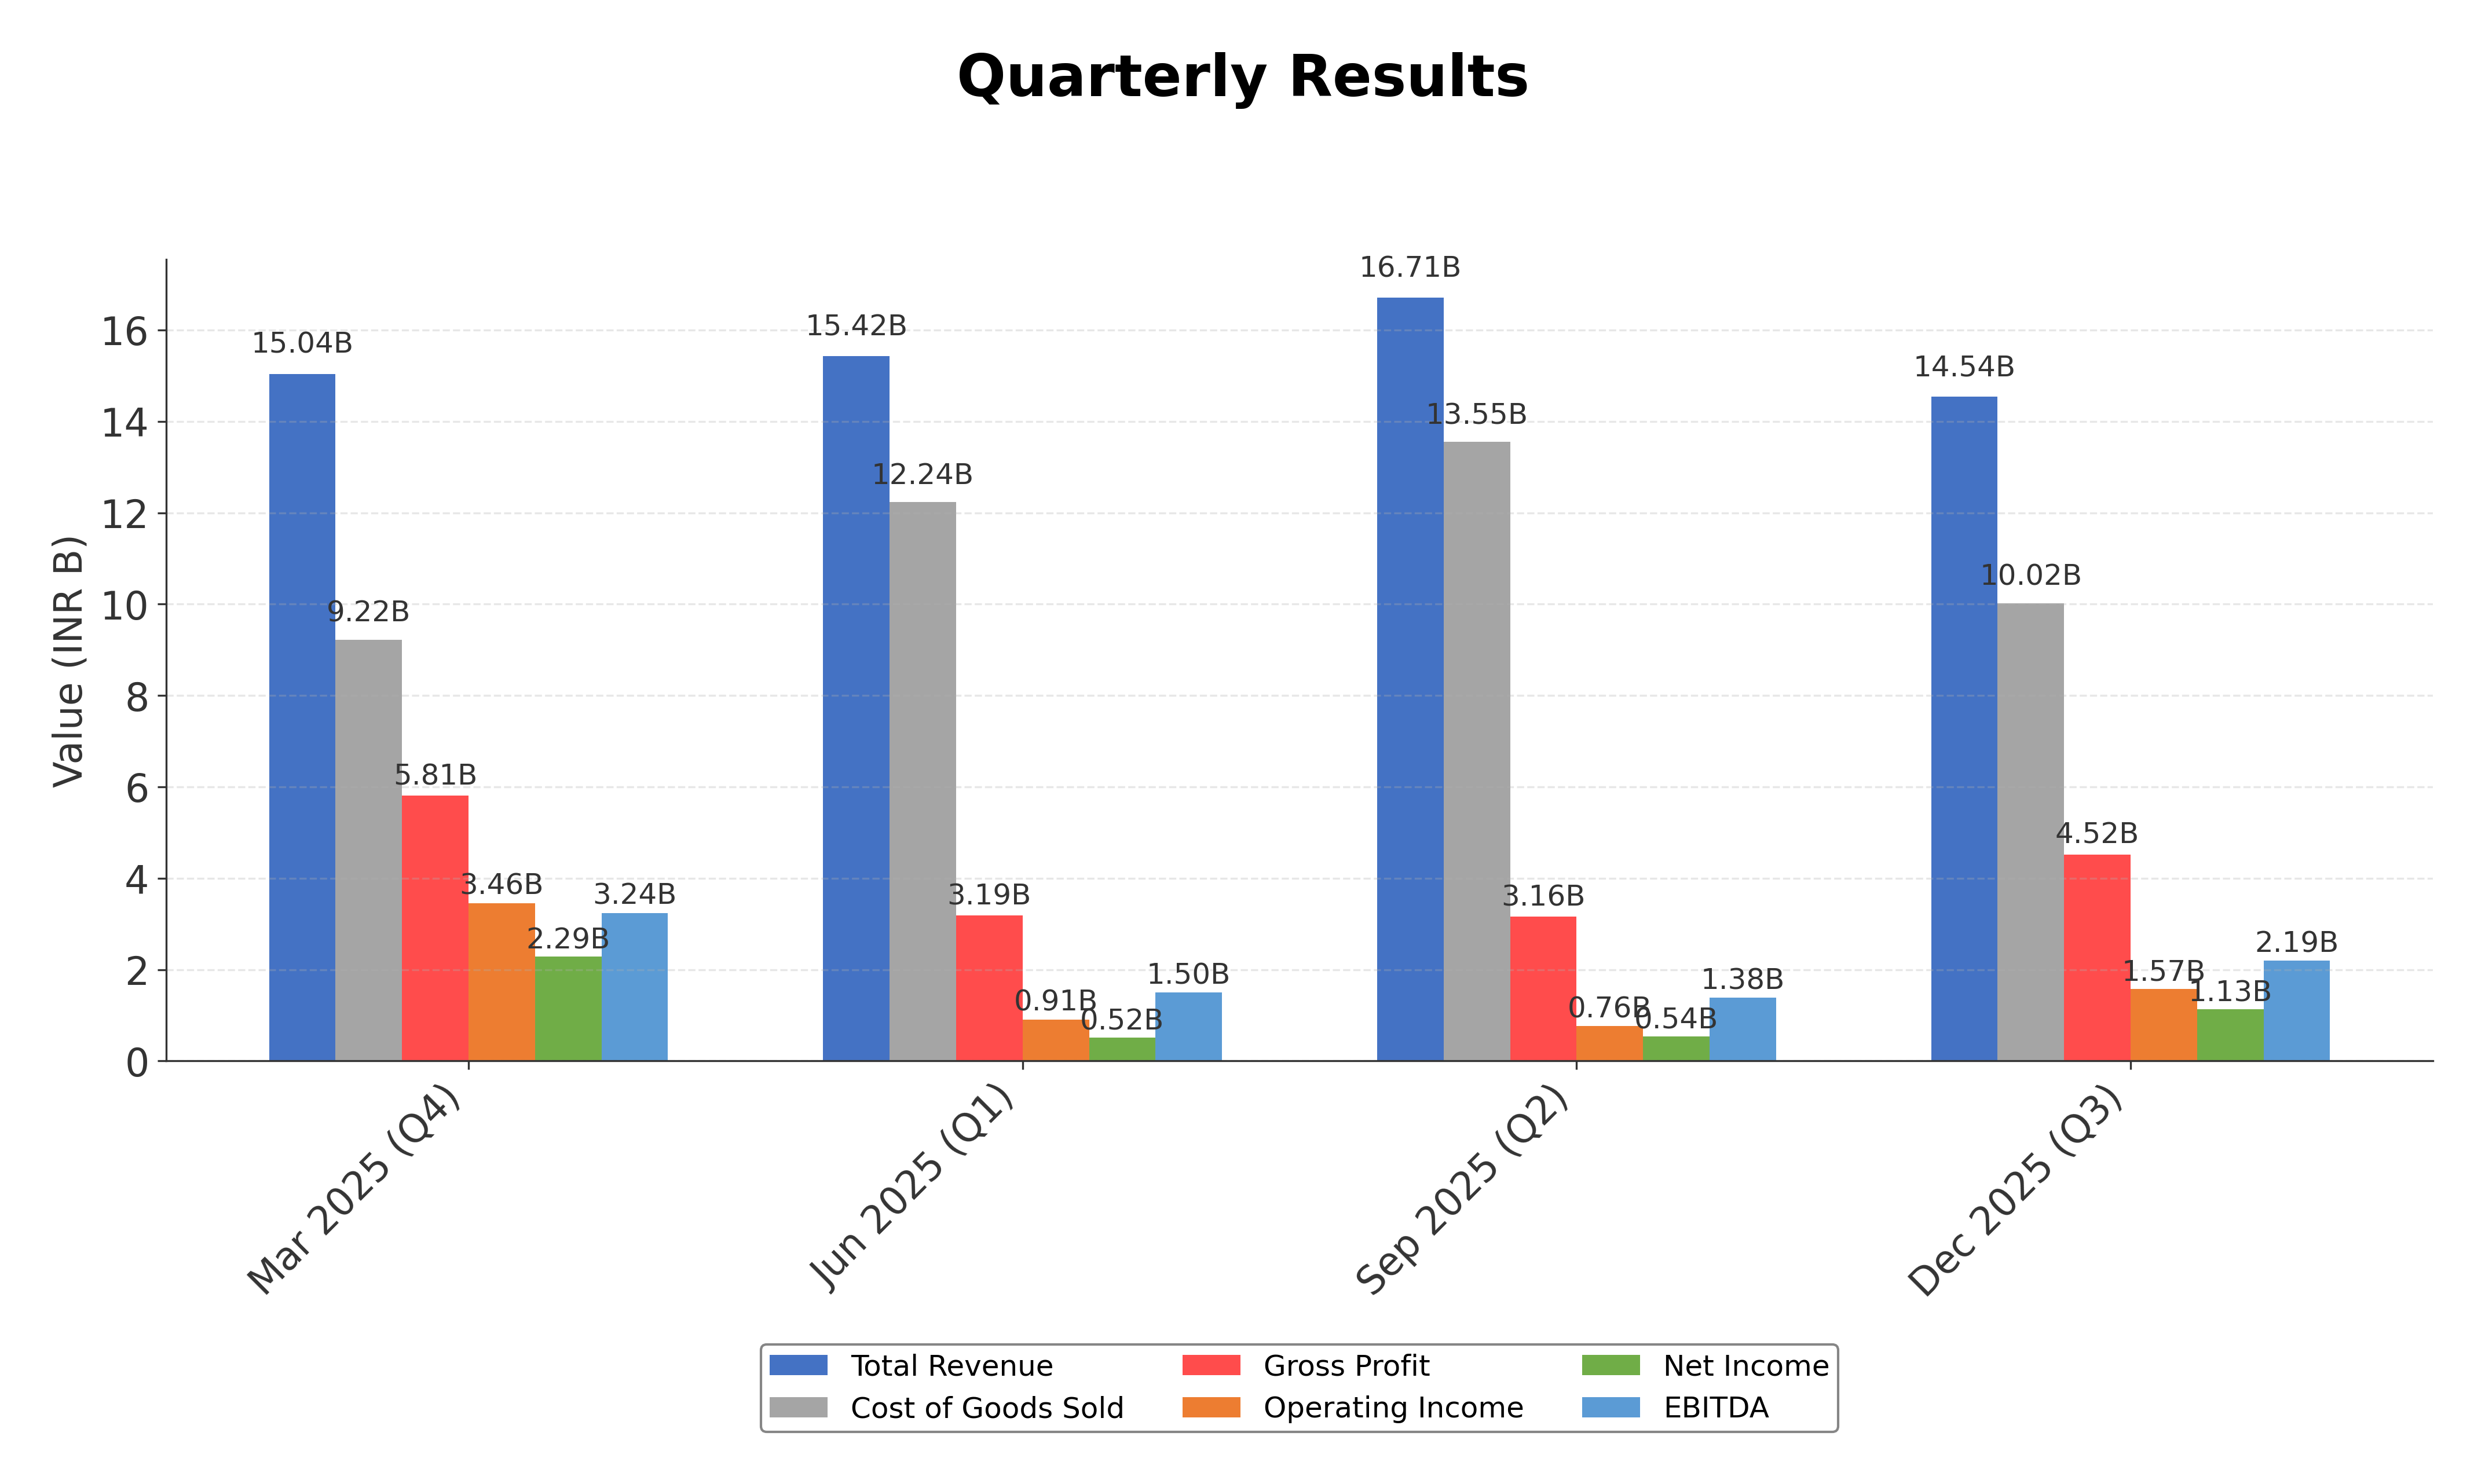
- Revenue growth of 22% quarterly indicates strong demand and operational momentum.
- Return on equity of 11.5% reflects efficient use of shareholder capital.
- Significant investment in bioplastics with ₹2,000–4,000 crore planned expansion supports diversification and sustainability.
Cons
- Stock trades below 50-day and 200-day moving averages, signaling technical weakness.
- Price-to-cash-flow ratio of 25.92 is high relative to peers, suggesting potential overvaluation in cash flow terms.
- Downside risk of approximately 21.5% from 52-week high indicates notable price volatility.
Disclosure: This information is for general awareness and does not constitute investment advice
Report Summary
Balrampur Chini Mills Ltd. is a prominent Indian sugar manufacturing company listed on the NSE under the Consumer Defensive sector, specifically within the Confectioners industry. The company operates large-scale sugar production facilities and is also engaged in the production of ethanol and cogeneration of power, leveraging by-products for sustainable energy generation. Its integrated operations support agricultural supply chains and contribute significantly to the rural economy in India. The company’s market positioning is bolstered by its focus on innovation and expansion, including ventures into bioplastics, making it a key player in the agro-based industry.
Financially, Balrampur Chini Mills reported trailing twelve months (TTM) revenue of approximately ₹61.7 billion with a gross margin of 31.1%, operating margin of 10.8%, and net profit margin of 7.3%. The return on equity (ROE) stands at 11.5%, and return on assets (ROA) at 6.1%, indicating moderate profitability and efficient asset utilization. The company’s EBITDA is ₹8.3 billion, and net income is ₹4.48 billion, reflecting solid earnings growth with a quarterly revenue growth of 22% and quarterly earnings growth year-over-year of 61%. These metrics suggest a stable financial performance with positive growth momentum.
Valuation metrics show a trailing P/E ratio of 22.03 and a forward P/E of 19.26, with a price-to-book ratio of 2.50 and an EV/EBITDA multiple of 12.85. The market capitalization is approximately ₹98.1 billion. The stock price currently trades at ₹516.45, within a 52-week range of ₹393.55 to ₹627.80, representing a downside risk of about 21.5% from the 52-week high. These valuation ratios place the stock near industry averages, suggesting the market prices the company in line with its fundamentals.
Balrampur Chini Mills’ strengths include strong cash flow generation with operating cash flow of ₹3.79 billion and free cash flow of ₹4.37 billion, a healthy current ratio of 2.65 indicating good liquidity, and relatively low debt-to-equity ratio of 0.20. The company is also advancing strategic initiatives such as a significant investment in India’s first polylactic acid (PLA) bioplastics plant, reflecting a commitment to green growth and diversification. Key risks include regulatory challenges in the sugar sector, competitive pressures, and macroeconomic factors affecting commodity prices and demand.
Technically, the stock exhibits mixed signals with a current price below its 50-day and 200-day moving averages, and momentum indicators showing a mildly bearish stance on some timeframes while others suggest consolidation. Recent news highlights both upgrades and downgrades in analyst sentiment, reflecting uncertainty. Overall, the data suggests a cautious stance with potential for sideways movement, warranting close monitoring of financial and technical developments.
Company and Industry Overview
Company Basics
Price Performance
Company Size
Shareholding Pattern
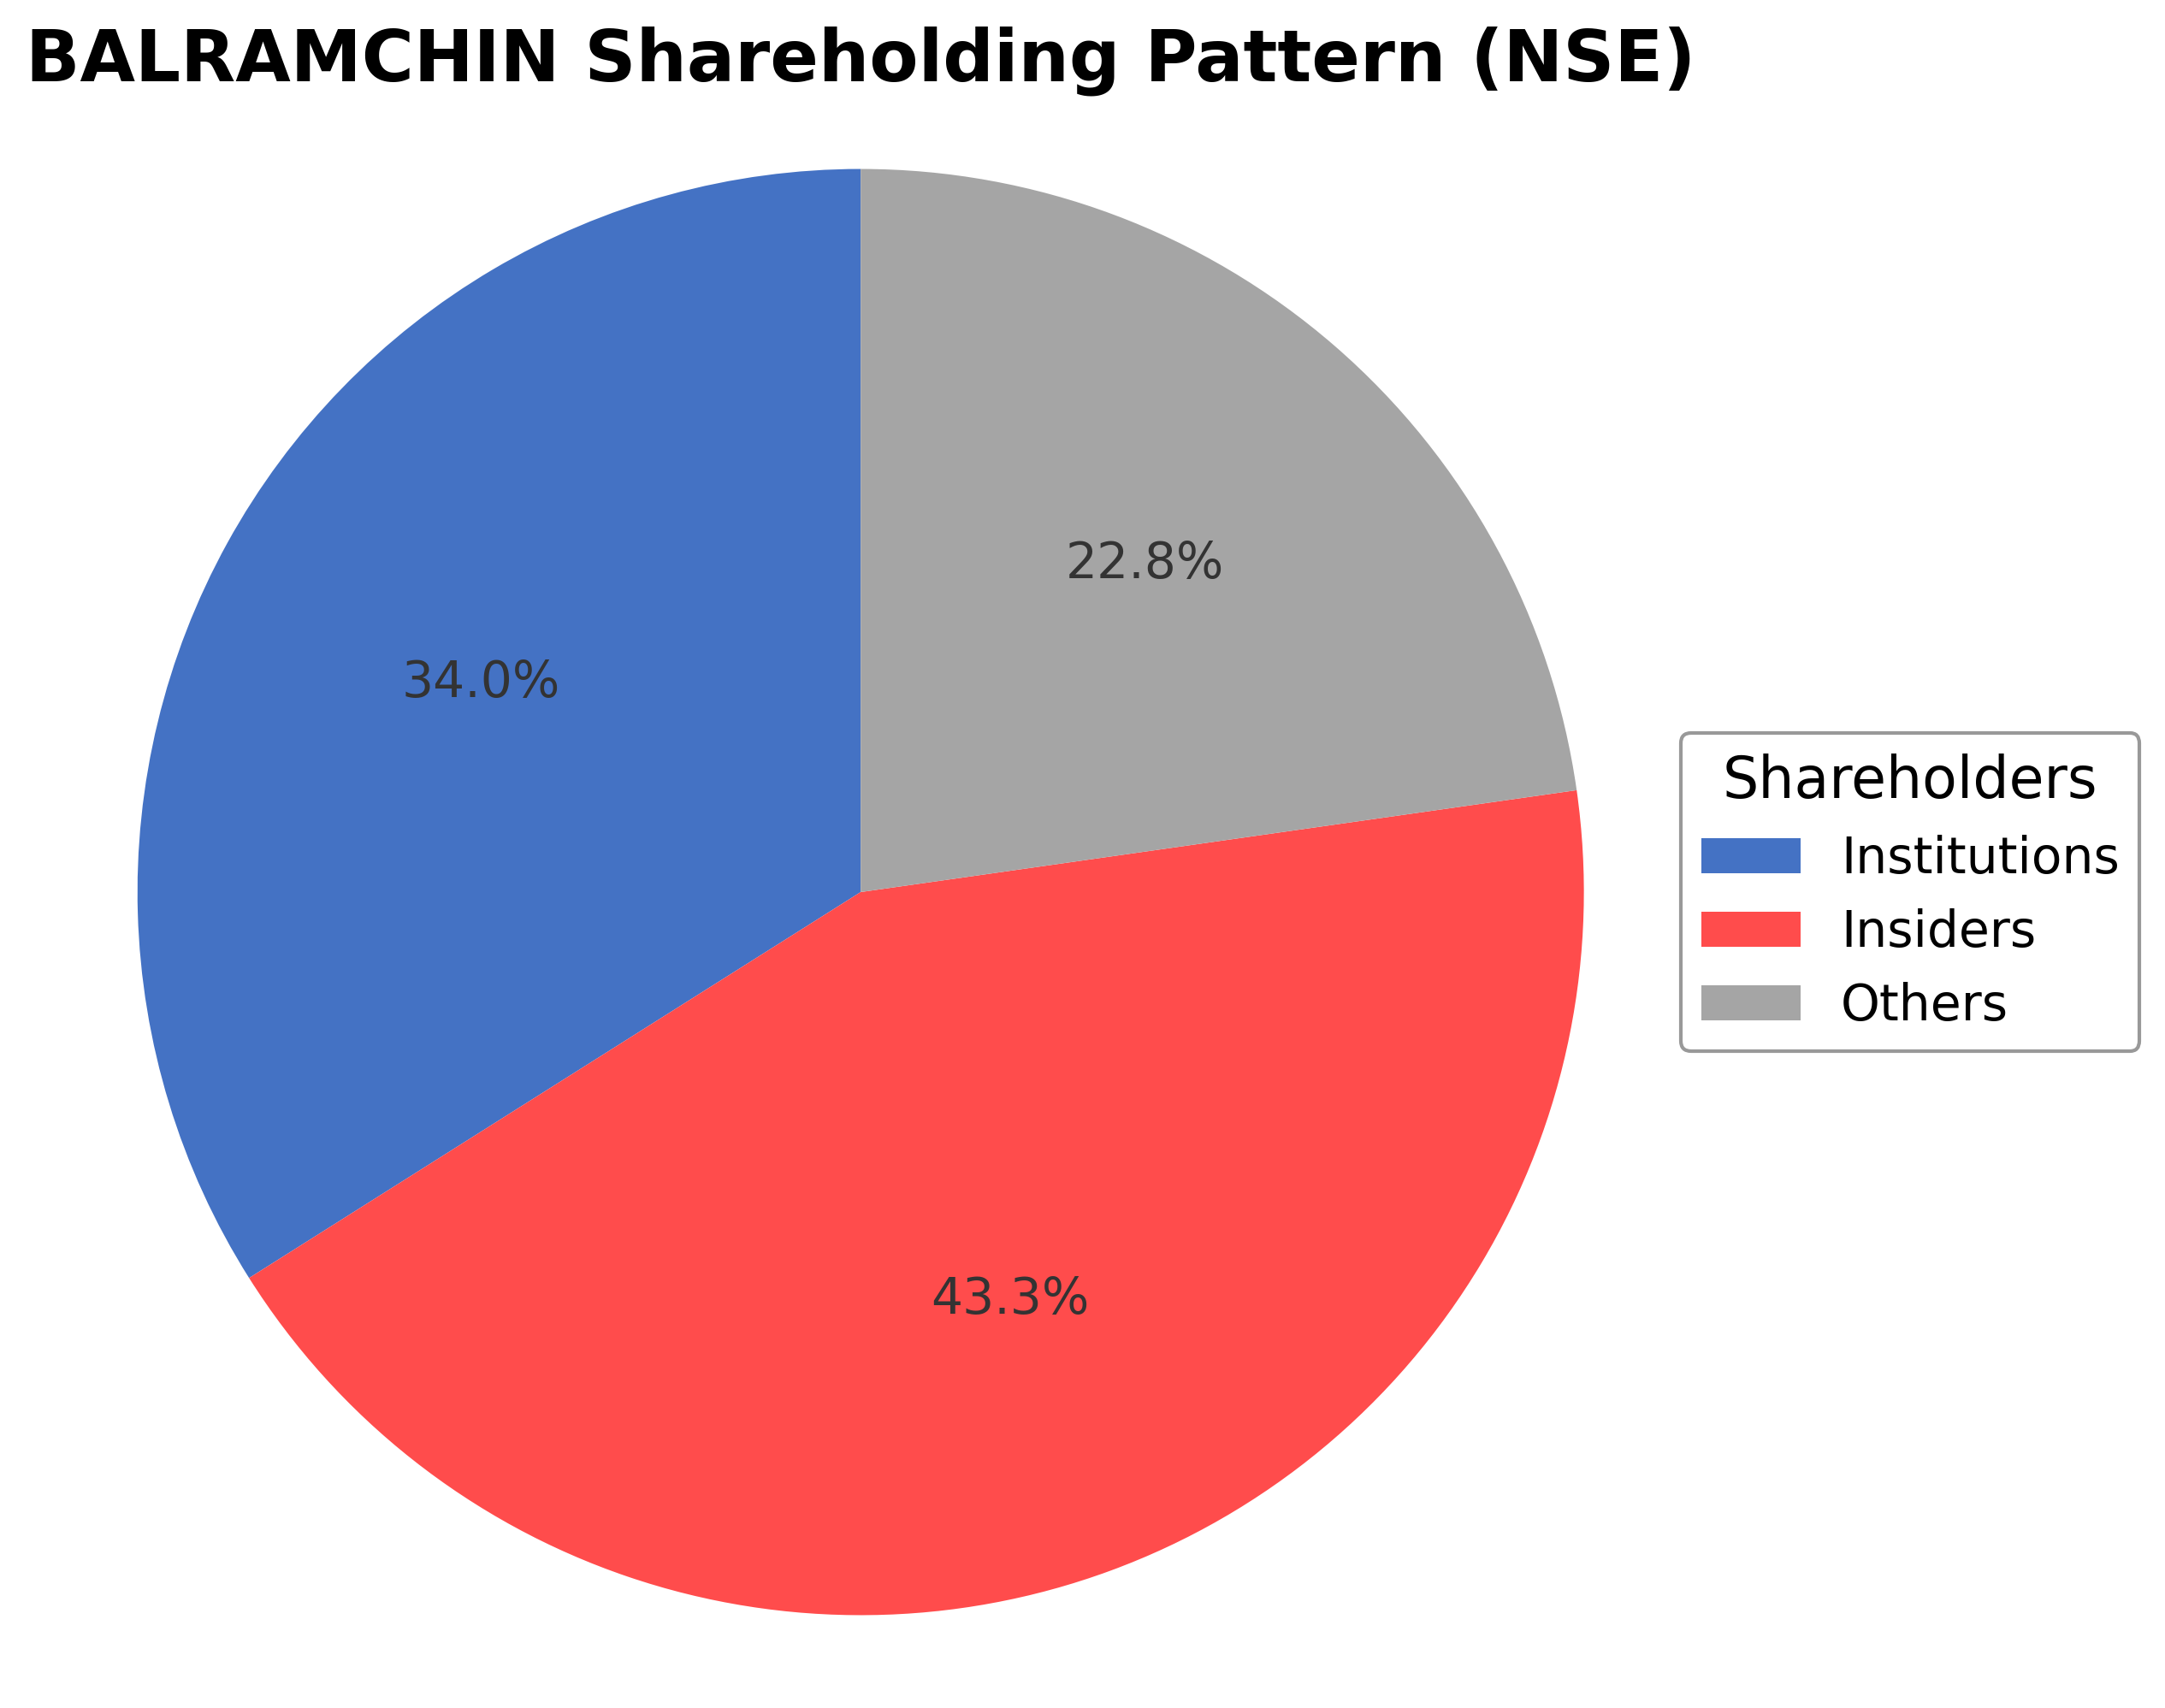
Balrampur Chini Mills Ltd.'s ownership structure comprises approximately 43.29% insiders including executives and board members, 33.96% held by institutional investors such as mutual funds and pension funds, and the remaining 22.75% by public shareholders and other retail investors. Over the past 12 to 24 months, institutional holdings have shown moderate accumulation, reflecting steady confidence from major funds. Prominent institutional investors have maintained or slightly increased their stakes, indicating positive sentiment toward the company's governance and strategic direction. This ownership distribution supports balanced corporate oversight and suggests alignment between management and shareholders, potentially facilitating continued strategic initiatives and operational stability within the confectionery and sugar industry.
Sector and Industry Analysis
The sugar sector in India is a significant agro-based industry with a production capacity exceeding 35 million tonnes annually, supported by numerous large-scale sugar mills. The industry has witnessed moderate growth driven by increasing domestic consumption and export opportunities, with key players including Balrampur Chini Mills, Dwarikesh Sugar, and other regional producers. The sector also integrates downstream activities like distilleries and co-generation, enhancing revenue streams beyond sugar production.
Industry trends indicate a shift towards modernization and capacity expansion, particularly in distillery operations to capitalize on ethanol demand for blending with petrol. Companies are investing in new sugarcane varieties to improve crop yields and sugar recovery rates, addressing challenges like crop diseases and climatic variability. Competitive dynamics are influenced by operational efficiencies, access to sugarcane supply, and the ability to diversify product offerings, creating moderate barriers to entry for new players.
The regulatory environment plays a crucial role, with government policies on sugar export quotas, minimum support prices for sugarcane, and ethanol blending mandates shaping industry economics. Recent export restrictions capped at 10 million tonnes aim to balance domestic supply and global commitments without significantly impacting current export volumes. Continued government support for ethanol blending targets is expected to drive distillery growth, while inventory management policies influence market stability and pricing.
Note: Analysis synthesized from industry research, market reports, and regulatory filings. Information is subject to change based on market conditions.
Financial Ratios Dashboard
Illustrative Scenario Analysis
DCF Assumptions:
Method: Two-Stage EPS-Priority Model
Financials
Peer Analysis
| Company Name | Market Cap | P/E Ratio | P/B Ratio | EV/EBITDA | Price to CFO |
|---|---|---|---|---|---|
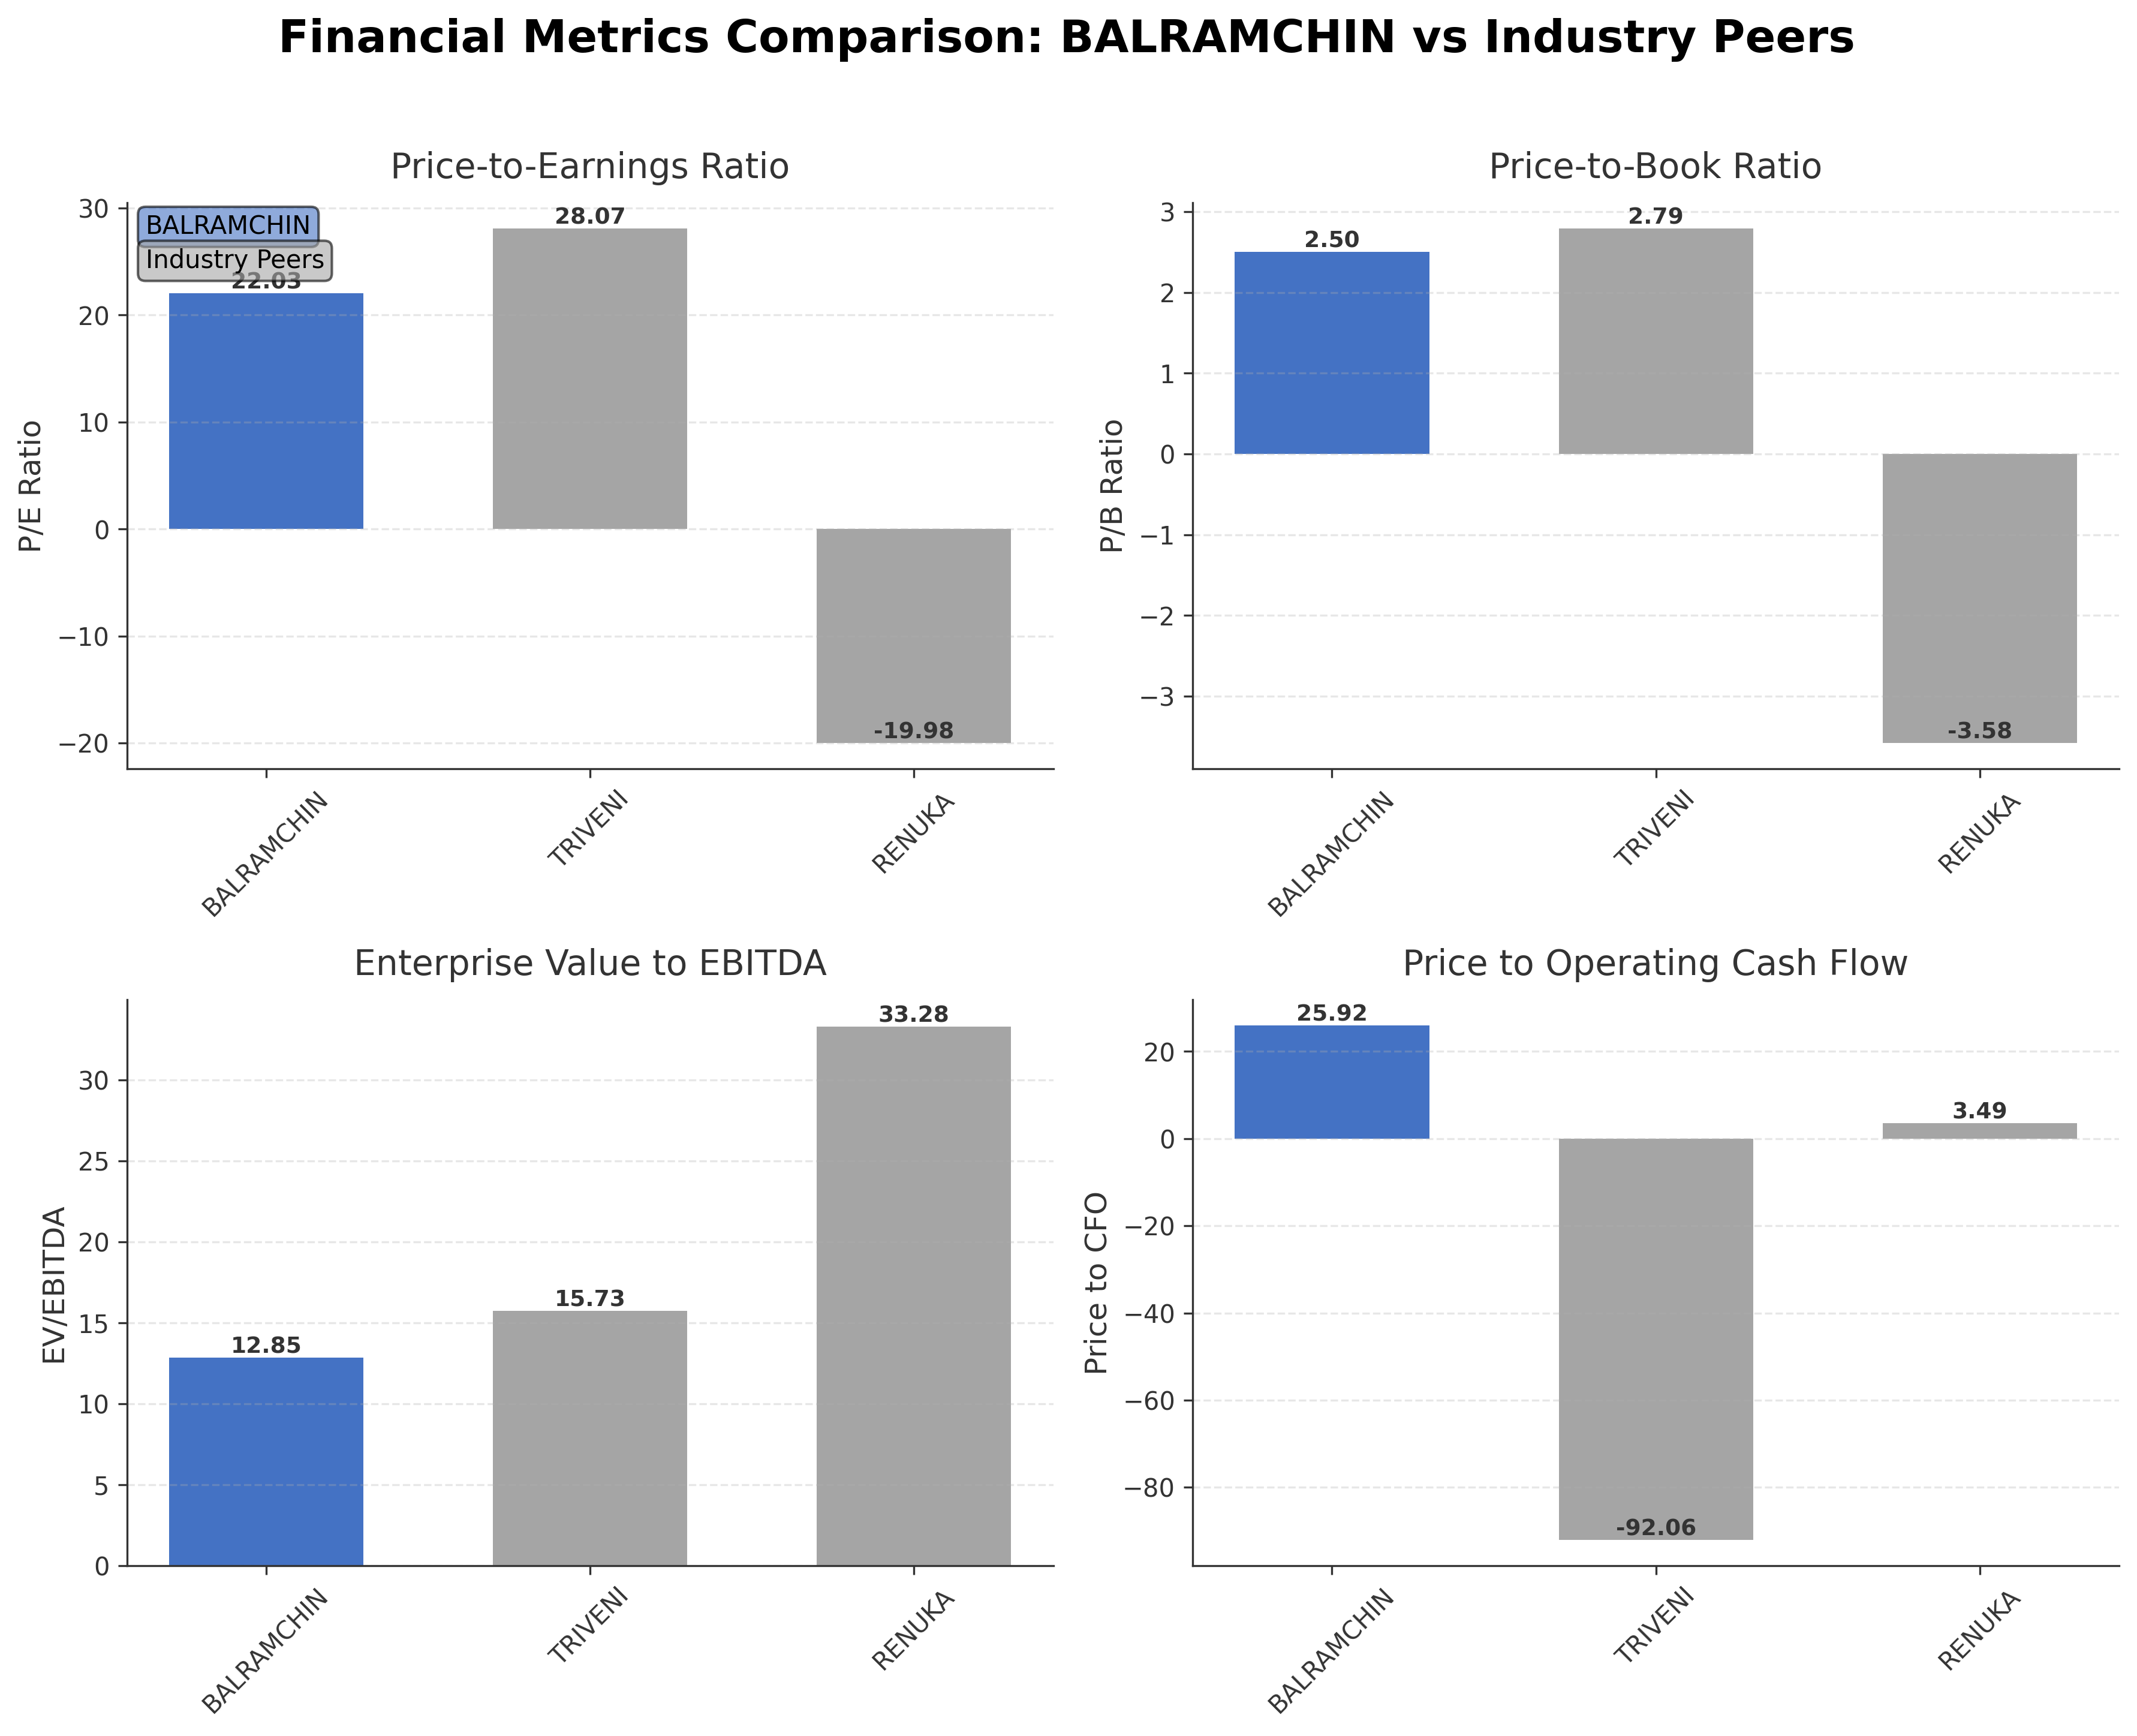
| Balrampur Chini Mills Ltd. | ₹98.15B | 22.03 | 2.50 | 12.85 | 25.92 |
| Triveni Engineering & Industries Ltd. | ₹86.06B | 28.07 | 2.79 | 15.73 | -92.06 |
| Shree Renuka Sugars Ltd. | ₹59.96B | -19.98 | -3.58 | 33.28 | 3.49 |
Comparison Analysis: Balrampur Chini Mills Ltd. compares favorably with its regional peers by maintaining a moderate P/E ratio of 22.03, which is lower than Triveni Engineering's 28.07 but positive relative to Shree Renuka Sugars' negative P/E. Its price-to-book ratio of 2.50 is competitive, slightly below Triveni's 2.79, indicating reasonable valuation relative to book value. The EV/EBITDA multiple of 12.85 is also lower than peers, suggesting better operational efficiency or valuation. Return on equity at 11.5% is solid, outperforming Triveni but below Renuka's higher ROE. Price to CFO is notably higher than peers, reflecting stronger cash flow metrics. Overall, Balrampur Chini Mills demonstrates balanced valuation and profitability metrics within the sugar and confectionery sector.
Financial Metrics Comparison with Peers
Financial Statements
Comprehensive financial data including income, balance sheet, and cash flow metrics
Income Statement
| fiscal_date | 2025-03-31 | 2024-03-31 | 2023-03-31 | 2022-03-31 | 2021-03-31 |
|---|---|---|---|---|---|
| Sales | 54.15B | 55.94B | 46.66B | 47.73B | 46.73B |
| Cost Of Goods | 39.12B | 39.80B | 34.62B | 35.69B | 35.65B |
| Gross Profit | 15.04B | 16.14B | 12.04B | 12.04B | 11.07B |
| Operating Expense Selling General And Administrative | 871.55M | 1.34B | 908.38M | 1.23B | 1.22B |
| Operating Expense Other Operating Expenses | 2.95B | 2.89B | 2.23B | 1.36B | 1.26B |
| Operating Income | 5.55B | 6.22B | 3.94B | 5.94B | 6.02B |
| Non Operating Interest Income | 1.98M | 21.36M | 8.35M | 3.84M | 3.42M |
| Non Operating Interest Expense | 925.11M | 832.94M | 484.43M | 301.69M | 389.00M |
| Pretax Income | 5.62B | 7.42B | 4.08B | 5.99B | 6.09B |
| Income Tax | 1.25B | 2.08B | 1.24B | 1.34B | 1.29B |
| Net Income | 4.37B | 5.34B | 2.84B | 4.65B | 4.80B |
| Eps Basic | 21.65 | 26.49 | 13.94 | 22.44 | 22.48 |
| Eps Diluted | 21.57 | 26.49 | 13.94 | 22.44 | 22.48 |
| Basic Shares Outstanding | 201.81M | 201.75M | 203.89M | 207.02M | 213.45M |
| Diluted Shares Outstanding | 201.81M | 201.75M | 203.89M | 207.02M | 213.45M |
| Ebit | 6.55B | 8.26B | 4.57B | 6.29B | 6.48B |
| Ebitda | 7.67B | 8.45B | 5.78B | 7.36B | 7.45B |
| Net Income Continuous Operations | 5.27B | 7.16B | 3.97B | 5.88B | 5.90B |
| Preferred Stock Dividends | 0.00 | 0.00 | 0.00 | 0.00 | 0.00 |
| Minority Interests | N/A | N/A | N/A | N/A | N/A |
Source: Financial statements and regulatory filings
Balance Sheet
| fiscal_date | 2025-03-31 | 2024-03-31 | 2023-03-31 | 2022-03-31 | 2021-03-31 |
|---|---|---|---|---|---|
| Cash And Cash Equivalents | 3.57M | 3.19M | 3.10M | 3.22M | 4.47M |
| Accounts Receivable | 1.43B | 1.26B | 1.25B | 1.37B | 2.45B |
| Total Assets | 71.29B | 60.86B | 54.29B | 44.92B | 46.34B |
| Total Liabilities | 33.33B | 26.85B | 25.33B | 17.22B | 20.15B |
| Long Term Debt | 4.90B | 3.27B | 4.30B | 1.45B | 2.43B |
| Shareholders Equity | 37.96B | 34.01B | 28.96B | 27.70B | 26.19B |
Source: Financial statements and regulatory filings
Cash Flow Statement
| fiscal_date | 2025-03-31 | 2024-03-31 | 2023-03-31 | 2022-03-31 | 2021-03-31 |
|---|---|---|---|---|---|
| Operating Activities Net Income | 5.27B | 7.16B | 3.97B | 5.88B | 5.90B |
| Operating Activities Stock Based Compensation | 160.51M | 239.60M | 0.00 | N/A | N/A |
| Operating Activities Other Non Cash Items | 925.81M | 818.10M | 460.59M | 282.76M | 363.27M |
| Operating Activities Accounts Receivable | -173.93M | -7.45M | 119.01M | 1.09B | -61.75M |
| Operating Activities Other Assets Liabilities | -2.40B | -5.60B | -1.03B | 2.82B | 603.84M |
| Operating Activities Operating Cash Flow | 3.79B | 2.62B | 3.52B | 10.08B | 6.80B |
| Investing Activities Capital Expenditures | -8.80B | -2.21B | -8.44B | -3.96B | -977.65M |
| Investing Activities Net Acquisitions | 0.00 | -60.02M | -174.96M | 723.69M | 101.95M |
| Investing Activities Purchase Of Investments | -7.46M | -9.47M | -22.39M | -9.08M | -9.71M |
| Investing Activities Sale Of Investments | 4.18M | 27.58M | 37.31M | 3.21M | 69.95M |
| Investing Activities Investing Cash Flow | -8.81B | -2.25B | -8.60B | -3.25B | -815.47M |
| Financing Activities Long Term Debt Issuance | 3.95B | 300.00M | 4.66B | 0.00 | N/A |
| Financing Activities Long Term Debt Payments | -2.75B | -1.86B | -1.06B | -1.06B | -833.65M |
| Financing Activities Short Term Debt Issuance | 5.01B | 2.83B | 3.04B | 684.91M | -1.67B |
| Financing Activities Common Stock Issuance | 153.00K | N/A | N/A | N/A | N/A |
| Financing Activities Common Stock Repurchase | -15.00K | 0.00 | -818.51M | -2.15B | -1.80B |
| Financing Activities Common Dividends | -605.71M | -605.25M | -508.44M | -510.10M | -525.00M |
| Financing Activities Financing Cash Flow | 5.60B | 1.31B | 4.47B | -3.53B | -5.26B |
| End Cash Position | 3.57M | 3.19M | 3.10M | 3.22M | 4.47M |
| Free Cash Flow | -4.67B | -909.40M | -4.03B | 2.91B | 5.48B |
| Financing Activities Other Financing Charges | N/A | 641.15M | -842.73M | -498.68M | -432.19M |
Source: Financial statements and regulatory filings
Technical Analysis
Key Insights
- The current trend shows a mildly bearish momentum with the stock price trading below both the 50-day (₹478.82) and 200-day (₹485.66) moving averages, indicating potential downward pressure.
- Key support levels are near the 52-week low of ₹393.55, while resistance is observed around the 52-week high of ₹627.80 and the 200-day moving average at approximately ₹485.66.
- The stock is positioned below its major moving averages (10-day, 50-day, 200-day), suggesting a consolidation phase or potential correction.
- Momentum indicators show mixed signals: RSI indicates neutral to slightly oversold conditions, MACD has recently shifted to a mildly bearish stance, and Stochastic oscillators reflect sideways momentum.
- Multi-timeframe analysis reveals that daily charts show consolidation, weekly charts indicate mild bearishness, and monthly charts suggest longer-term sideways trading.
- Potential market scenarios include continued sideways movement with possible retests of support levels or a gradual recovery if momentum indicators improve.
Trending News
1. Headline: Balrampur Chini Mills Ltd is Rated Sell
Summary: Balrampur Chini Mills Ltd is rated Sell by MarketsMojo. This rating was last updated on 01 April 2026, reflecting a shift from the previous Hold rating. However, all fundamentals, returns, and financial metrics discussed here are current as of 13 April 2026, providing investors with the latest insight into the stock...
Sentiment: neutral
2. Headline: Balrampur Chini Mills Declines 1.55%: Mixed Signals Shape Weekly Performance
Summary: On 30 March 2026, Balrampur Chini Mills Ltd was upgraded by MarketsMOJO from a 'Sell' to a 'Hold' rating, signalling cautious optimism. This upgrade was driven by a stabilisation in technical momentum, with the stock’s weekly MACD turning mildly bullish and On-Balance Volume indicating ...
Sentiment: positive
3. Headline: Balrampur Chini Mills Downgraded to Sell Amid Mixed Financial and Technical Signals
Summary: Long-term returns have been impressive, ... Over five years, the stock gained 131.24%, compared to the Sensex’s 46.18%. However, recent underperformance relative to the market and peers has tempered enthusiasm. Holding Balrampur Chini Mills Ltd from Sugar?...
Sentiment: positive
Summary: Balrampur Chini Mills Ltd is one of the largest integrated sugar manufacturer in India.Their business portfolio consist of manufacturing and marketing of sugar, ethyl alcohol, ethanol, generation & selling of power & also manufacturing & marketing of organic manure..The company also in the ...
Sentiment: neutral
5. Headline: Balrampur Chini Mills Ltd Upgraded to Hold on Technical and Financial Improvements
Summary: However, the bullish On-Balance ... Dow Theory’s mixed signals reinforce the sideways trend, implying that the stock may consolidate before a decisive move. Considering Balrampur Chini Mills Ltd?...
Sentiment: positive
Recent Updates
News Summary
As of March 24, 2026. Balrampur Chini Mills Ltd has opened a special one-year window from February 5, 2026, to February 4, 2027, for re-lodgement of physical share transfer requests, complying with SEBI regulations to facilitate dematerialization of securities sold or purchased before April 1, 2019. This initiative aims to ensure rightful access to securities for investors and improve regulatory compliance. Additionally, the company is making significant investments in green growth, planning to scale up its polylactic acid (PLA) bioplastics project in Uttar Pradesh with an additional ₹2,000 to ₹4,000 crore investment, building on an initial ₹2,850 crore outlay. The PLA plant will produce 100% bio-based, compostable plastics derived from sugarcane, creating around 250 direct jobs and over 2,000 indirect jobs, contributing to local economic development and sustainability. These developments highlight the company's strategic focus on regulatory adherence and innovation in sustainable product lines.
News Sentiment
The overall sentiment from recent updates is cautiously positive, driven by the company's proactive regulatory compliance measures and ambitious expansion into bioplastics, which signals a commitment to sustainable growth. The special window for physical share transfer re-lodgement reflects responsiveness to investor needs and regulatory frameworks, while the substantial investment in the PLA project underscores strategic diversification and potential for long-term value creation. Although the news does not directly address near-term financial performance, these initiatives contribute to a constructive outlook on operational and strategic fronts.
Source List
- https://scanx.trade/stock-market-news/companies/balrampur-chini-mills-opens-special-window-for-physical-share-transfer-re-lodgement/36259334
- https://government.economictimes.indiatimes.com/news/economy/we-plan-to-invest-up-to-4000-crore-more-to-scale-our-pla-project-avantika-saraogi-ed-balrampur-chini-mills/129778237
Analytical Overview
Analysis Summary
Balrampur Chini Mills Ltd's valuation metrics, including a trailing P/E of 22.03 and forward P/E of 19.26, are aligned with the confectionery industry average P/E of 22.03, suggesting the stock is fairly valued relative to peers. The company's revenue growth of 22% quarterly and positive cash flow trends, with operating cash flow of ₹3.79 billion and free cash flow of ₹4.37 billion, indicate a robust growth trajectory supported by operational efficiency. Financial health appears stable with a manageable debt-to-equity ratio of 0.20 and a strong current ratio of 2.65, reflecting good liquidity and limited leverage. Sector-specific opportunities include expansion into bioplastics and sustainable energy, while challenges remain in regulatory compliance and commodity price volatility. Considering India's regulatory environment and growing consumer demand for sustainable products, the company is well-positioned to leverage market trends and policy support.
Overall Business and Market Assessment
Supporting Factors: No data
Risk Factors: regulatory uncertainties in the sugar sector and sensitivity to raw material price fluctuations
SWOT Analysis
Strengths
- Strong revenue growth of 22% quarterly indicating robust demand.
- Healthy profitability with a net profit margin of 7.3% and ROE of 11.5%.
- Solid liquidity position with a current ratio of 2.65 and manageable debt levels.
- Strategic investment in bioplastics demonstrating innovation and diversification.
Weaknesses
- Relatively high price-to-cash-flow ratio of 25.92 compared to peers.
- Stock price trading below major moving averages indicating technical weakness.
- Dependence on volatile commodity prices impacting margins.
- Limited dividend yield of 0.72% may be less attractive to income-focused investors.
Opportunities
- Expansion of India’s first PLA bioplastics plant with significant capital investment.
- Growing demand for sustainable and bio-based products in domestic and global markets.
- Potential to leverage government incentives for agro-based and green energy projects.
- Increasing institutional investor interest supporting capital availability.
Threats
- Regulatory risks related to sugar pricing and export policies.
- Competitive pressures from other sugar manufacturers and alternative sweeteners.
- Macroeconomic factors such as inflation and currency fluctuations affecting costs.
- Potential delays or cost overruns in large-scale capital projects.
Company Description
Balrampur Chini Mills Ltd. is a leading sugar manufacturing company in India, primarily engaged in the production of sugar and its allied products. As a key player in the agro-based industry, the company plays a crucial role in the Indian agriculture sector, sourcing sugarcane directly from farmers to produce high-grade sugar. Beyond sugar production, Balrampur Chini Mills diversifies into the manufacture of ethanol and cogeneration of power, utilizing by-products efficiently, which represents a significant advancement towards sustainable practices. The company’s operations are integral to supply chains, impacting food and beverage manufacturers, energy producers, and agricultural commerce. Known for its large-scale operations and advanced production facilities, Balrampur Chini Mills Ltd. significantly contributes to India's economy and supports the rural workforce. Its market significance is highlighted by its focus on innovation and expansion, making it a stalwart in the sugar sector.