


Bajaj Hindusthan Sugar Ltd (BAJAJHIND)
Stock Analysis Report
Stock Journey
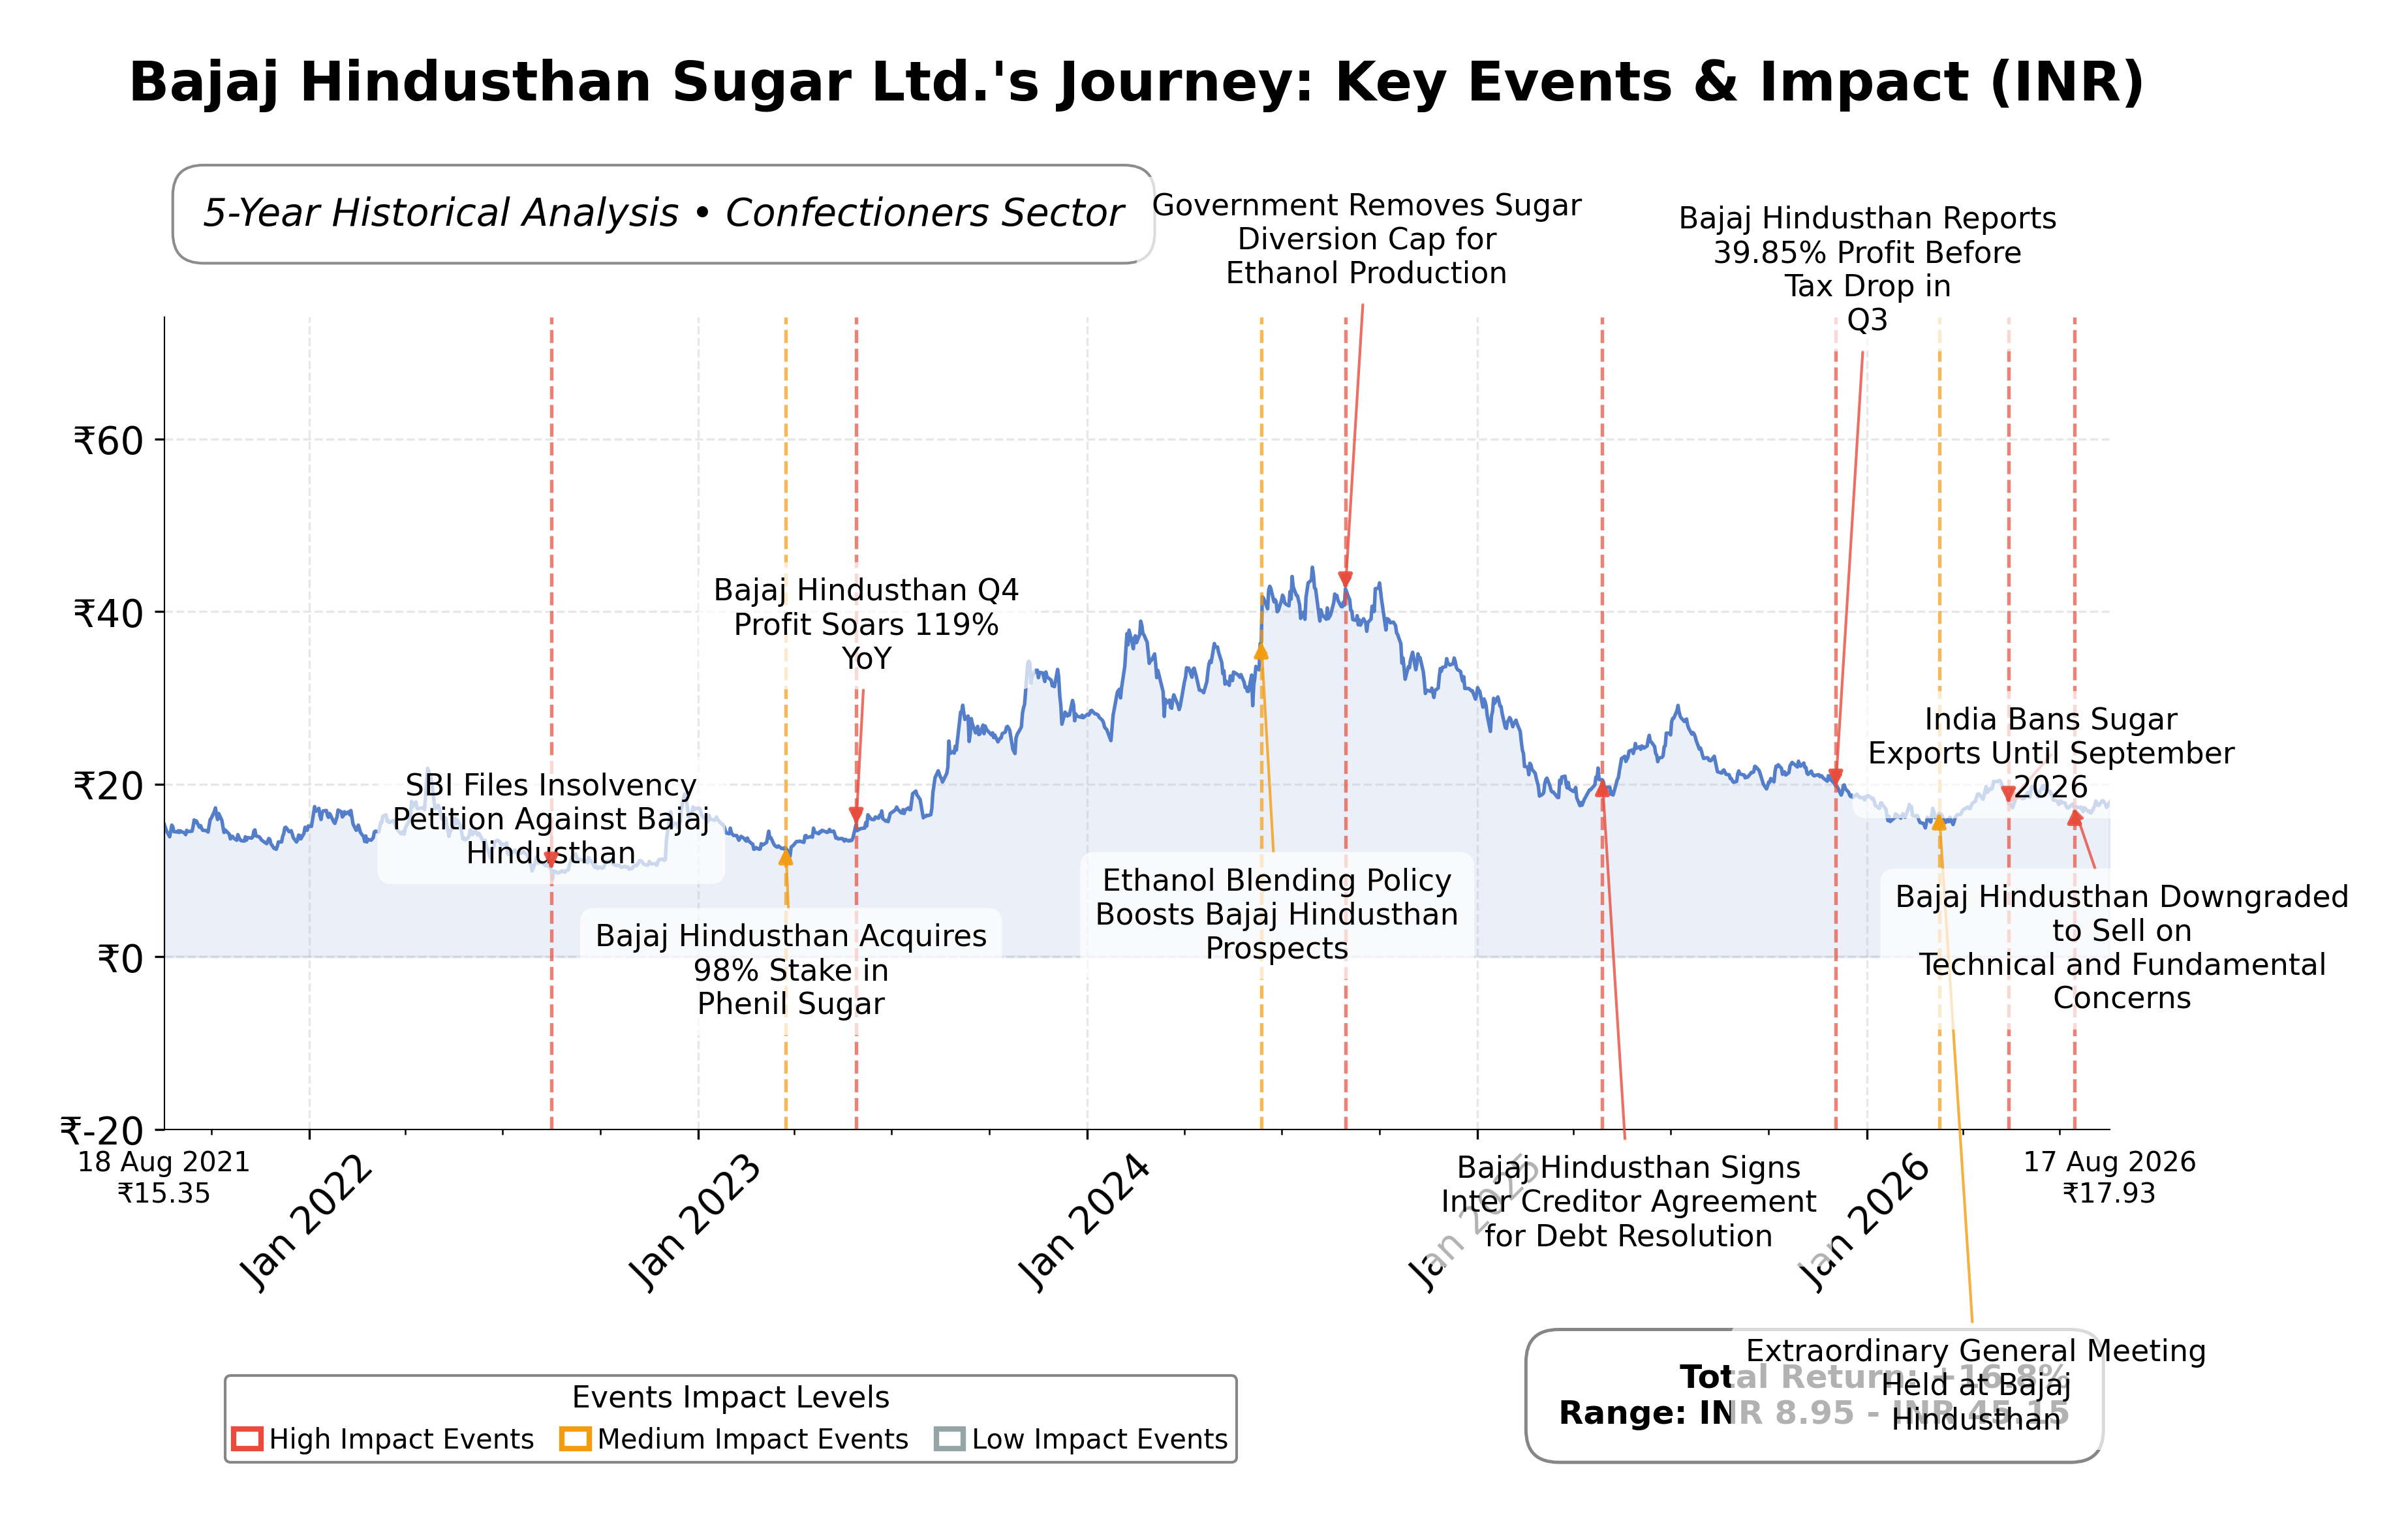
Key Positives and Key Risks
Pros
- Market capitalization of ₹42.28 billion reflects established industry presence and scale.
- Trailing P/E ratio of 20.21 aligns with industry average, indicating valuation parity.
- Positive operating cash flow of INR 2.30 billion supports liquidity despite operational losses.
Cons
- Negative operating margin of -15.39% signals operational inefficiencies impacting profitability.
- High debt-to-equity ratio of 92.99% raises concerns about financial leverage and risk.
- Recent quarterly net loss of Rs 184.70 crore highlights ongoing earnings pressure.
Disclosure: This information is for general awareness and does not constitute investment advice
Report Summary
Bajaj Hindusthan Sugar Ltd. operates primarily in the sugar manufacturing and ethanol production sectors within the Indian consumer defensive industry. Listed on the NSE under the symbol BAJAJHIND, the company is one of India's largest integrated sugar producers, with significant operations in sugarcane processing, ethanol manufacturing, and renewable energy generation through by-products like bagasse. Its strategic positioning in both agriculture and energy sectors underscores its role in supporting rural economies and aligning with national sustainability goals.
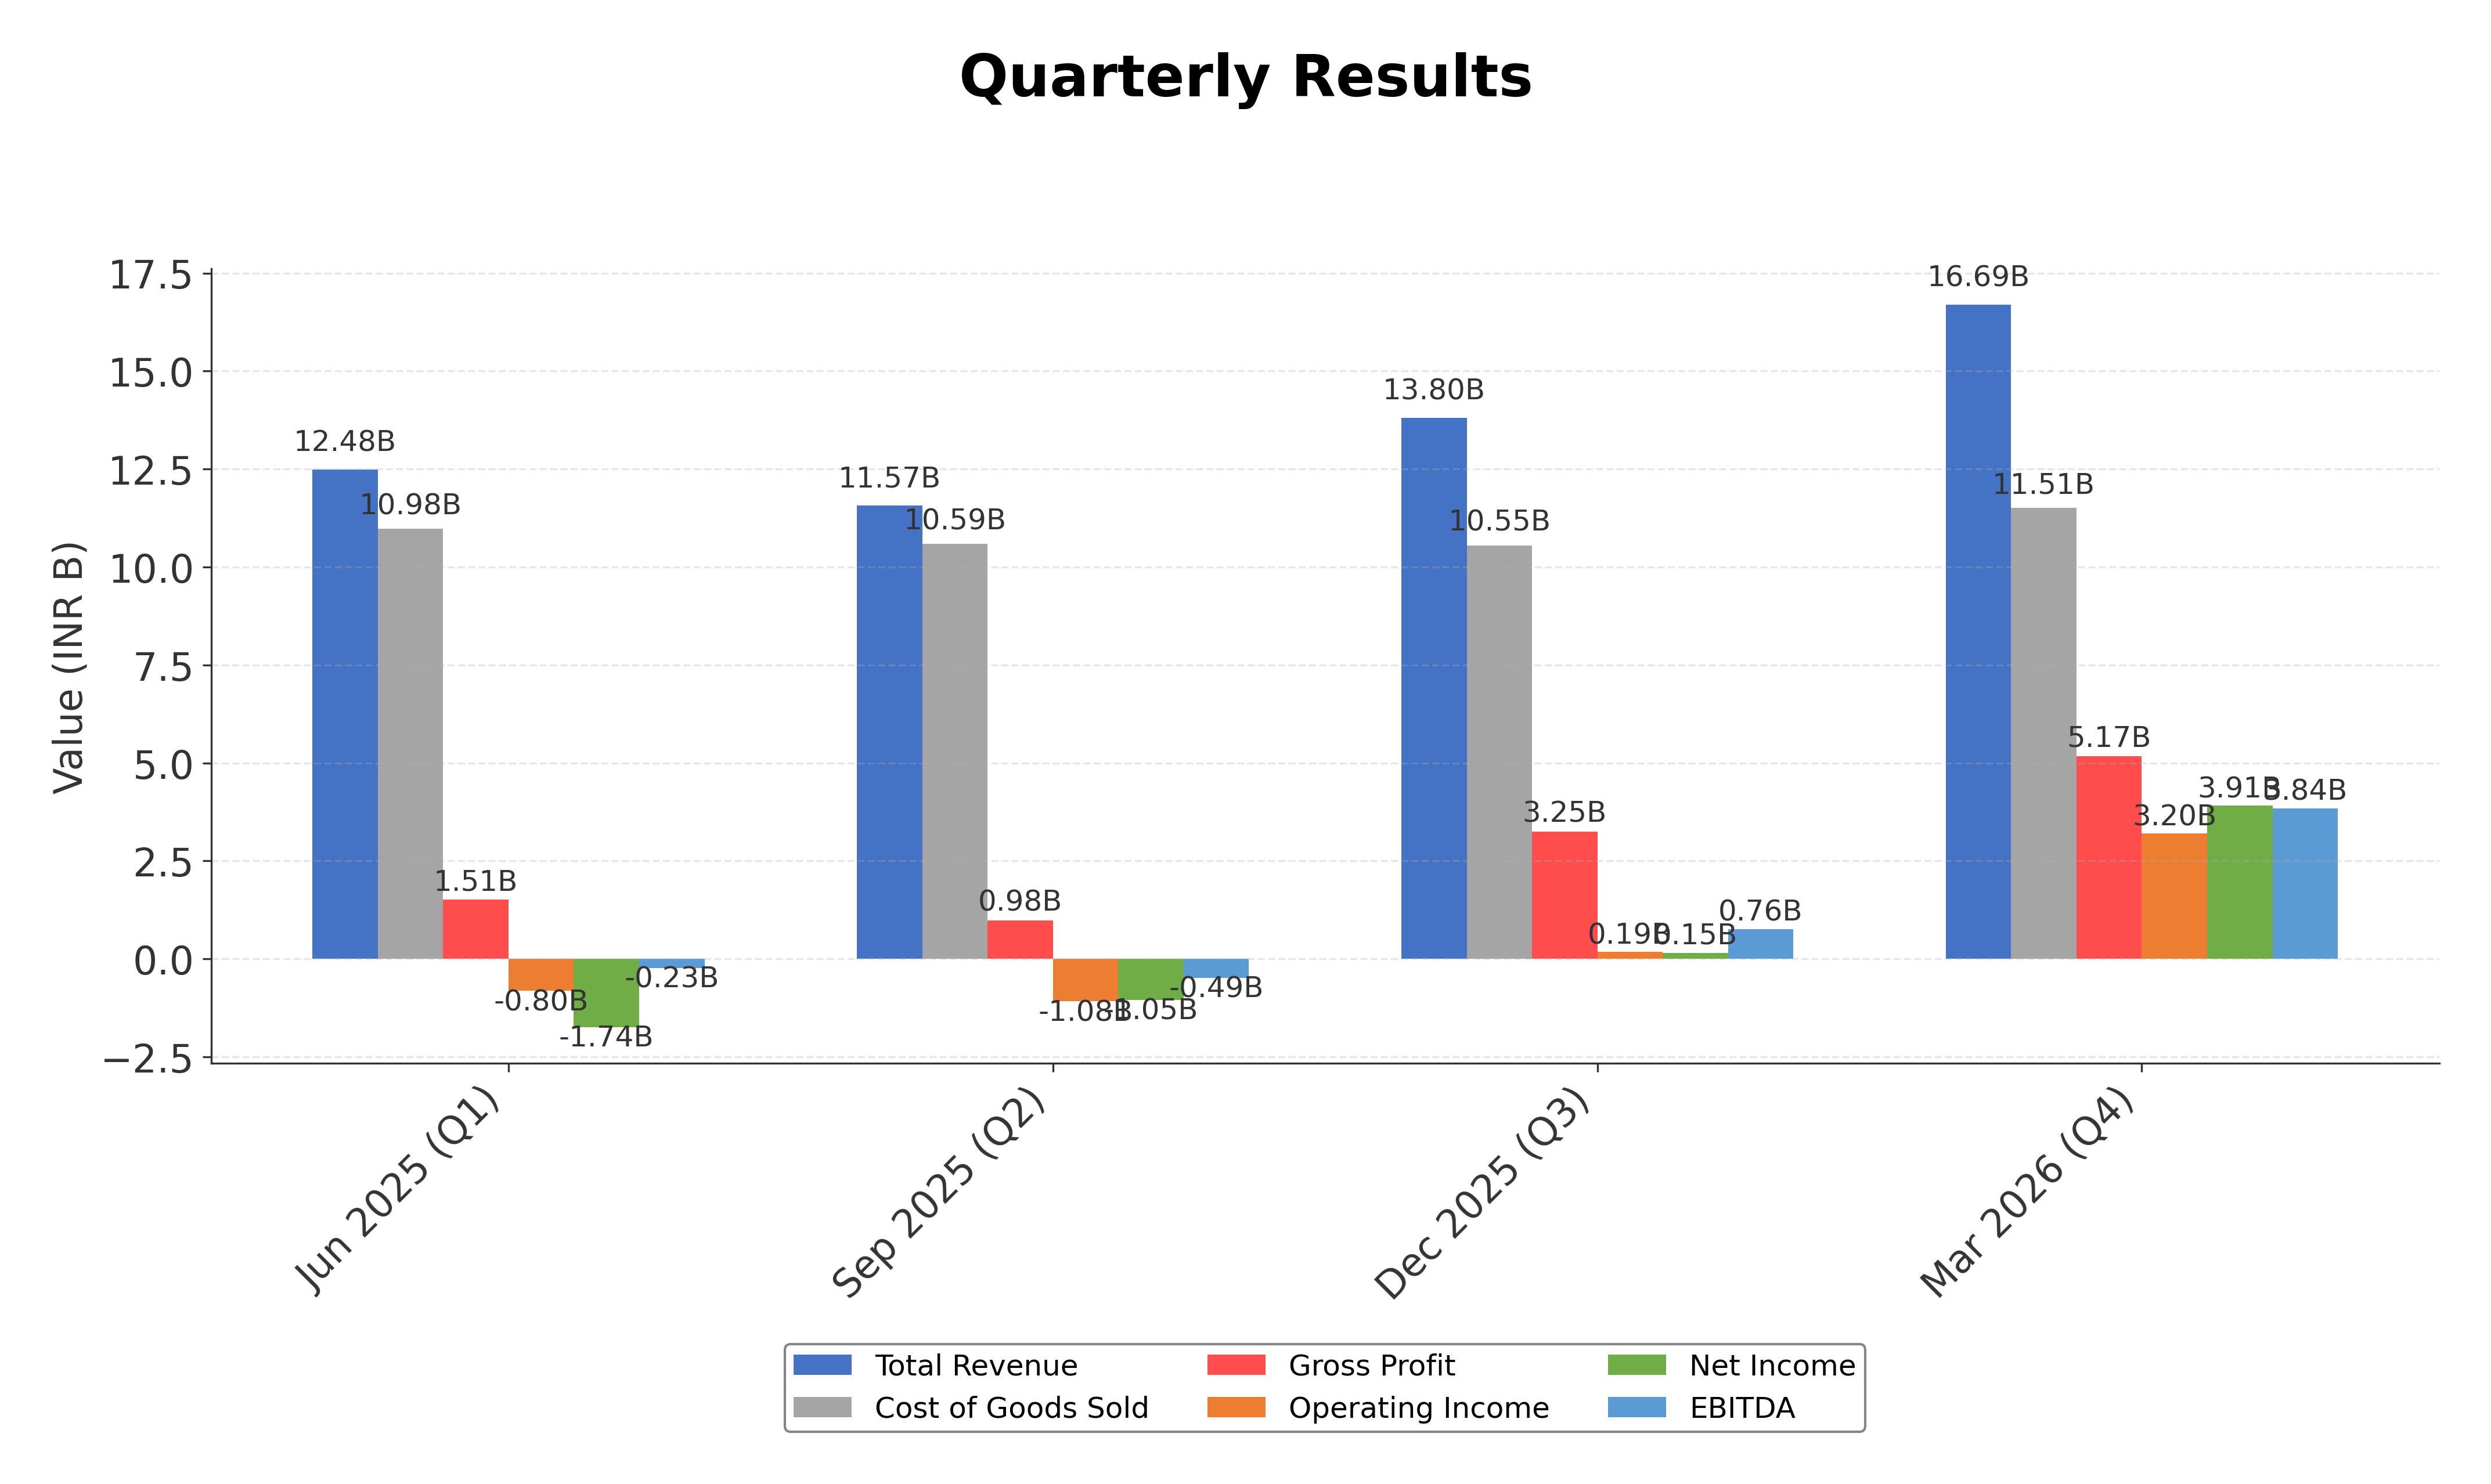
Financially, the company reported trailing twelve months (TTM) revenue of approximately INR 53.31 billion with a gross margin of 31.01%, indicating moderate profitability at the production level. However, operating margins are negative at -15.39%, and net profit margin stands low at 2.17%, reflecting operational challenges. Return on equity (ROE) and return on assets (ROA) are modest at 3.32% and 0.89% respectively, suggesting limited efficiency in generating returns from equity and assets. The company’s operating cash flow over the last twelve months was INR 2.30 billion, with free cash flow at INR 1.27 billion, indicating positive but constrained cash generation.
Valuation metrics reveal a trailing P/E ratio of 20.21, aligning closely with the industry average, while the price-to-book ratio is elevated at 4.12, suggesting the stock may be priced at a premium relative to its book value. The enterprise value to EBITDA ratio is high at 20.48, indicating a relatively expensive valuation compared to earnings before interest, taxes, depreciation, and amortization. The market capitalization stands at approximately INR 42.28 billion, with the stock trading near INR 17.93, within a 52-week range of INR 14.85 to INR 23.30, reflecting a 14.88% decline over the past year.
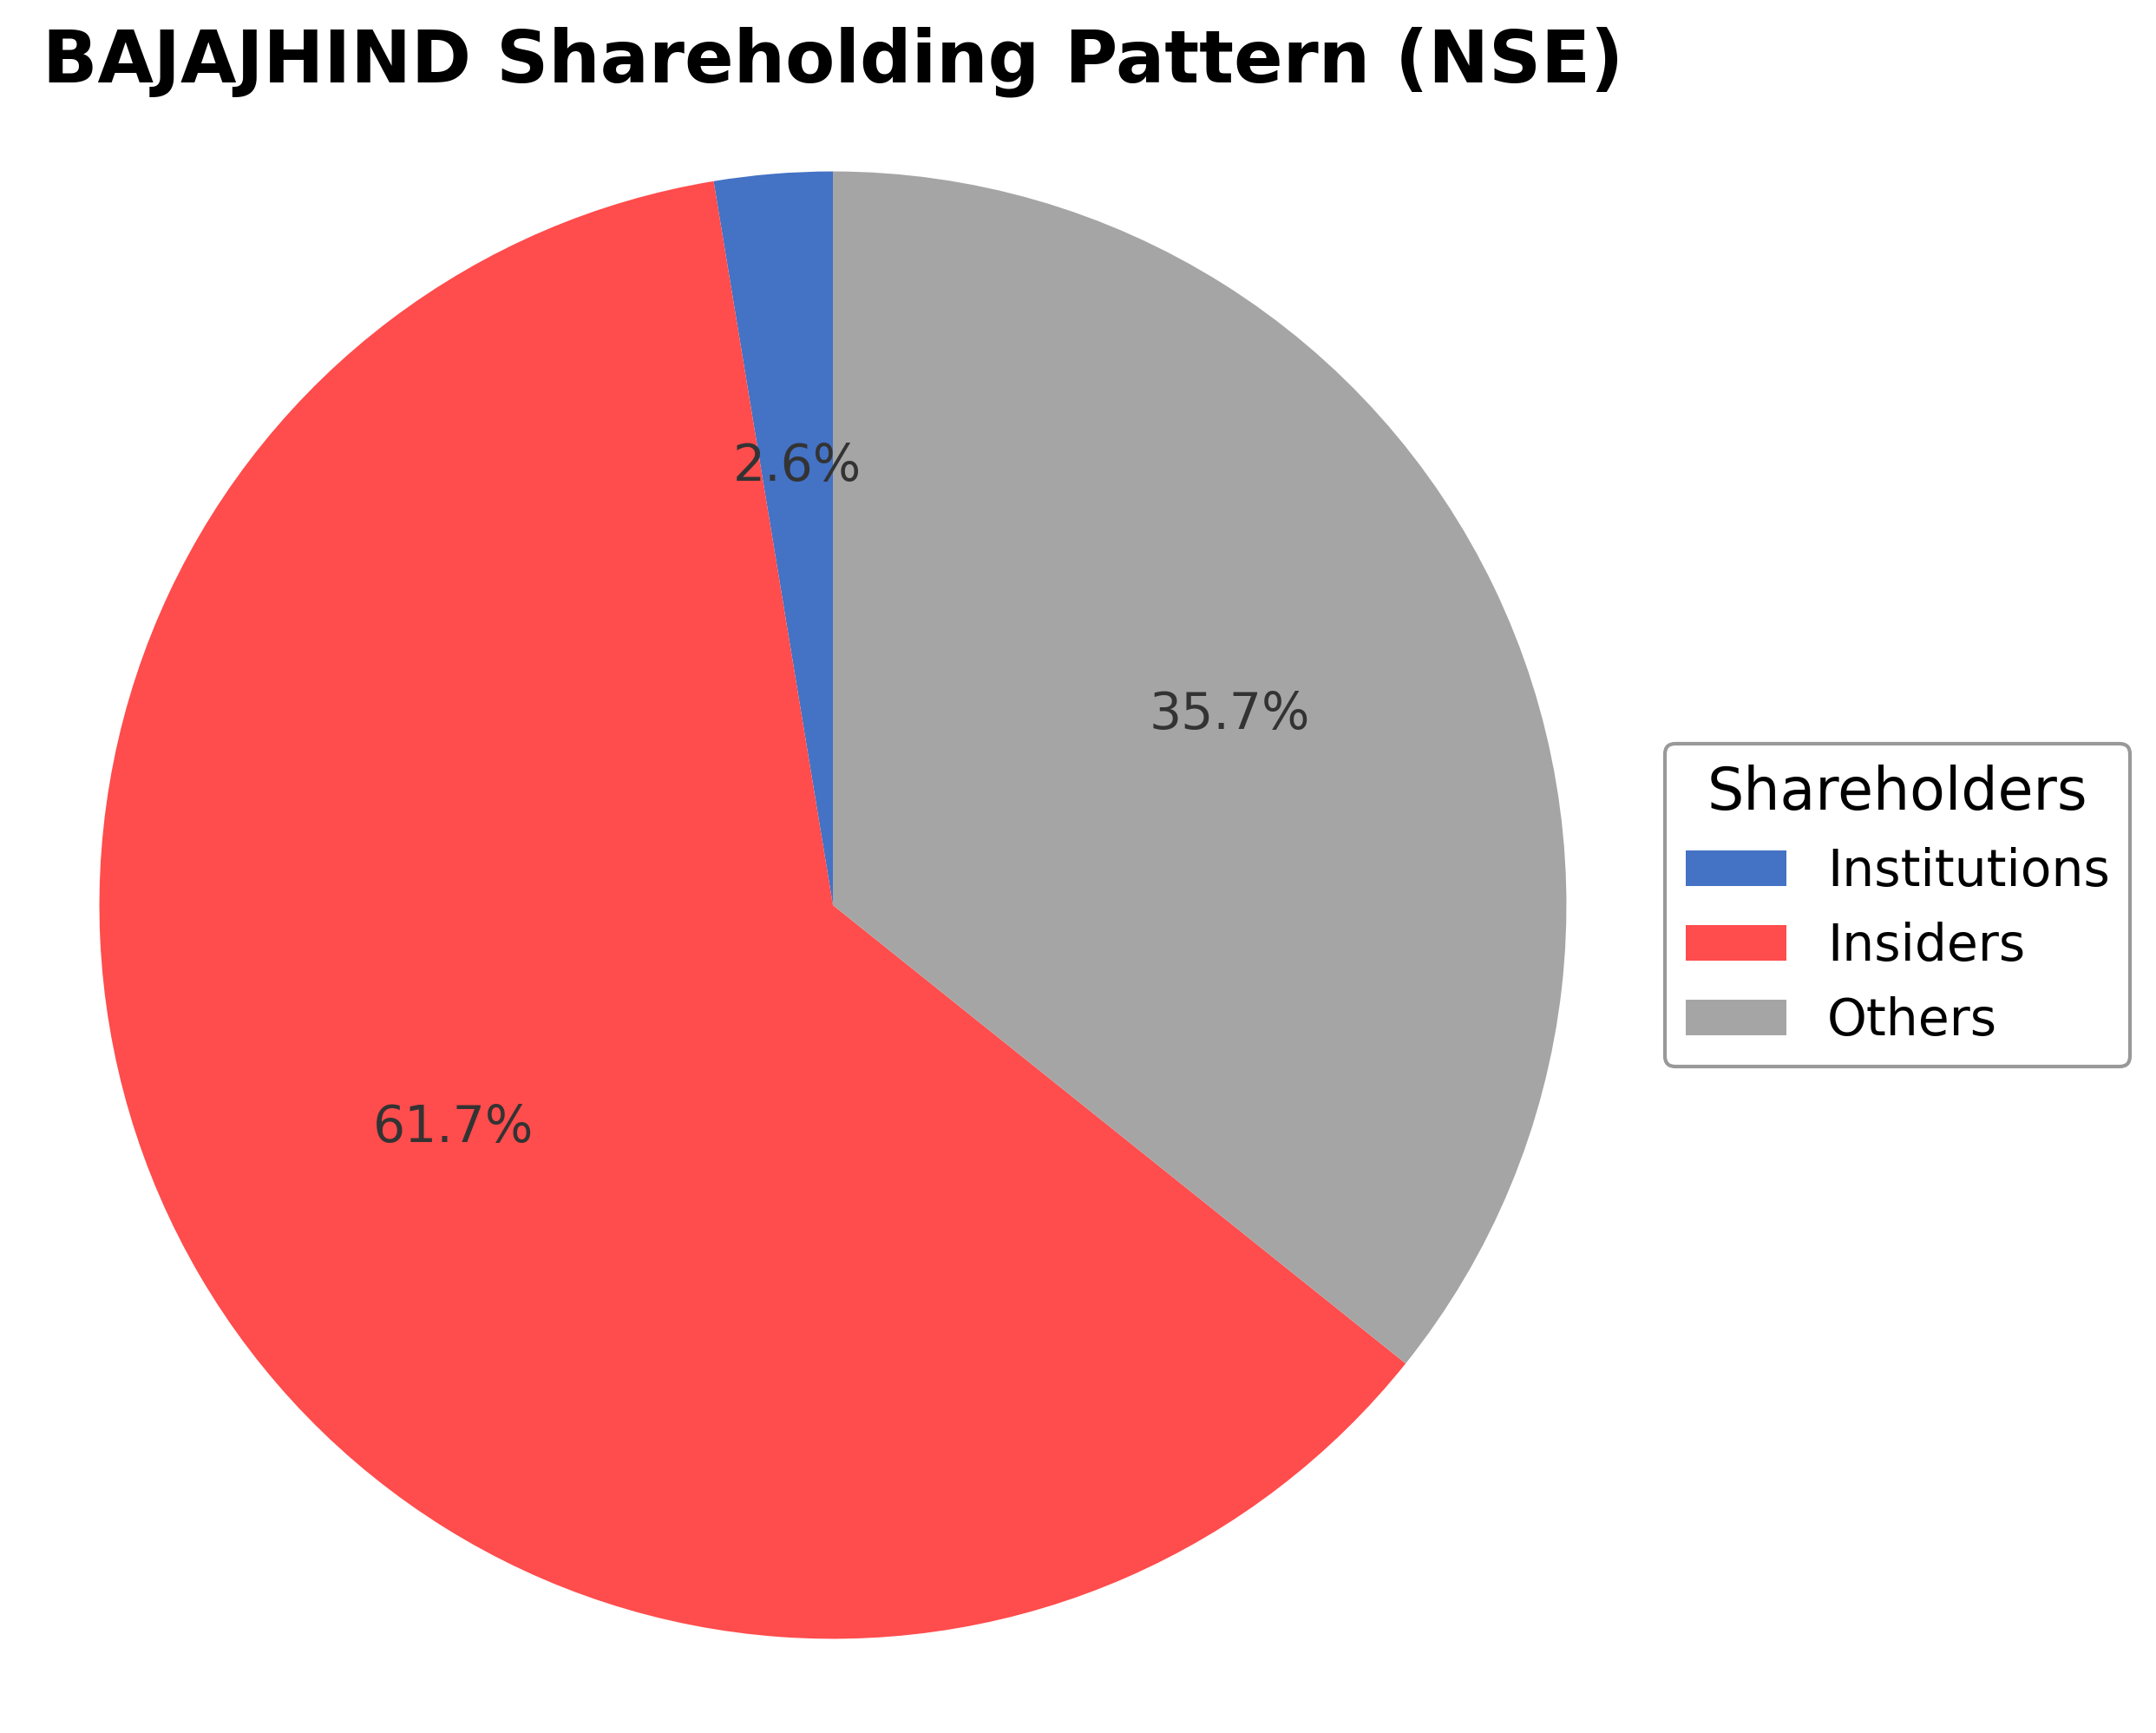
Strengths include the company’s integrated operations in sugar and ethanol production, contributing to steady cash flows and a significant market presence in India’s sugar sector. However, key risks involve regulatory pressures, seasonal fluctuations impacting sugarcane crushing, and inventory adjustments that have recently widened losses. Recent strategic developments include managing off-season destocking and inventory write-downs, which have materially affected quarterly profitability. Institutional ownership remains low at approximately 2.6%, while insiders hold about 0.62%, indicating a concentrated ownership structure.
Technically, the stock is trading slightly above its 50-day and 200-day moving averages, with momentum indicators showing mixed signals across timeframes. Recent news highlights a widening net loss in the latest quarter due to operational and inventory challenges. Overall, the data suggests a cautious stance with attention to operational recovery and market conditions, reflecting a nuanced environment for stakeholders to monitor ongoing developments.
Company and Industry Overview
Company Basics
Price Performance
Company Size
Shareholding Pattern
Sector and Industry Analysis
The sugar sector in India is a significant contributor to the agro-based industry, with a market size driven by both domestic consumption and export demand. The sector has experienced moderate growth, supported by increasing demand for sugar, ethanol, and co-generated power. Key players include Bajaj Hindusthan Sugar Ltd, Balrampur Chini Mills Ltd, and Dhampur Sugar Mills Ltd, which operate integrated facilities encompassing sugar production, ethanol distillation, and power generation.
Industry trends reflect a diversification towards ethanol production and renewable energy generation from by-products like bagasse, enhancing revenue streams beyond traditional sugar sales. Competitive dynamics are shaped by fluctuating sugarcane prices, monsoon dependency, and government policies on minimum support prices, creating barriers to entry for new players. Established firms leverage scale, integrated operations, and geographic presence in key sugarcane-growing regions such as Uttar Pradesh to maintain market positioning.
The regulatory environment is characterized by government interventions including sugarcane pricing, export quotas, and ethanol blending mandates aimed at stabilizing the sector and promoting biofuel usage. Recent policies encouraging ethanol blending have increased demand for industrial alcohol, benefiting integrated sugar companies. However, regulatory uncertainties and price controls continue to impact profitability and investment decisions within the sector.
Note: Analysis synthesized from industry research, market reports, and regulatory filings. Information is subject to change based on market conditions.
Financial Ratios Dashboard
Illustrative Scenario Analysis
DCF Assumptions:
Method: Two-Stage EPS-Priority Model
Financials
Peer Analysis
| Company Name | Market Cap | P/E Ratio | P/B Ratio | EV/EBITDA | Price to CFO |
|---|---|---|---|---|---|
| Bajaj Hindusthan Sugar Ltd. | ₹42.28B | 20.21 | 4.12 | 20.48 | 18.41 |
| Shree Renuka Sugars Ltd. | ₹47.32B | -5.99 | -1.79 | 50.57 | -38.85 |
| Triveni Engineering & Industries Ltd. | ₹54.80B | 21.46 | 1.64 | 13.82 | 29.16 |
| Balrampur Chini Mills Ltd. | ₹128.90B | 32.79 | 2.98 | 20.90 | 21.50 |
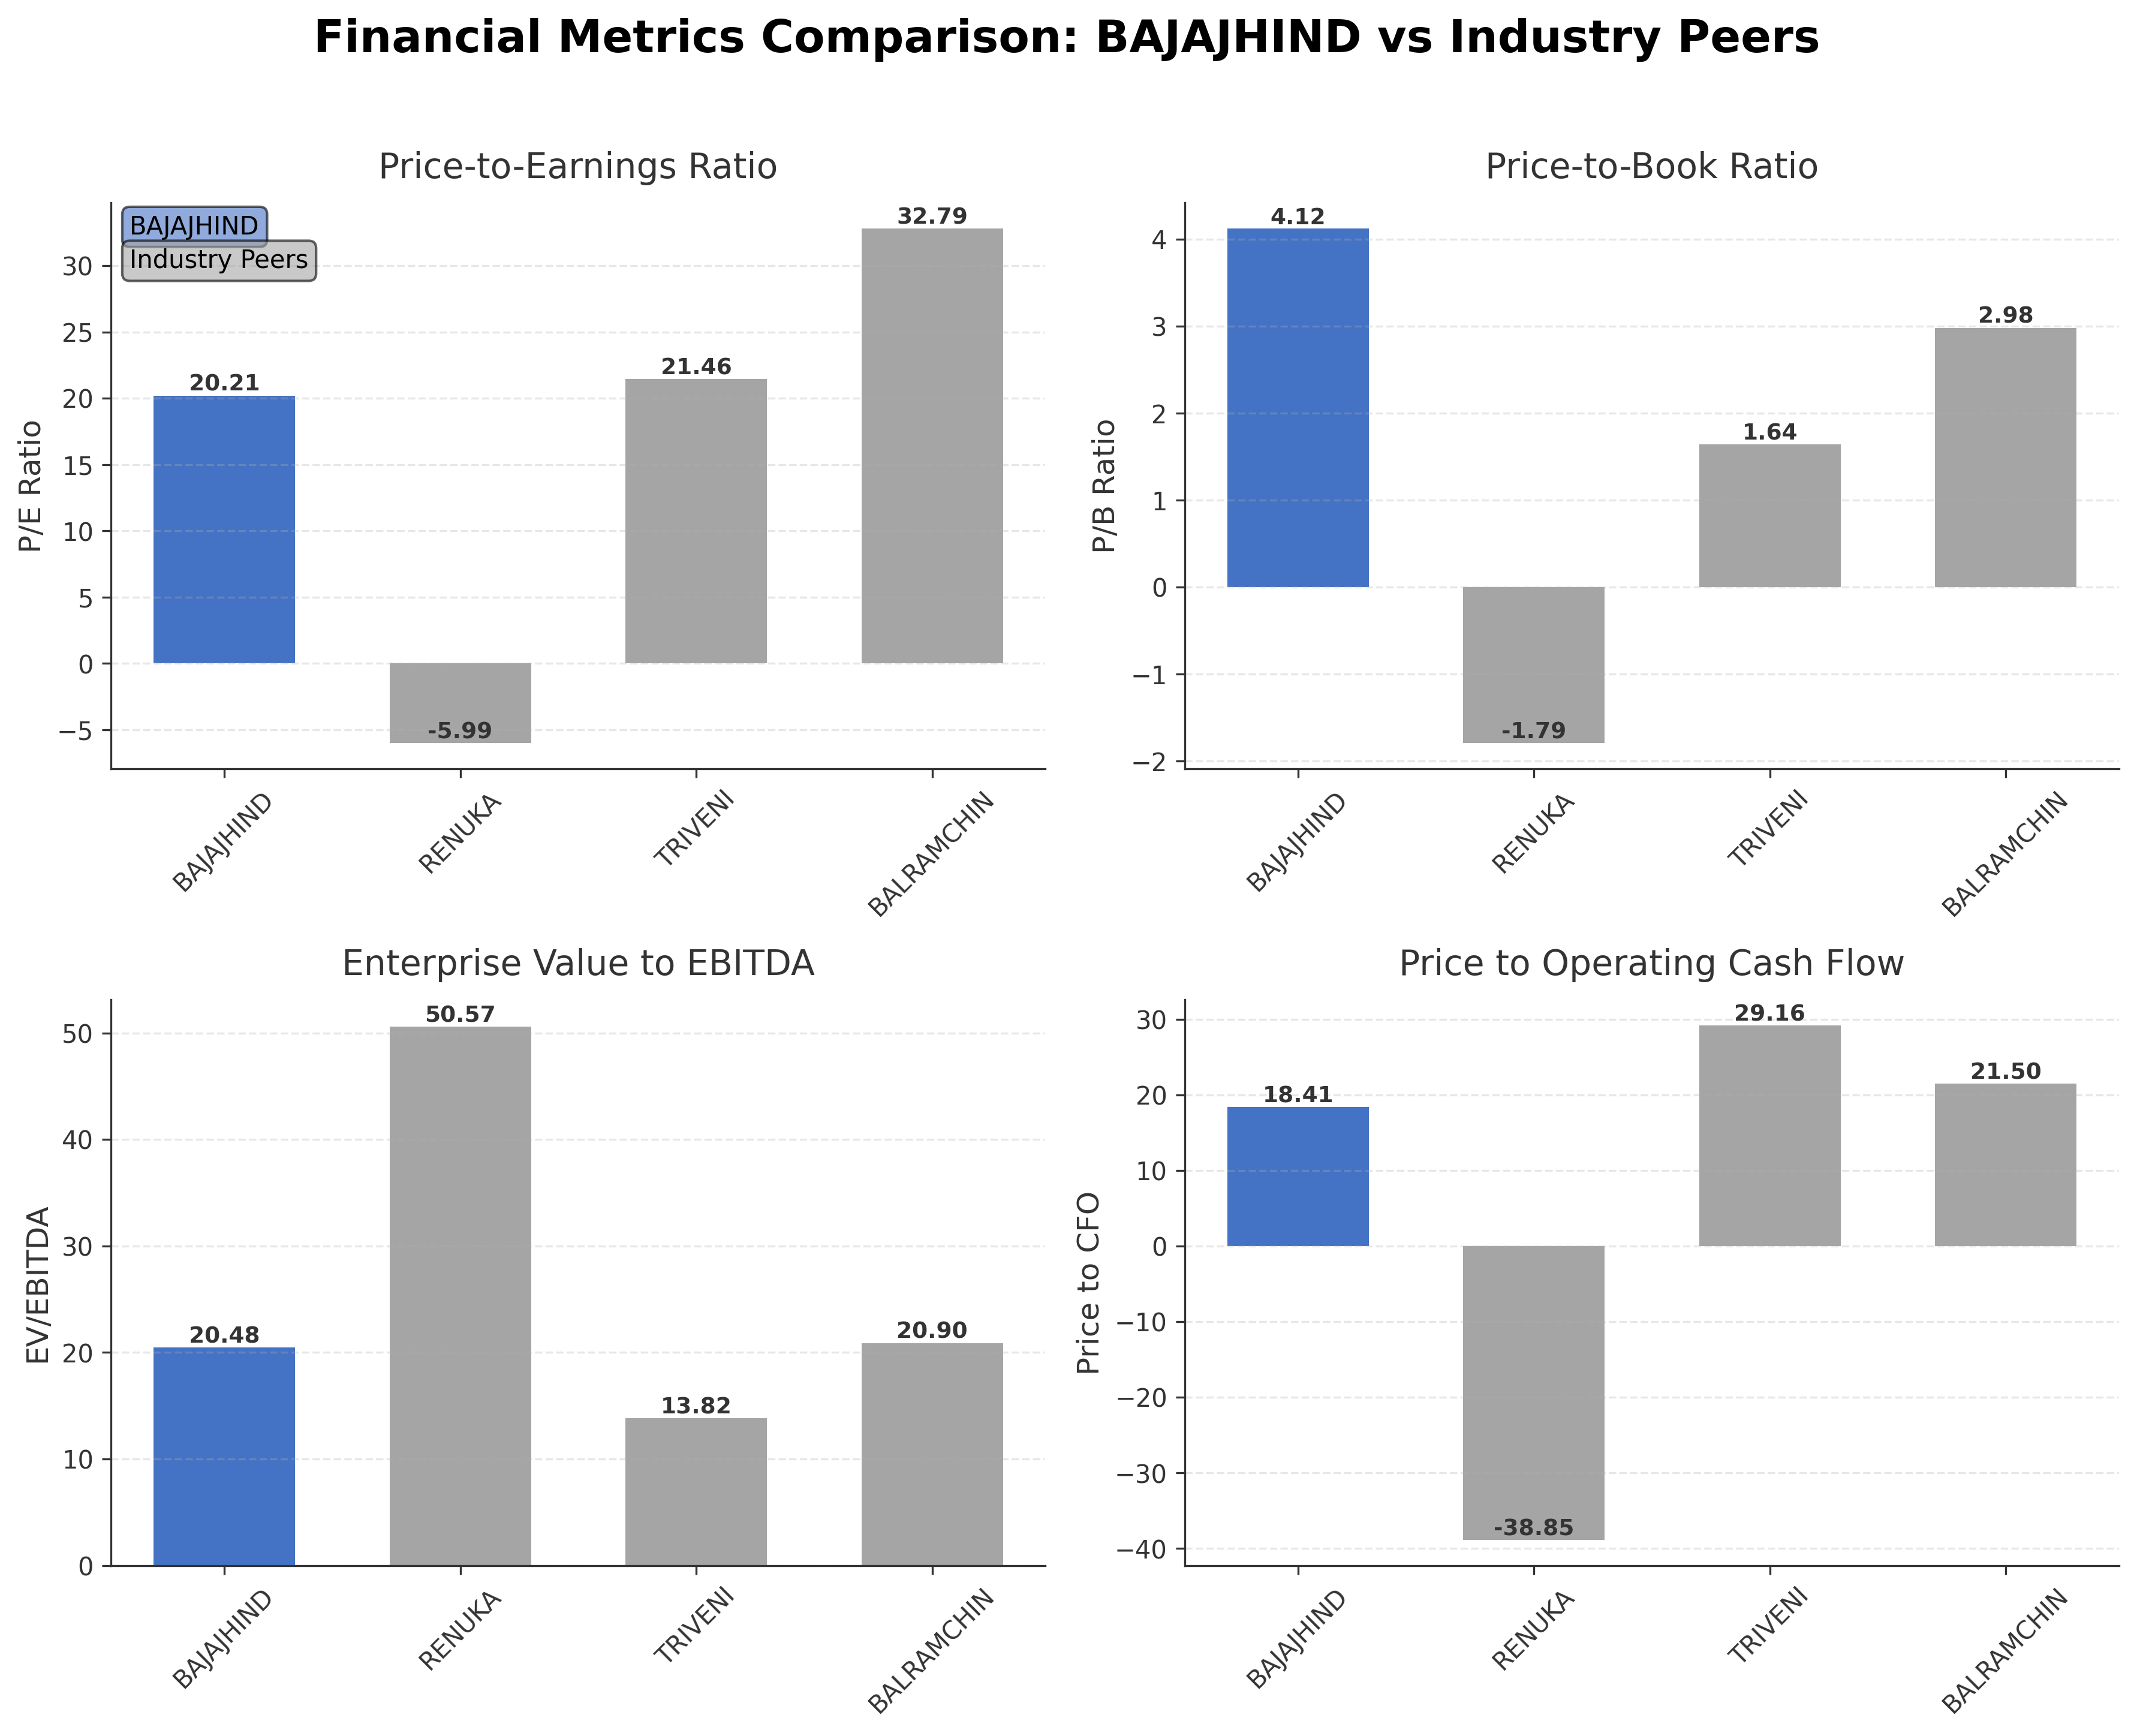
Comparison Analysis: Bajaj Hindusthan Sugar Ltd. exhibits a trailing P/E ratio of 20.21, which is comparable to Triveni Engineering & Industries Ltd. at 21.46 but significantly lower than Balrampur Chini Mills Ltd. at 32.79. Its price-to-book ratio of 4.12 is notably higher than peers such as Triveni (1.64) and Balrampur (2.98), indicating a premium valuation relative to book value. The enterprise value to EBITDA ratio stands at 20.48, aligning closely with Balrampur's 20.90 but exceeding Triveni's 13.82, suggesting a relatively higher valuation on earnings. Return on equity is modest at 3.32%, lagging behind peers like Renuka (29.59%) and Balrampur (9.54%), reflecting comparatively lower profitability. Overall, Bajaj Hindusthan's valuation metrics suggest a premium pricing relative to some peers, while its profitability metrics indicate room for operational improvement.
Financial Metrics Comparison with Peers
Financial Statements
Comprehensive financial data including income, balance sheet, and cash flow metrics
Income Statement
| fiscal_date | 2026-03-31 | 2025-03-31 | 2024-03-31 | 2023-03-31 | 2022-03-31 |
|---|---|---|---|---|---|
| Sales | 53.98B | 55.15B | 60.43B | 61.75B | 55.76B |
| Cost Of Goods | 44.60B | 45.40B | 50.34B | 53.58B | 44.00B |
| Gross Profit | 9.38B | 9.74B | 10.10B | 8.17B | 11.75B |
| Operating Expense Selling General And Administrative | 620.20M | 632.30M | 705.00M | 691.90M | 761.50M |
| Operating Expense Other Operating Expenses | 1.71B | 2.68B | 2.59B | 2.64B | 6.61B |
| Operating Income | 1.53B | 771.50M | 1.08B | 508.40M | -432.50M |
| Non Operating Interest Income | 28.50M | 21.70M | 15.60M | 18.50M | 13.00M |
| Non Operating Interest Expense | 184.50M | 1.03B | 1.62B | 2.10B | 2.54B |
| Pretax Income | 1.25B | -106.70M | -950.50M | -1.38B | -2.72B |
| Income Tax | -9.20M | 47.70M | -81.30M | -34.20M | -39.80M |
| Net Income | 1.26B | -247.80M | -869.20M | -1.35B | -2.68B |
| Ebit | 1.44B | 922.30M | 667.70M | 719.60M | -175.30M |
| Ebitda | 3.75B | 3.10B | 3.72B | 2.85B | 2.03B |
| Net Income Continuous Operations | 1.25B | -200.10M | -950.50M | -1.38B | -2.72B |
| Minority Interests | 4.90M | 12.10M | 5.10M | 100.00K | 0.00 |
| Preferred Stock Dividends | 0.00 | 0.00 | 0.00 | 0.00 | 0.00 |
| Eps Basic | N/A | -0.19 | -0.69 | -1.08 | -2.23 |
| Eps Diluted | N/A | -0.19 | -0.69 | -1.08 | -2.23 |
| Basic Shares Outstanding | N/A | 1.24B | 1.24B | 1.24B | 1.20B |
| Diluted Shares Outstanding | N/A | 1.24B | 1.24B | 1.24B | 1.20B |
Data provided by Twelve Data
Balance Sheet
| fiscal_date | 2026-03-31 | 2025-03-31 | 2024-03-31 | 2023-03-31 | 2022-03-31 |
|---|---|---|---|---|---|
| Cash And Cash Equivalents | 871.30M | 711.80M | 519.70M | 231.70M | 231.70M |
| Accounts Receivable | 986.30M | 1.08B | 1.56B | 1.41B | 1.41B |
| Total Assets | 143.04B | 152.84B | 159.06B | 159.39B | 159.39B |
| Total Liabilities | 104.92B | 110.53B | 114.21B | 115.05B | 115.05B |
| Long Term Debt | 31.56B | 35.48B | 35.41B | 38.51B | 38.40B |
| Shareholders Equity | 38.12B | 42.31B | 44.85B | 44.35B | 44.35B |
Data provided by Twelve Data
Cash Flow Statement
| fiscal_date | 2026-03-31 | 2025-03-31 | 2024-03-31 | 2023-03-31 | 2022-03-31 |
|---|---|---|---|---|---|
| Operating Activities Net Income | 1.25B | -200.10M | -950.50M | -1.38B | -2.72B |
| Operating Activities Other Non Cash Items | 263.50M | 969.20M | 1.54B | 1.97B | 2.42B |
| Operating Activities Accounts Receivable | 61.20M | 339.00M | -166.10M | -232.80M | -109.00M |
| Operating Activities Other Assets Liabilities | 2.55B | 383.70M | -1.08B | 1.38B | -2.04B |
| Operating Activities Operating Cash Flow | 2.30B | 1.49B | -654.60M | 1.74B | -2.45B |
| Investing Activities Capital Expenditures | 16.80M | 102.40M | -83.70M | -60.40M | -63.50M |
| Investing Activities Sale Of Investments | 6.60B | 32.70M | 500.00K | 0.00 | N/A |
| Investing Activities Other Investing Activity | 158.50M | 38.10M | 62.40M | 110.50M | 110.20M |
| Investing Activities Investing Cash Flow | 6.77B | 173.20M | -20.80M | 52.20M | 46.70M |
| Financing Activities Long Term Debt Issuance | 167.00M | N/A | 151.30M | 0.00 | N/A |
| Financing Activities Long Term Debt Payments | -9.28B | -2.73B | -4.75B | -5.44B | -4.71B |
| Financing Activities Short Term Debt Issuance | 3.90B | 0.00 | 31.70M | 19.90M | 42.40M |
| Financing Activities Common Stock Repurchase | -6.30M | N/A | N/A | N/A | N/A |
| Financing Activities Other Financing Charges | 3.73B | N/A | N/A | N/A | N/A |
| Financing Activities Financing Cash Flow | -1.49B | -2.73B | -4.57B | -5.42B | -4.67B |
| End Cash Position | 871.30M | 711.80M | 519.70M | 231.70M | 517.30M |
| Free Cash Flow | 1.13B | 2.60B | 6.35B | 7.86B | 6.11B |
| Investing Activities Net Acquisitions | N/A | N/A | 0.00 | 2.10M | 0.00 |
| Financing Activities Common Dividends | N/A | N/A | N/A | N/A | N/A |
Data provided by Twelve Data
Technical Analysis
Key Insights
- The current trend shows the stock trading slightly above its 50-day moving average of ₹17.93 and 200-day moving average of ₹17.98, indicating a tentative upward momentum.
- Key support levels are observed near the 52-week low of ₹14.85, while resistance is noted around the 52-week high of ₹23.30.
- The stock price is positioned marginally above both the 10-day and longer-term moving averages, suggesting short-term strength but limited conviction.
- Momentum indicators such as RSI and MACD display mixed signals, with RSI near neutral levels and MACD showing no clear crossover, indicating indecisive momentum.
- Analysis across daily, weekly, and monthly timeframes reveals consolidation with no strong breakout, reflecting a cautious market stance.
- Potential scenarios include a continuation of sideways movement within the current range or a gradual recovery if support levels hold and momentum indicators improve.
Trending News
1. Headline: Sensex Today | Stock Market Live: Sensex, Nifty trade lower; auto, media stocks shine, IT drags | Moneycontrol News
Summary: Sensex Today | Stock Market Live: Indian benchmark indices extended losses on Tuesday, with the Sensex falling over 320 points and the Nifty trading above 24,200. At 12:45 hrs IST, the Sensex was down 387.37 points or 0.50 percent at 77,340.79, and the Nifty was down 90.05 points or 0.37 percent ...
Sentiment: negative
Summary: Bajaj Housing Share Price: Find the latest news on Bajaj Housing Stock Price. Get all the information on Bajaj Housing with historic price charts for NSE / BSE. Experts & Broker view also get the Bajaj Housing Ltd. buy/sell tips detailed news, announcements, Forecasts, Analysts, Valuation, ...
Sentiment: neutral
3. Headline: Bajaj Finserv Share Price Highlights: Bajaj Finserv Stock Price History - The Economic Times
Summary: Discover the Bajaj Finserv Stock Liveblog, your go-to destination for real-time updates and comprehensive analysis of a top-performing stock. Keep track of Bajaj Finserv's latest details, including: Last traded price 2005.0, Market capitalization: 320910.27, Volume: 1026623, Price-to-earnings ...
Sentiment: neutral
4. Headline: Bajaj Hindusthan Sugar April-June revenue drops 10%, off-season destocking widens loss - ChiniMandi
Summary: Bajaj Hindusthan Sugar Ltd. reported a widening of its consolidated net loss for the first quarter ended June 30, 2026, primarily dragged down by massive non-cash inventory adjustments and a dip in operational revenues. The company reported a first-quarter consolidated loss of Rs 184.70 crore compared with a loss of Rs 174.00 crore in the corresponding quarter of the previous fiscal year, the company said in a release to the stock ...
Sentiment: negative
5. Headline: US natural gas production set for record 122.5 Bcf/d in 2026, up 3.4%: EIA - ChiniMandi
Summary: Bajaj Hindusthan Sugar Ltd.
Sentiment: positive
Powered by Brave
Recent Updates
News Summary
As of August 18, 2026. Bajaj Hindusthan Sugar Ltd. reported a consolidated net loss of Rs 184.70 crore for the quarter ended June 30, 2026, representing a deterioration from the previous year's loss of Rs 174 crore. The decline in profitability was primarily driven by a 9.81% year-on-year reduction in consolidated revenue to Rs 1,125.97 crore, reflecting lower sales during the off-season. The company faced significant non-cash inventory adjustments amounting to Rs 1,056.81 crore due to aggressive summer destocking, which accounted for over 80% of total expenses and contributed to the operating loss. Expenses were marginally lower compared to the prior year quarter, but the impact of inventory write-downs and reduced operational income weighed heavily on the bottom line. Bajaj Hindusthan operates 14 sugar plants in Uttar Pradesh, and these results highlight ongoing challenges in managing seasonal fluctuations and inventory costs.
News Sentiment
The overall sentiment from recent updates is predominantly neutral to negative, driven by the widening net loss and declining revenues reported in the latest quarter. The significant inventory adjustments and off-season destocking have materially impacted profitability, overshadowing modest improvements in expense management. While the company continues to operate a substantial asset base and production capacity, these operational headwinds have tempered positive sentiment. No major strategic shifts or leadership changes were reported, and market conditions remain challenging. The sentiment reflects cautious market perception focused on near-term earnings pressures and inventory management.
Source List
Analytical Overview
Analysis Summary
Bajaj Hindusthan Sugar Ltd.'s trailing P/E ratio of 20.21 is in line with the confectioners industry average, indicating valuation parity; however, the absence of a forward P/E ratio limits forward-looking valuation insights. The company’s revenue has declined by approximately 9.6% year-over-year, and cash flow trends show positive but modest operating cash flow of INR 2.30 billion and free cash flow of INR 1.27 billion, reflecting constrained growth momentum. Financial health is challenged by a high debt-to-equity ratio of 92.99 and a current ratio below 1 at 0.56, suggesting liquidity pressures despite positive cash flow generation. Sector-specific challenges include seasonal volatility in sugarcane crushing and regulatory impacts on sugar pricing and ethanol blending mandates. Considering the Indian regulatory environment, consumer demand patterns, and economic outlook, the company operates within a complex framework of agricultural cycles and energy policy shifts.
Overall Business and Market Assessment
Supporting Factors: the company’s integrated operations in sugar and ethanol production, positive operating cash flow, and a market capitalization that reflects its established presence
Risk Factors: the high leverage ratio, negative operating margins, and recent quarterly losses driven by inventory adjustments and seasonal factors
SWOT Analysis
Strengths
- Integrated operations in sugar and ethanol production provide diversified revenue streams.
- Established market presence as one of India's largest sugar manufacturers.
- Positive operating cash flow supports liquidity despite operational challenges.
- Contributes to renewable energy through power generation from by-products.
Weaknesses
- Negative operating margin indicates operational inefficiencies.
- High debt-to-equity ratio of approximately 93% raises financial risk.
- Current ratio below 1 suggests potential liquidity constraints.
- Low return on equity and assets reflect limited profitability.
Opportunities
- Growing demand for ethanol as a renewable energy source in India.
- Potential benefits from government policies promoting ethanol blending.
- Expansion in power generation from agricultural by-products.
- Improvement in operational efficiencies could enhance margins.
Threats
- Seasonal fluctuations in sugarcane availability impact production volumes.
- Regulatory changes in sugar pricing and ethanol mandates may affect revenues.
- Inventory adjustments and destocking can suppress short-term profitability.
- Competitive pressures within the Indian sugar industry.
Company Description
Bajaj Hindusthan Sugar Ltd. is a leading manufacturer of sugar and ethanol in India. As one of the largest integrated sugar companies in the country, its primary function is to produce and market sugar derived from sugarcane. The company's operations extend beyond sugar production, including the manufacture of ethanol, an important renewable energy source, which plays a vital role in India's efforts to enhance energy independence and sustainability. The firm is significantly involved in both the agriculture and energy sectors, impacting and advancing the Indian rural economy through employment and growth in these regions. Beyond sugar and ethanol, Bajaj Hindusthan also engages in power generation, utilizing by-products like bagasse to produce electricity, thereby contributing to renewable energy supplies. With a history that dates back to its establishment in 1931, Bajaj Hindusthan Sugar Ltd. has carved a niche in the Indian commodities market, providing value across the agriculture and energy industries while aligning with national policies on sustainable development and energy usage. Its operations underscore the integration of traditional agriculture with modern energy goals, illustrating its pivotal market role.