
Bajaj Finance Ltd (BAJFINANCE)
Stock Analysis Report
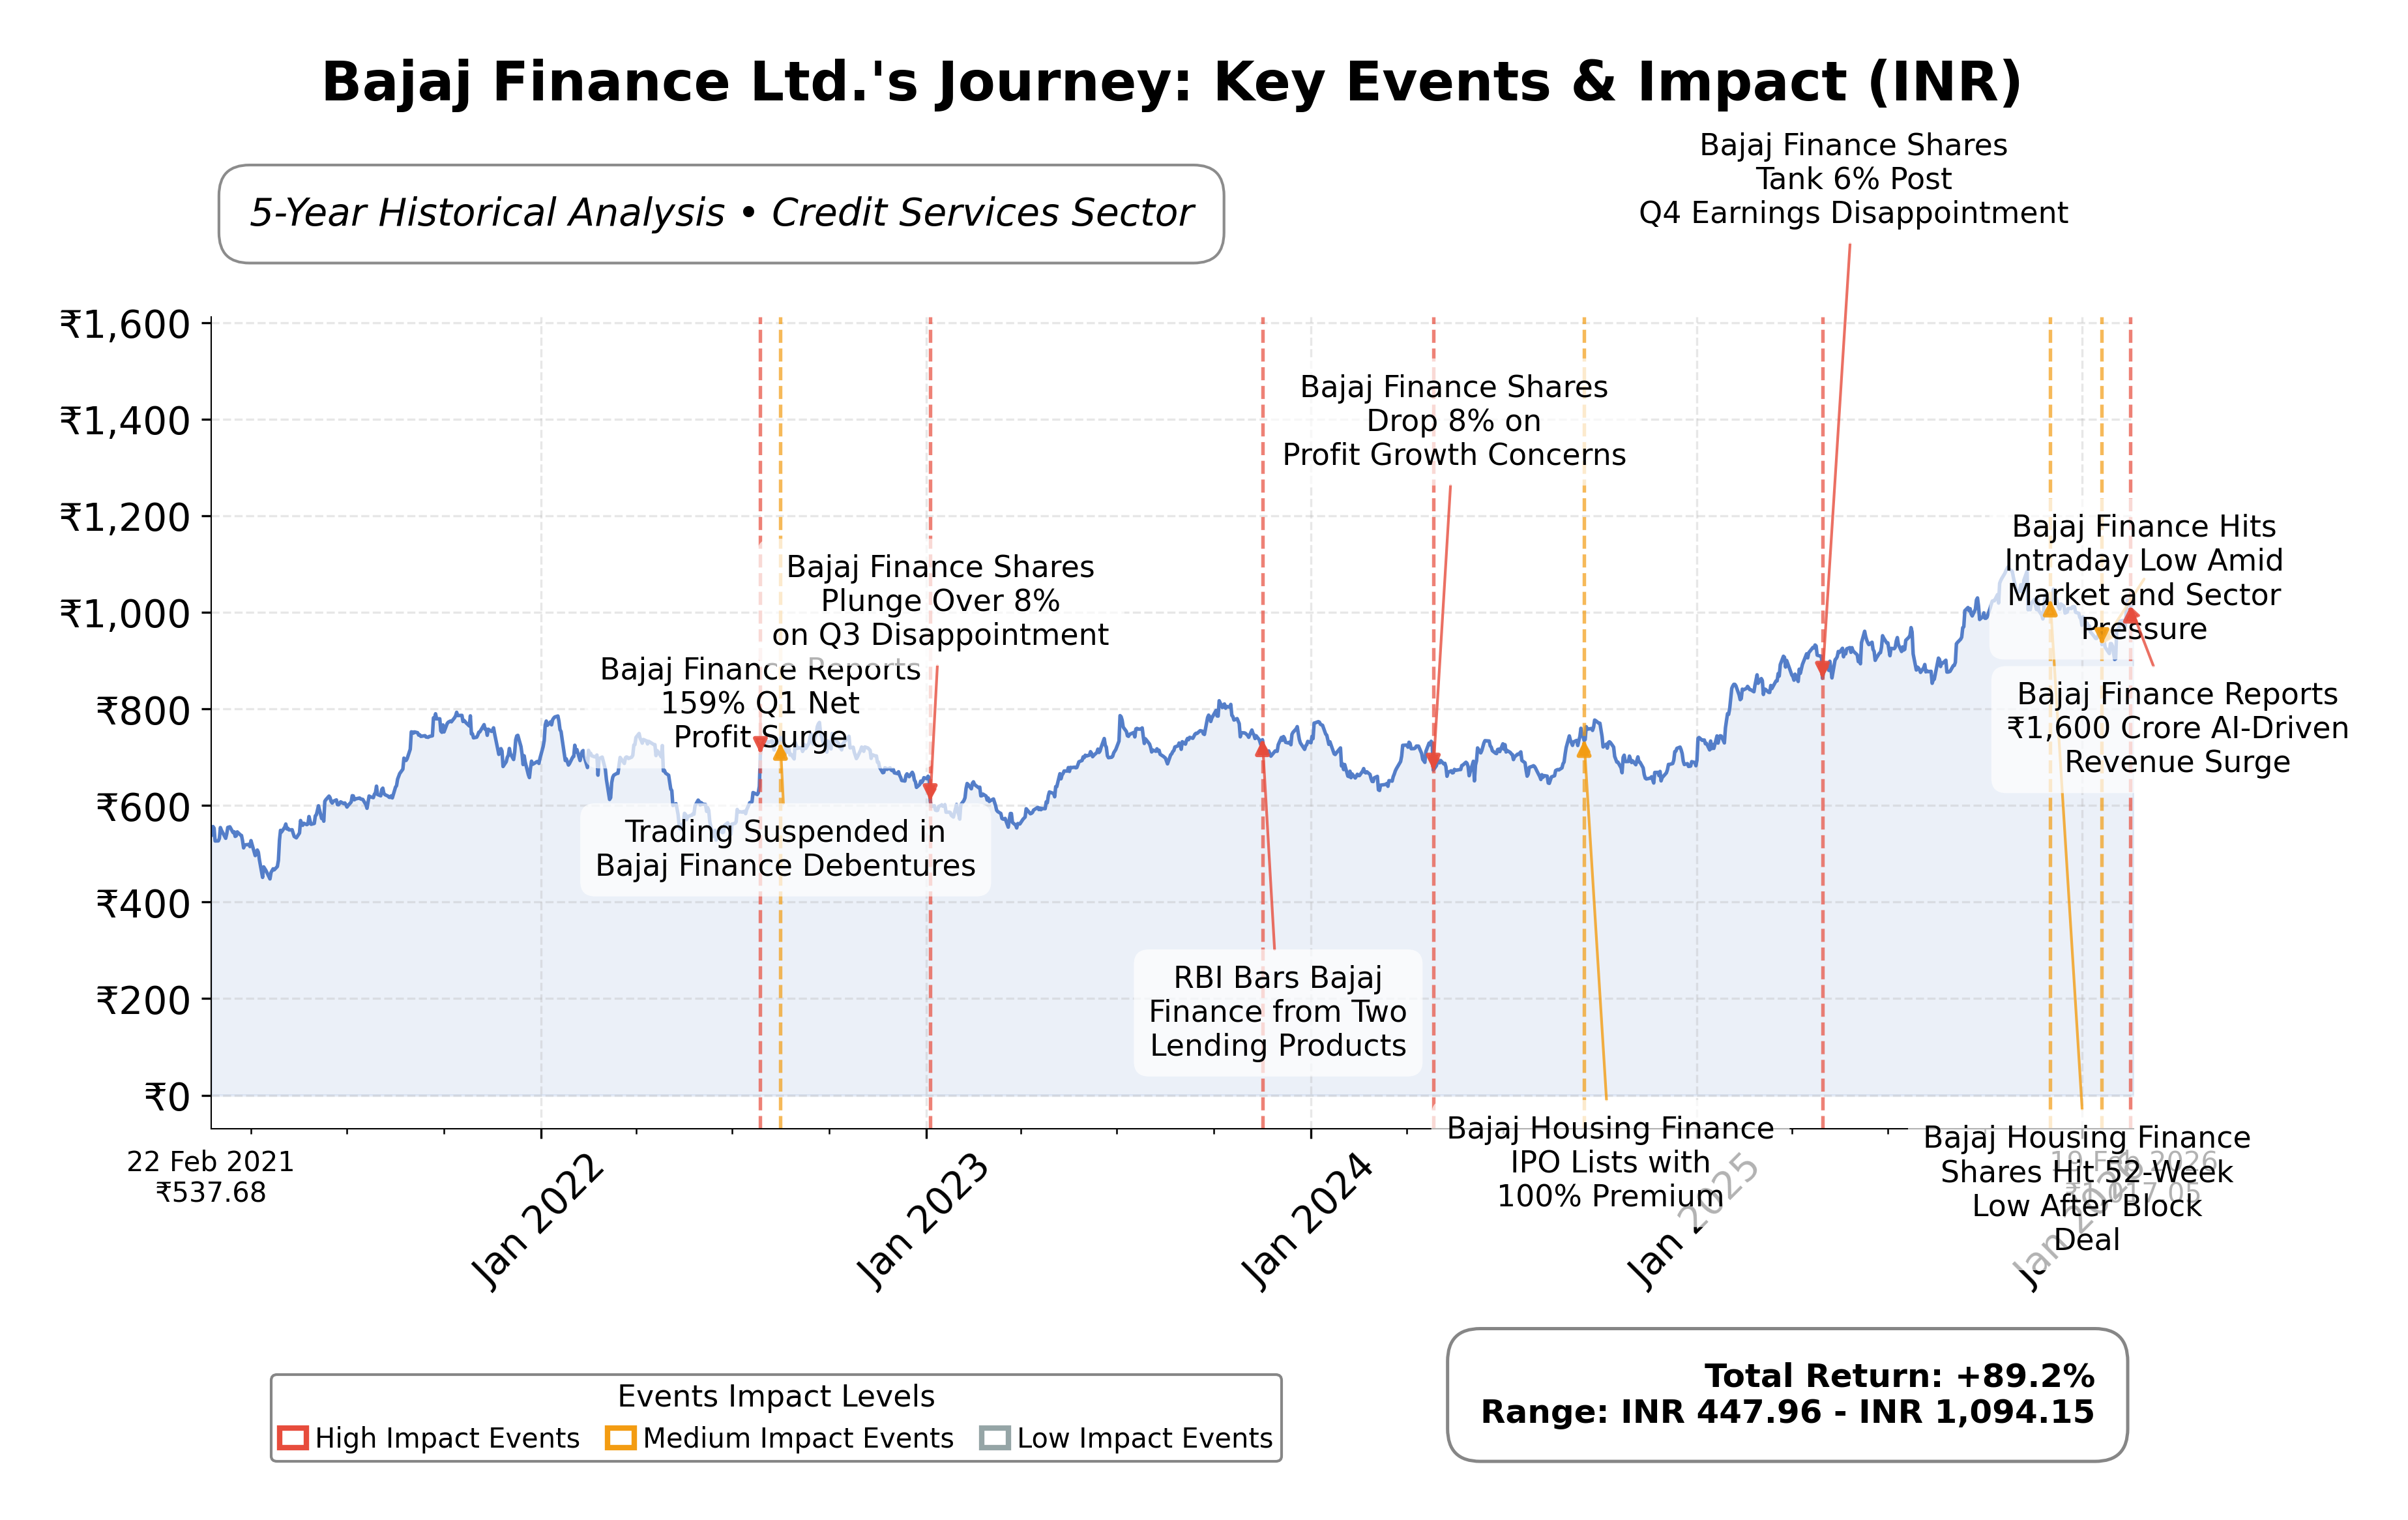
Stock Journey
Key Positives and Key Risks
Pros
- Market capitalization of ₹6.37 trillion underscores Bajaj Finance’s dominant industry position.
- Strong profit margin of 43.7% and operating margin of 55.55% indicate operational efficiency.
- Positive free cash flow of ₹166 billion supports liquidity and growth funding.
Cons
- High debt-to-equity ratio of 3.10 reflects elevated financial leverage risk.
- Negative operating cash flow of ₹147 billion suggests operational or working capital challenges.
- PEG ratio of 60.83 indicates potentially stretched valuation relative to earnings growth.
Disclosure: This information is for general awareness and does not constitute investment advice
Report Summary
Bajaj Finance Ltd. operates as a leading non-banking financial company (NBFC) in India, specializing in a broad range of lending solutions including consumer finance, SME loans, and commercial lending. The companyâs product suite covers personal loans, home loans, vehicle financing, and consumer durables finance, serving both urban and rural markets. Leveraging technology and digital platforms, Bajaj Finance has established a strong market position within the financial services sector, supported by its affiliation with the Bajaj Group conglomerate.
Financially, Bajaj Finance reports a market capitalization of approximately â¹6.37 trillion with a trailing P/E ratio of 35.37 and a forward P/E of 25.12, indicating premium valuation relative to earnings. The company exhibits a robust profit margin of 43.7% and an operating margin of 55.55%, alongside a return on equity of 16.82%. Despite a high debt-to-equity ratio of 3.10, the firm maintains substantial cash reserves of â¹128 billion and a free cash flow of â¹166 billion. The stock trades near â¹1030, within a 52-week range of â¹1102.5 to â¹821.13, reflecting a moderate upside potential of 7.04% from the current price to the 52-week high.
From a technical and strategic perspective, Bajaj Financeâs stock price remains above its 50-day and 200-day moving averages, signaling sustained upward momentum. Recent strategic initiatives include capital raising through debenture allotments and active participation in the derivatives market with increased open interest, highlighting evolving market positioning. Strengths include a diversified product portfolio and strong institutional interest, while risks stem from elevated leverage and sensitivity to credit market conditions. The companyâs leadership continues to focus on digital innovation and market expansion, reinforcing its competitive advantages.
In peer comparison within Indiaâs credit services sector, Bajaj Financeâs market capitalization significantly exceeds that of its regional peers such as Indian Railway Finance Corporation Ltd. (â¹1.46T) and Rec Ltd. (â¹913.59B). Its P/E ratio of 35.37 is notably higher than peers like IRFC (20.79) and RECLTD (5.31), reflecting market expectations of superior growth or profitability. The price-to-book ratio of 6.17 also surpasses industry averages, indicating a premium valuation. However, the companyâs negative price to cash flow ratio contrasts with positive or less negative values among peers, suggesting unique cash flow dynamics.
Bajaj Finance Ltd. stands as a pivotal entity in Indiaâs NBFC landscape, balancing strong growth trajectories with the challenges of high leverage and competitive pressures. Recent achievements include robust earnings growth and strategic capital raises, while ongoing challenges involve managing credit risk and sustaining operational efficiencies. The companyâs future hinges on its ability to capitalize on digital transformation and market expansion while navigating macroeconomic and regulatory factors. Given the current financial and market data, a neutral stance with close observation of evolving fundamentals and sector dynamics may be appropriate for those assessing the stockâs prospects.
Company and Industry Overview
Company Basics
Price Performance
Company Size
Shareholding Pattern
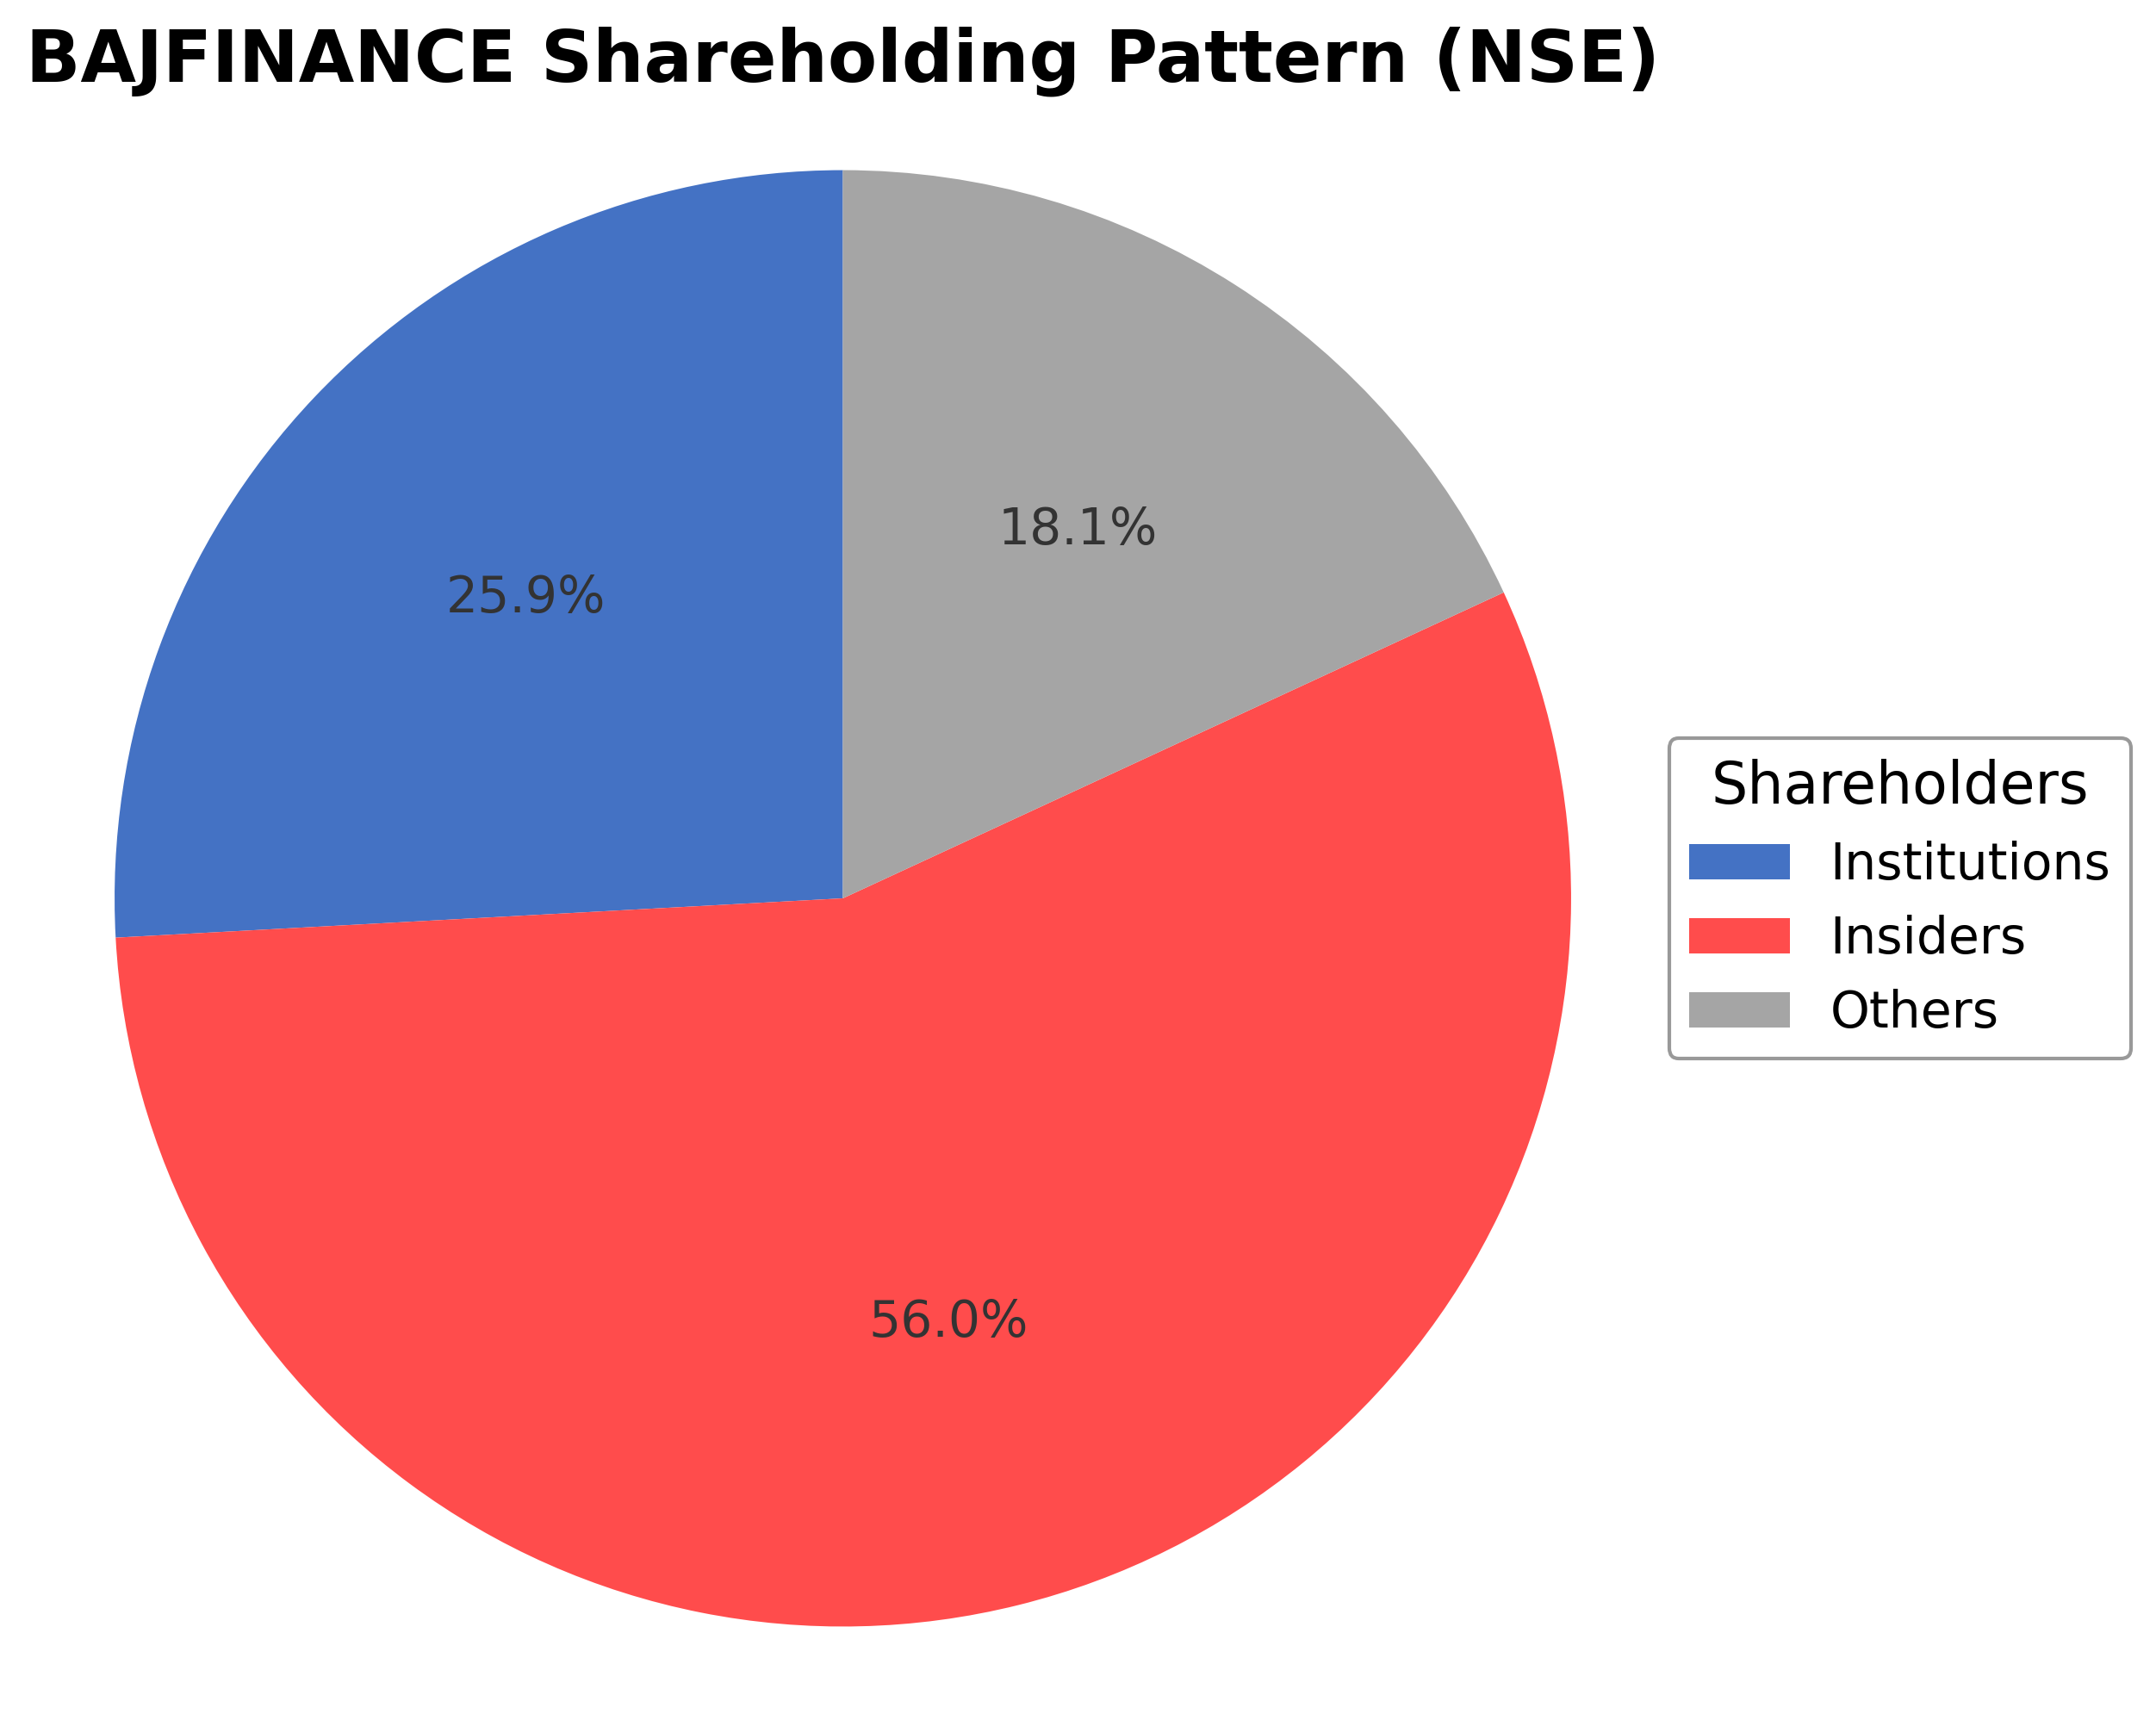
Bajaj Finance Ltd.'s shareholding structure comprises approximately 0.56% held by insiders including executives and board members, 25.86% by institutional investors such as mutual funds and asset managers, and the remaining 73.58% by public shareholders including retail investors and employee stock plans. Over the past 12 to 24 months, institutional holdings have shown stable accumulation with notable participation from major Indian and global funds, reflecting sustained confidence in the company's governance and strategic direction. These ownership patterns indicate a broad market interest and diversified control, which may influence corporate governance practices and future strategic initiatives within the competitive credit services industry in India.
Sector and Industry Analysis
Bajaj Finance Ltd operates within the Indian Non-Banking Financial Company (NBFC) sector, a critical segment of the broader financial services industry. The NBFC sector in India has witnessed robust growth over the past decade, driven by increasing financial inclusion, rising consumer credit demand, and diversification of lending products. The market size of the NBFC sector is substantial, with assets under management running into trillions of INR, and Bajaj Finance stands out as one of the largest and most diversified players with a market capitalization exceeding ₹6 trillion. Key competitors include other large NBFCs such as Shriram Finance, Cholamandalam Investment, and Muthoot Finance, alongside traditional banks that increasingly encroach into consumer finance.
Industry trends in the NBFC space are shaped by rapid digitization, evolving consumer preferences, and the rise of fintech platforms. Technology adoption is accelerating, with companies leveraging data analytics, AI-driven credit scoring, and digital lending platforms to enhance customer acquisition and risk management. Consumer behavior is shifting towards online and instant credit solutions, especially among millennials and the underbanked population. Emerging opportunities lie in unsecured personal loans, consumer durable financing, and small business loans, segments where NBFCs like Bajaj Finance have established strong footholds. Additionally, partnerships with e-commerce and digital payment platforms are expanding the reach and convenience of credit products.
The regulatory environment for NBFCs in India is stringent and evolving, overseen primarily by the Reserve Bank of India (RBI). Key regulations focus on capital adequacy, asset classification, provisioning norms, and liquidity requirements to ensure financial stability and protect consumer interests. Post the NBFC crisis in 2018-19, regulators have tightened compliance mandates, including enhanced disclosure norms and stress testing. Policy impacts include periodic changes in interest rate frameworks and priority sector lending targets, which influence NBFC lending strategies. Compliance with Anti-Money Laundering (AML) and Know Your Customer (KYC) norms remains critical, alongside adherence to data privacy regulations as digital lending grows.
Competitive dynamics in the NBFC sector are characterized by a mix of large diversified players and numerous smaller niche lenders. The market structure is moderately concentrated, with Bajaj Finance occupying a leading position due to its extensive product portfolio, strong brand, and technological capabilities. Barriers to entry include regulatory capital requirements, the need for robust risk management systems, and the challenge of building extensive distribution networks. Competitive positioning is increasingly driven by digital innovation, customer experience, and pricing strategies. Bajaj Finance’s ability to leverage technology for underwriting efficiency and customer engagement provides it a competitive edge, while smaller players often compete on specialized products or regional presence. Overall, the sector remains dynamic with ongoing consolidation and innovation shaping the competitive landscape.
Note: Analysis synthesized from industry research, market reports, and regulatory filings. Information is subject to change based on market conditions.
Illustrative Scenario Analysis
DCF Assumptions:
Method: Two-Stage EPS-Priority Model
Financials
Peer Analysis
| Company Name | Market Cap | P/E Ratio | P/B Ratio | EV/EBITDA | Price to CFO |
|---|---|---|---|---|---|
| Bajaj Finance Ltd. | ₹6.37T | 35.37 | 6.17 | N/A | -43.26 |
| Indian Renewable Energy Development Agency Ltd. | ₹347.11B | 18.06 | 2.56 | 25.64 | -2.06 |
| Indian Railway Finance Corporation Ltd. | ₹1.46T | 20.79 | 2.57 | 39.23 | -14.55 |
| Rec Ltd. | ₹913.59B | 5.31 | 1.09 | N/A | 4.48 |
| SBFC Finance Ltd. | ₹106.06B | 25.26 | 3.07 | 26.95 | -4.99 |
| Capri Global Capital Ltd. | ₹170.53B | 19.24 | 2.59 | 50.17 | -3.14 |
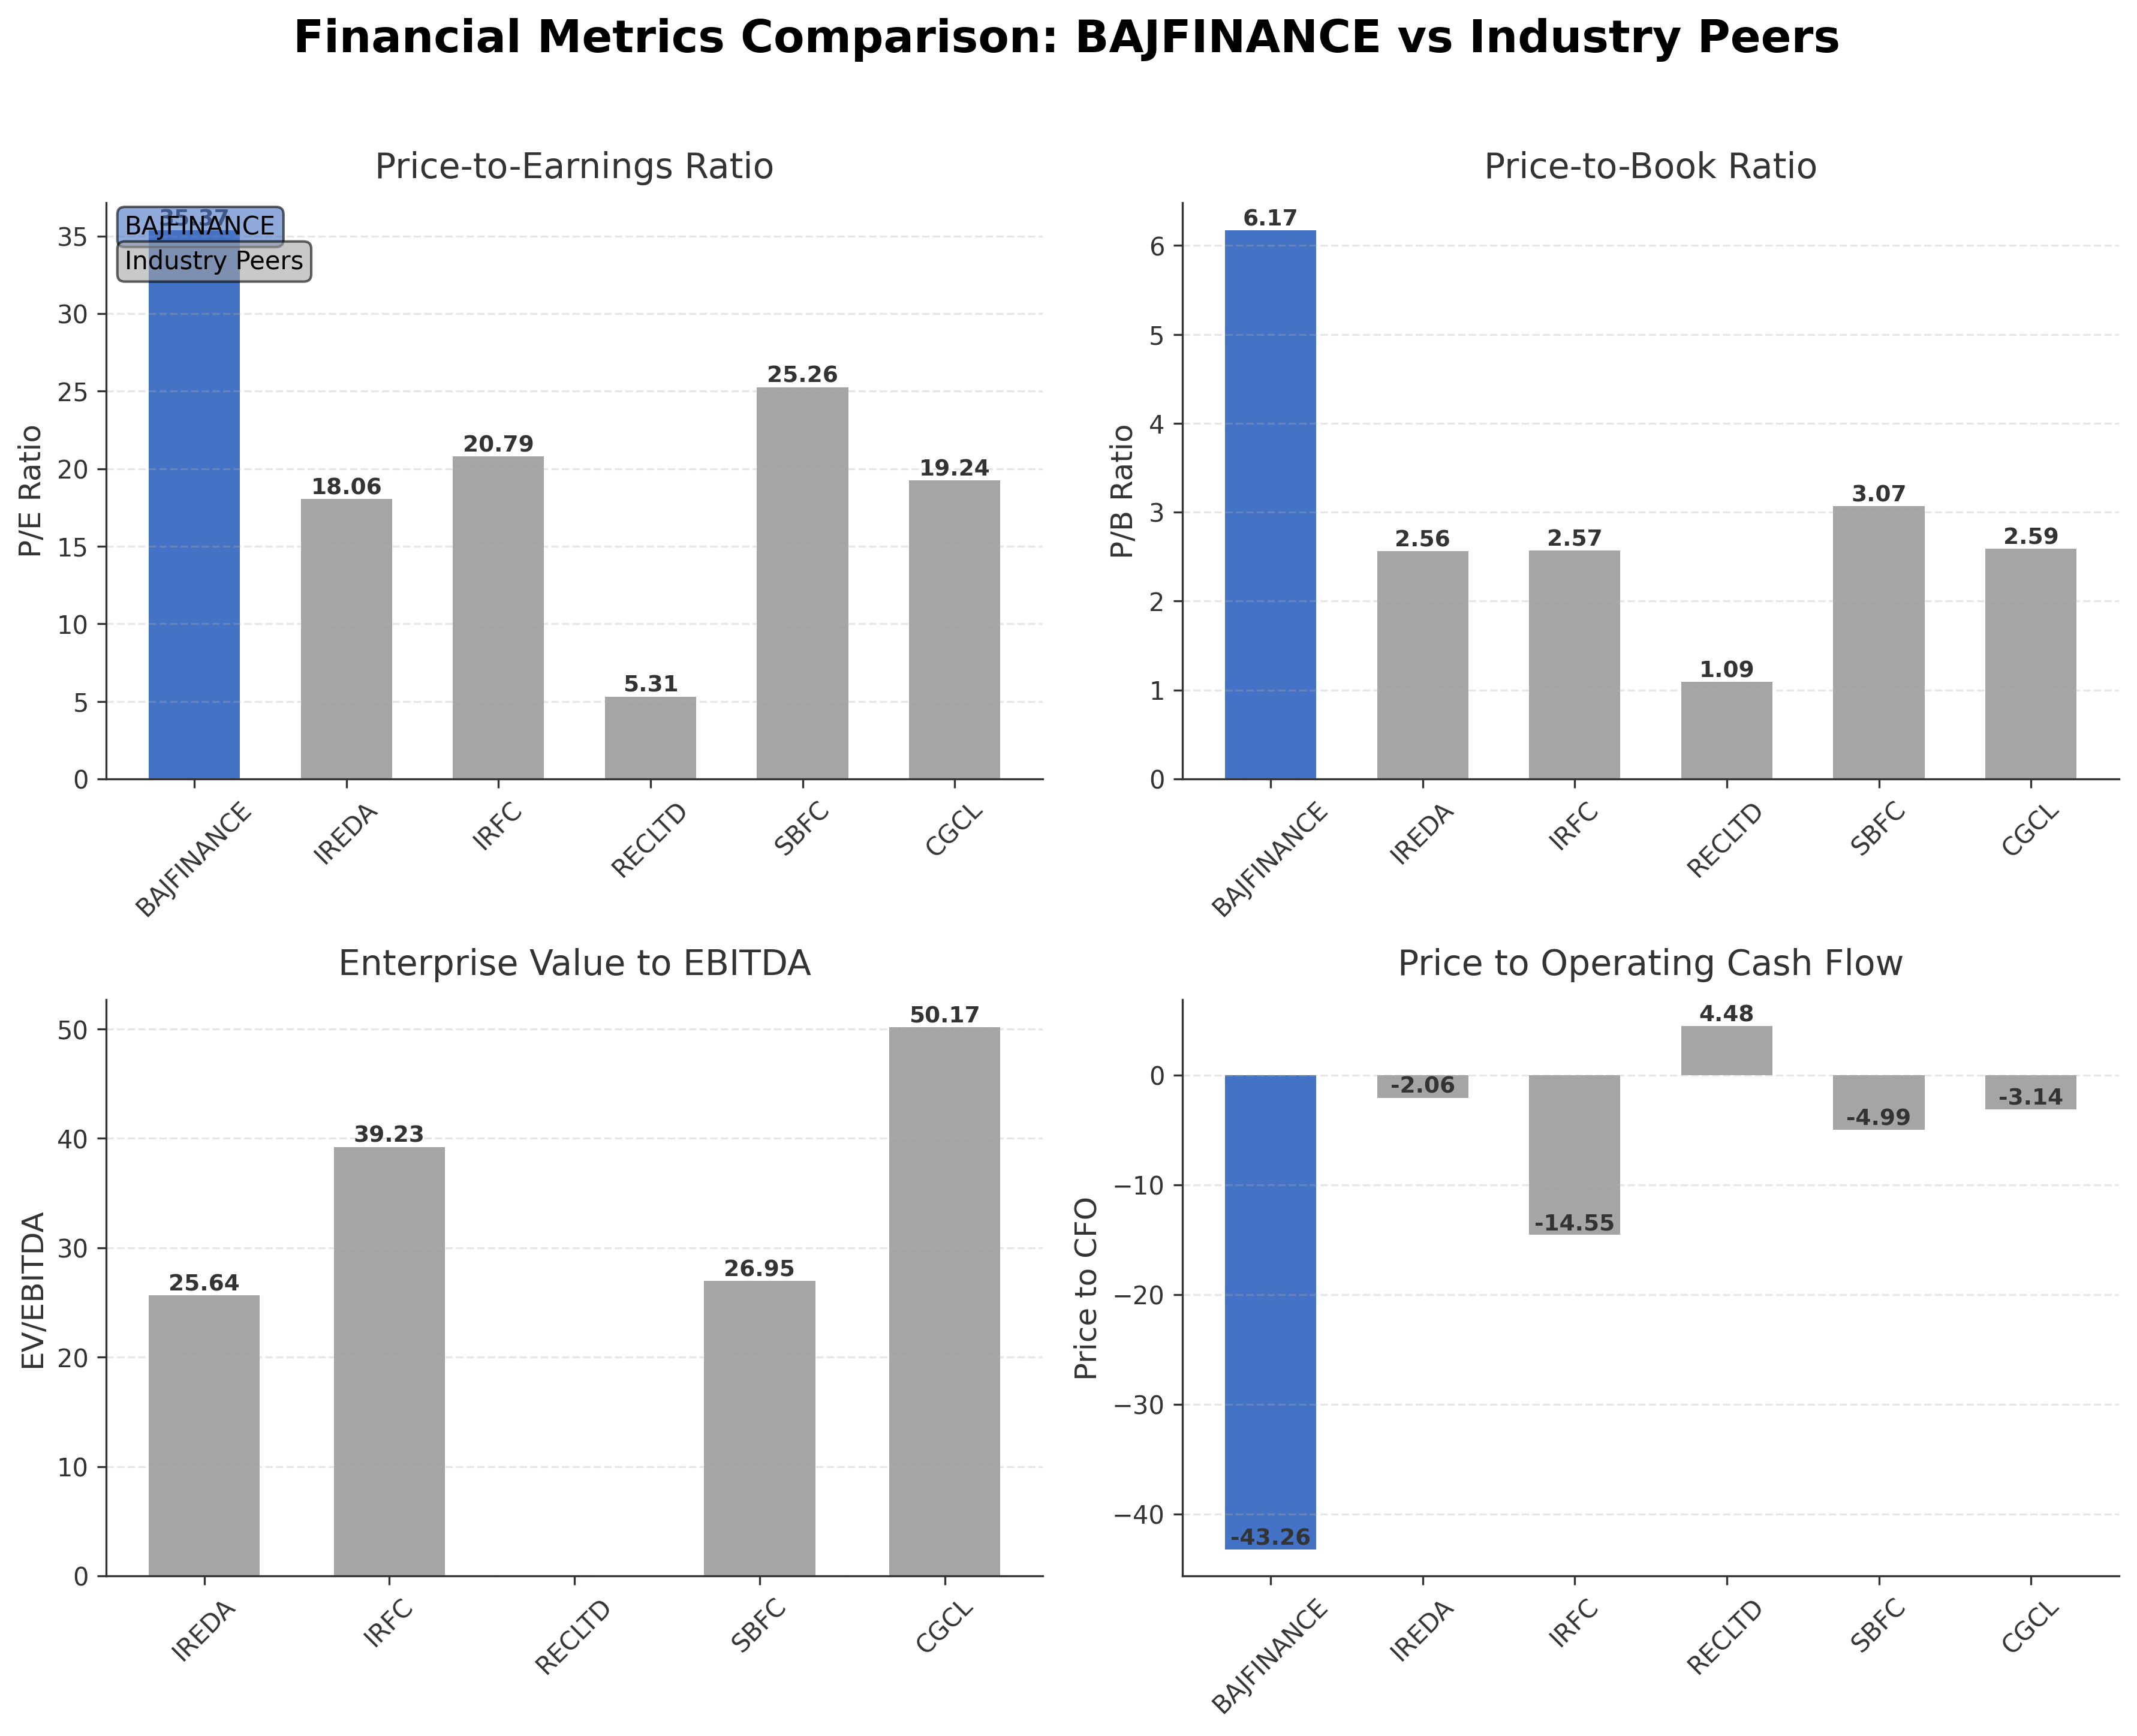
Comparison Analysis: Bajaj Finance Ltd. commands a market capitalization significantly larger than its regional peers, reflecting its dominant position in the Indian credit services sector. Its P/E ratio of 35.37 is substantially higher than those of peers such as Indian Railway Finance Corporation Ltd. (20.79) and Rec Ltd. (5.31), indicating a premium valuation that may be attributed to expected growth or profitability. The price-to-book ratio of 6.17 also exceeds peer averages, suggesting market confidence in the company’s asset quality and earnings potential. However, the negative price to cash flow ratio contrasts with positive or less negative figures among peers, highlighting unique cash flow characteristics that warrant attention in comparative analysis.
Financial Metrics Comparison with Peers
Financial Statements
Comprehensive financial data including income, balance sheet, and cash flow metrics
Income Statement
| fiscal_date | 2025-03-31 | 2024-03-31 | 2023-03-31 | 2022-03-31 | 2021-03-31 |
|---|---|---|---|---|---|
| Sales | 423.56B | 343.26B | 269.67B | 201.32B | 160.23B |
| Operating Expense Selling General And Administrative | 5.39B | 4.03B | 3.91B | 2.01B | 1.23B |
| Operating Expense Other Operating Expenses | 31.23B | 27.10B | 21.23B | 15.26B | 10.64B |
| Pretax Income | 220.80B | 193.10B | 155.28B | 95.04B | 59.92B |
| Income Tax | 53.00B | 48.58B | 40.20B | 24.76B | 15.72B |
| Net Income | 167.79B | 144.51B | 115.08B | 70.28B | 44.20B |
| Eps Basic | 26.89 | 236.89 | 190.53 | 116.64 | 73.58 |
| Eps Diluted | 26.82 | 235.98 | 189.57 | 115.79 | 73.00 |
| Basic Shares Outstanding | 6.19B | 610.03M | 603.98M | 602.57M | 600.67M |
| Diluted Shares Outstanding | 6.19B | 610.03M | 603.98M | 602.57M | 600.67M |
| Net Income Continuous Operations | 220.80B | 193.10B | 155.28B | 95.04B | 59.92B |
| Minority Interests | -1.42B | N/A | N/A | N/A | N/A |
Data provided by Twelve Data
Balance Sheet
| fiscal_date | 2025-09-30 | 2025-03-31 | 2024-09-30 | 2024-03-31 | 2023-09-30 |
|---|---|---|---|---|---|
| Cash And Cash Equivalents | 120.01B | 107.68B | 123.60B | 73.67B | 75.52B |
| Accounts Receivable | N/A | N/A | N/A | N/A | N/A |
| Total Assets | 5099.61B | 4661.27B | 4206.56B | 3757.42B | N/A |
| Total Liabilities | 4043.62B | 3671.90B | 3317.40B | N/A | N/A |
| Long Term Debt | 3276.35B | 2753.60B | 2580.87B | 2184.37B | 2017.27B |
| Shareholders Equity | 1055.98B | 989.37B | 889.16B | 766.95B | 598.74B |
Data provided by Twelve Data
Cash Flow Statement
| fiscal_date | 2025-03-31 | 2024-03-31 | 2023-03-31 | 2022-03-31 | 2021-03-31 |
|---|---|---|---|---|---|
| Operating Activities Net Income | 220.80B | 193.10B | 155.28B | 95.04B | 59.92B |
| Operating Activities Stock Based Compensation | 3.94B | 2.68B | 2.24B | 1.61B | 1.25B |
| Operating Activities Other Non Cash Items | -369.72B | -296.45B | -230.50B | -175.99B | -140.47B |
| Operating Activities Accounts Receivable | -2.06B | -4.58B | -934.30M | -3.21B | 459.50M |
| Operating Activities Other Assets Liabilities | -220.80M | 837.00M | -1.25B | 907.30M | 8.70M |
| Operating Activities Operating Cash Flow | -147.27B | -104.41B | -75.16B | -81.64B | -78.83B |
| Investing Activities Capital Expenditures | -5.48B | -5.65B | -4.66B | -3.56B | -1.27B |
| Investing Activities Net Intangibles | -4.98B | -4.34B | -3.92B | -2.59B | -1.71B |
| Investing Activities Net Acquisitions | 0.00 | -2.67B | -927.40M | 0.00 | N/A |
| Investing Activities Purchase Of Investments | -478.99B | -1412.95B | -3184.10B | -2411.81B | -2415.86B |
| Investing Activities Sale Of Investments | 461.79B | 1344.46B | 3083.61B | 2477.42B | 2412.29B |
| Investing Activities Investing Cash Flow | -22.69B | -76.81B | -106.08B | 62.05B | -4.84B |
| Financing Activities Long Term Debt Issuance | 849.67B | 726.66B | 668.60B | 417.91B | 49.37B |
| Financing Activities Long Term Debt Payments | -390.27B | -343.76B | -364.74B | -184.36B | -55.94B |
| Financing Activities Short Term Debt Issuance | 87.88B | 220.24B | 79.24B | 46.72B | 31.49B |
| Financing Activities Common Stock Issuance | 77.12B | 93.64B | 1.58B | 1.73B | 1.03B |
| Financing Activities Common Dividends | -22.25B | -18.15B | -12.07B | -6.03B | -27.40M |
| Financing Activities Other Financing Charges | 105.27B | 147.60B | 135.57B | 47.84B | 41.73B |
| Financing Activities Financing Cash Flow | 707.42B | 826.24B | 508.19B | 323.81B | 67.65B |
| End Cash Position | 36.42B | 40.35B | 15.51B | 33.81B | 18.49B |
| Free Cash Flow | -692.36B | -737.98B | -429.90B | -377.24B | -11.17B |
Data provided by Twelve Data
Technical Analysis
Key Insights
- The current trend direction for Bajaj Finance Ltd. is upward, with price action maintaining levels above both the 50-day (₹972.51) and 200-day (₹963.88) moving averages, indicating sustained bullish momentum.
- Key support levels are observed near ₹972 and ₹963, corresponding to the 50-day and 200-day moving averages, while resistance is proximate to the 52-week high of ₹1102.5.
- The stock price is positioned above major moving averages (10-day, 50-day, 200-day), suggesting a strong trend across short and long-term timeframes.
- Momentum indicators show a moderately strong Relative Strength Index (RSI) without signs of overbought conditions; MACD and Stochastic indicators reflect positive momentum with no immediate reversal signals.
- Multi-timeframe analysis across daily, weekly, and monthly charts confirms consistent upward trends, with no significant divergences detected.
- Current technical setup suggests potential continuation of the bullish trend, contingent on maintaining support levels, while any breach below moving averages could signal consolidation or correction phases.
Trending News
1. Headline: InCred Equities Suggests Add on Bajaj Finance with Target Price Rs 1,200
Summary: InCred Equities recommended an 'Add' rating on Bajaj Finance Ltd., setting a target price of ₹1,200. The report highlights positive outlooks for vehicle financiers including Shriram Finance and Mahindra & Mahindra Financial Services. This endorsement reflects confidence in Bajaj Finance’s growth prospects within the financial services sector.
Sentiment: Positive
2. Headline: Bajaj Finance Ltd Sees High-Value Trading Amid Sector-Aligned Performance
Summary: Bajaj Finance Ltd. experienced significant trading activity on February 19, 2026, with total traded value exceeding ₹67,381 lakhs. Despite a slight price decline, institutional interest remains strong, indicating robust market engagement and confidence in the company’s sector-aligned performance.
Sentiment: Positive
3. Headline: Bajaj Finance Ltd Sees Significant Open Interest Surge Amid Mixed Market Signals
Summary: Bajaj Finance Ltd. reported a 12.38% increase in open interest in its derivatives segment, signaling heightened market activity and evolving investor positioning. This surge, coupled with volume patterns, suggests dynamic market sentiment despite a modest decline in stock price.
Sentiment: Positive
4. Headline: Tech-Led Finance: Bajaj Group Companies Poised for Growth Amidst NBFC Divergence
Summary: DRChoksey Finserv highlights Bajaj Finance and Bajaj Housing Finance as preferred investments within retail NBFCs due to strong technology adoption. This contrasts with uncertainty in AI-impacted BPO sectors, underscoring Bajaj Finance’s strategic advantage in tech-led growth.
Sentiment: Positive
5. Headline: Bajaj Finance Ltd Raises INR25 Billion Through Debenture Allotment
Summary: Bajaj Finance successfully raised ₹25 billion via non-convertible debenture allotment on a private placement basis. This capital infusion supports the company’s funding requirements and strategic growth initiatives within the competitive NBFC sector.
Sentiment: Neutral
Powered by Brave
Recent Updates
News Summary
Recent developments for Bajaj Finance Ltd. include a successful ₹25 billion debenture allotment, enhancing liquidity and supporting growth strategies. The company also experienced a notable surge in open interest within its derivatives segment, indicating increased market engagement and evolving positioning. Additionally, Bajaj Housing Finance, a group affiliate, raised over ₹1,020 crore via secured non-convertible debentures, reflecting broader capital market activity within the group. Profit after tax showed an increase in the second quarter, reinforcing operational strength. These events collectively underscore Bajaj Finance’s active capital management and strategic positioning amidst a dynamic NBFC sector landscape.
News Sentiment
The overall sentiment from recent news is moderately positive, with capital raising activities and increased market participation highlighting confidence in the company’s prospects. Neutral tones in earnings reports and financial calculators suggest stable operational performance without significant volatility. Positive signals from derivatives market activity and group-level financing initiatives further support a constructive outlook, balanced by the need for ongoing monitoring of market and regulatory conditions.
Analytical Overview
Analysis Summary
Valuation Metrics: Bajaj Finance’s trailing P/E of 35.37 and forward P/E of 25.12 are elevated compared to the industry average of 35.37, reflecting a premium valuation consistent with growth expectations. The PEG ratio of 60.83 suggests high valuation relative to earnings growth, warranting careful consideration.
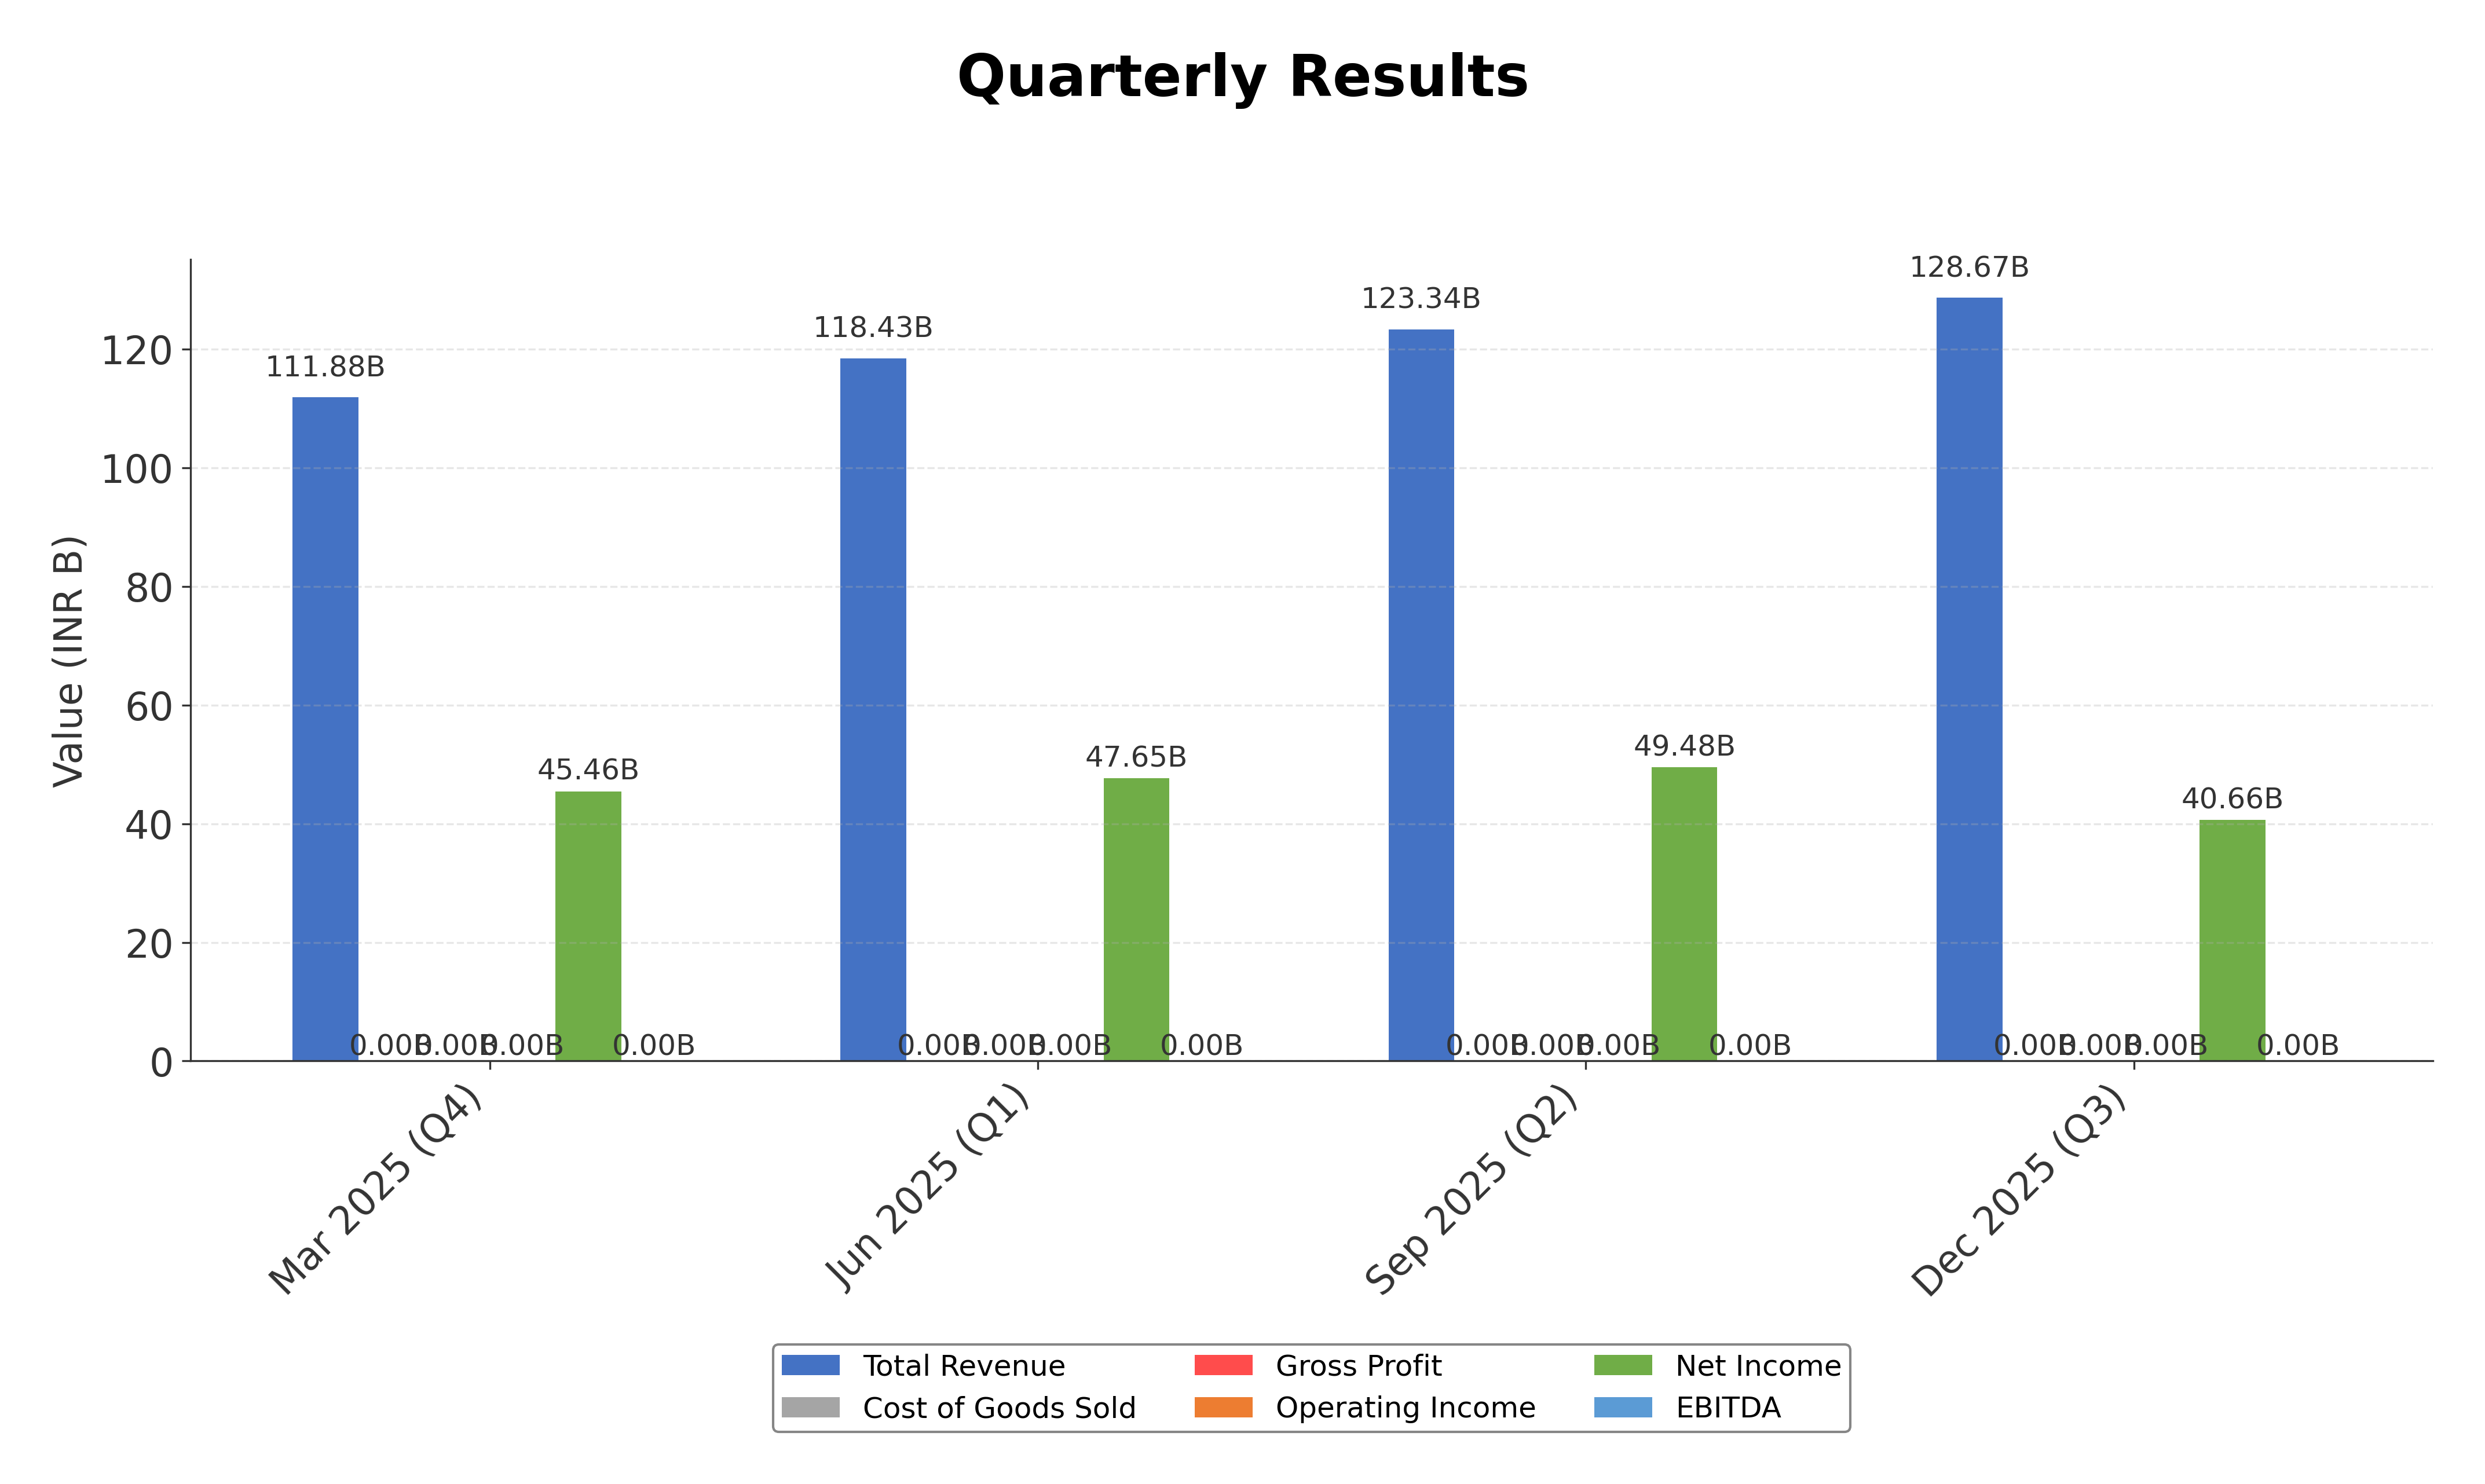
Growth Trajectory: The company exhibits steady revenue growth of 6.5% quarterly, supported by a strong profit margin of 43.7%. However, quarterly earnings growth shows a slight decline of 6.3% year-over-year, indicating mixed signals in profitability trends.
Financial Health: A high debt-to-equity ratio of 3.10 highlights significant leverage, though substantial cash reserves of ₹128 billion and positive free cash flow of ₹166 billion provide liquidity buffers. Negative operating cash flow of ₹147 billion suggests working capital or operational challenges.
Sector Specific Factors: The Indian NBFC sector faces regulatory scrutiny and competitive pressures, but Bajaj Finance’s technology-driven approach and diversified product portfolio offer opportunities to capture underserved markets. Economic growth and credit demand in India remain supportive factors.
Market Positioning: Bajaj Finance benefits from strong brand recognition and governance under the Bajaj Group, positioning it well against peers in India’s financial services market.
Investment Conclusion
Supporting Factors: Robust market capitalization and premium valuation reflecting growth potential.
Risk Factors: Elevated debt-to-equity ratio posing financial leverage risks.
SWOT Analysis
Strengths
- Diverse lending portfolio spanning consumer, SME, and commercial finance.
- Strong brand presence and governance under the Bajaj Group.
- Robust profit and operating margins indicating efficient operations.
- Significant market capitalization and premium valuation in the sector.
Weaknesses
- High debt-to-equity ratio indicating elevated financial leverage.
- Negative operating cash flow despite positive free cash flow.
- Relatively high PEG ratio suggesting stretched valuation.
- Dependence on credit market conditions and regulatory environment.
Opportunities
- Expansion into underserved rural and urban markets via digital platforms.
- Growing credit demand in India’s evolving financial services sector.
- Strategic capital raising to support growth initiatives.
- Technology adoption enhancing customer experience and operational efficiency.
Threats
- Regulatory changes impacting NBFC operations and capital requirements.
- Competitive pressures from banks and fintech companies.
- Macroeconomic volatility affecting credit quality and asset performance.
- Market sentiment shifts influencing stock valuation and liquidity.
Company Description
Bajaj Finance Ltd. is a prominent non-banking financial company (NBFC) in India, known for its diverse portfolio of financial services. Its primary function is to offer lending solutions, which encompass consumer finance, small and medium-sized enterprise (SME) loans, and commercial lending. Key products include personal loans, home loans, and vehicle financing, alongside consumer durables finance, which drives significant retail participation. The company has carved a significant niche in the financial sector by leveraging technology to enhance customer experience and expand reach through digital lending platforms. Notably, Bajaj Finance has successfully penetrated both urban and rural markets, reflecting its adaptive business strategies and wide-ranging customer base. It plays a critical role in providing credit access to underserved segments, thus fostering economic growth. As part of the Bajaj Group, a well-established conglomerate in India, Bajaj Finance benefits from a robust governance framework and brand reputation. This positions it as a key player in the financial services market, contributing significantly to financial inclusion and offering substantial support to India's growing economy.