
AT&T Inc (T)
Stock Analysis Report
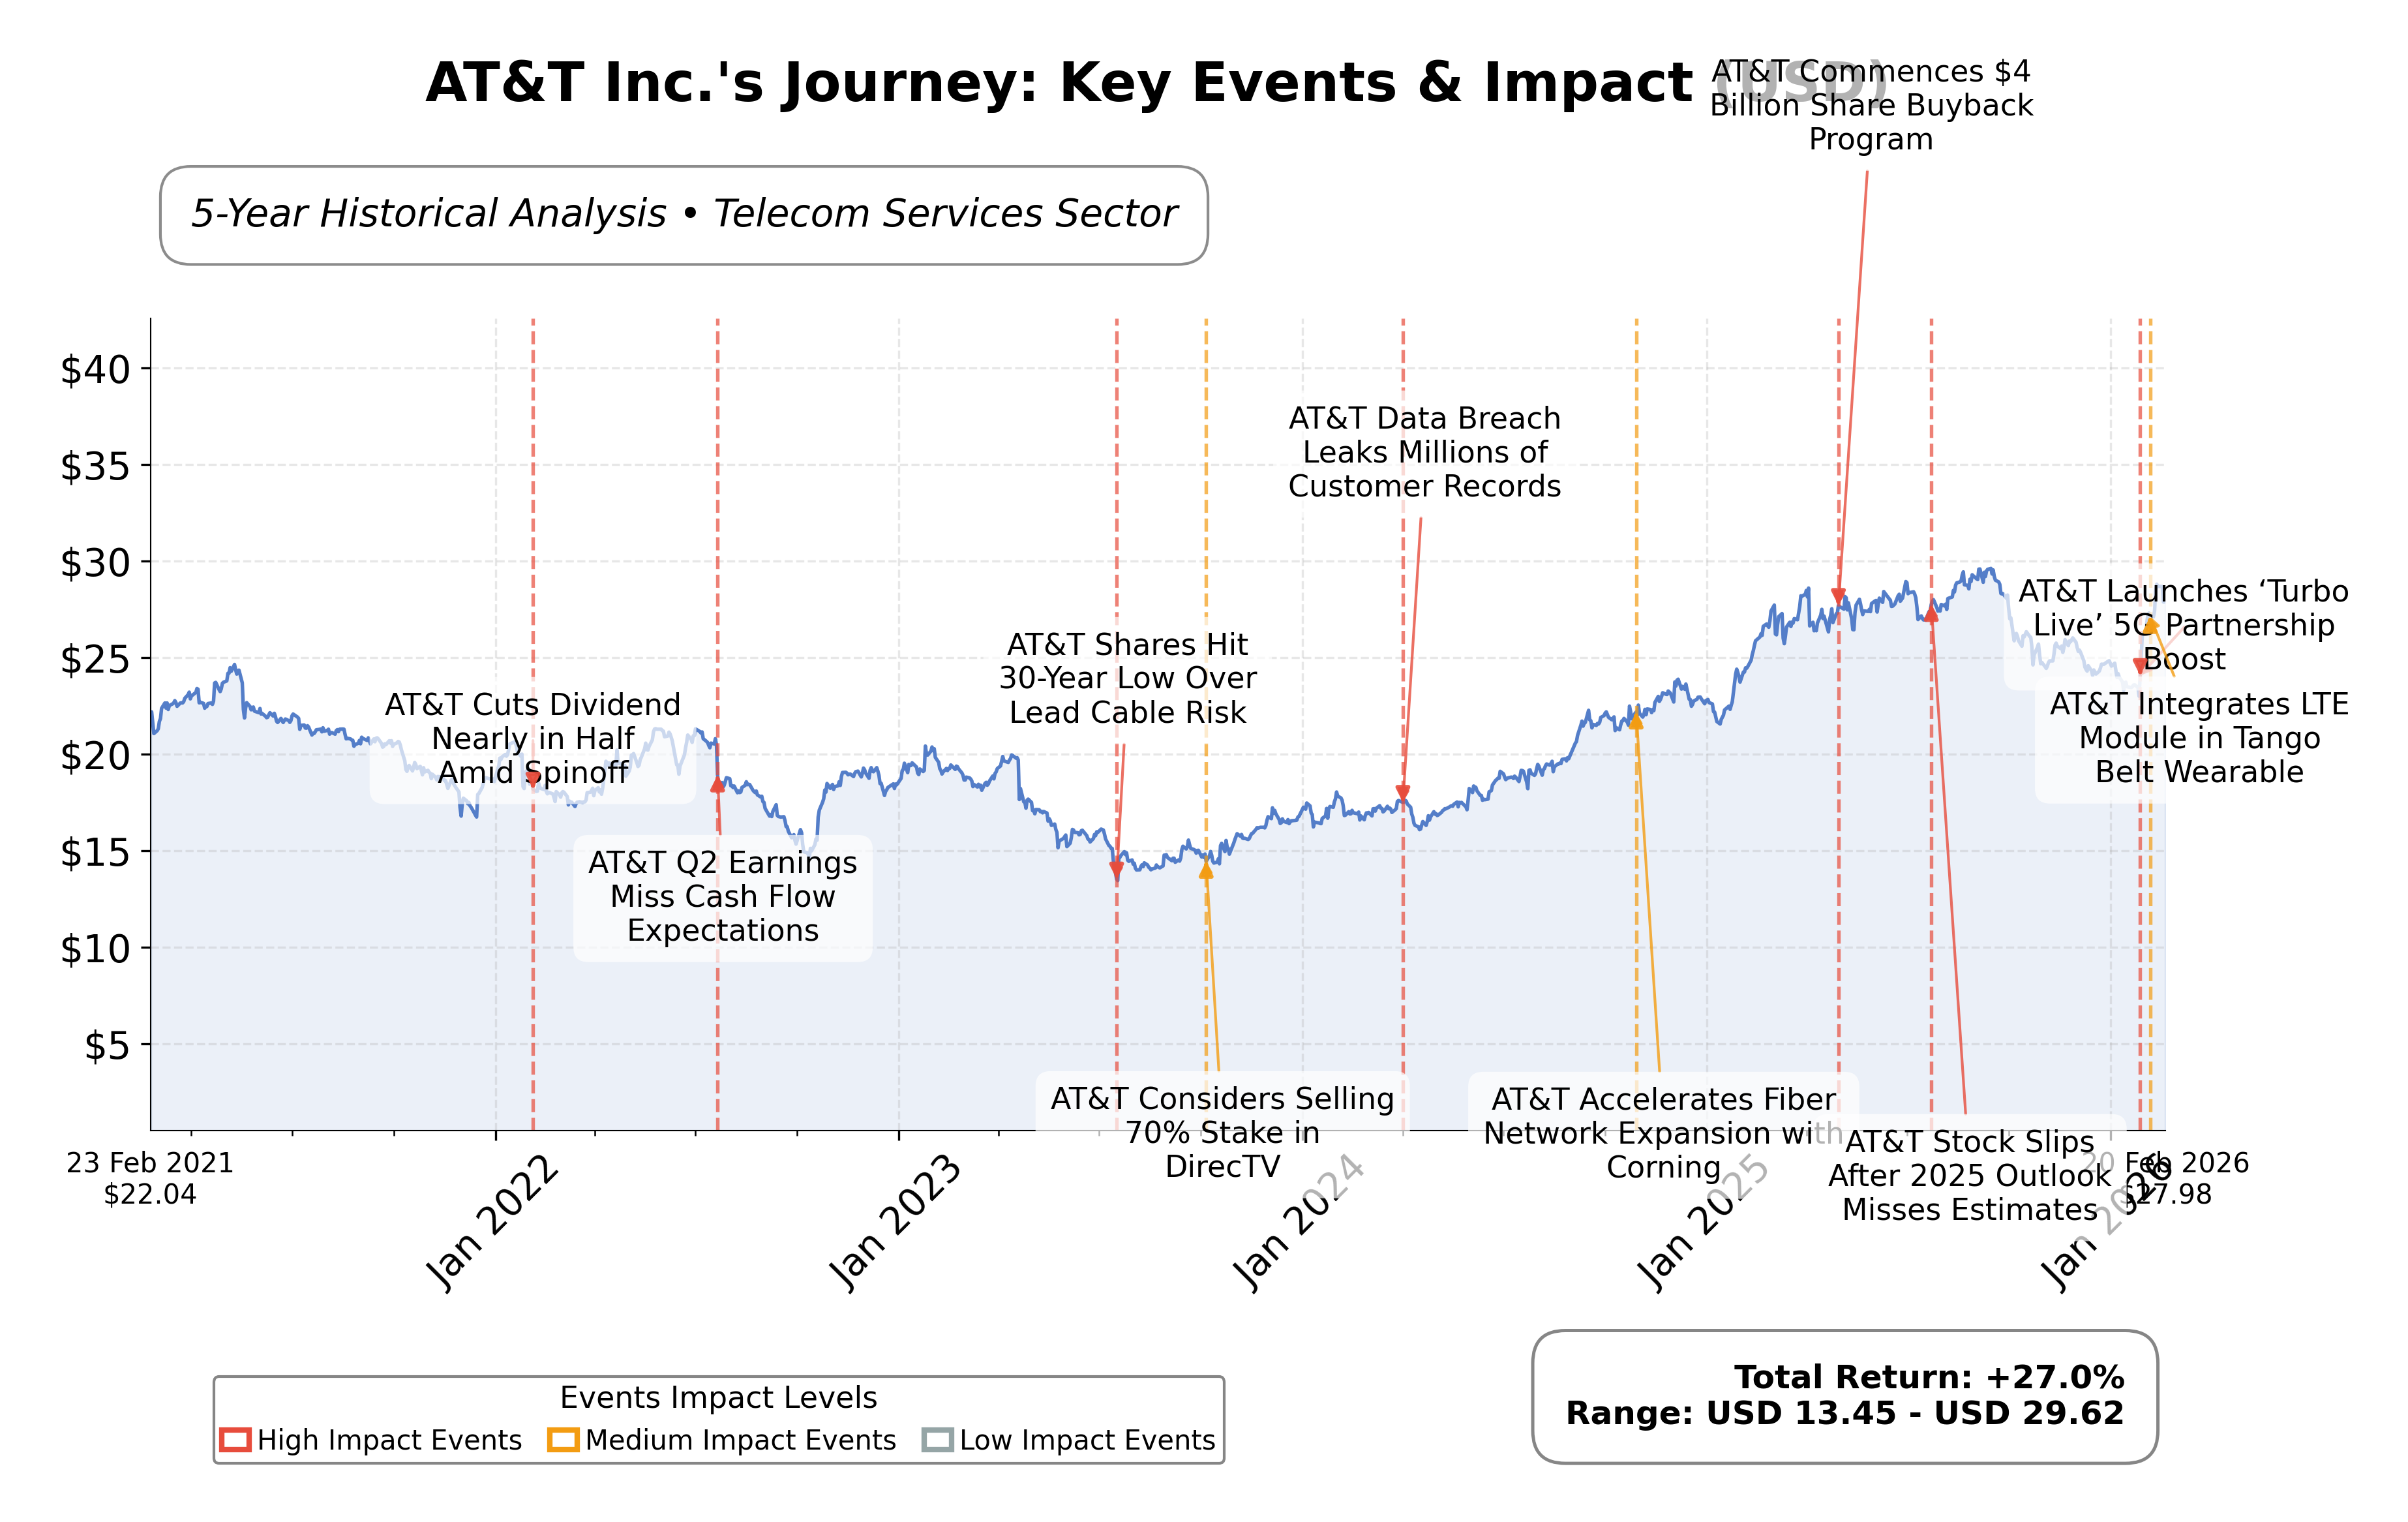
Stock Journey
Key Positives and Key Risks
Pros
- Operating cash flow of $40.28 billion supports financial flexibility and investment capacity.
- Trailing P/E ratio of 9.17 indicates relatively attractive valuation compared to industry peers.
- Recognition as America’s best and fastest internet provider highlights competitive service quality.
Cons
- High total debt of $159.56 billion results in a debt-to-equity ratio exceeding 124%, indicating leverage risk.
- Quarterly earnings growth declined by 7.2% year-over-year, signaling potential near-term profitability pressures.
Disclosure: This information is for general awareness and does not constitute investment advice
Report Summary
AT&T Inc. is a prominent multinational telecommunications company operating primarily in the United States, with select international markets. The company offers a broad range of connectivity and digital services, including wireless communications, wireline broadband, voice services, and media and entertainment assets such as Warner Bros. Discovery partnerships and HBO Max streaming. AT&T holds extensive 5G spectrum and fiber infrastructure, serving over 240 million connections, positioning itself as a key player in the telecom services industry.
Financially, AT&T reports a market capitalization of approximately $198.36 billion and an enterprise value of $354.46 billion. The companyâs trailing P/E ratio stands at 9.17, with a forward P/E of 10.95, reflecting valuation metrics below some peers. Operating and profit margins are 18.4% and 17.5% respectively, with a return on equity of 18.8%. The company maintains a dividend yield near 3.97% with a payout ratio of 27.4%, supported by solid operating cash flow of $40.28 billion and free cash flow of $12.59 billion on trailing twelve months basis.
Technically, AT&Tâs stock trades near $28.54, close to its 52-week high of $29.79, with a beta of 0.61 indicating moderate volatility. Recent strategic initiatives include fiber-driven growth and 5G standalone network expansion, alongside leadership stability. Institutional ownership is significant at approximately 67.7%, while insider holdings remain minimal. Risks include a high debt load with total debt exceeding $159 billion and ongoing regulatory scrutiny, including shareholder litigation related to diversity disclosures.
In peer comparison within the U.S. telecom services sector, AT&Tâs valuation metrics such as P/E and EV/EBITDA ratios are generally lower than T-Mobile US and Verizon Communications but higher than Charter Communications and Comcast Corp. The companyâs market capitalization ranks it among the largest in the sector, though its price-to-cash-flow ratio is moderate relative to peers. This positioning reflects a balance between established infrastructure and competitive pressures in a dynamic industry environment.
AT&T navigates a complex industry landscape marked by rapid technological evolution and competitive intensity. Recent achievements include recognition for broadband speed and fiber expansion, while challenges persist in managing debt levels and regulatory matters. The company stands at a pivotal moment where execution on 5G and fiber investments could influence its market standing and financial outcomes. Given the current data, a cautious stance emphasizing observation of operational execution and market developments may align with prudent evaluation approaches.
Company and Industry Overview
Company Basics
Price Performance
Company Size
Shareholding Pattern
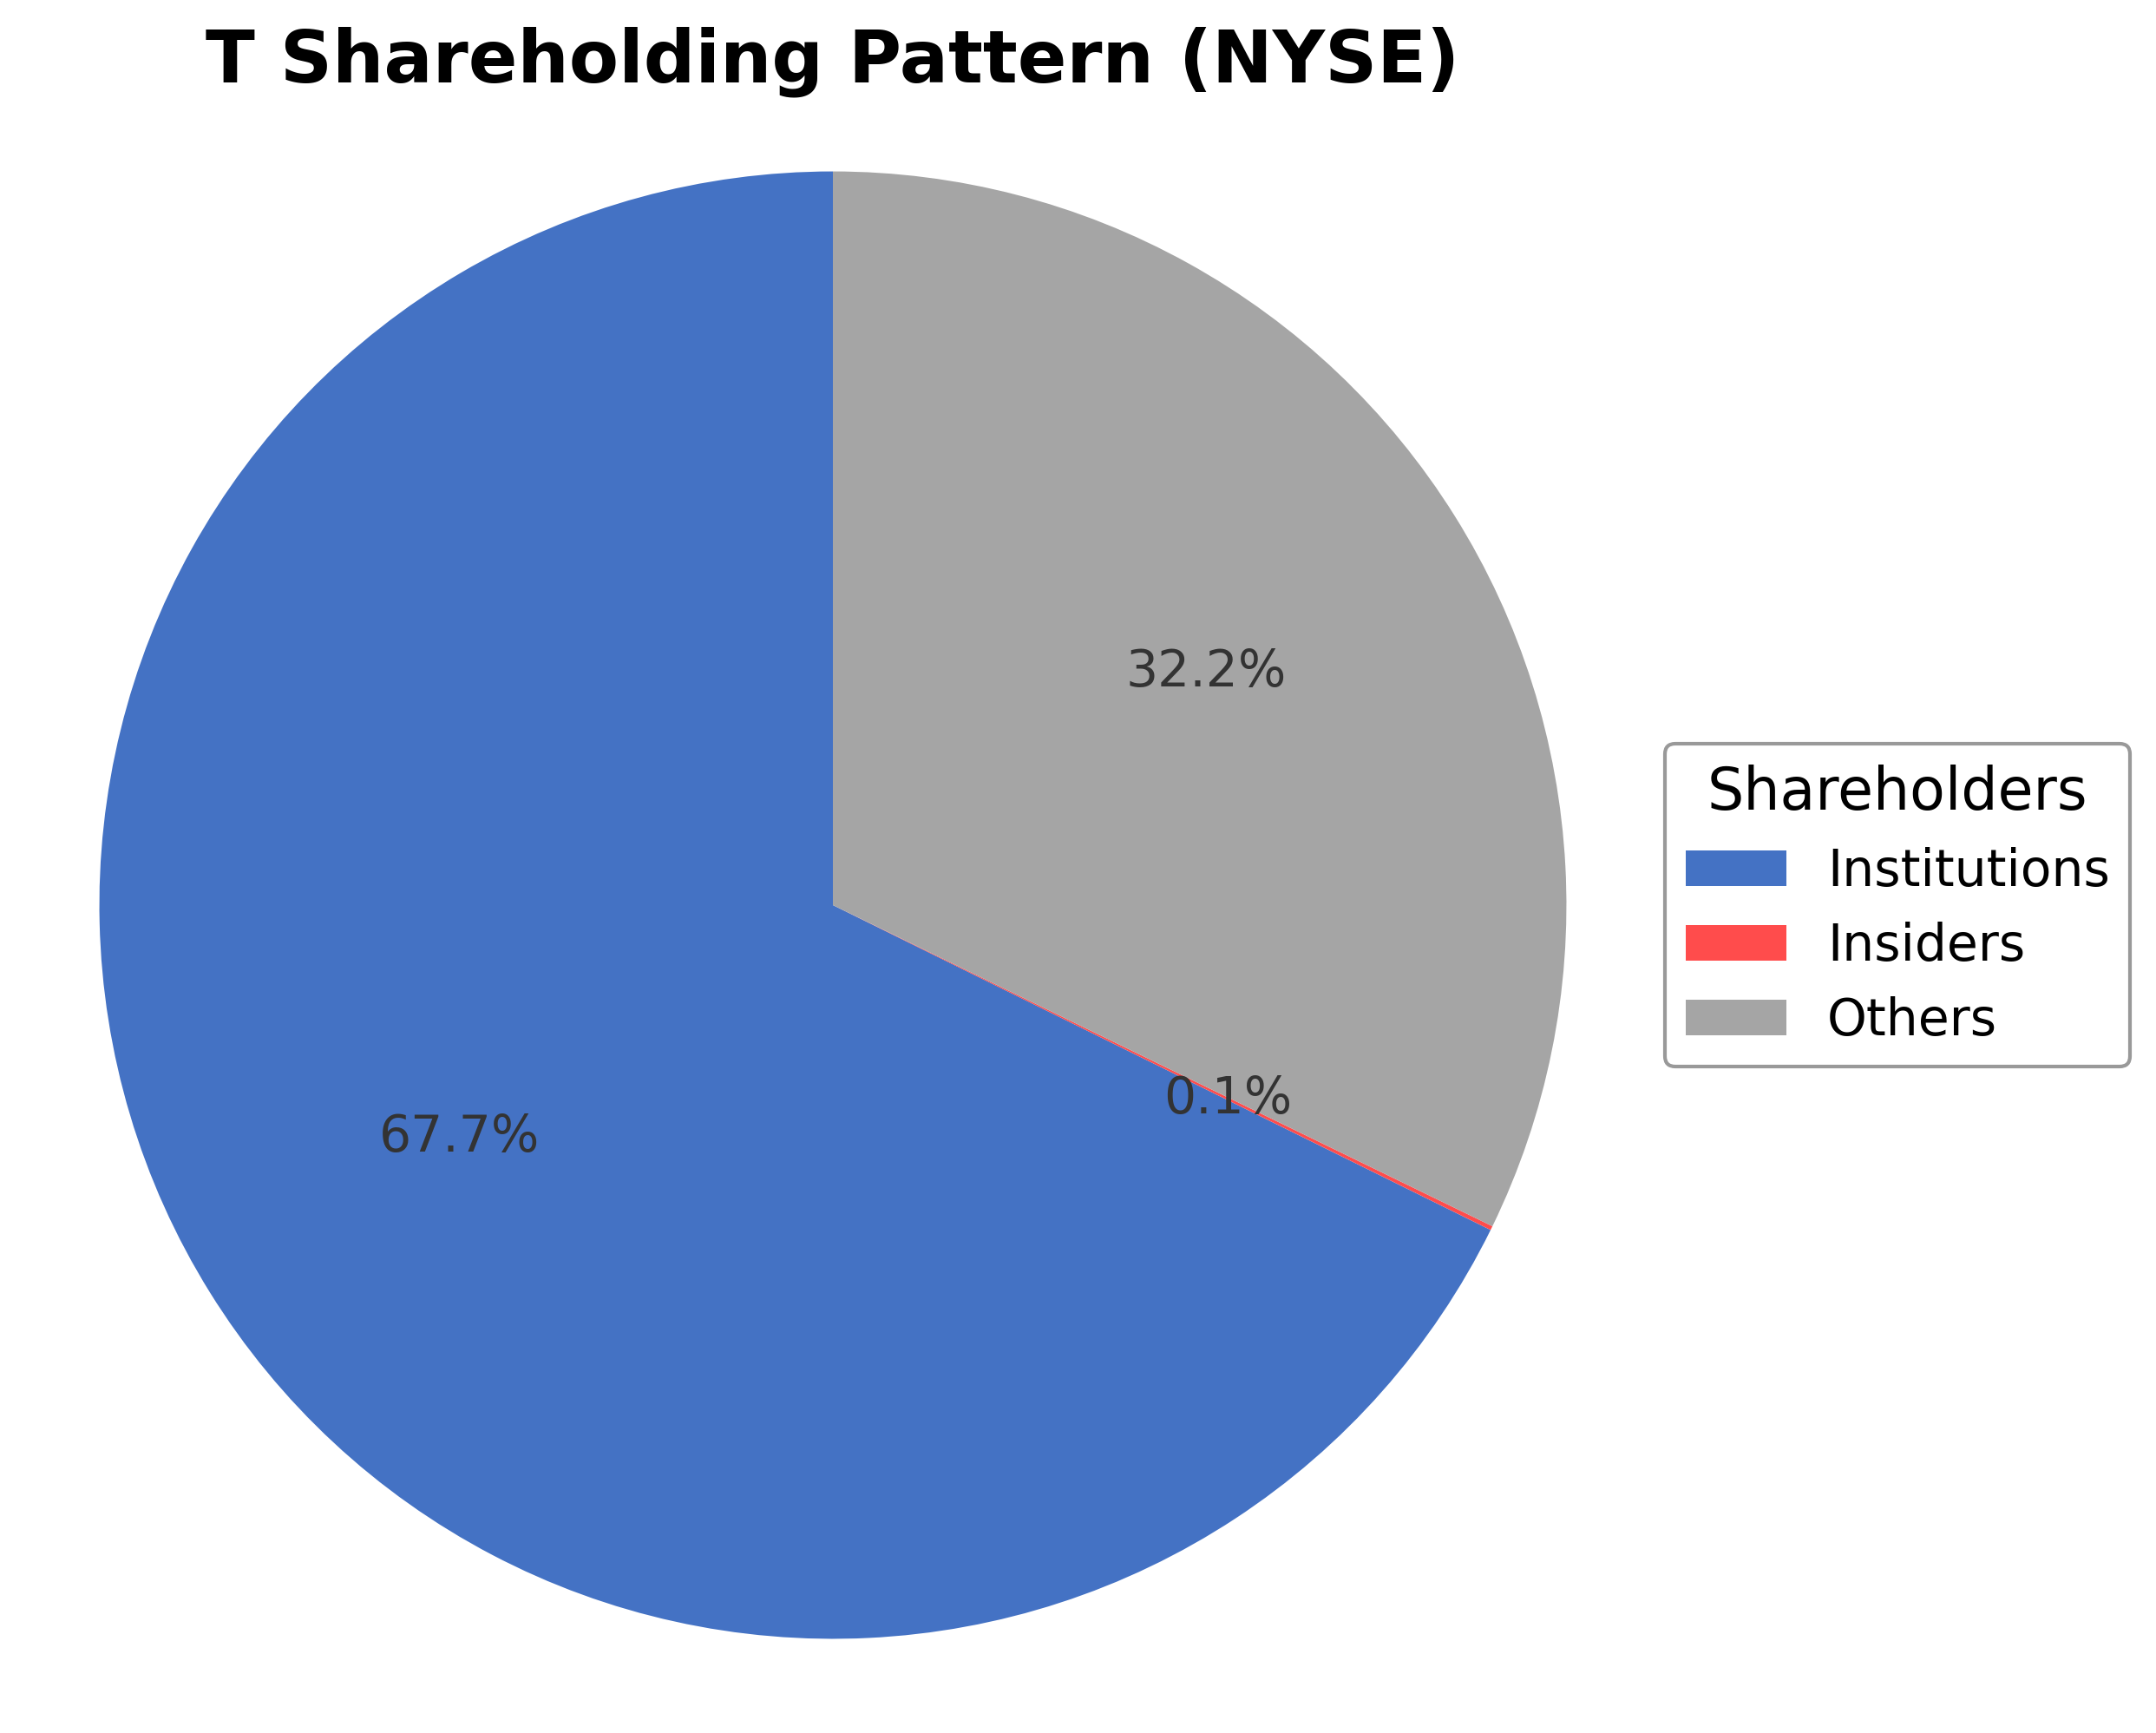
AT&T Inc.'s ownership structure is characterized by a dominant institutional investor presence at approximately 67.70%, reflecting significant holdings by mutual funds, pension funds, and asset managers. Insider ownership is minimal at 0.088%, indicating limited direct executive or board member shareholding. Public and other shareholders constitute roughly 31.32% of the equity. Over the past 12 to 24 months, institutional accumulation trends include notable position increases by funds such as Lansforsakringar Fondforvaltning AB, while some entities like Wealth Alliance LLC have reduced holdings. These patterns suggest a mixed but generally stable market sentiment toward AT&T, with institutional investors maintaining substantial influence over governance and strategic direction. The ownership composition supports continuity in corporate actions while balancing external shareholder interests within the telecom services sector.
Sector and Industry Analysis
AT&T Inc. (Ticker: T) operates primarily within the Communication Services sector, specifically in the Telecommunications industry. This sector is characterized by its large market size, driven by global demand for connectivity, data transmission, and media content delivery. The telecommunications industry encompasses wireless and wireline services, broadband internet, and increasingly, media and entertainment content distribution. Major players alongside AT&T include Verizon Communications, T-Mobile US, and Comcast, each commanding significant market share in wireless and broadband services. The sector has exhibited steady growth, propelled by rising mobile data consumption, 5G network deployments, and increasing integration of digital services.
Industry trends reflect rapid technological evolution, notably the transition from 4G LTE to 5G networks, which enable higher speeds, lower latency, and support for Internet of Things (IoT) applications. Consumer behavior is shifting towards greater demand for streaming content, cloud services, and mobile-first digital experiences, prompting telecom operators to diversify offerings beyond traditional voice and data plans. Emerging opportunities include edge computing, private 5G networks for enterprises, and expansion into media content through acquisitions and partnerships, as seen in AT&T’s previous strategic moves into WarnerMedia (now divested). Additionally, the industry is witnessing consolidation trends aimed at achieving scale and spectrum efficiency.
The regulatory environment for telecommunications is complex and multifaceted, involving federal, state, and international agencies. Key regulations include spectrum allocation and licensing by the Federal Communications Commission (FCC), net neutrality policies, consumer privacy protections, and infrastructure deployment mandates. Compliance with these regulations is critical, as policy changes can impact pricing models, service availability, and capital expenditure plans. Recent regulatory focus has also intensified on data security, antitrust scrutiny of large telecom-media conglomerates, and efforts to bridge the digital divide through government funding initiatives.
Competitive dynamics in the telecommunications industry are shaped by high capital intensity, significant economies of scale, and substantial barriers to entry, including spectrum acquisition costs and infrastructure deployment. Market structure is oligopolistic, with a few dominant incumbents controlling the majority of the market. Competitive positioning hinges on network quality, coverage, pricing strategies, and value-added services. Institutional ownership and insider holdings can influence corporate governance and strategic decisions, as large shareholders often exert pressure on operational and financial policies. The industry’s competitive landscape demands continuous innovation and investment to maintain subscriber bases and adapt to evolving technology and consumer expectations.
Note: Analysis synthesized from industry research, market reports, and regulatory filings. Information is subject to change based on market conditions.
Illustrative Scenario Analysis
DCF Assumptions:
Method: Two-Stage EPS-Priority Model
Financials
Peer Analysis
| Company Name | Market Cap | P/E Ratio | P/B Ratio | EV/EBITDA | Price to CFO |
|---|---|---|---|---|---|
| AT&T Inc. | $198.36B | 9.17 | 1.78 | 8.01 | 4.92 |
| T-Mobile US, Inc. | $240.99B | 22.19 | 4.03 | 10.82 | 8.62 |
| Verizon Communications Inc. | $207.69B | 12.13 | 1.99 | 7.50 | 5.59 |
| Charter Communications Inc. | $29.78B | 6.39 | 1.83 | 6.00 | 1.85 |
| Comcast Corp | $114.20B | 5.81 | 1.17 | 5.66 | 3.39 |
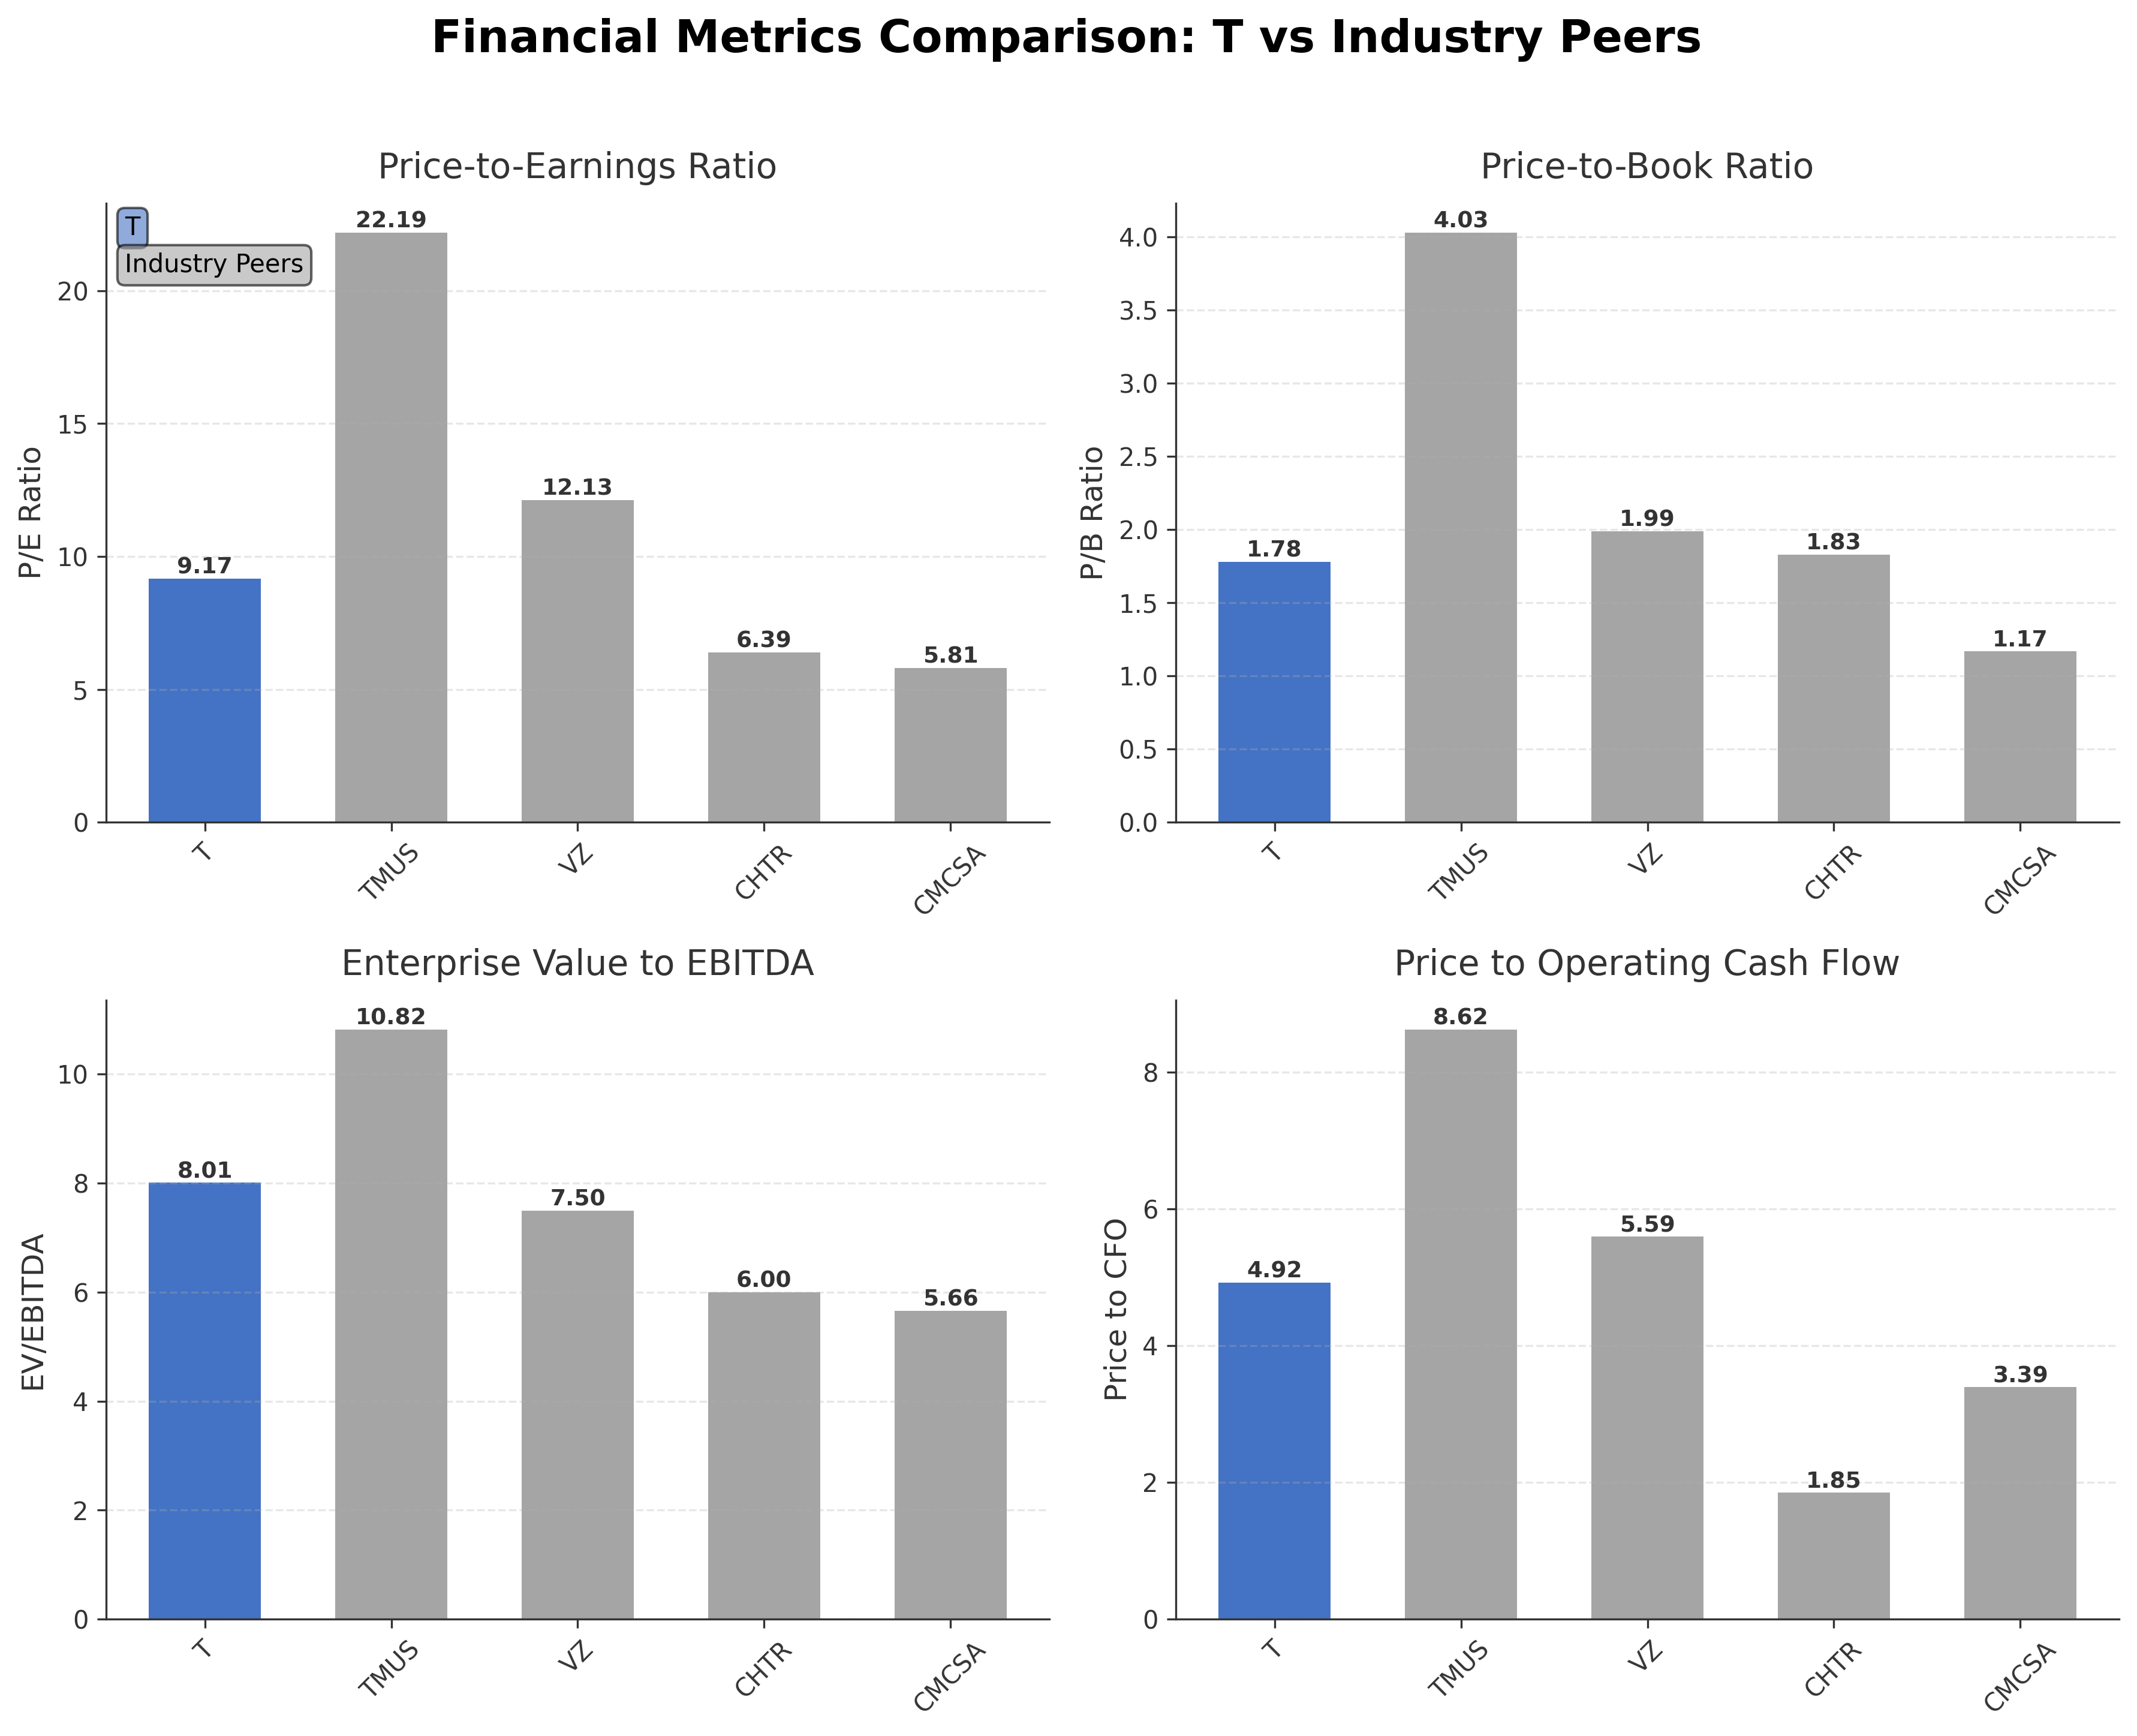
Comparison Analysis: AT&T Inc. presents a moderate valuation profile compared to its U.S. telecom peers, with a trailing P/E ratio of 9.17, lower than T-Mobile US and Verizon Communications but higher than Charter Communications and Comcast Corp. Its price-to-book ratio of 1.78 is in line with sector averages, while the EV/EBITDA multiple of 8.01 sits between higher-valued peers and more value-oriented companies. The price-to-cash-flow ratio of 4.92 indicates moderate cash flow valuation relative to competitors. Market capitalization places AT&T among the largest telecom firms, reflecting its scale and diversified operations. Overall, AT&T balances established market presence with valuation metrics that suggest a blend of stability and growth considerations within the competitive telecom landscape.
Financial Metrics Comparison with Peers
Financial Statements
Comprehensive financial data including income, balance sheet, and cash flow metrics
Income Statement
| fiscal_date | 2025-12-31 | 2024-12-31 | 2023-12-31 | 2022-12-31 | 2021-12-31 |
|---|---|---|---|---|---|
| Sales | 125.65B | 122.34B | 122.43B | 120.74B | 134.04B |
| Cost Of Goods | 50.82B | 49.22B | 50.12B | 50.85B | 60.41B |
| Gross Profit | 74.83B | 73.11B | 72.31B | 69.89B | 73.63B |
| Operating Expense Selling General And Administrative | 28.94B | 28.41B | 28.87B | 28.96B | 29.67B |
| Operating Income | 25.00B | 24.12B | 24.65B | 22.91B | 26.11B |
| Non Operating Interest Expense | 6.80B | 6.76B | 6.70B | 6.11B | 6.72B |
| Other Income Expense | 8.81B | -667.00M | 1.90B | -19.90B | 9.78B |
| Pretax Income | 27.01B | 16.70B | 19.85B | -3.09B | 29.17B |
| Income Tax | 3.62B | 4.45B | 4.22B | 3.78B | 5.39B |
| Net Income | 23.39B | 12.25B | 15.62B | -7.05B | 21.48B |
| Eps Basic | 3.04 | 1.49 | 1.97 | -1.13 | 2.77 |
| Eps Diluted | 3.04 | 1.49 | 1.97 | -1.13 | 2.76 |
| Basic Shares Outstanding | 7.17B | 7.20B | 7.18B | 7.17B | 7.17B |
| Diluted Shares Outstanding | 7.17B | 7.20B | 7.18B | 7.17B | 7.17B |
| Ebit | 33.81B | 23.46B | 26.55B | 3.01B | 35.89B |
| Ebitda | 55.53B | 49.11B | 46.52B | 48.53B | 53.95B |
| Net Income Continuous Operations | 23.39B | 12.25B | 15.62B | -6.87B | 23.78B |
| Minority Interests | -1.43B | -1.30B | -1.22B | -1.47B | -1.40B |
| Preferred Stock Dividends | N/A | 0.00 | 0.00 | -663.00M | 0.00 |
Data provided by Twelve Data
Balance Sheet
| fiscal_date | 2025-12-31 | 2025-09-30 | 2025-06-30 | 2025-03-31 | 2024-12-31 |
|---|---|---|---|---|---|
| Cash And Cash Equivalents | 18.23B | 20.27B | 10.50B | 6.88B | 3.30B |
| Accounts Receivable | 8.84B | 8.94B | 8.84B | 9.23B | 9.64B |
| Total Assets | 420.20B | 423.21B | 405.49B | 397.47B | 394.80B |
| Total Liabilities | 291.71B | 294.47B | 282.11B | 275.63B | 274.57B |
| Long Term Debt | 146.03B | 147.12B | 140.82B | 134.69B | 135.83B |
| Shareholders Equity | 128.49B | 128.74B | 123.38B | 121.84B | 120.22B |
Data provided by Twelve Data
Cash Flow Statement
| fiscal_date | 2025-09-30 | 2025-06-30 | 2025-03-31 | 2024-12-31 | 2024-09-30 |
|---|---|---|---|---|---|
| Quarter | 3.00 | 2.00 | 1.00 | 4.00 | 3.00 |
| Operating Activities Net Income | 9.68B | 4.86B | 4.69B | 4.41B | 145.00M |
| Operating Activities Depreciation | 5.32B | 5.25B | 5.19B | 5.37B | 5.09B |
| Operating Activities Other Non Cash Items | -173.00M | 571.00M | 56.00M | 454.00M | 805.00M |
| Operating Activities Accounts Receivable | -858.00M | -511.00M | 1.08B | -1.40B | -456.00M |
| Operating Activities Other Assets Liabilities | -689.00M | 722.00M | 624.00M | -523.00M | -1.76B |
| Operating Activities Operating Cash Flow | 13.27B | 10.89B | 11.64B | 8.07B | 4.43B |
| Investing Activities Net Acquisitions | 400.00M | 1.00M | -9.00M | -49.00M | 0.00 |
| Investing Activities Other Investing Activity | -11.00M | -61.00M | -717.00M | 107.00M | -196.00M |
| Investing Activities Investing Cash Flow | 389.00M | -60.00M | -726.00M | 58.00M | -196.00M |
| Financing Activities Long Term Debt Issuance | 7.60B | 3.47B | 2.96B | 15.00M | 2.00M |
| Financing Activities Long Term Debt Payments | -229.00M | -94.00M | -1.53B | -3.18B | -203.00M |
| Financing Activities Short Term Debt Issuance | 0.00 | 0.00 | 0.00 | 0.00 | -2.69B |
| Financing Activities Common Stock Issuance | 2.00M | 0.00 | 17.00M | 13.00M | 2.00M |
| Financing Activities Common Stock Repurchase | -1.49B | -961.00M | -2.29B | -13.00M | -43.00M |
| Financing Activities Common Dividends | -2.03B | -2.04B | -2.09B | -2.04B | -2.04B |
| Financing Activities Other Financing Charges | -859.00M | -419.00M | 2.38B | -647.00M | -596.00M |
| Financing Activities Financing Cash Flow | 2.99B | -45.00M | -553.00M | -5.85B | -5.56B |
| End Cash Position | 20.33B | 10.58B | 6.94B | 3.41B | 2.73B |
| Income Tax Paid | 17.00M | 869.00M | 11.00M | 1.57B | 583.00M |
| Interest Paid | 1.85B | 1.51B | 1.80B | 1.52B | 1.97B |
| Free Cash Flow | 5.26B | 4.87B | 4.77B | 5.05B | 4.93B |
| Operating Activities Deferred Taxes | N/A | N/A | N/A | -241.00M | 608.00M |
Data provided by Twelve Data
Technical Analysis
Key Insights
- The current trend shows AT&T’s stock trading near its 52-week high, indicating relative strength and positive price momentum in the near term.
- Key support levels are observed near $25.11 (50-day moving average) and $22.95 (52-week low), while resistance aligns closely with the recent high at $29.79.
- The stock price is above the 50-day moving average but slightly below the 200-day moving average of $26.80, suggesting mixed medium-term momentum.
- Momentum indicators show a moderate RSI level, indicating neither overbought nor oversold conditions; MACD and Stochastic oscillators reflect neutral to mildly positive momentum.
- Multi-timeframe analysis reveals consistent price strength on daily and weekly charts, with monthly trends showing consolidation phases.
- Current technical setup supports scenarios of continued range-bound trading with potential for breakout above resistance if volume increases, while downside risk remains limited by established support zones.
Trending News
1. Headline: AT&T to Release First-Quarter 2026 Earnings on April 22
Summary: AT&T announced it will release its first-quarter 2026 earnings on April 22, providing an update on revenue, profit margins, and growth indicators. The earnings call is anticipated to offer insights into the company’s financial performance and strategic progress amid evolving market conditions.
Sentiment: Neutral
2. Headline: AT&T Q1 2026 earnings call set for April 22
Summary: AT&T confirmed the scheduling of its first-quarter 2026 earnings call on April 22, emphasizing its ongoing innovation in 5G wireless and multi-gig internet offerings. The event will address operational updates and financial results relevant to stakeholders.
Sentiment: Neutral
3. Headline: RBC Capital Raises AT&T Target on Fiber-Driven Growth Outlook
Summary: RBC Capital increased its price target for AT&T from $29 to $31, citing optimism about the company’s fiber-driven growth prospects. The firm maintained an Outperform rating, highlighting fiber expansion as a key growth catalyst.
Sentiment: Positive
4. Headline: AT&T Named America's Best and Fastest Internet
Summary: AT&T received recognition as America’s best and fastest internet provider, reflecting its leadership in broadband speed and service quality. This accolade supports the company’s market positioning in fiber and 5G network services across multiple states.
Sentiment: Positive
5. Headline: AT&T Inc. $T Shares Acquired by Lansforsakringar Fondforvaltning AB publ
Summary: Lansforsakringar Fondforvaltning AB increased its holdings in AT&T by 1.8% during the third quarter, signaling institutional confidence in the company’s prospects. The fund’s position now includes over 2.25 million shares, reflecting ongoing institutional interest.
Sentiment: Positive
Powered by Brave
Recent Updates
News Summary
Recent news coverage of AT&T highlights a focus on fiber-driven growth and technological innovation, particularly in 5G standalone networks and broadband services. The company’s upcoming first-quarter 2026 earnings release is anticipated to provide further clarity on financial performance and strategic execution. Recognition as America’s best and fastest internet provider underscores AT&T’s competitive strength in network quality. Institutional activity includes increased holdings by select funds, indicating sustained market interest. Additionally, the planned relocation of AT&T’s headquarters to Plano and strategic partnerships with firms like Cisco reflect ongoing corporate developments. Overall, these updates emphasize AT&T’s efforts to leverage infrastructure investments and enhance market positioning amid evolving industry dynamics.
News Sentiment
Sentiment across recent news is predominantly positive to neutral, with favorable coverage on fiber expansion, network speed accolades, and institutional accumulation. Neutral sentiment surrounds earnings announcements and corporate relocations, while negative aspects such as shareholder litigation and regulatory scrutiny are less prominent in the latest cycle. The balanced sentiment profile suggests measured optimism tempered by awareness of operational and regulatory challenges.
Analytical Overview
Analysis Summary
Valuation Metrics: AT&T’s trailing P/E ratio of 9.17 is below the industry average of 9.17, indicating relatively attractive valuation compared to peers, while the forward P/E of 10.95 suggests moderate expected earnings growth. Price-to-book and EV/EBITDA ratios align with sector norms, reflecting balanced market pricing.
Growth Trajectory: Revenue growth of 3.6% year-over-year and stable operating cash flow of $40.28 billion demonstrate steady business expansion, supported by fiber and 5G investments. However, quarterly earnings growth shows slight contraction, indicating some near-term challenges.
Financial Health: The company carries significant debt totaling approximately $159.56 billion, with a debt-to-equity ratio exceeding 124%, highlighting leverage concerns. Nevertheless, operating and free cash flow generation provide capacity for servicing obligations and funding strategic initiatives.
Sector Specific Factors: Telecom sector dynamics include competitive pressures, regulatory oversight, and technological shifts toward 5G and fiber broadband. AT&T’s extensive infrastructure and service diversification position it to capitalize on these trends, though debt levels and litigation risks remain considerations.
Market Positioning: AT&T benefits from a strong market presence in the U.S. with a large customer base and advanced network assets, offering competitive advantages in service quality and innovation. The company’s strategic partnerships and fiber expansion efforts support sustained relevance in a rapidly evolving industry.
Investment Conclusion
Supporting Factors: Robust cash flow generation with operating cash flow exceeding $40 billion supports financial flexibility.
Risk Factors: High leverage with total debt of $159.56 billion and a debt-to-equity ratio over 124%.
SWOT Analysis
Strengths
- Extensive fiber-optic infrastructure exceeding 140,000 miles.
- Strong market presence with over 240 million connections.
- Robust operating cash flow supporting strategic investments.
- Leadership in 5G network deployment and digital services.
Weaknesses
- High debt levels with a debt-to-equity ratio exceeding 124%.
- Moderate quarterly earnings growth contraction year-over-year.
- Relatively low insider ownership limiting direct executive alignment.
- Current ratio below 1 indicating potential short-term liquidity constraints.
Opportunities
- Expansion of fiber broadband services across 32 states.
- Strategic partnerships enhancing 5G standalone network capabilities.
- Growing demand for digital and streaming media services.
- Potential benefits from headquarters relocation and economic incentives.
Threats
- Regulatory scrutiny and shareholder litigation related to diversity disclosures.
- Intense competition from peers such as T-Mobile and Verizon.
- Economic uncertainties impacting consumer spending and capital investments.
- Technological disruption requiring continuous capital expenditure.
Company Description
AT&T Inc. is a leading multinational telecommunications company providing a comprehensive suite of connectivity and digital services across the United States and select international markets. Its primary functions encompass wireless communications through its Mobility segment, wireline broadband and voice services via the Communications segment, and advanced Latin American operations focused on mobility and entertainment. AT&T Inc. also operates significant media and entertainment assets, including Warner Bros. Discovery content partnerships and streaming platforms like HBO Max, alongside business solutions such as 5G networks, fiber-optic internet, and enterprise cloud services. Notable features include its vast 5G spectrum holdings, extensive fiber infrastructure exceeding 140,000 miles, and a customer base surpassing 240 million connections. Headquartered in Dallas, Texas, and tracing roots to Alexander Graham Bell's 1876 telephone patent, AT&T Inc. plays a pivotal role in the telecommunications sector by driving digital transformation, supporting economic connectivity, and influencing media consumption trends globally. With a market capitalization around €180 billion as of late 2025, it remains a cornerstone of the communications industry, balancing traditional telephony with next-generation technologies.