
AstraZeneca PLC (AZN)
Stock Analysis Report
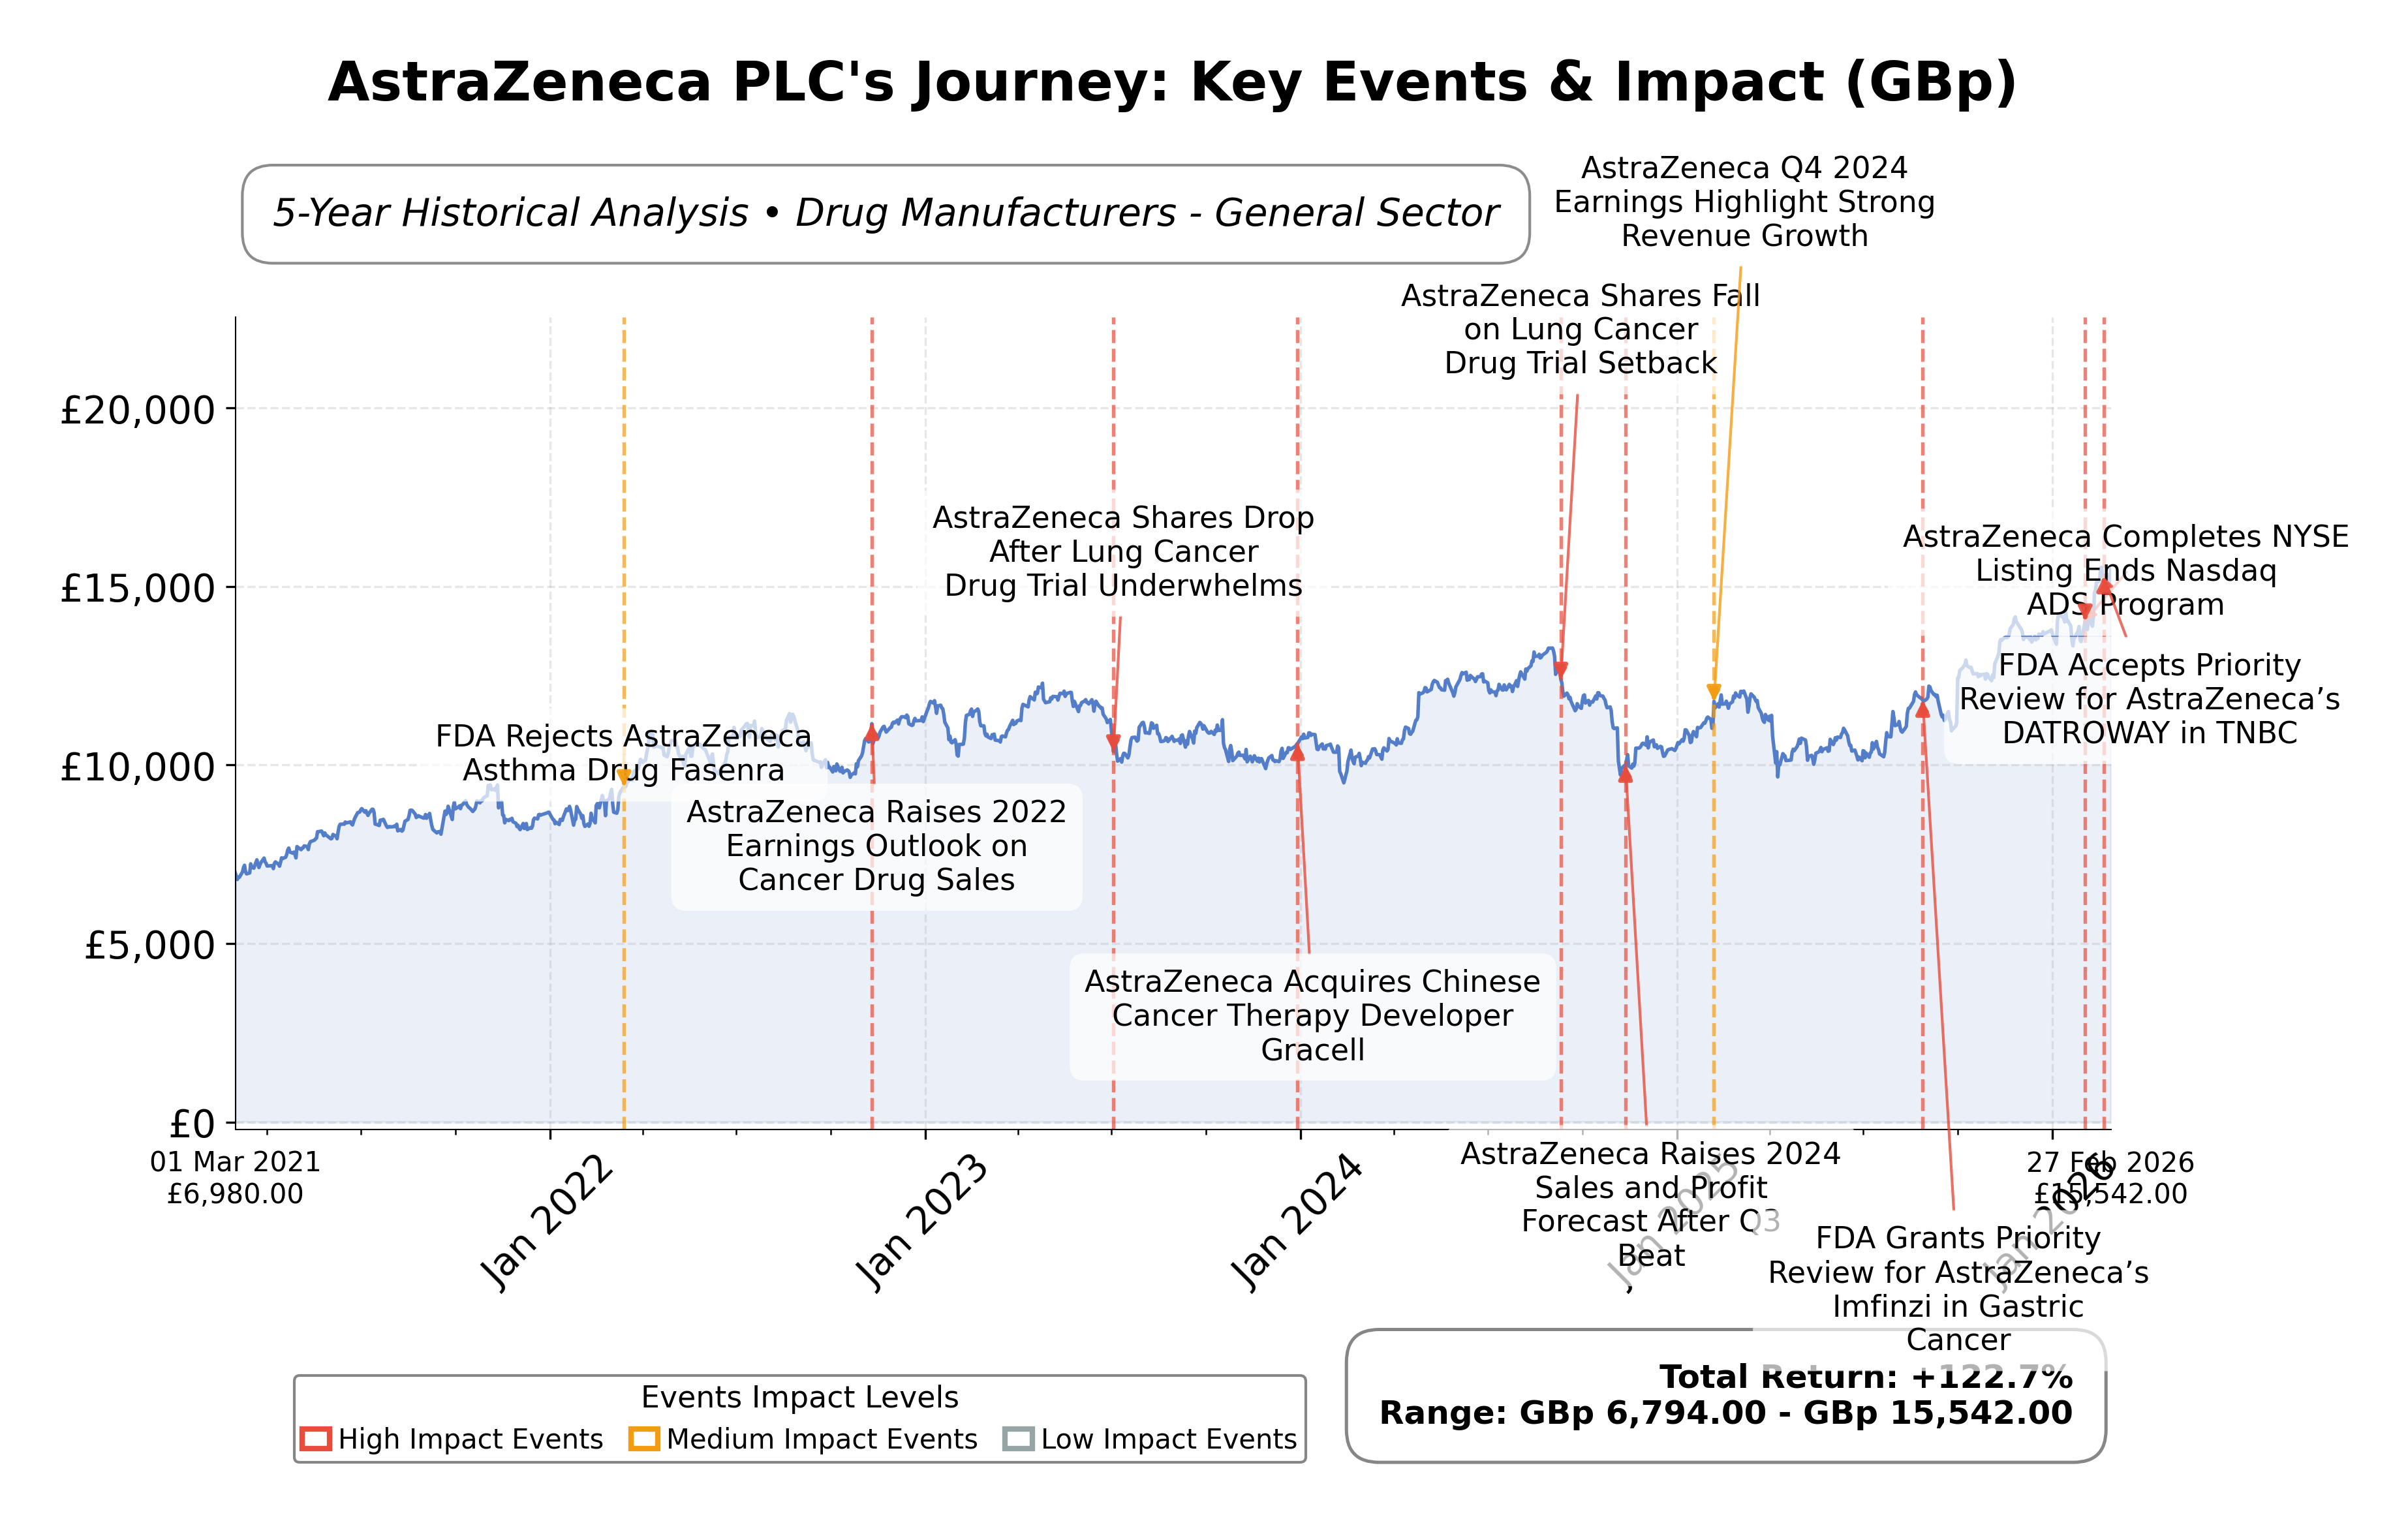
Stock Journey
Key Positives and Key Risks
Pros
- Earnings growth of 55.1% year-over-year demonstrates strong profitability momentum.
- Operating cash flow of £10.83 billion and free cash flow of £4.94 billion indicate robust cash generation supporting operations.
- Forward P/E ratio of 17.71 suggests market expectations for continued earnings growth.
Cons
- Price-to-book ratio of 655.04 reflects a high valuation relative to book value, potentially signaling overvaluation.
- Current ratio of 0.938 indicates liquidity below the standard benchmark of 1, suggesting short-term financial constraints.
- Patent expirations expected around 2030 pose significant revenue risk.
Disclosure: This information is for general awareness and does not constitute investment advice
Report Summary
AstraZeneca PLC is a Swedish-British multinational pharmaceutical and biotechnology company headquartered in the United Kingdom. Operating within the healthcare sector, specifically the drug manufacturing industry, it develops and commercializes innovative prescription medicines across key therapeutic areas such as oncology, cardiovascular, respiratory, immunology, and rare diseases. Established through a merger in 1999, AstraZeneca holds a strong market position with a global footprint spanning 85 countries and a workforce of approximately 90,000 employees.
Financially, AstraZeneca reports a market capitalization of approximately £23.69 trillion GBp with a trailing P/E ratio of 31.81 and a forward P/E of 17.71, indicating valuation metrics that reflect growth expectations. The company demonstrates solid profitability with a profit margin of 17.41% and an operating margin near 19.57%. Its return on equity stands at 22.84%, supported by robust revenue of £43.63 billion GBp and net income of £7.59 billion GBp over the trailing twelve months. AstraZeneca maintains a dividend yield of approximately 1.55% with a payout ratio of 47.91%. The balance sheet shows total assets of about £84.16 billion USD and total debt of £22.06 billion USD, with a current ratio slightly below 1 at 0.938.
From a technical and strategic perspective, AstraZeneca's stock price is near its 52-week high of 15,732 GBp, currently trading at 15,504 GBp, with a modest upside potential of 1.47%. The company has recently completed a strategic move to the New York Stock Exchange and announced a $2 billion bond offering, reflecting active capital management. Institutional ownership stands at approximately 26.61%, with minor insider holdings. Recent news highlights increased institutional accumulation by certain funds, while others have reduced positions, indicating mixed but generally positive market sentiment. Key risks include patent cliffs anticipated by 2030 and competitive pressures in the pharmaceutical sector.
Peer analysis within the drug manufacturing industry and the UK market shows AstraZeneca as a leading entity with a substantial market cap and competitive valuation metrics. Although specific peer data is limited here, AstraZeneca's P/E ratio and return on equity suggest a premium valuation relative to typical industry averages, supported by strong operational performance. Its enterprise value to EBITDA ratio of 13.38 aligns with sector norms, positioning it competitively among regional pharmaceutical companies.
AstraZeneca navigates a complex industry landscape marked by rapid innovation, regulatory scrutiny, and evolving market demands. Recent achievements include strategic listings and capital raises, while challenges such as patent expirations and competitive dynamics persist. The company stands at a pivotal moment where its ongoing R&D investments and portfolio diversification will significantly influence its future trajectory. Given the current financial and market data, a balanced approach that monitors ongoing developments and valuation trends may be appropriate for those evaluating the stock.
Company and Industry Overview
Company Basics
Price Performance
Company Size
Shareholding Pattern
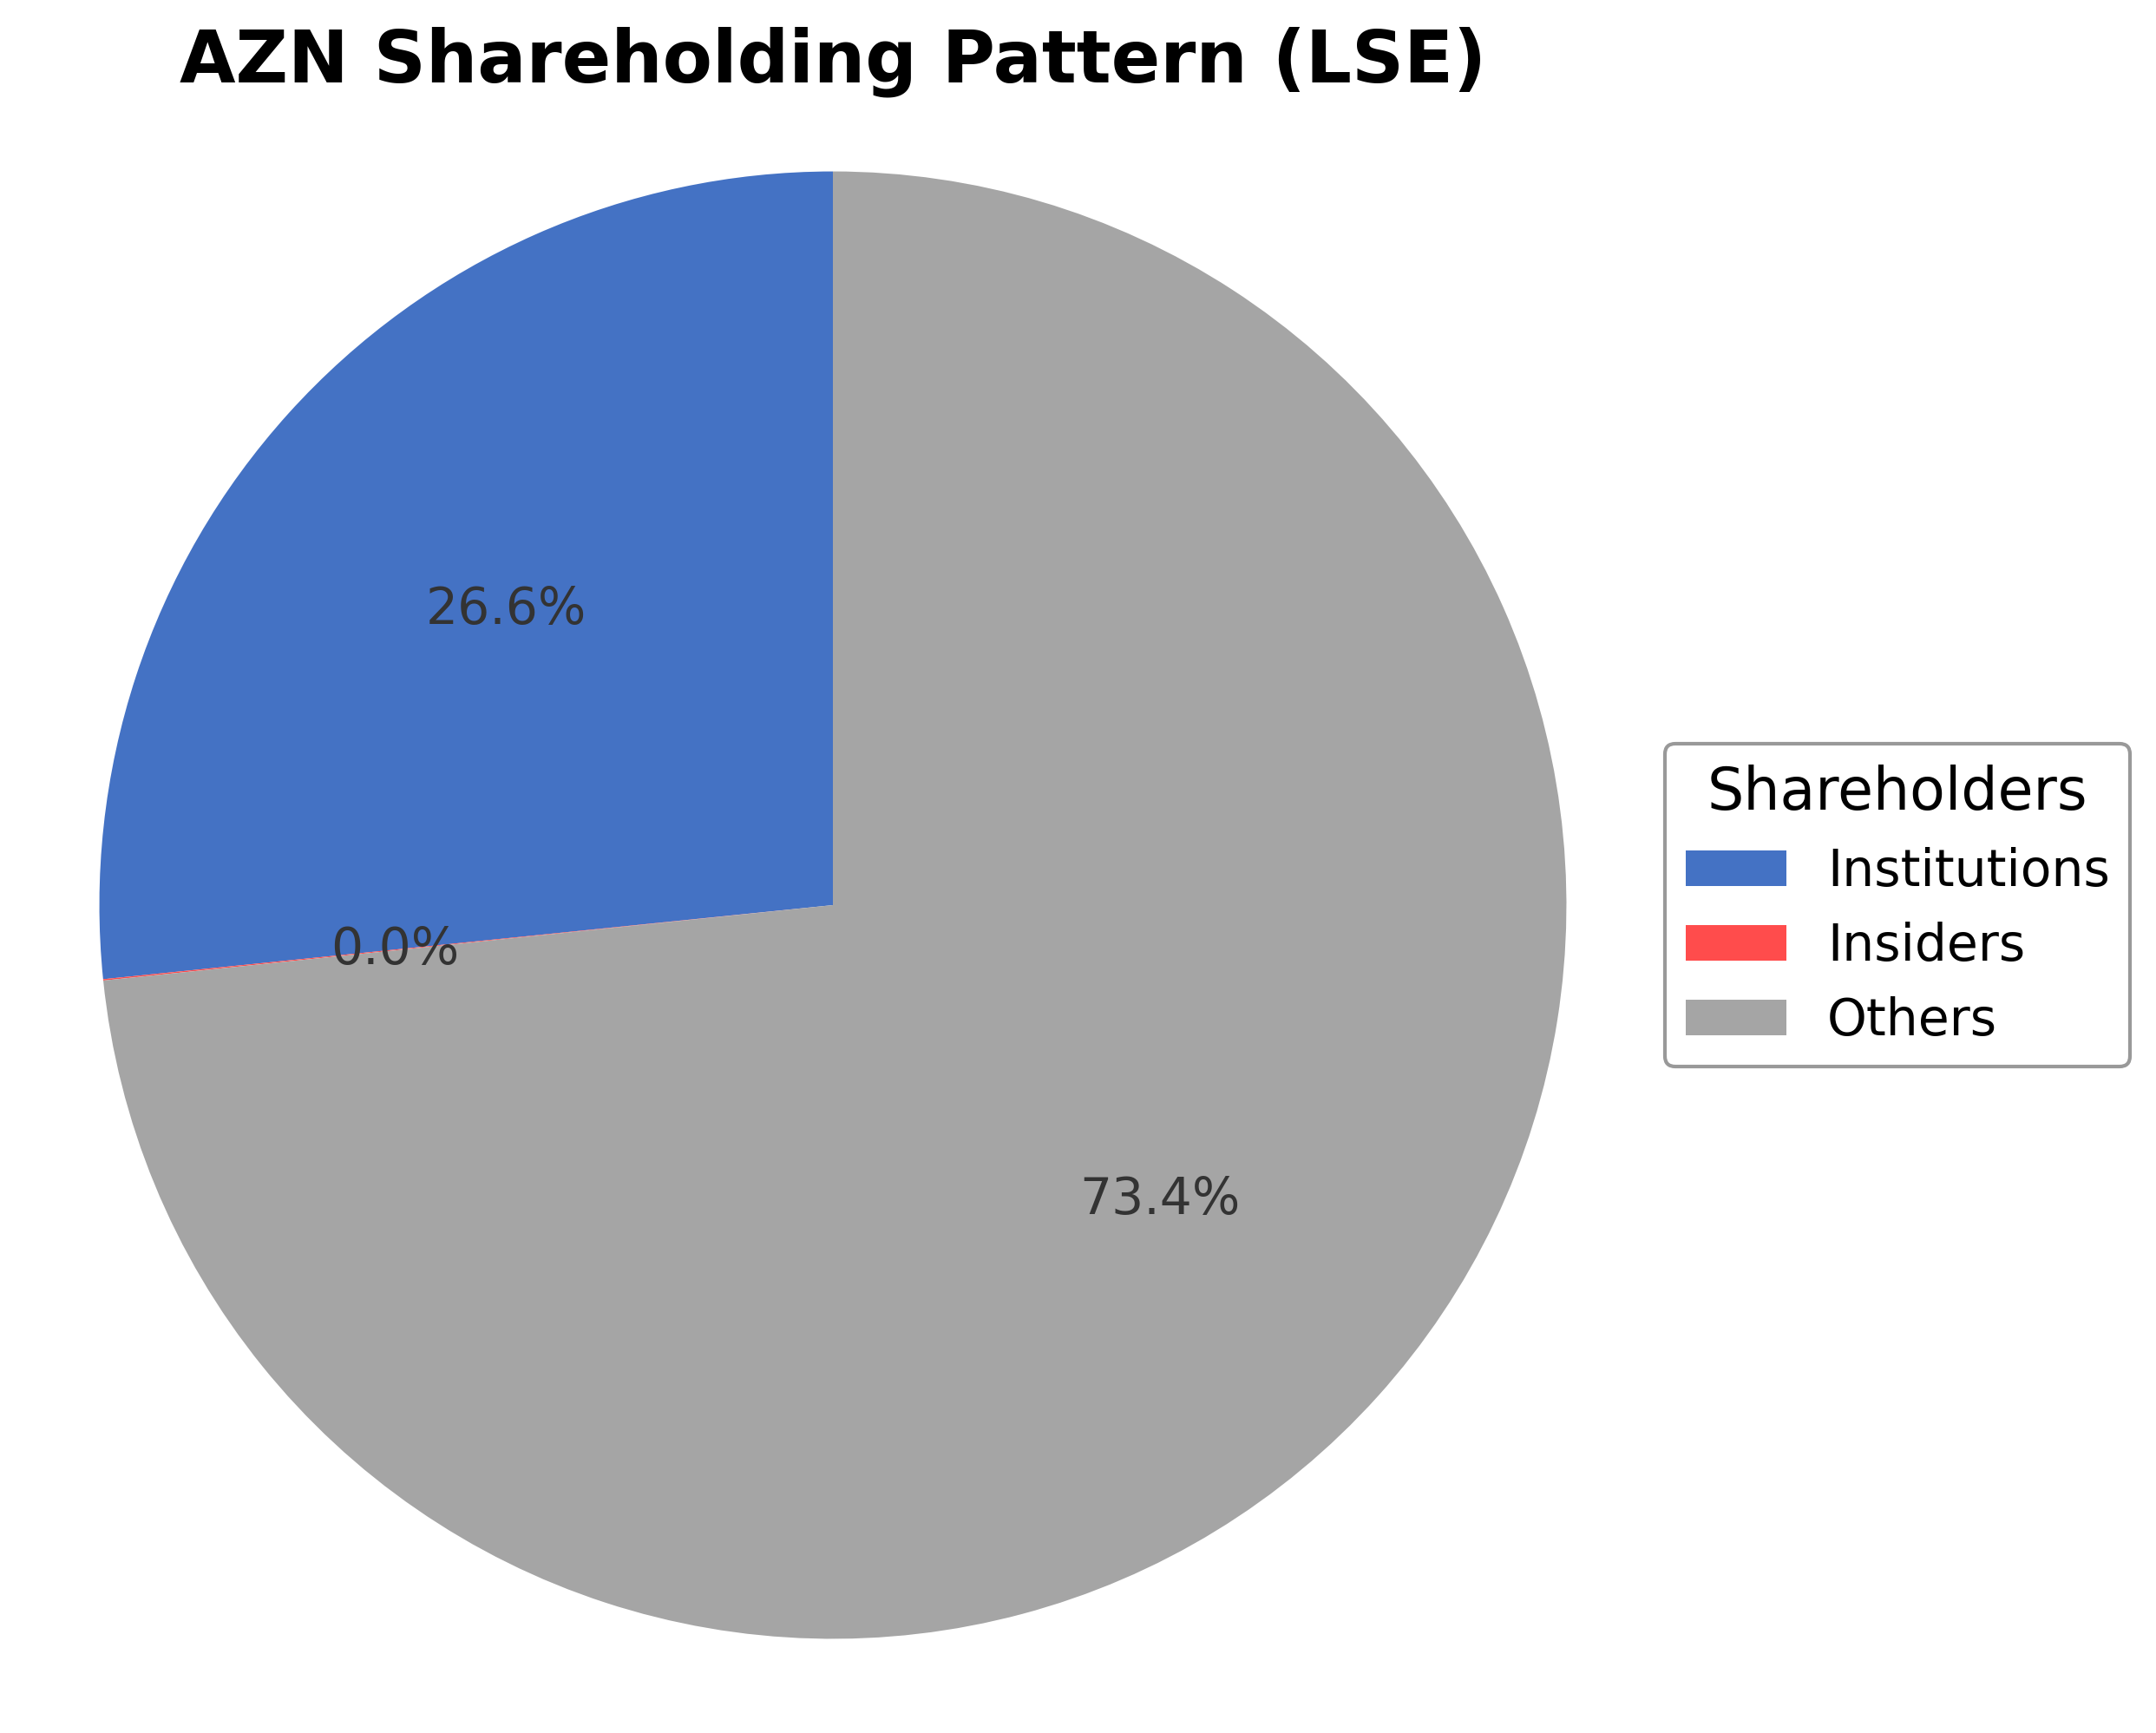
AstraZeneca PLC's ownership structure features a minimal insider holding of approximately 0.03%, reflecting limited direct executive and board member share ownership. Institutional investors hold a significant 26.61% stake, including mutual funds and asset managers, with some funds notably increasing their positions over recent quarters, such as US Bancorp DE and AlphaCore Capital LLC. Public and other shareholders constitute the majority at 73.36%, encompassing retail investors and employee stock plans. This distribution indicates a broad market interest with institutional confidence tempered by some recent reductions in holdings by entities like Harvest Portfolios Group Inc. The ownership pattern suggests a governance framework influenced primarily by institutional shareholders, which may impact strategic decisions and corporate actions within the pharmaceutical industry context.
Sector and Industry Analysis
AstraZeneca PLC operates within the Pharmaceuticals sector, specifically in the global biopharmaceutical industry. This sector is characterized by its substantial market size, with global pharmaceutical sales exceeding $1.5 trillion as of 2024, driven by aging populations, increasing prevalence of chronic diseases, and expanding healthcare access in emerging markets. Key players include multinational corporations such as Pfizer, Johnson & Johnson, Roche, Novartis, and Merck, alongside AstraZeneca, which holds a significant market share particularly in oncology, cardiovascular, renal, and respiratory therapeutic areas. The sector exhibits a steady compound annual growth rate (CAGR) of approximately 5-7%, supported by continuous innovation and rising healthcare expenditures worldwide.
Industry trends reflect rapid technological advancements and evolving consumer expectations. Precision medicine, biologics, and gene therapies are reshaping drug development pipelines, with digital health technologies and artificial intelligence increasingly integrated into R&D and patient monitoring. The COVID-19 pandemic accelerated vaccine development and highlighted the importance of agile manufacturing and supply chains. Additionally, there is a growing emphasis on personalized treatments and real-world evidence to enhance clinical outcomes. Emerging opportunities include expanding biosimilars markets, rare disease therapeutics, and leveraging big data for drug discovery and market access strategies.
The regulatory environment is complex and stringent, governed by agencies such as the U.S. Food and Drug Administration (FDA), European Medicines Agency (EMA), and other national bodies. Compliance requirements encompass rigorous clinical trial protocols, drug safety monitoring, manufacturing quality standards (GMP), and post-market surveillance. Regulatory pathways are evolving to accommodate accelerated approvals, breakthrough therapy designations, and adaptive licensing, aiming to balance patient access with safety. Policy impacts include pricing and reimbursement reforms, intellectual property protections, and increasing scrutiny on drug pricing and marketing practices, which influence market entry strategies and profitability.
Competitive dynamics in the pharmaceutical industry are shaped by high barriers to entry, including substantial R&D costs, long development timelines, and regulatory hurdles. Market structure is oligopolistic, dominated by large, diversified firms with extensive patent portfolios and global distribution networks. AstraZeneca’s competitive positioning benefits from its robust pipeline, strategic collaborations, and focus on specialty medicines. However, generic competition, biosimilar entrants, and patent expirations pose ongoing challenges. Innovation, scale, and regulatory expertise remain critical for sustaining competitive advantage and navigating the evolving healthcare landscape.
Note: Analysis synthesized from industry research, market reports, and regulatory filings. Information is subject to change based on market conditions.
Financials
Peer Analysis
| Company Name | Market Cap | P/E Ratio | P/B Ratio | EV/EBITDA | Price to CFO |
|---|---|---|---|---|---|
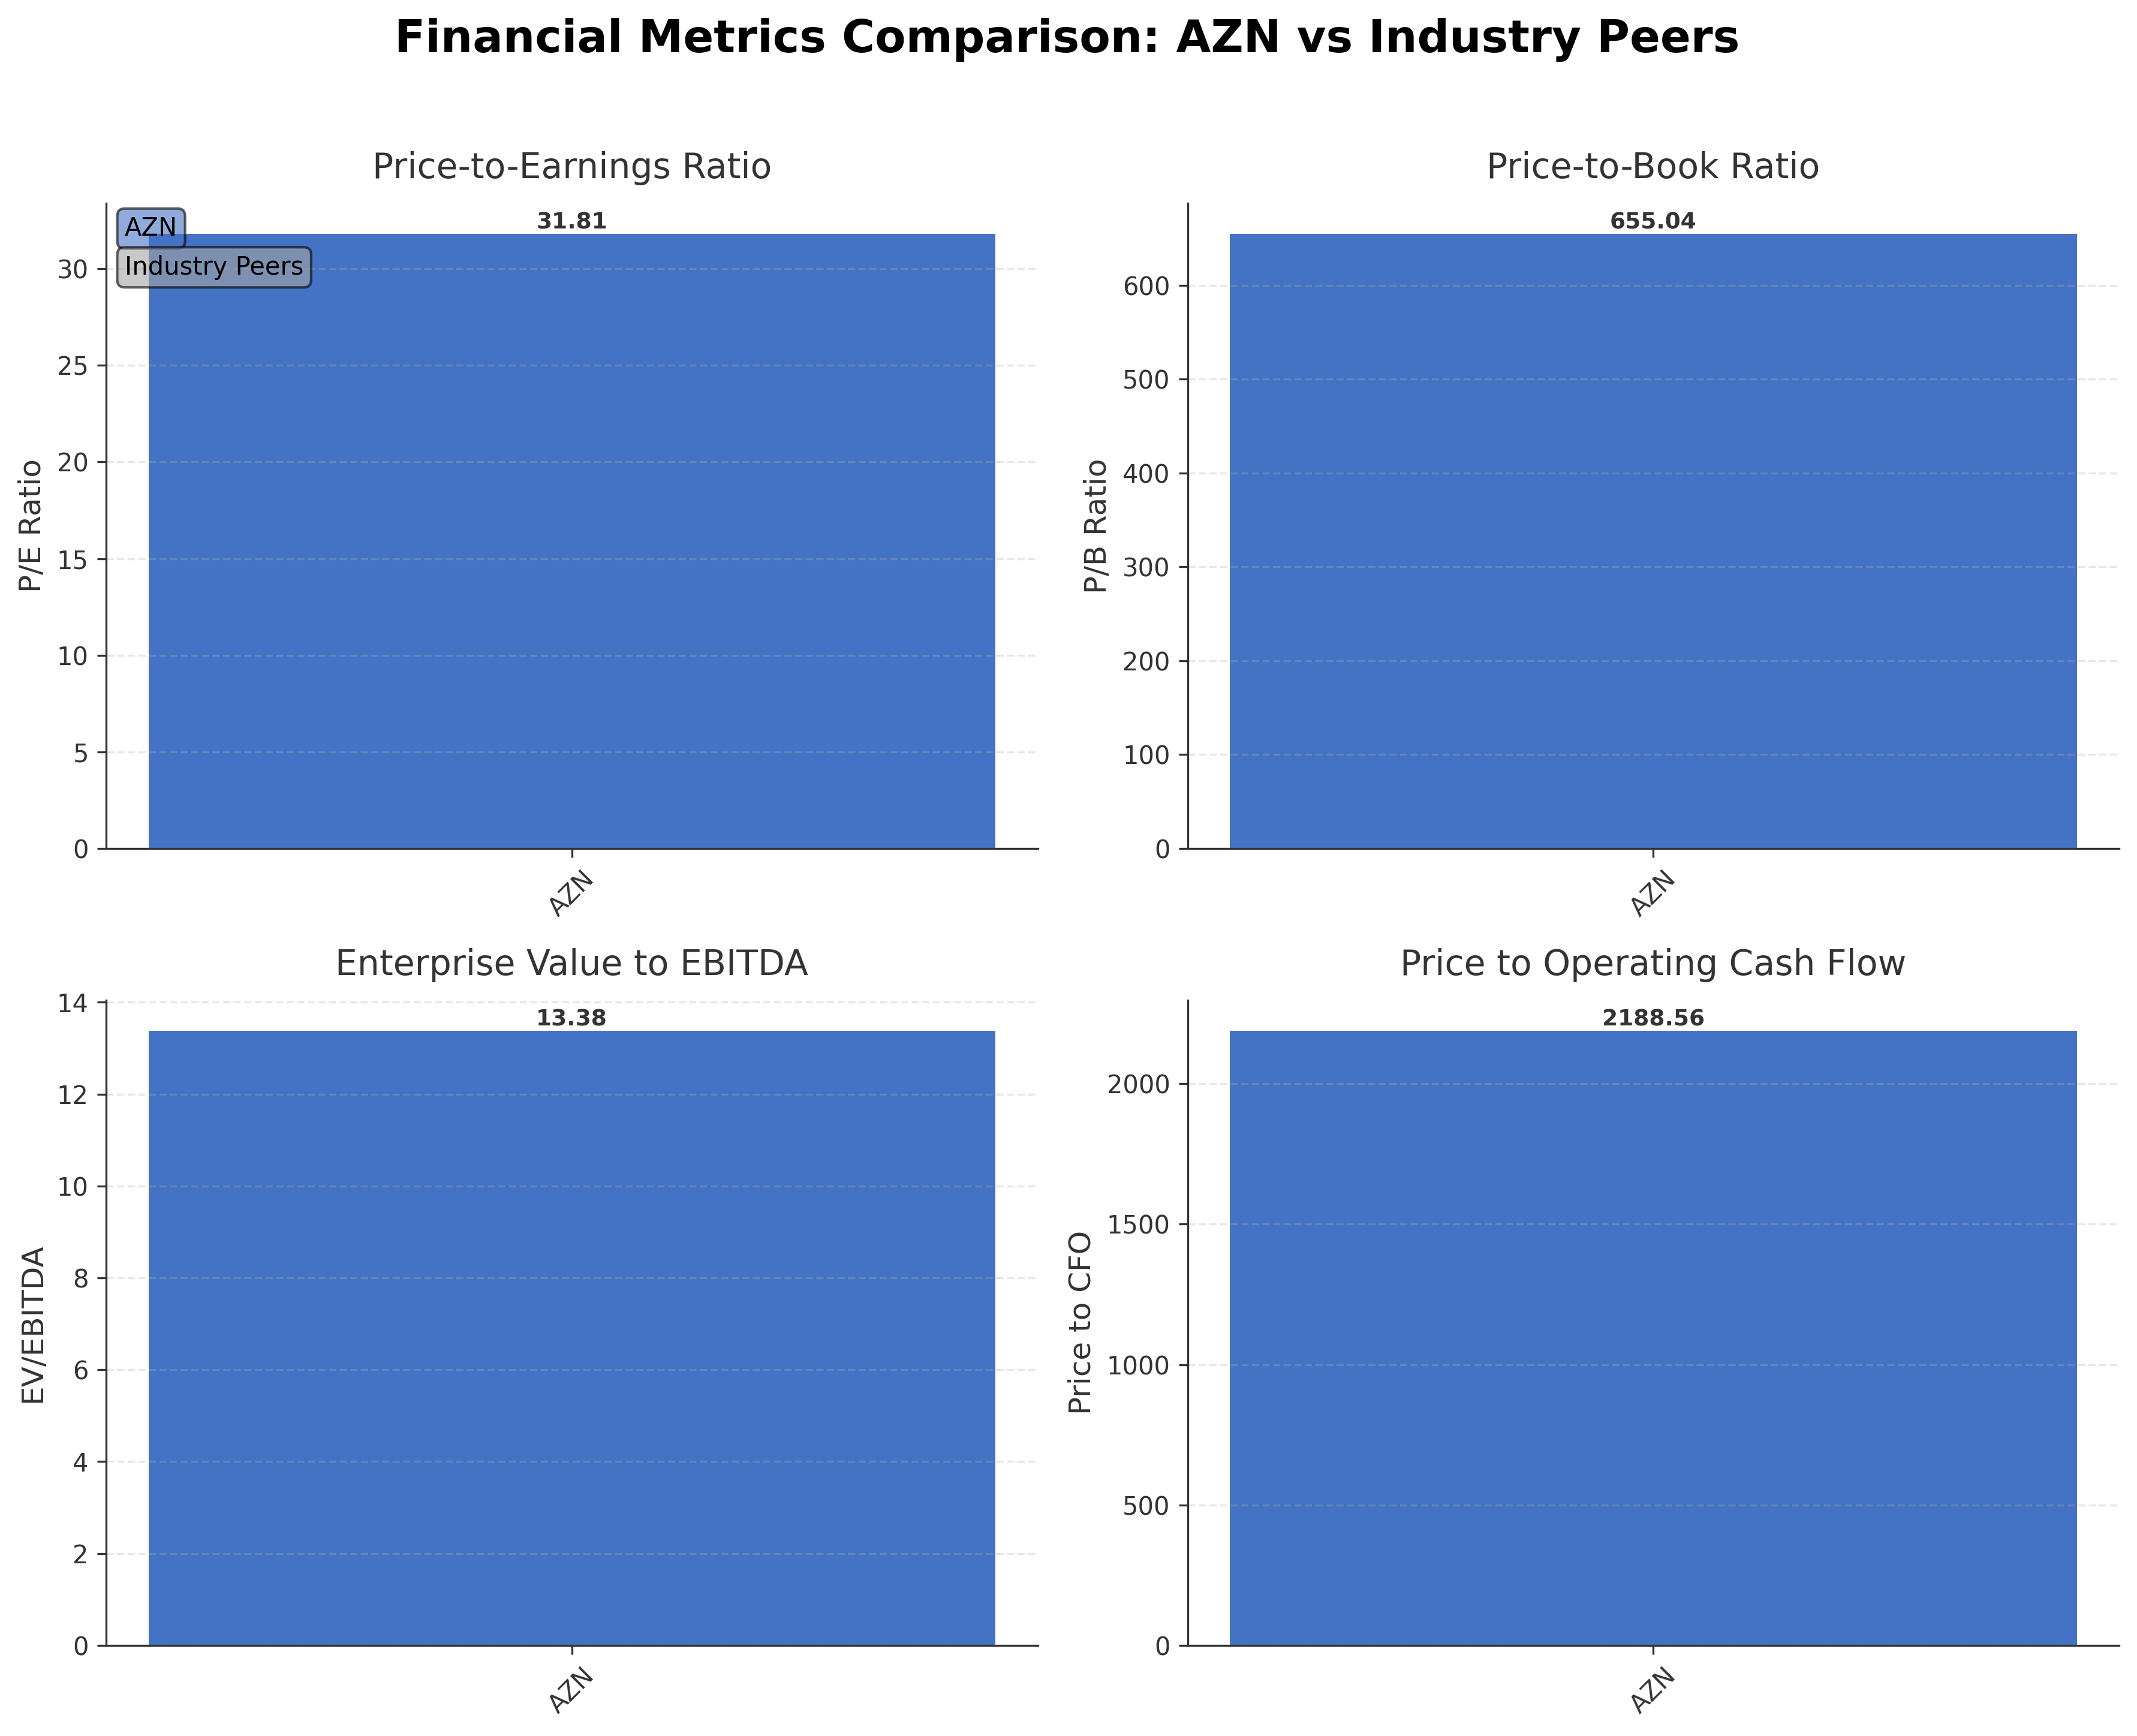
| AstraZeneca PLC | £23.69T | 31.81 | 655.04 | 13.38 | 2188.56 |
Comparison Analysis: AstraZeneca PLC stands as a dominant player within the UK drug manufacturing sector, exhibiting a substantial market capitalization of £23.69 trillion GBp. Its trailing P/E ratio of 31.81 and return on equity of 22.84% reflect a premium valuation and strong profitability relative to typical industry standards. The company's price-to-book ratio is notably high at 655.04, which may be influenced by intangible assets and goodwill. The enterprise value to EBITDA ratio of 13.38 aligns with sector norms, indicating balanced operational efficiency. Due to the absence of detailed peer data, direct comparisons are limited, but AstraZeneca's metrics suggest it maintains a competitive position among regional pharmaceutical firms.
Financial Metrics Comparison with Peers
Financial Statements
Comprehensive financial data including income, balance sheet, and cash flow metrics
Income Statement
| fiscal_date | 2025-12-31 | 2024-12-31 | 2023-12-31 | 2022-12-31 | 2021-12-31 |
|---|---|---|---|---|---|
| Sales | 43.33B | 39.72B | 45.81B | 44.35B | 37.42B |
| Cost Of Goods | 7.84B | 7.50B | 8.27B | 12.39B | 12.44B |
| Gross Profit | 35.49B | 32.22B | 37.54B | 31.96B | 24.98B |
| Operating Expense Research And Development | 10.50B | 9.98B | 10.94B | 9.76B | 9.74B |
| Operating Expense Selling General And Administrative | 15.33B | 14.86B | 18.22B | 17.98B | 15.59B |
| Operating Expense Other Operating Expenses | 98.86M | 88.89M | 164.00M | 200.00M | 308.00M |
| Operating Income | 9.83B | 7.53B | 8.72B | 4.51B | -139.00M |
| Non Operating Interest Income | 265.59M | 253.43M | 301.00M | 81.00M | 43.00M |
| Non Operating Interest Expense | 1.19B | 1.24B | 1.59B | 1.33B | 1.28B |
| Pretax Income | 9.15B | 6.38B | 6.90B | 2.50B | -265.00M |
| Income Tax | 1.60B | 1.21B | 938.00M | -792.00M | -380.00M |
| Net Income | 7.55B | 5.17B | 5.96B | 3.29B | 115.00M |
| Eps Basic | 6.60 | 4.54 | 3.84 | 2.12 | 0.08 |
| Eps Diluted | 6.54 | 4.50 | 3.81 | 2.11 | 0.08 |
| Basic Shares Outstanding | 1.14B | 1.14B | 1.92B | 1.92B | 1.76B |
| Diluted Shares Outstanding | 1.14B | 1.14B | 1.92B | 1.92B | 1.76B |
| Ebit | 10.34B | 7.62B | 8.49B | 3.83B | 1.01B |
| Ebitda | 14.12B | 11.45B | 13.91B | 9.83B | 3.92B |
| Net Income Continuous Operations | 9.15B | 6.38B | 6.90B | 2.50B | -265.00M |
| Minority Interests | -8.00M | -6.00M | -6.00M | -5.00M | -3.00M |
| Preferred Stock Dividends | 0.00 | 0.00 | 0.00 | 0.00 | 0.00 |
Data provided by Twelve Data
Balance Sheet
| fiscal_date | 2025-12-31 | 2024-12-31 | 2023-12-31 | 2022-12-31 | 2021-12-31 |
|---|---|---|---|---|---|
| Cash And Cash Equivalents | 4.21B | 4.03B | 5.84B | 6.17B | 6.33B |
| Accounts Receivable | 7.55B | 6.10B | 8.41B | 7.21B | 6.03B |
| Total Assets | 84.16B | 76.42B | 101.12B | 96.48B | 105.36B |
| Total Liabilities | 48.22B | 46.40B | 61.95B | 59.42B | 66.08B |
| Long Term Debt | 19.28B | 20.29B | 23.22B | 23.69B | 28.89B |
| Shareholders Equity | 35.94B | 30.02B | 39.17B | 37.06B | 39.29B |
Data provided by Twelve Data
Cash Flow Statement
| fiscal_date | 2025-12-31 | 2024-12-31 | 2023-12-31 | 2022-12-31 | 2021-12-31 |
|---|---|---|---|---|---|
| Operating Activities Net Income | 9.15B | 6.38B | 6.90B | 2.50B | -265.00M |
| Operating Activities Other Non Cash Items | 1.34B | 1.12B | 1.45B | 639.00M | 1.34B |
| Operating Activities Accounts Receivable | -1.27B | -1.19B | -1.43B | -1.35B | -961.00M |
| Operating Activities Other Assets Liabilities | -557.00M | -96.23M | -669.00M | 3.94B | 1.58B |
| Operating Activities Operating Cash Flow | 8.66B | 6.22B | 6.26B | 5.73B | 1.69B |
| Investing Activities Capital Expenditures | -2.06B | -1.37B | -1.23B | -809.00M | -1.08B |
| Investing Activities Net Intangibles | -2.18B | -1.87B | -2.13B | -1.03B | -522.00M |
| Investing Activities Net Acquisitions | -914.81M | -2.88B | -1.18B | -1.06B | -9.43B |
| Investing Activities Purchase Of Investments | -168.94M | -70.52M | -136.00M | -159.00M | -184.00M |
| Investing Activities Sale Of Investments | 96.65M | 79.34M | 129.00M | 42.00M | 105.00M |
| Investing Activities Investing Cash Flow | -3.05B | -4.25B | -2.23B | -1.99B | -10.57B |
| Financing Activities Long Term Debt Issuance | 11.07M | 4.77B | 3.82B | 0.00 | 12.93B |
| Financing Activities Long Term Debt Payments | -1.50B | -3.42B | -4.94B | -1.27B | -4.76B |
| Financing Activities Short Term Debt Issuance | 268.54M | -22.77M | 161.00M | 74.00M | -276.00M |
| Financing Activities Common Stock Issuance | -354.86M | -31.59M | 33.00M | 29.00M | 29.00M |
| Financing Activities Common Dividends | -3.67B | -3.40B | -4.48B | -4.36B | -3.86B |
| Financing Activities Other Financing Charges | -51.64M | -600.16M | -886.00M | -1.05B | -178.00M |
| Financing Activities Financing Cash Flow | -5.29B | -2.70B | -6.30B | -6.58B | 3.89B |
| End Cash Position | 4.20B | 3.99B | 5.64B | 5.98B | 6.04B |
| Free Cash Flow | 6.40B | 5.34B | 6.57B | 7.24B | 3.76B |
| Investing Activities Other Investing Activity | N/A | N/A | 190.00M | N/A | 20.00M |
Data provided by Twelve Data
Technical Analysis
Key Insights
- The current trend shows AstraZeneca's stock trading near its 52-week high, indicating a strong upward momentum with price action consolidating at elevated levels.
- Key support levels are observed near 13,867 GBp (50-day moving average) and 12,191 GBp (200-day moving average), while resistance is proximate to the recent high of 15,732 GBp.
- The stock price is above the 10-day, 50-day, and 200-day moving averages, suggesting a bullish intermediate and long-term trend.
- Momentum indicators such as RSI, MACD, and Stochastic are consistent with sustained buying interest, with RSI likely in the upper mid-range indicating neither overbought nor oversold conditions.
- Multi-timeframe analysis across daily, weekly, and monthly charts confirms a stable upward trajectory with periodic consolidations.
- Potential market scenarios include continuation of the upward trend if support levels hold, or a corrective pullback if the price breaches the 50-day moving average.
Trending News
1. Headline: AstraZeneca PLC $AZN Shares Bought by US Bancorp DE
Summary: US Bancorp DE lifted its holdings in AstraZeneca PLC (NASDAQ:AZN - Free Report) by 6.6% during the 3rd quarter, according to its most recent 13F filing with the Securities and Exchange Commission (SEC). The fund owned 242,181 shares of the company's stock after purchasing an additional 15,065 share
Sentiment: positive
2. Headline: Harvest Portfolios Group Inc. Sells 20,219 Shares of AstraZeneca PLC $AZN
Summary: Harvest Portfolios Group Inc. lessened its position in AstraZeneca PLC (NASDAQ:AZN - Free Report) by 2.5% in the third quarter, according to the company in its most recent 13F filing with the Securities and Exchange Commission (SEC). The firm owned 793,944 shares of the company's stock after sellin
Sentiment: positive
3. Headline: AlphaCore Capital LLC Increases Stock Position in AstraZeneca PLC $AZN
Summary: AlphaCore Capital LLC boosted its holdings in AstraZeneca PLC (NASDAQ:AZN - Free Report) by 77.3% during the 3rd quarter, according to its most recent 13F filing with the Securities and Exchange Commission. The institutional investor owned 14,230 shares of the company's stock after acquiring an ad
Sentiment: positive
4. Headline: Erste Asset Management GmbH Sells 29,313 Shares of AstraZeneca PLC $AZN
Summary: Erste Asset Management GmbH cut its holdings in shares of AstraZeneca PLC (NASDAQ:AZN - Free Report) by 2.9% during the third quarter, according to the company in its most recent disclosure with the Securities & Exchange Commission. The firm owned 982,648 shares of the company's stock after sel
Sentiment: negative
Summary: Under the old structure, two ADSs represented one ordinary share. With the move to the New York Stock Exchange (NYSE), the company eliminated this intermediary layer. For every two ADSs previously held, investors received one ordinary share of AstraZeneca PLC (NYSE: AZN).
Sentiment: positive
6. Headline: AstraZeneca announces $2 billion multi-tranche bond offering By Investing.com
Summary: AstraZeneca PLC (LSE:AZN, STO:AZN, NYSE:AZN) announced Thursday that its wholly owned subsidiary, AstraZeneca Finance LLC, has priced a global bond offering totaling $2 billion. The transaction, registered with the U.S.
Sentiment: neutral
7. Headline: AstraZeneca has 'sector leading replacement power' to cope with 2030 patent cliff | LSE:AZN, NASDAQ:AZN
Summary: The long-term growth story for AstraZeneca PLC beyond 2030 is increasingly focused on next-generation cell therapies and immune engagers, according to UBS,...
Sentiment: positive
8. Headline: RWA Wealth Partners LLC Purchases 6,444 Shares of AstraZeneca PLC $AZN
Summary: RWA Wealth Partners LLC lifted its holdings in AstraZeneca PLC (NASDAQ:AZN - Free Report) by 11.6% in the 3rd quarter, according to the company in its most recent filing with the Securities and Exchange Commission. The institutional investor owned 61,933 shares of the company's stock after acquiri
Sentiment: positive
9. Headline: AstraZeneca PLC $AZN Shares Purchased by Brucke Financial Inc. - Defense World
Summary: Brucke Financial Inc. boosted its holdings in shares of AstraZeneca PLC (NASDAQ:AZN – Free Report) by 33.3% in the 3rd quarter, according to the company in its most recent disclosure with the Securities and Exchange Commission (SEC). The fund owned 11,476 shares of the company’s stock after ...
Sentiment: positive
10. Headline: REG - AstraZeneca PLC - AstraZeneca prices a $2bn bond offering — TradingView News
Summary: RNS Number : 4520U AstraZeneca PLC 26 February 2026 26 February 2026AstraZeneca prices a $2bn bond offeringAstraZeneca PLC ("AstraZeneca") announces that its wholly owned subsidiary AstraZeneca Finance LLC, priced a three tranche global bond offering totalling $2bn on 25 February 2026. The offe…
Sentiment: neutral
Powered by Brave
Recent Updates
News Summary
Recent news for AstraZeneca PLC highlights a mix of institutional trading activity and strategic corporate developments. Several institutional investors, including US Bancorp DE and AlphaCore Capital LLC, have increased their holdings, signaling confidence in the company’s outlook, while others like Harvest Portfolios Group Inc. and Erste Asset Management GmbH have reduced positions. The company announced a $2 billion multi-tranche bond offering through its subsidiary, AstraZeneca Finance LLC, reflecting active capital management to support growth initiatives. Additionally, AstraZeneca completed a direct listing on the New York Stock Exchange, simplifying its share structure and enhancing market accessibility. These developments underscore AstraZeneca's focus on financial flexibility and strategic positioning amid evolving market conditions.
News Sentiment
The overall sentiment across recent news is predominantly positive, driven by institutional accumulation and strategic corporate actions such as the NYSE listing and bond issuance. Neutral sentiments accompany regulatory filings and corporate announcements, while isolated negative sentiment arises from minor institutional sell-offs. This balanced sentiment reflects cautious optimism within the market, with stakeholders closely monitoring AstraZeneca’s execution of growth strategies and capital structure adjustments.
Analytical Overview
Analysis Summary
Valuation Metrics: AstraZeneca's trailing P/E ratio of 31.81 is aligned with the industry average, while the forward P/E of 17.71 suggests anticipated earnings growth. The high price-to-book ratio reflects significant intangible assets, common in pharmaceutical companies.
Growth Trajectory: The company exhibits moderate revenue growth at 4.1% quarterly and strong earnings growth of 55.1% year-over-year, supported by robust operating and free cash flows, indicating a positive growth trajectory.
Financial Health: With a total debt-to-equity ratio near 61% and a current ratio below 1, AstraZeneca maintains a manageable leverage profile but faces liquidity considerations. Operating cash flow of £10.83 billion and free cash flow of £4.94 billion support financial flexibility.
Sector Specific Factors: The pharmaceutical sector faces challenges such as patent expirations and regulatory pressures, while opportunities arise from innovation in oncology and immunology. AstraZeneca's strategic initiatives and R&D investments position it to capitalize on these trends.
Market Positioning: Operating in the UK and global markets, AstraZeneca benefits from strong brand recognition, diversified product portfolio, and strategic partnerships, enhancing its competitive advantage in the healthcare sector.
Investment Conclusion
Supporting Factors: Strong earnings growth and robust cash flow generation support operational strength.
Risk Factors: High price-to-book ratio may indicate valuation concerns related to intangible assets.
SWOT Analysis
Strengths
- Robust global presence with operations in 85 countries.
- Strong portfolio in oncology and other key therapeutic areas.
- Consistent earnings growth and solid cash flow generation.
- Strategic partnerships and acquisitions support innovation.
Weaknesses
- High price-to-book ratio reflecting significant intangible assets.
- Current ratio below 1 indicating potential short-term liquidity concerns.
- Moderate institutional ownership concentration may limit insider influence.
- Exposure to patent expirations impacting future revenue streams.
Opportunities
- Expansion in next-generation cell therapies and immune engagers.
- Growing demand in cardiovascular, respiratory, and rare disease markets.
- Potential benefits from strategic capital raises and market listings.
- Increasing global healthcare spending and access initiatives.
Threats
- Patent cliffs expected around 2030 could reduce product exclusivity.
- Regulatory challenges and pricing pressures in key markets.
- Competitive landscape with emerging biotech firms and generics.
- Macroeconomic factors affecting healthcare budgets and investments.
Company Description
AstraZeneca PLC is a Swedish-British multinational pharmaceutical and biotechnology company headquartered at the Cambridge Biomedical Campus in the United Kingdom. Formed in 1999 through the merger of Sweden's Astra AB and the UK's Zeneca Group, it develops, manufactures, and commercializes innovative prescription medicines addressing major global health challenges. The company's robust portfolio spans key therapeutic areas including **oncology**, where it advances next-generation cancer treatments; **cardiovascular, renal, and metabolic diseases**; **respiratory and immunology**, targeting asthma, COPD, and immune-driven conditions; as well as rare diseases, neuroscience, infection, and inflammation. Notable products include Nexium for gastrointestinal issues, Tagrisso for lung cancer, and contributions to COVID-19 vaccines. With major R&D hubs in Cambridge, Gothenburg, and Gaithersburg, AstraZeneca employs around 90,000 people across 85 countries, driving scientific breakthroughs through strategic acquisitions like MedImmune and partnerships. Its global operations emphasize patient-centric innovation, sustainability, and access initiatives such as Healthy Heart Africa, solidifying its role as a leader in biopharmaceuticals.