
Aster DM Healthcare Ltd (ASTERDM)
Stock Analysis Report
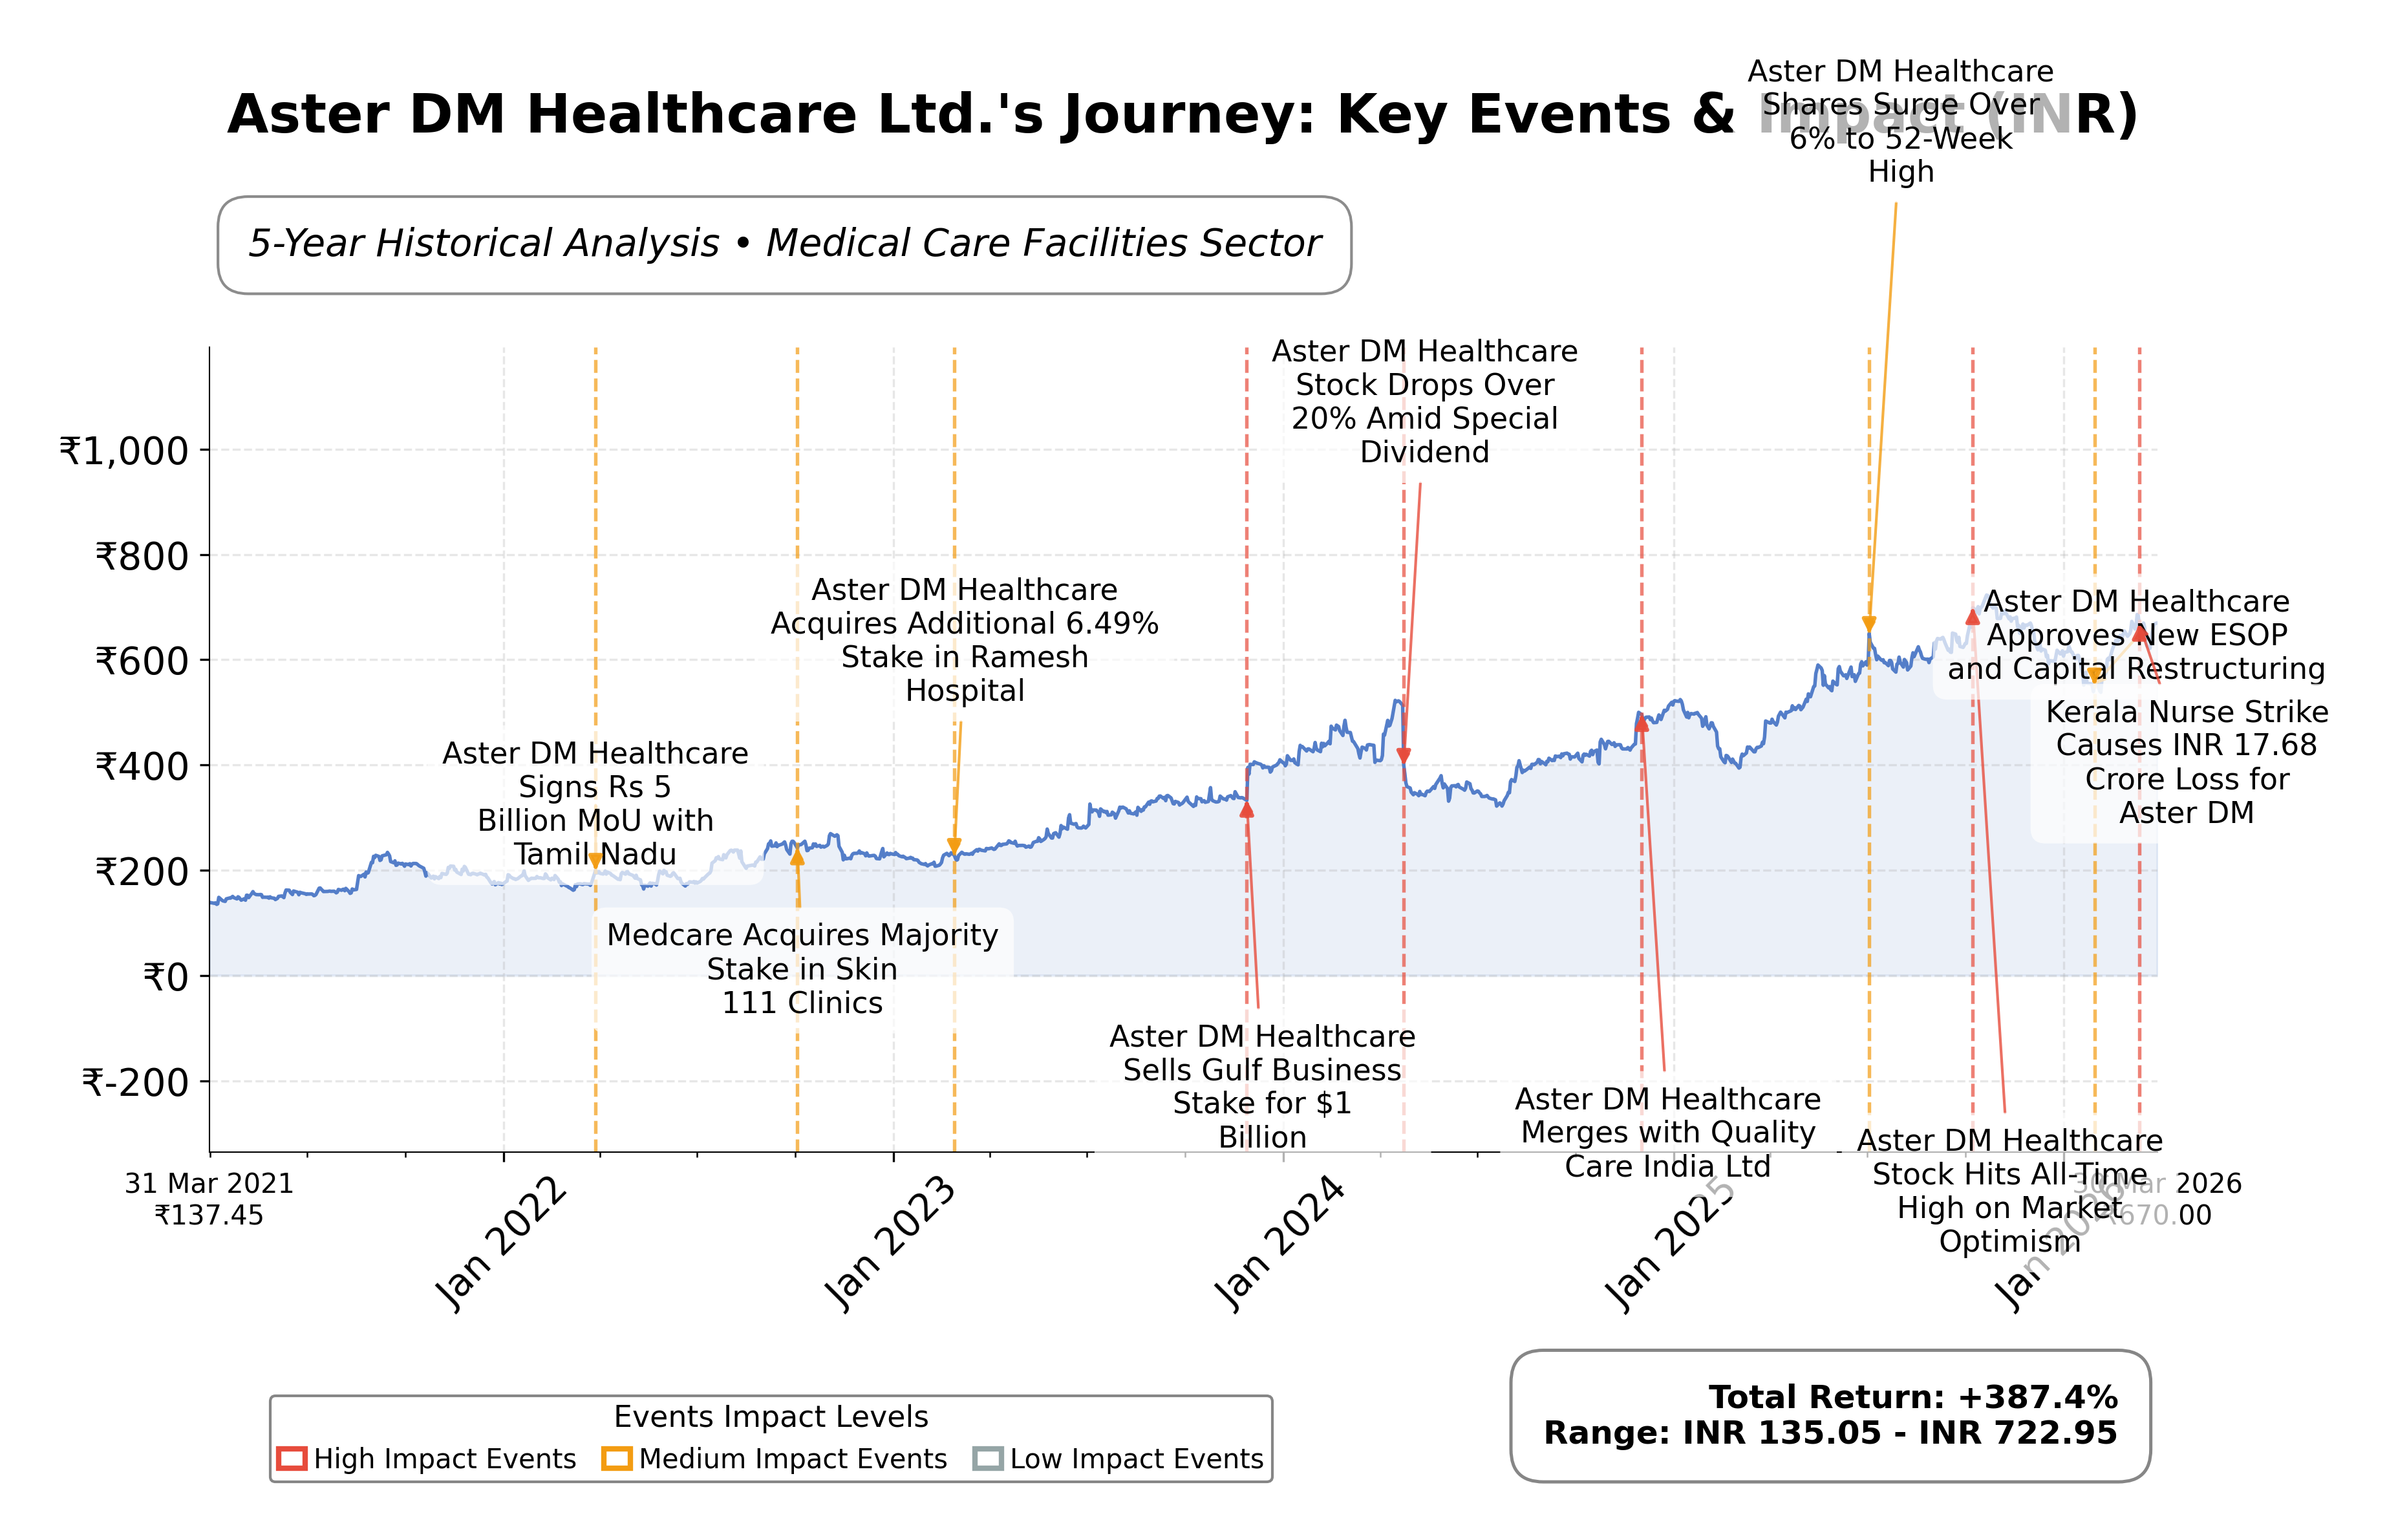
Stock Journey
Key Positives and Key Risks
Pros
- Operating cash flow of ₹54.1 billion and free cash flow of ₹53.8 billion indicate strong cash generation capacity supporting operational needs.
- Current ratio of 2.16 reflects solid liquidity, providing a buffer against short-term obligations.
- Shareholders and creditors approved the Aster-QCIL merger with 96.68% voting, highlighting strong support for strategic growth initiatives.
Cons
- Trailing P/E ratio of 104.54 suggests the stock is trading at a high valuation relative to earnings, which may pressure future returns.
- Negative PEG ratio (-2.20) points to challenges in sustaining growth relative to current price levels.
- Quarterly earnings growth declined by 7.6% year-over-year, indicating recent softness in profitability.
Disclosure: This information is for general awareness and does not constitute investment advice
Report Summary
Aster DM Healthcare Ltd. is a multinational healthcare provider headquartered in the United Arab Emirates, operating extensively across the Middle East and India. The company delivers a wide range of medical services through its network of hospitals, clinics, and pharmacies, focusing on specialties such as cardiology, oncology, and orthopedics. Positioned as a significant player in the healthcare sector, Aster DM Healthcare aims to enhance healthcare accessibility and quality in regions with limited medical infrastructure.
Financially, Aster DM Healthcare reports a market capitalization of approximately â¹337.12 billion with a trailing P/E ratio of 104.54 and a forward P/E of 57.62, reflecting high valuation multiples relative to earnings. The company demonstrates a gross margin of 77.44% and a profit margin of 7.33%, supported by a return on assets of 0.81% and return on equity of 1.47%. Operating cash flow and free cash flow stand strong at â¹54.1 billion and â¹53.8 billion respectively, indicating robust cash generation despite a relatively high enterprise-to-EBITDA ratio of 44.22.
Recent technical indicators show the stock trading near â¹676.60, close to its 52-week high of â¹732.20, with a beta of -0.073 suggesting low volatility relative to the market. The company has announced interim dividends and is progressing with strategic initiatives such as the Aster-QCIL merger, which received strong shareholder approval. Key strengths include a solid cash position and a diversified healthcare network, while risks involve high valuation multiples and moderate debt levels. These factors provide nuanced insights for those assessing the stockâs positioning.
In comparison to regional peers within the Indian healthcare sector, Aster DM Healthcare holds a competitive market cap but exhibits higher valuation multiples, including a P/E ratio of 104.54 versus peers like Fortis Healthcare Ltd. at 64.11 and Narayana Hrudayalaya Ltd. at 42.74. Its return on equity at 1.47% is modestly higher than peers, though the enterprise-to-EBITDA ratio is notably elevated. This peer context highlights Aster DM Healthcareâs premium valuation alongside strong cash flow metrics relative to industry counterparts.
Aster DM Healthcare navigates a complex healthcare landscape marked by expansion and consolidation efforts, such as its recent merger approval, alongside challenges of maintaining profitability amid high valuation levels. The companyâs ongoing initiatives and financial fundamentals underscore pivotal moments that could influence its market standing and operational scale. Given the current data and sector dynamics, a balanced approach that monitors evolving financial and strategic developments may be appropriate for those evaluating the stockâs potential trajectory.
Company and Industry Overview
Company Basics
Price Performance
Company Size
Shareholding Pattern
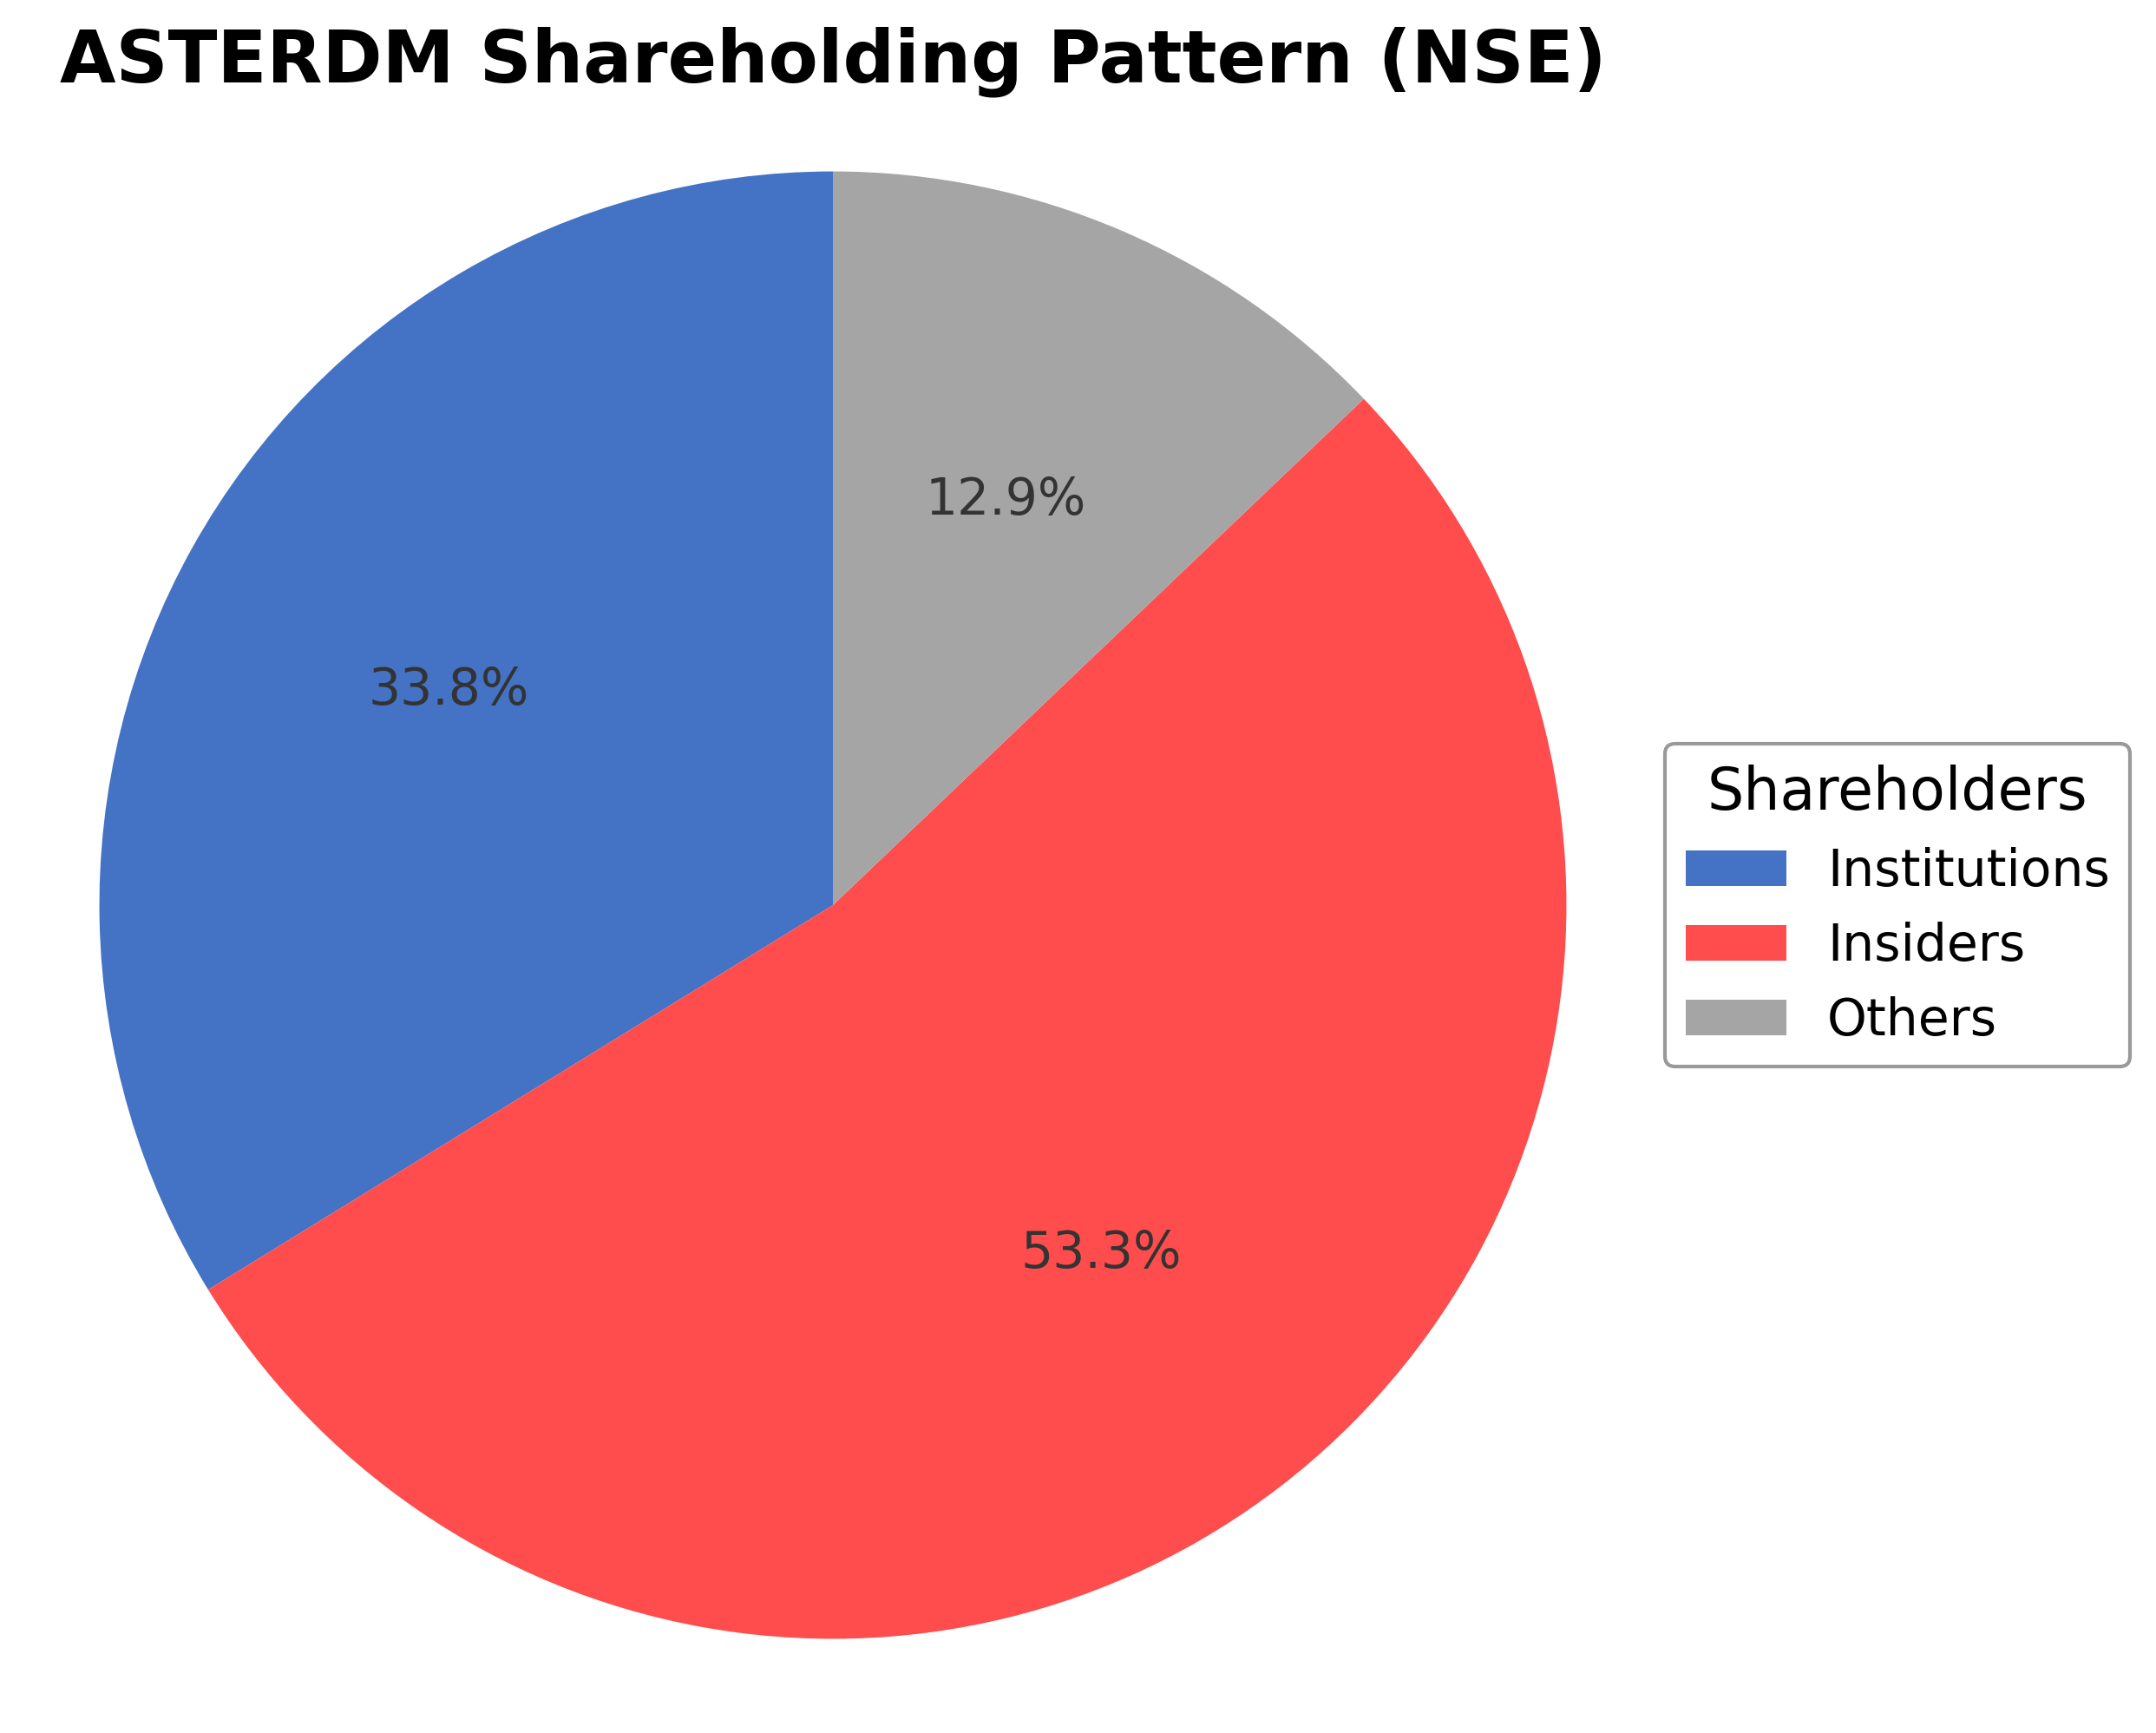
Aster DM Healthcare Ltd.'s shareholding structure comprises approximately 53.34% held by insiders including executives and board members, 33.78% by institutional investors such as mutual funds and asset managers, and the remaining 12.88% by public shareholders and other retail investors. Over the past 12 to 24 months, institutional holdings have shown moderate accumulation, reflecting confidence from major funds. This ownership distribution suggests a stable governance framework with significant promoter control balanced by institutional oversight, which may influence strategic decisions and corporate governance. The healthcare industry in India remains dynamic, with Aster DM Healthcare positioned to leverage its extensive network and service offerings within this evolving sector.
Sector and Industry Analysis
Aster DM Healthcare Ltd. (ASTERDM) operates within the Healthcare sector, specifically in the healthcare services industry, which encompasses hospital management, diagnostics, outpatient care, and related medical services. Globally, the healthcare sector is a significant and rapidly expanding market, driven by demographic shifts such as aging populations, rising chronic disease prevalence, and increasing healthcare awareness. The global healthcare services market is projected to grow at a compound annual growth rate (CAGR) of approximately 7-9% over the next decade, fueled by expanding middle-class populations in emerging markets and technological advancements improving care delivery. Key players in this sector include large hospital chains, diagnostic service providers, and integrated healthcare delivery networks, with Aster DM Healthcare positioned as a prominent player in the Middle East and Indian subcontinent markets.
Industry trends are marked by the integration of digital health technologies, telemedicine, and AI-driven diagnostics, which are reshaping patient care models and operational efficiencies. Consumer behavior is evolving with increased demand for personalized, accessible, and affordable healthcare services, prompting providers to expand outpatient services and preventive care offerings. Emerging opportunities lie in chronic disease management, home healthcare, and health data analytics, which enable better patient outcomes and cost management. Additionally, the COVID-19 pandemic accelerated adoption of remote care and digital health solutions, trends that continue to influence industry dynamics.
The regulatory landscape in healthcare services is complex and varies significantly by geography but generally includes stringent compliance with patient safety, data privacy (e.g., HIPAA in the US, GDPR in Europe), and quality standards. Governments and health authorities impose licensing requirements, accreditation standards, and reimbursement policies that directly impact operational viability and profitability. In markets where Aster DM Healthcare operates, regulatory frameworks are evolving to enhance healthcare quality and accessibility, often accompanied by increased government spending and public-private partnerships. Compliance with these regulations is critical, as non-compliance can result in penalties, reputational damage, and operational disruptions.
Competitive dynamics in the healthcare services industry are characterized by moderate to high entry barriers due to capital intensity, regulatory approvals, and the need for skilled medical personnel. Market structure tends to be fragmented in emerging markets but increasingly consolidated in developed regions through mergers and acquisitions. Providers differentiate themselves through service quality, geographic reach, technological adoption, and brand reputation. For Aster DM Healthcare, competitive positioning is strengthened by its integrated model combining hospitals, clinics, and pharmacies, enabling cross-service synergies and patient retention. However, competition from both local providers and multinational healthcare chains remains intense, necessitating continuous investment in infrastructure, talent, and technology to maintain market share.
Note: Analysis synthesized from industry research, market reports, and regulatory filings. Information is subject to change based on market conditions.
Illustrative Scenario Analysis
DCF Assumptions:
Method: Two-Stage EPS-Priority Model
Financials
Peer Analysis
| Company Name | Market Cap | P/E Ratio | P/B Ratio | EV/EBITDA | Price to CFO |
|---|---|---|---|---|---|
| Aster DM Healthcare Ltd. | ₹337.12B | 104.54 | 7.61 | 44.22 | 6.23 |
| Krishna Institute of Medical Sciences Ltd. | ₹259.85B | 84.52 | 11.22 | 40.84 | 52.23 |
| Fortis Healthcare Ltd. | ₹626.69B | 64.11 | 6.52 | 34.24 | 61.66 |
| Narayana Hrudayalaya Ltd. | ₹345.59B | 42.74 | 8.18 | 25.08 | 51.92 |
| Global Health Ltd. | ₹271.73B | 51.56 | 7.15 | 29.79 | 49.90 |
| Apollo Hospitals Enterprise Ltd. | ₹1.09T | 60.24 | 11.94 | 35.43 | 74.80 |
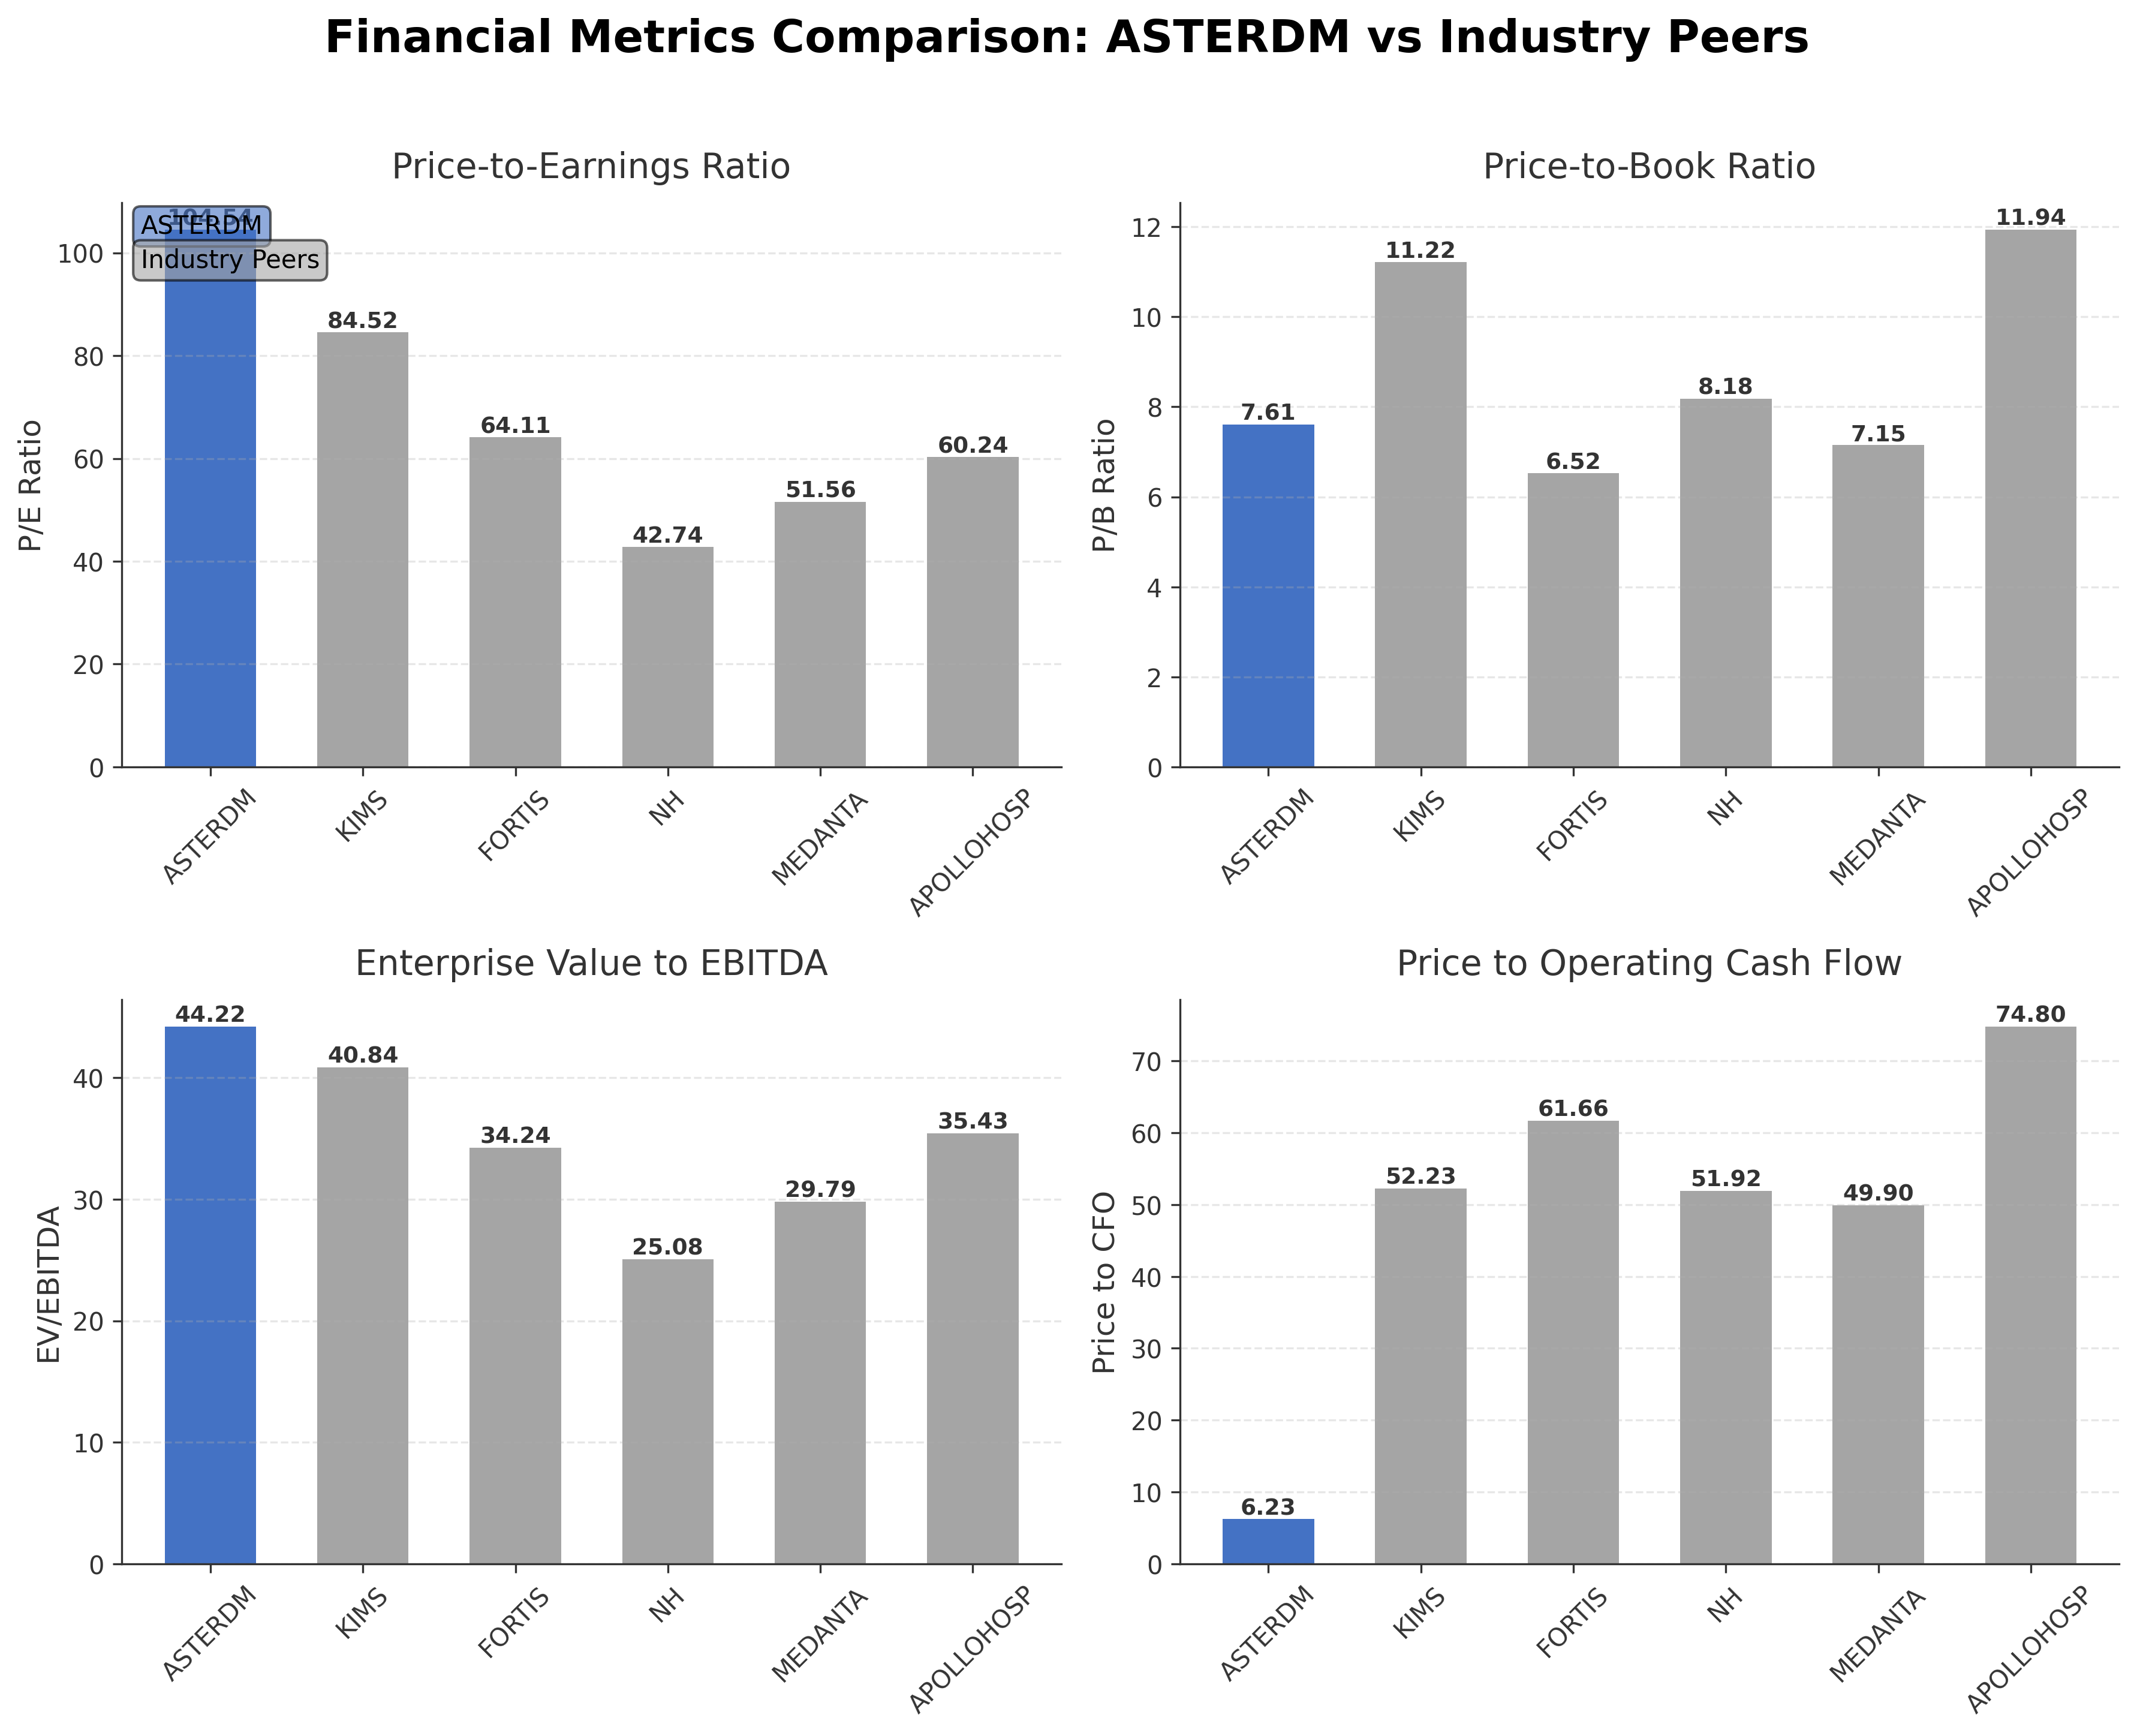
Comparison Analysis: Aster DM Healthcare Ltd. exhibits higher valuation multiples compared to its Indian healthcare peers, with a P/E ratio of 104.54 significantly above the peer range of approximately 42.74 to 84.52. The company’s price-to-cash-flow ratio of 6.23 is notably lower than peers, indicating relatively efficient cash generation. Return on equity at 1.47% surpasses that of comparable firms, although the enterprise-to-EBITDA ratio of 44.22 is elevated, suggesting a premium valuation. Market capitalization positions Aster DM Healthcare competitively within the sector, though Apollo Hospitals leads in scale. Overall, Aster DM Healthcare shows strengths in profitability and cash flow metrics but trades at a premium relative to regional competitors.
Financial Metrics Comparison with Peers
Financial Statements
Comprehensive financial data including income, balance sheet, and cash flow metrics
Income Statement
| fiscal_date | 2025-03-31 | 2024-03-31 | 2023-03-31 | 2022-03-31 | 2021-03-31 |
|---|---|---|---|---|---|
| Sales | 40.69B | 36.42B | 29.52B | 102.53B | 85.23B |
| Cost Of Goods | 9.38B | 9.16B | 7.84B | 28.92B | 25.73B |
| Gross Profit | 31.31B | 27.26B | 21.68B | 73.62B | 59.50B |
| Operating Expense Selling General And Administrative | 11.14B | 9.86B | 7.72B | 8.15B | 8.37B |
| Operating Expense Other Operating Expenses | 4.91B | 4.70B | 4.09B | 17.99B | 12.42B |
| Operating Income | 5.25B | 3.67B | 2.66B | 8.43B | 5.02B |
| Non Operating Interest Income | 1.10B | 47.80M | 48.60M | 48.00M | 42.00M |
| Non Operating Interest Expense | 1.08B | 1.06B | 851.50M | 2.57B | 2.92B |
| Pretax Income | 4.71B | 2.61B | 1.95B | 6.37B | 2.05B |
| Income Tax | 1.34B | 565.10M | 358.70M | 358.00M | 272.20M |
| Net Income | 54.08B | 2.12B | 4.75B | 6.01B | 1.78B |
| Eps Basic | 107.98 | 2.60 | 8.54 | 10.58 | 2.97 |
| Eps Diluted | 107.85 | 2.60 | 8.53 | 10.57 | 2.97 |
| Basic Shares Outstanding | 498.00M | 497.50M | 497.30M | 497.16M | 496.90M |
| Diluted Shares Outstanding | 498.00M | 497.50M | 497.30M | 497.16M | 496.90M |
| Ebit | 5.79B | 3.67B | 2.81B | 8.94B | 4.97B |
| Ebitda | 8.75B | 13.55B | 10.61B | 15.34B | 11.29B |
| Net Income Continuous Operations | 55.42B | 3.30B | 5.35B | 6.37B | 2.05B |
| Minority Interests | -300.60M | -822.80M | -505.80M | -750.60M | -300.90M |
| Preferred Stock Dividends | 0.00 | 0.00 | 0.00 | 0.00 | 0.00 |
Data provided by Twelve Data
Balance Sheet
| fiscal_date | 2025-03-31 | 2024-03-31 | 2023-03-31 | 2022-03-31 | 2021-03-31 |
|---|---|---|---|---|---|
| Cash And Cash Equivalents | 1.65B | 822.30M | 3.79B | 3.43B | 2.58B |
| Accounts Receivable | 2.58B | 2.33B | 23.36B | 20.21B | 20.19B |
| Total Assets | 66.06B | 179.91B | 148.81B | 125.46B | 116.43B |
| Total Liabilities | 29.55B | 129.61B | 100.21B | 80.64B | 78.09B |
| Long Term Debt | 18.29B | 11.36B | 44.67B | 39.39B | 40.30B |
| Shareholders Equity | 36.51B | 50.30B | 48.60B | 44.83B | 38.34B |
Data provided by Twelve Data
Cash Flow Statement
| fiscal_date | 2025-03-31 | 2024-03-31 | 2023-03-31 | 2022-03-31 | 2021-03-31 |
|---|---|---|---|---|---|
| Operating Activities Net Income | 55.42B | 3.30B | 5.35B | 6.37B | 2.05B |
| Operating Activities Stock Based Compensation | 84.20M | 73.60M | 6.70M | -1.30M | 24.90M |
| Operating Activities Other Non Cash Items | -600.00K | 4.06B | 3.27B | 2.54B | 2.89B |
| Operating Activities Accounts Receivable | -344.90M | -2.22B | -3.18B | -1.82B | 359.50M |
| Operating Activities Other Assets Liabilities | -1.06B | -14.49B | 4.06B | -2.19B | 1.60B |
| Operating Activities Operating Cash Flow | 54.10B | -9.28B | 9.50B | 4.89B | 6.93B |
| Investing Activities Capital Expenditures | -3.44B | -7.50B | -7.08B | -4.79B | -3.67B |
| Investing Activities Net Intangibles | -106.90M | -86.70M | -1.31B | -649.30M | -193.90M |
| Investing Activities Net Acquisitions | 75.63B | -1.35B | -1.30B | -472.60M | 654.10M |
| Investing Activities Purchase Of Investments | -11.93B | N/A | -46.10M | N/A | -125.30M |
| Investing Activities Sale Of Investments | 84.60M | 82.10M | 3.10M | 174.90M | N/A |
| Investing Activities Investing Cash Flow | 60.35B | -8.77B | -8.43B | -5.09B | -3.14B |
| Financing Activities Long Term Debt Issuance | 1.88B | N/A | 3.58B | 673.80M | 1.90B |
| Financing Activities Long Term Debt Payments | -1.34B | N/A | -6.02B | -3.67B | -5.55B |
| Financing Activities Short Term Debt Issuance | -831.20M | 2.92B | 1.89B | 1.20B | -2.53B |
| Financing Activities Common Stock Issuance | 30.90M | N/A | N/A | 5.80M | 7.90M |
| Financing Activities Common Dividends | -61.73B | N/A | N/A | N/A | N/A |
| Financing Activities Other Financing Charges | 138.20M | -449.30M | -1.41B | -270.50M | -9.70M |
| Financing Activities Financing Cash Flow | -61.85B | 2.47B | -1.96B | -2.06B | -6.18B |
| End Cash Position | 1.65B | 6.97B | 3.65B | 2.99B | 2.35B |
| Free Cash Flow | 683.20M | -6.48B | 9.86B | 7.66B | 11.45B |
| Investing Activities Other Investing Activity | N/A | N/A | N/A | N/A | N/A |
| Financing Activities Common Stock Repurchase | N/A | N/A | N/A | N/A | N/A |
Data provided by Twelve Data
Technical Analysis
Key Insights
- The current trend shows Aster DM Healthcare trading near its recent highs with price action indicating a consolidation phase following a recovery from a market-wide sell-off.
- Key support levels are identified around ₹609.33 (50-day moving average) and ₹625.50 (200-day moving average), with resistance near the 52-week high of ₹732.20.
- The stock price is currently above the 10-day, 50-day, and 200-day moving averages, suggesting a generally bullish positioning across short and long-term timeframes.
- Momentum indicators show RSI in a neutral to slightly overbought range, MACD indicating positive momentum, and Stochastic oscillators reflecting upward movement, consistent with recent price gains.
- Multi-timeframe analysis reveals daily and weekly charts supporting an uptrend, while monthly charts indicate steady accumulation without extreme volatility.
- Potential market scenarios include continuation of the upward trend if support levels hold, or a correction towards moving averages if resistance at recent highs proves strong.
Trending News
1. Headline: Share Market Highlights March 30: Sensex, Nifty tumble over 2% as FY26 closes on a weak note - The HinduBusinessLine
Summary: TVS Motor Company Ltd has set the ex-date for its interim dividend of ₹12.0 as Monday. Aster DM Healthcare Ltd has set the ex-date for its interim dividend of ₹3.0 as Thursday.
Sentiment: negative
2. Headline: Dividend Stocks To Watch This Week: Ireda, TVS Holdings, Crisil, Aster DM Healthcare & More
Summary: Chennai Petroleum Corporation Ltd. has declared an interim dividend of Rs 8 per share, while Aster DM Healthcare Ltd. has announced an interim dividend of Rs 3 per share.
Sentiment: neutral
3. Headline: Corporate Actions This Week: TVS Motor Company, IREDA, CRISIL And More To Trade Ex-Dividend | Full List
Summary: Aster DM Healthcare will trade ex-interim dividend for Rs 3 per share. Photo Source: Canva AI ... Did our AI summary help? Let us know. ... TVS Motor Company Ltd., Indian Renewable Energy Development Agency Ltd., CRISIL Ltd. and Aster DM Healthcare Ltd. are among the many companies that have ...
Sentiment: neutral
4. Headline: Aster DM Healthcare Gains 6.23%: 2 Key Factors Driving the Weekly Move
Summary: Aster DM Healthcare Ltd delivered a notable weekly gain of 6.23%, closing at Rs.666.35 on 27 March 2026, outperforming the Sensex which declined by 1.46% over the same period. The stock’s recovery was marked by a series of positive daily advances following a sharp market-wide sell-off on ...
Sentiment: positive
5. Headline: JSW Steel, Coal India, Paytm, Sammaan Capital, Thermax among stocks in focus next week; here’s why - BusinessToday
Summary: TVS Motor Company Ltd, Aster DM Healthcare Ltd,IREDA, CRISIL Ltd, TVS Holdings Ltd and IRB Infrastructure Developers Ltd are among stocks which would turn ex-dates for corporate actions next week, BSE data showed.
Sentiment: neutral
6. Headline: Aster DM Healthcare - GE Vernova T&D India among 5 stocks closed crossing above VWAP | The Economic Times
Summary: On March 25, the closing prices of five stocks in the Nifty 500 pack rallied by more than 1% relative to their VWAP (Volume Weighted Average Price). A move above VWAP suggests a potential bullish trend, according to StockEdge’s technical scan data. When a stock closes above its VWAP, it indicates ...
Sentiment: positive
Summary: Aster DM Healthcare Ltd has maintained a consistent dividend history in recent years.
Sentiment: positive
Summary: Aster DM Healthcare Ltdhas informed BSE that the meeting of the Board of Directors of the Company is scheduled on 26/03/2026 ,inter alia, to....
Sentiment: neutral
9. Headline: Aster DM Healthcare Ltd is Rated Sell
Summary: Aster DM Healthcare Ltd is rated 'Sell' by MarketsMOJO, with this rating last updated on 09 March 2026. However, the analysis and financial metrics discussed here reflect the stock's current position as of 21 March 2026, providing investors with the latest insights into its performance and outlook.
Sentiment: neutral
10. Headline: Aster DM Healthcare Ltd Upgraded to Sell on Technical Improvements Despite Financial Challenges
Summary: Aster DM Healthcare Ltd has seen its investment rating upgraded from Strong Sell to Sell as of 9 March 2026, driven primarily by a shift in technical indicators despite ongoing financial headwinds. The company’s technical outlook has improved to mildly bullish, prompting a reassessment of ...
Sentiment: positive
Powered by Brave
Recent Updates
News Summary
Recent news highlights Aster DM Healthcare's ongoing corporate activities including the declaration of an interim dividend for the fiscal year ending March 31, 2026, reflecting steady shareholder returns. The company has received strong shareholder and creditor approval for its merger with Quality Care India Limited, signaling strategic consolidation efforts. Investor and analyst hospital visits planned in Kerala indicate a focus on transparency and engagement. Tangible book value per share data has been updated, providing insights into the company's asset base. These developments collectively underscore Aster DM Healthcare's active management of growth initiatives and shareholder relations within a dynamic healthcare sector.
News Sentiment
The overall sentiment from recent updates is moderately positive, driven by strategic merger approvals and dividend announcements. Neutral tones prevail in financial statistics and investor engagement activities, while no significant negative news has emerged. Positive shareholder support for corporate actions and steady dividend policies contribute to a constructive outlook in the near term.
Analytical Overview
Analysis Summary
Valuation Metrics: Aster DM Healthcare's trailing P/E ratio of 104.54 and forward P/E of 57.62 are significantly higher than the industry average, indicating a premium valuation relative to earnings expectations.
Growth Trajectory: The company reports a quarterly revenue growth rate of 13%, supported by strong operating and free cash flow figures, suggesting a positive growth trajectory despite a slight year-over-year earnings decline.
Financial Health: With a total debt-to-equity ratio of 43.79% and a current ratio above 2, Aster DM Healthcare maintains a balanced financial position with sufficient liquidity and manageable leverage.
Sector Specific Factors: The Indian healthcare sector presents both opportunities in expanding healthcare access and challenges from regulatory complexities and competitive pressures, factors relevant to the company's operational environment.
Market Positioning: Aster DM Healthcare's extensive network and strategic merger activities enhance its competitive positioning within the healthcare industry, supported by a stable ownership structure and institutional interest.
Investment Conclusion
Supporting Factors: Robust cash flow generation with operating cash flow of ₹54.1 billion and free cash flow of ₹53.8 billion.
Risk Factors: High valuation multiples with trailing P/E exceeding 100, which may pressure future returns.
SWOT Analysis
Strengths
- Extensive multinational healthcare network across the Middle East and India.
- Strong operating and free cash flow generation supporting financial stability.
- High gross margin of 77.44% indicating efficient cost management.
- Robust shareholder and creditor support for strategic mergers.
Weaknesses
- Elevated valuation multiples with a trailing P/E over 100.
- Modest return on equity at 1.47% relative to valuation.
- Negative PEG ratio suggesting challenges in growth relative to price.
- Profit margin of 7.33% indicates limited net profitability.
Opportunities
- Expansion through mergers and acquisitions to enhance market share.
- Growing demand for healthcare services in India and the Middle East.
- Potential to improve operational efficiencies and profitability.
- Increasing institutional investor interest supporting capital access.
Threats
- Regulatory complexities in multiple operating jurisdictions.
- Competitive pressures from established healthcare providers.
- Economic fluctuations impacting healthcare spending.
- Risks related to integration of merged entities.
Company Description
Aster DM Healthcare Ltd. is a multinational healthcare provider based in the United Arab Emirates, offering a broad spectrum of healthcare services across the Middle East and India. The company operates through a network of hospitals, clinics, and pharmacies, delivering comprehensive medical care to diverse communities. A standout feature of Aster DM Healthcare is its focus on delivering high-quality services across various medical specialties, including cardiology, oncology, and orthopedics. This expansive network facilitates access to essential healthcare services and equipment, contributing significantly to public health infrastructure in regions where medical resources may be limited. In the financial market, Aster DM Healthcare is viewed as a key player within the healthcare sector, known for its scalable model and substantial impact on the health and wellness industry. With its ongoing efforts to expand and innovate, the company plays a crucial role in shaping healthcare delivery standards, contributing to the broader economic context by enhancing healthcare accessibility and quality.