


Applied Materials, Inc (AMAT)
Stock Analysis Report
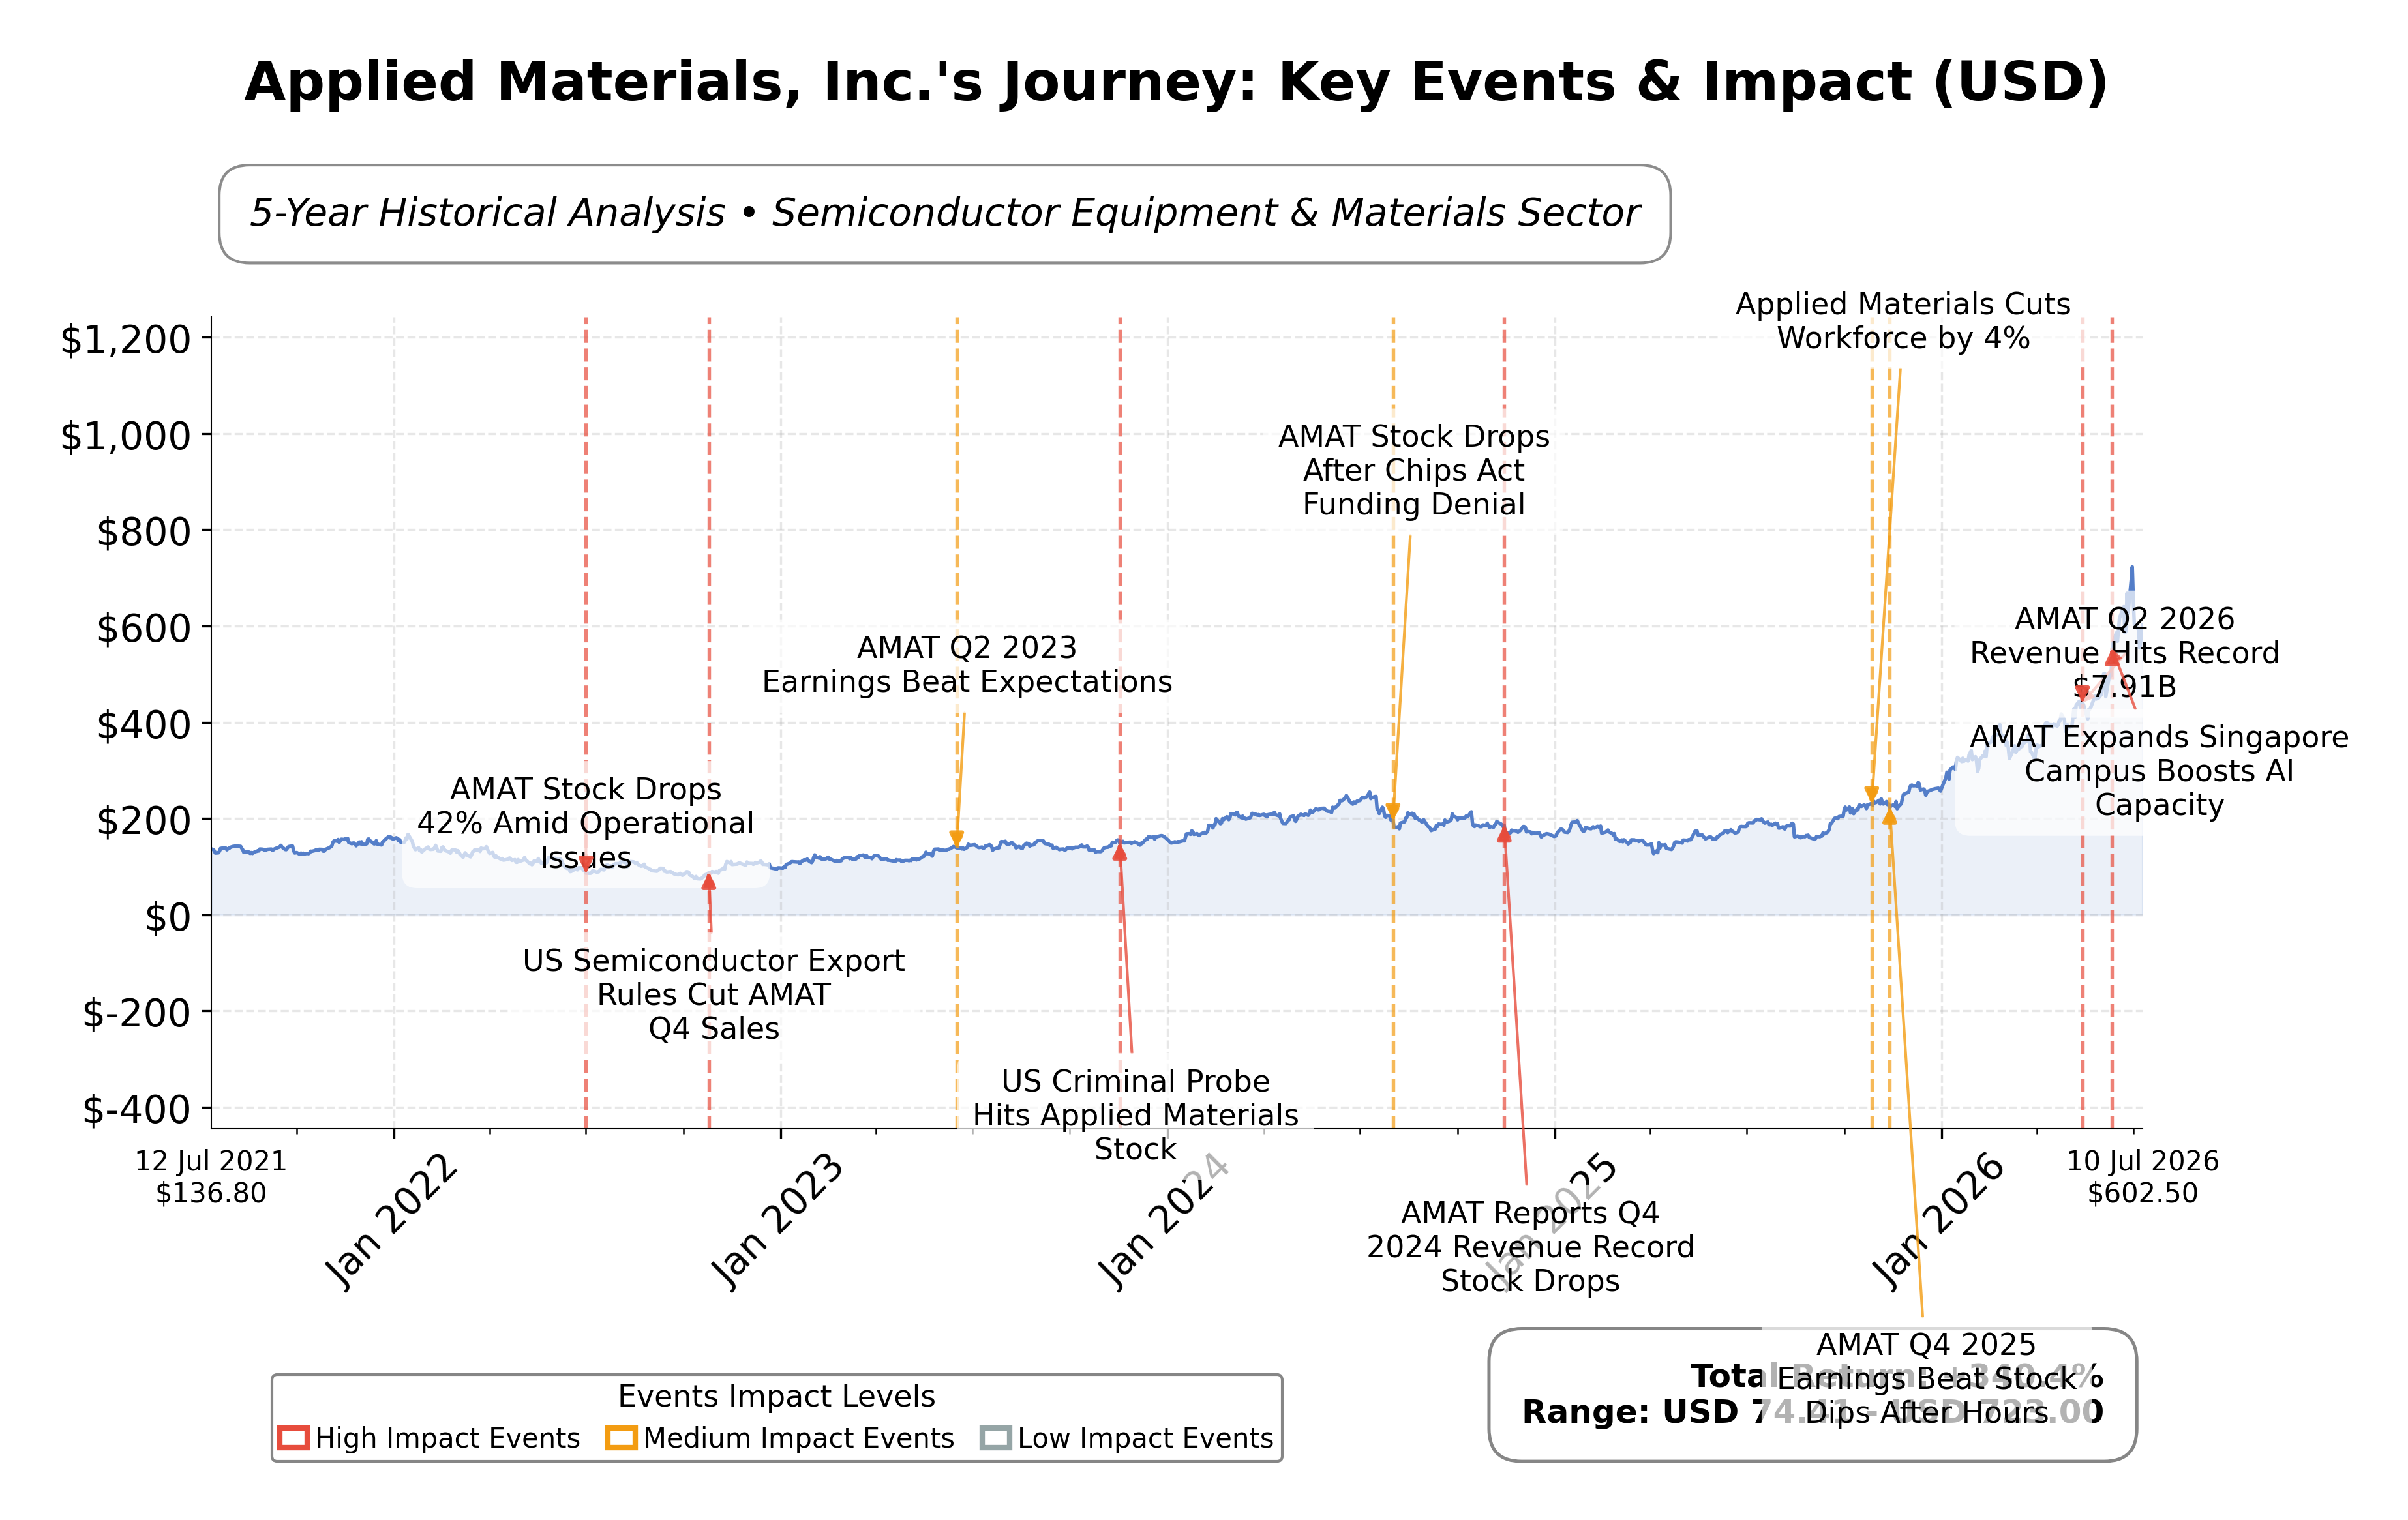
Stock Journey
Key Positives and Key Risks
Pros
- Strong profitability with a net profit margin of 29.3% and return on equity of 39.7%, indicating efficient capital use and earnings generation.
- Robust liquidity supported by $8.24 billion in cash and a current ratio of 2.51, ensuring financial flexibility to fund growth and operations.
- Significant market capitalization of $478.79 billion with solid revenue growth of 11.4% quarterly, reflecting sustained demand in semiconductor equipment.
Cons
- High valuation multiples including a trailing P/E of 56.8 and price-to-book ratio of 20.0, suggesting premium pricing relative to fundamentals.
- Exposure to cyclical semiconductor capital expenditure trends, which may lead to volatility in revenue and earnings.
- Recent sector-specific selloff and competitive pressures from peers with higher returns on equity, indicating potential operational challenges.
Disclosure: This information is for general awareness and does not constitute investment advice
Report Summary
Applied Materials, Inc. operates as a leading provider of materials engineering solutions, equipment, services, and software to the semiconductor and related industries globally. Listed on NASDAQ under the technology sector, the company serves major semiconductor manufacturers with critical capital equipment and integrated factory performance solutions. Its two main segments, Semiconductor Systems and Applied Global Services, enable advanced wafer fabrication and factory automation. With a strong presence across the United States, Asia, and Europe, Applied Materials holds a prominent position in the semiconductor equipment market.
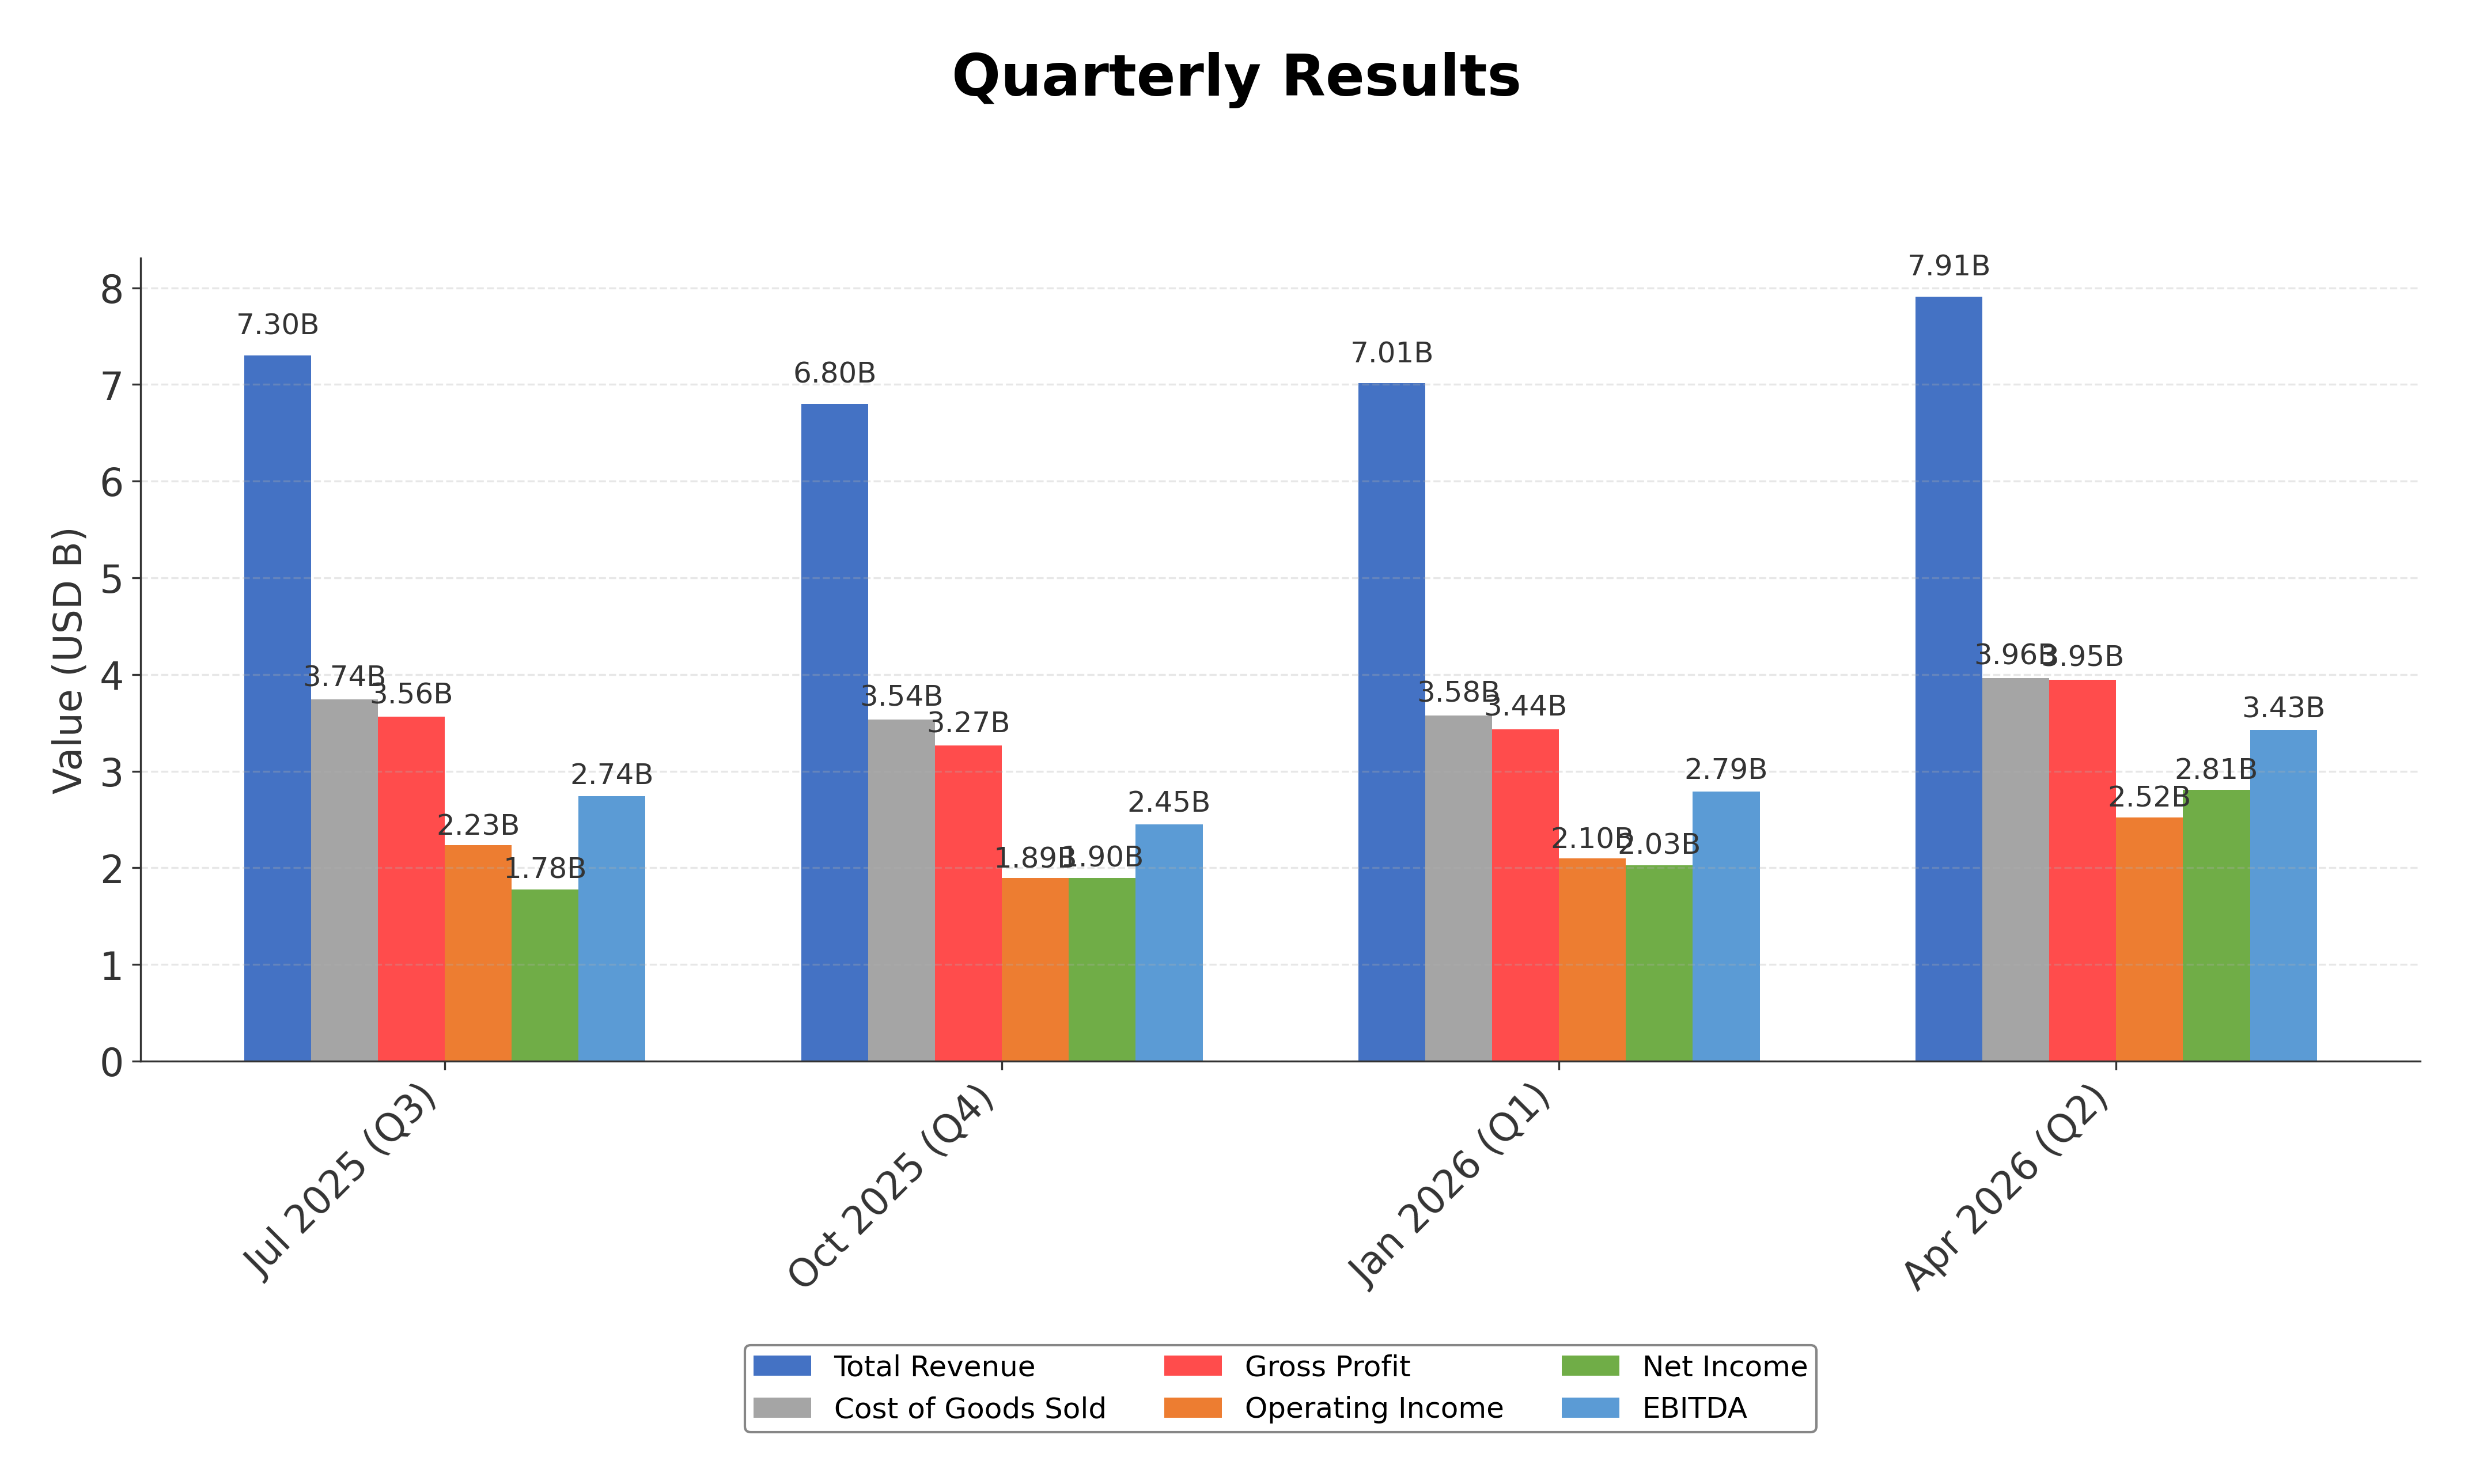
Financially, Applied Materials reported trailing twelve months (TTM) revenue of approximately $29.0 billion with a gross margin near 49.9%, an operating margin of 31.9%, and a net profit margin of 29.3%, indicating robust profitability. The company’s return on equity (ROE) stands at 39.7%, return on assets (ROA) at 14.9%, and return on invested capital (ROIC) is similarly strong, reflecting efficient capital utilization and solid earnings generation. Quarterly revenue growth of 11.4% and earnings growth of 31.3% year-over-year further underscore its growth momentum.
Valuation metrics show a trailing price-to-earnings (P/E) ratio of 56.8 and a forward P/E of 36.8, with a price-to-book (P/B) ratio of 20.0 and an enterprise value to EBITDA (EV/EBITDA) multiple of 51.5. The market capitalization is approximately $478.8 billion, with the current share price at $602.27, trading well below its 52-week high of $739.67 but significantly above the 52-week low of $154.47. These multiples suggest the stock is priced at a premium relative to earnings and book value, reflecting high growth expectations.
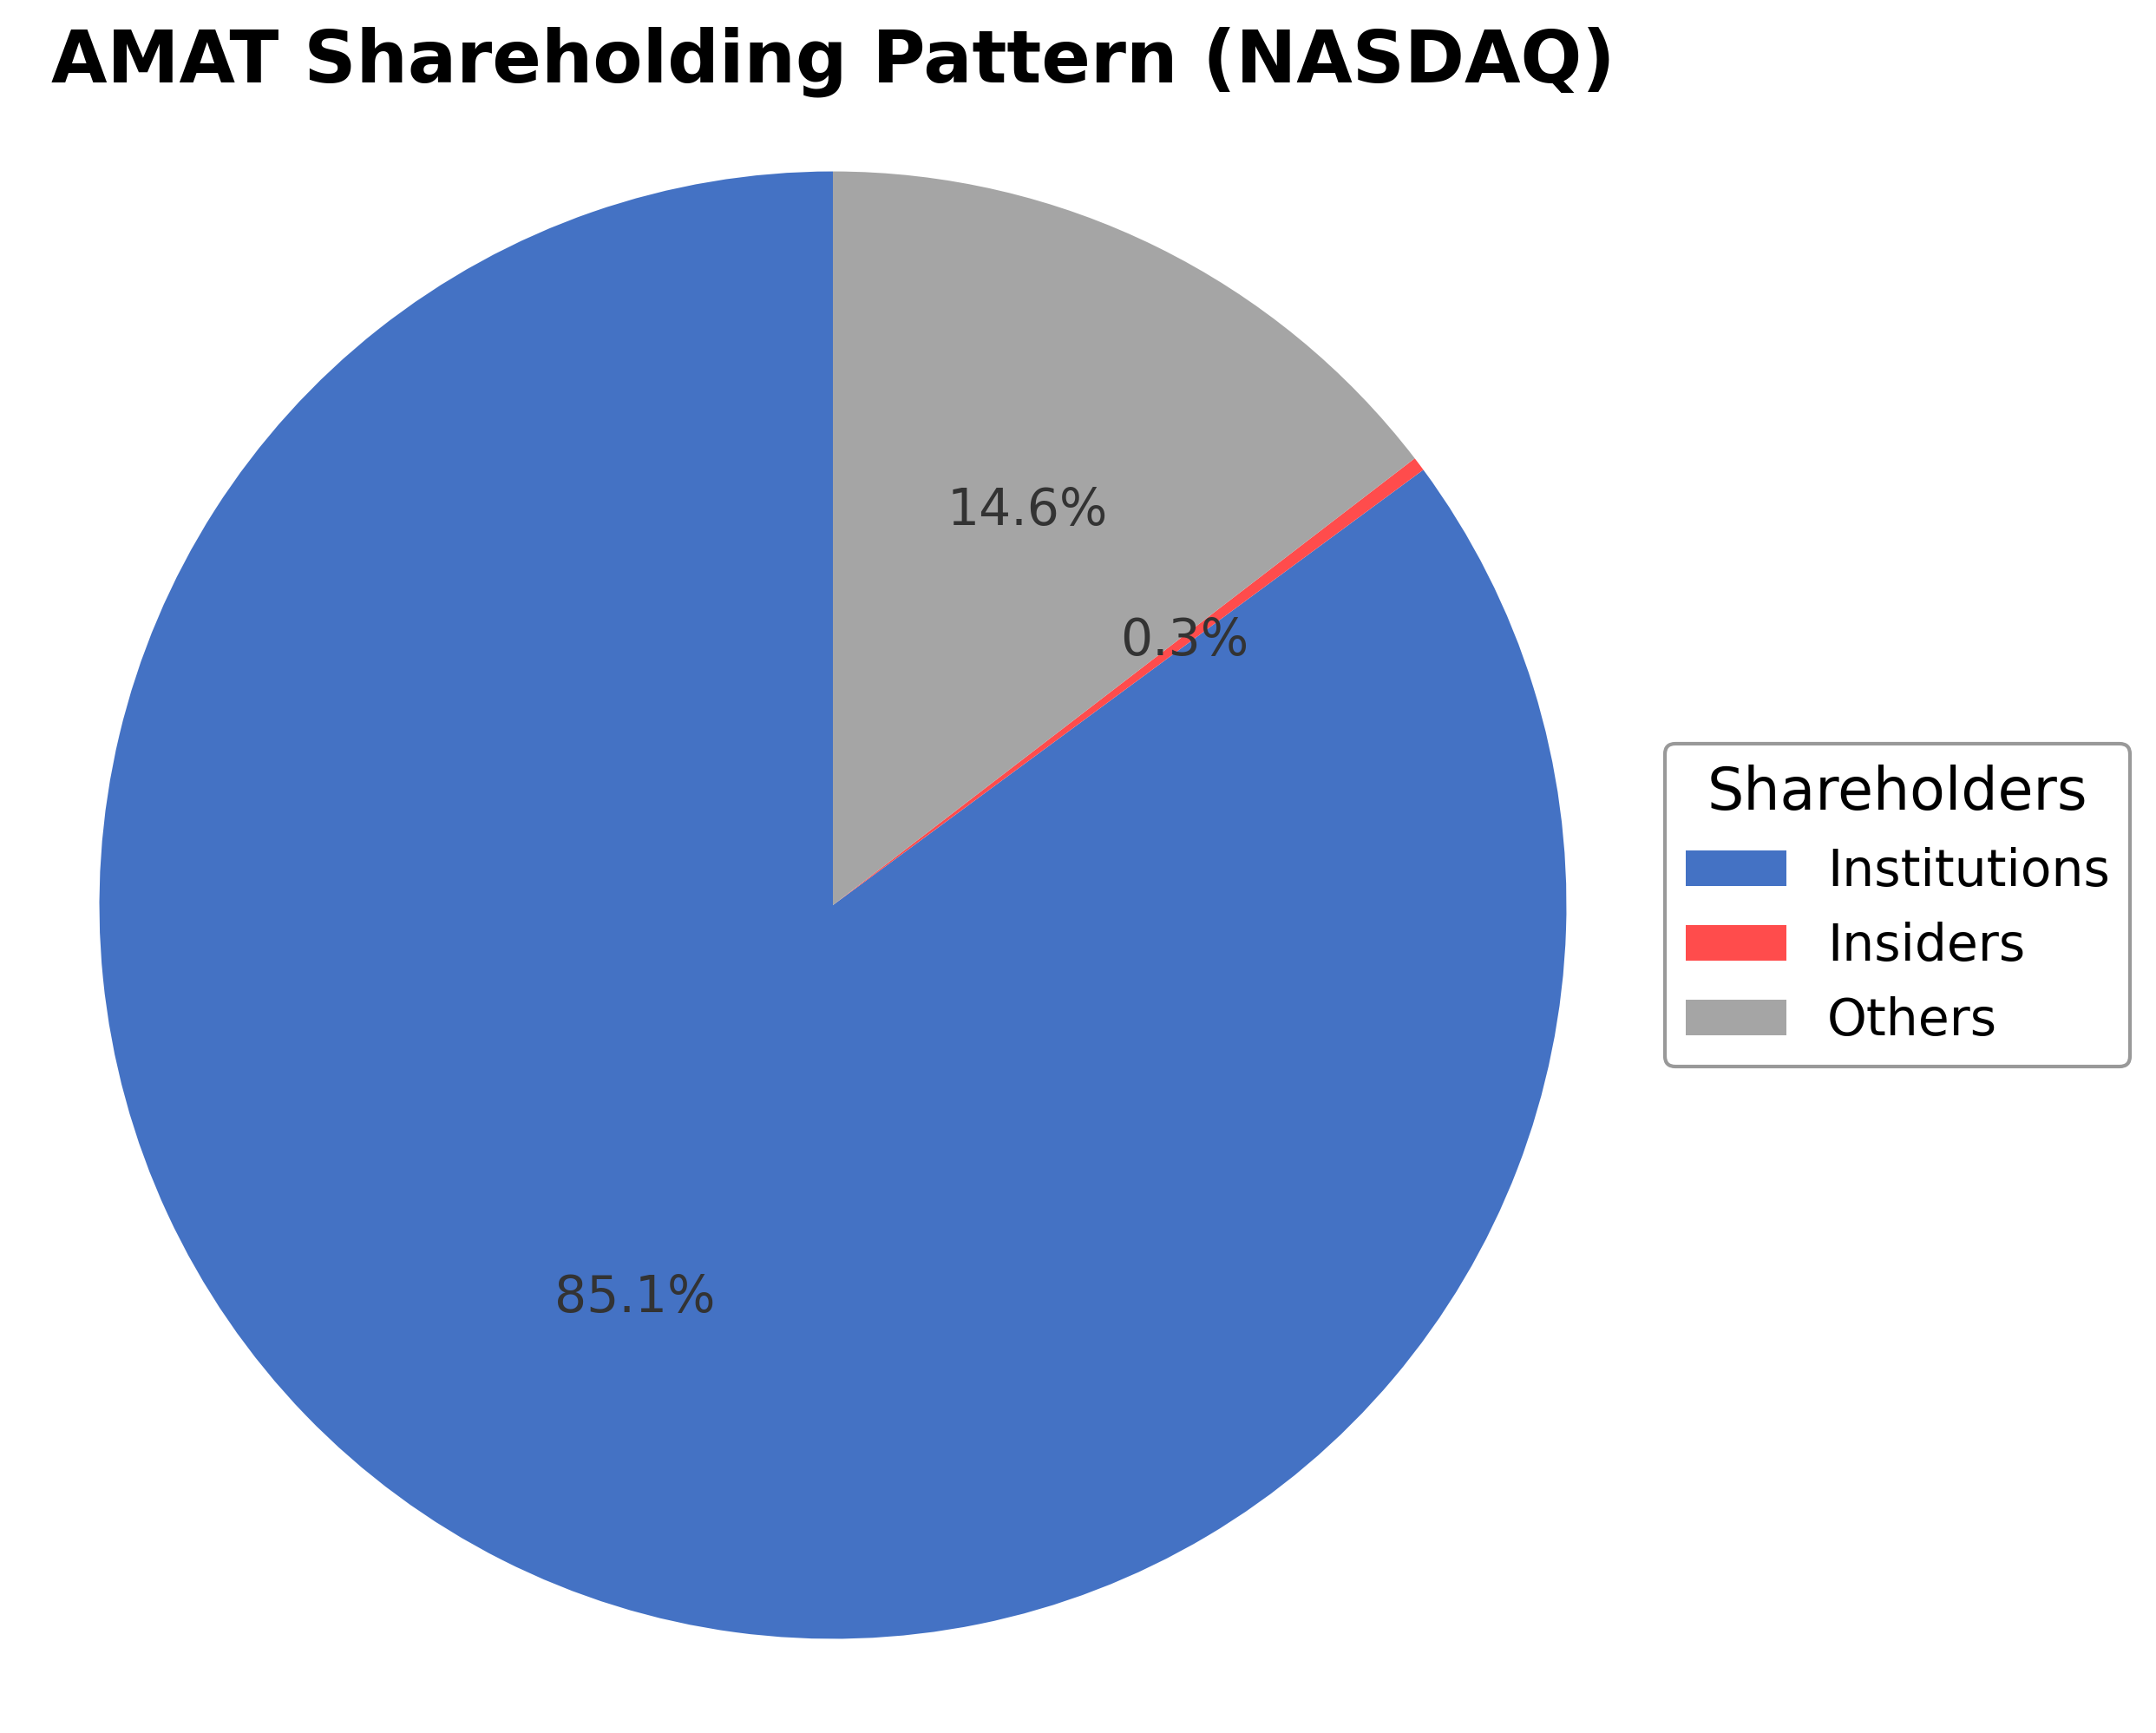
Applied Materials benefits from strong cash flow generation, a healthy current ratio of 2.51, and manageable debt levels with a debt-to-equity ratio of 0.30. Institutional ownership exceeds 85%, indicating significant confidence from large investors. However, risks include exposure to cyclical semiconductor capital expenditures, competitive pressures, and macroeconomic uncertainties affecting chip demand. Recent strategic moves include expanding cleanroom capacity in Singapore and launching new chipmaking systems targeting AI and DRAM markets, supporting its technological leadership.
Technically, the stock exhibits strength trading above key moving averages with positive momentum indicators and multi-timeframe bullish trends. Recent news highlights sustained AI-driven demand and optimistic earnings forecasts, balanced by sector-specific volatility following a chip selloff. Overall, the data suggests a nuanced environment where accumulation and cautious monitoring of market developments are warranted.
Company and Industry Overview
Company Basics
Price Performance
Company Size
Shareholding Pattern
Sector and Industry Analysis
The semiconductor equipment sector is a critical component of the broader technology industry, supporting the manufacture of microchips essential for electronics, computing, and communications. The global market for semiconductor capital equipment has experienced robust growth driven by increasing demand for advanced chips in AI, 5G, and automotive applications. Key players in this sector include Applied Materials, Lam Research, ASML, and KLA, which collectively dominate the supply of high-precision manufacturing tools and materials engineering solutions.
Industry trends highlight a shift towards more complex chip architectures and materials, necessitating advanced equipment for processes such as etching, deposition, and metrology. The competitive landscape is marked by high barriers to entry due to the capital-intensive nature of R&D and manufacturing, as well as the need for deep integration into semiconductor supply chains. Applied Materials distinguishes itself with a broad product portfolio and strong service offerings, enabling it to maintain a wide moat relative to more specialized competitors.
The regulatory environment for semiconductor equipment manufacturers involves export controls, intellectual property protections, and trade policies, particularly affecting cross-border supply chains with China and other key markets. Governments are increasingly scrutinizing technology transfers and imposing restrictions to safeguard national security interests, which can impact market access and operational flexibility. Overall, regulatory developments are shaping industry dynamics by influencing global supply chain configurations and investment decisions.
Note: Analysis synthesized from industry research, market reports, and regulatory filings. Information is subject to change based on market conditions.
Financial Ratios Dashboard
Illustrative Scenario Analysis
DCF Assumptions:
Method: Two-Stage EPS-Priority Model
Financials
Peer Analysis
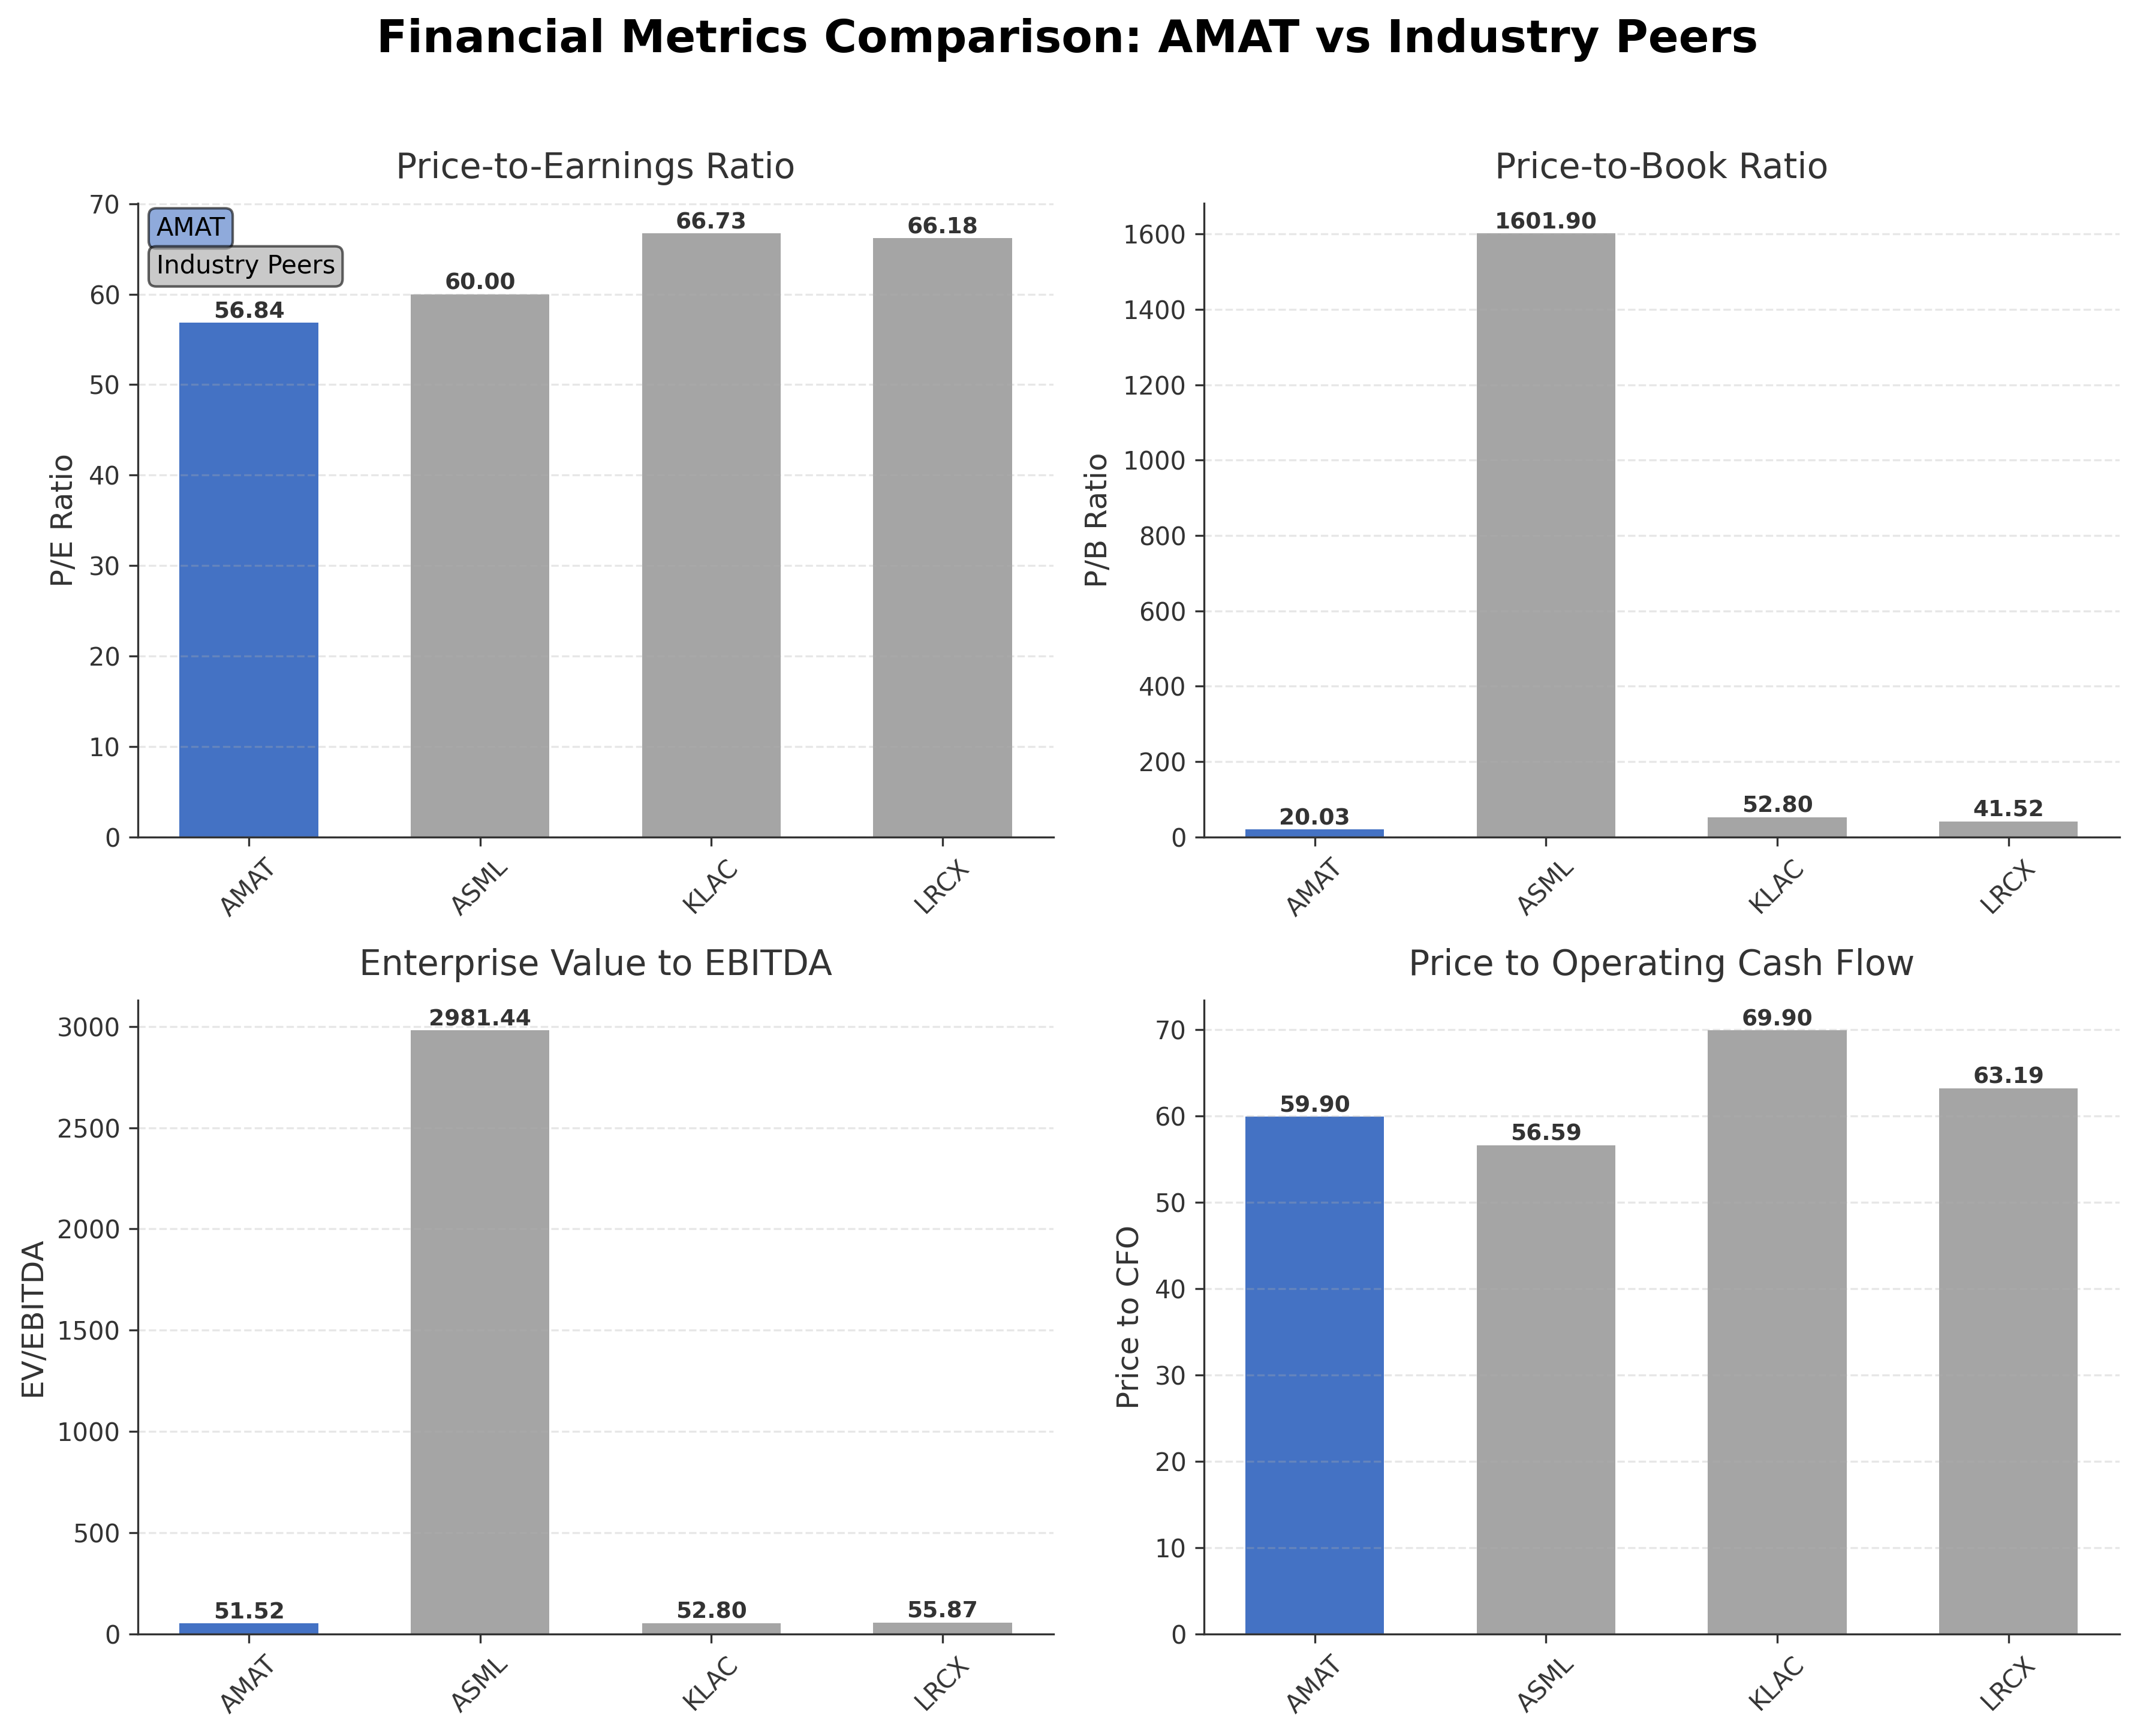
| Company Name | Market Cap | P/E Ratio | P/B Ratio | EV/EBITDA | Price to CFO |
|---|---|---|---|---|---|
| Applied Materials, Inc. | $478.79B | 56.84 | 20.03 | 51.52 | 59.90 |
| ASML Holding N.V. New York Registry Shares | $681.93B | 60.00 | 1601.90 | 2981.44 | 56.59 |
| KLA Corporation | $307.69B | 66.73 | 52.80 | 52.80 | 69.90 |
| Lam Research Corporation | $439.46B | 66.18 | 41.52 | 55.87 | 63.19 |
Comparison Analysis: Applied Materials holds a substantial market capitalization of $478.79 billion, positioning it competitively among major semiconductor equipment peers. Its P/E ratio of 56.84 is lower than KLA and Lam Research but slightly below ASML, reflecting relatively attractive earnings valuation within a high-growth sector. The P/B ratio of 20.03 is significantly lower than ASML’s extreme valuation but also below KLA and Lam Research, indicating more moderate premium pricing relative to book value. EV/EBITDA at 51.52 is competitive but lower than ASML’s outlier multiple. Applied Materials’ return on equity of 39.69% is solid but trails the higher returns of KLA and Lam Research, suggesting room for operational efficiency improvements. Overall, Applied Materials demonstrates balanced valuation and profitability metrics relative to its regional industry peers.
Financial Metrics Comparison with Peers
Financial Statements
Comprehensive financial data including income, balance sheet, and cash flow metrics
Income Statement
| fiscal_date | 2025-10-31 | 2024-10-31 | 2023-10-31 | 2022-10-31 | 2021-10-31 |
|---|---|---|---|---|---|
| Sales | 28.37B | 27.18B | 26.52B | 25.79B | 23.06B |
| Cost Of Goods | 14.56B | 14.28B | 14.13B | 13.79B | 12.15B |
| Gross Profit | 13.81B | 12.90B | 12.38B | 11.99B | 10.91B |
| Operating Expense Research And Development | 3.57B | 3.23B | 3.10B | 2.77B | 2.48B |
| Operating Expense Selling General And Administrative | 1.77B | 1.80B | 1.63B | 1.44B | 1.23B |
| Operating Income | 8.47B | 7.87B | 7.65B | 7.78B | 7.20B |
| Non Operating Interest Income | 1.25B | 532.00M | 300.00M | 39.00M | 118.00M |
| Non Operating Interest Expense | 269.00M | 247.00M | 238.00M | 228.00M | 236.00M |
| Other Income Expense | -181.00M | N/A | N/A | 4.00M | -311.00M |
| Pretax Income | 9.27B | 8.15B | 7.72B | 7.60B | 6.77B |
| Income Tax | 2.27B | 975.00M | 860.00M | 1.07B | 883.00M |
| Net Income | 7.00B | 7.18B | 6.86B | 6.53B | 5.89B |
| Eps Basic | 8.71 | 8.68 | 8.16 | 7.49 | 6.47 |
| Eps Diluted | 8.66 | 8.61 | 8.11 | 7.44 | 6.40 |
| Basic Shares Outstanding | 804.00M | 827.00M | 840.00M | 871.00M | 910.00M |
| Diluted Shares Outstanding | 804.00M | 827.00M | 840.00M | 871.00M | 910.00M |
| Ebit | 9.54B | 8.40B | 7.95B | 7.83B | 7.01B |
| Ebitda | 10.16B | 8.79B | 8.47B | 8.27B | 7.71B |
| Net Income Continuous Operations | 7.00B | 7.18B | 6.86B | 6.53B | 5.89B |
Data provided by Twelve Data
Balance Sheet
| fiscal_date | 2025-10-31 | 2024-10-31 | 2023-10-31 | 2022-10-31 | 2021-10-31 |
|---|---|---|---|---|---|
| Cash And Cash Equivalents | 7.24B | 8.02B | 6.13B | 2.00B | 5.00B |
| Accounts Receivable | 5.18B | 5.23B | 5.17B | 6.07B | 4.95B |
| Total Assets | 36.30B | 34.41B | 30.73B | 26.73B | 25.82B |
| Total Liabilities | 15.88B | 15.41B | 14.38B | 14.53B | 13.58B |
| Long Term Debt | 6.86B | 5.72B | 5.71B | 5.74B | 5.68B |
| Shareholders Equity | 20.41B | 19.00B | 16.35B | 12.19B | 12.25B |
Data provided by Twelve Data
Cash Flow Statement
| fiscal_date | 2025-10-31 | 2024-10-31 | 2023-10-31 | 2022-10-31 | 2021-10-31 |
|---|---|---|---|---|---|
| Operating Activities Net Income | 7.00B | 7.18B | 6.86B | 6.53B | 5.89B |
| Operating Activities Depreciation | 435.00M | 392.00M | 515.00M | 444.00M | 394.00M |
| Operating Activities Deferred Taxes | 639.00M | -633.00M | 24.00M | -223.00M | 80.00M |
| Operating Activities Stock Based Compensation | 668.00M | 577.00M | 490.00M | 413.00M | 346.00M |
| Operating Activities Other Non Cash Items | 210.00M | 47.00M | 40.00M | 36.00M | -70.00M |
| Operating Activities Accounts Receivable | 49.00M | -69.00M | 903.00M | -1.11B | -1.99B |
| Operating Activities Accounts Payable | 307.00M | 281.00M | -138.00M | 390.00M | 465.00M |
| Operating Activities Other Assets Liabilities | -806.00M | 516.00M | 30.00M | -532.00M | -216.00M |
| Operating Activities Operating Cash Flow | 8.50B | 8.29B | 8.72B | 5.94B | 4.90B |
| Investing Activities Net Acquisitions | -29.00M | 0.00 | -25.00M | -441.00M | -12.00M |
| Investing Activities Purchase Of Investments | -6.05B | -3.59B | -1.67B | -1.49B | -2.01B |
| Investing Activities Sale Of Investments | 5.53B | 2.45B | 1.27B | 1.36B | 1.47B |
| Investing Activities Other Investing Activity | 33.00M | N/A | N/A | N/A | N/A |
| Investing Activities Investing Cash Flow | -522.00M | -1.14B | -429.00M | -570.00M | -548.00M |
| Financing Activities Long Term Debt Issuance | 991.00M | 694.00M | 0.00 | 0.00 | 0.00 |
| Financing Activities Long Term Debt Payments | -1.20B | -502.00M | -907.00M | 0.00 | 0.00 |
| Financing Activities Short Term Debt Issuance | 1.00M | 1.00M | 91.00M | 0.00 | 0.00 |
| Financing Activities Common Stock Issuance | 261.00M | 243.00M | 227.00M | 199.00M | 175.00M |
| Financing Activities Common Stock Repurchase | -4.89B | -3.82B | -2.19B | -6.10B | -3.75B |
| Financing Activities Common Dividends | -1.38B | -1.19B | -975.00M | -873.00M | -838.00M |
| Financing Activities Other Financing Charges | -251.00M | -291.00M | -179.00M | -266.00M | -178.00M |
| Financing Activities Financing Cash Flow | -6.48B | -4.87B | -3.93B | -7.04B | -4.59B |
| End Cash Position | 7.31B | 8.11B | 6.23B | 2.10B | 5.10B |
| Income Tax Paid | 1.50B | 957.00M | 1.01B | 1.87B | 851.00M |
| Interest Paid | 239.00M | 205.00M | 205.00M | 205.00M | 205.00M |
| Free Cash Flow | 5.70B | 7.49B | 7.59B | 4.61B | 4.77B |
Data provided by Twelve Data
Technical Analysis
Key Insights
- Applied Materials is currently in a strong uptrend with price action showing consistent higher highs and higher lows across daily and weekly charts.
- Key support levels are identified near $580 and $540, while resistance is observed around the 52-week high near $740.
- The stock price is trading above its 10-day ($602), 50-day ($490), and 200-day ($339) moving averages, indicating bullish momentum across short to long-term horizons.
- Momentum indicators show RSI near 70, MACD above its signal line, and Stochastic oscillators in overbought territory, reflecting strong buying interest but potential for short-term consolidation.
- Multi-timeframe analysis confirms bullish trends on daily, weekly, and monthly charts with volume spikes supporting upward moves.
- Potential market scenarios include continuation of the uptrend supported by sustained AI demand or a short-term pullback to support levels before resuming upward momentum.
Trending News
1. Headline: Singapore cleanroom expansion lifts Applied Materials stock toward key resistance
Summary: Applied Materials (AMAT) stock is trading at $608.24, advancing 3.33% on the day. The price sits above its key moving averages, reflecting strength across multiple timeframes. ... Applied Materials expanded advanced cleanroom capacity in Singapore, boosting infrastructure to meet increasing ...
Sentiment: positive
2. Headline: Stifel raises Applied Materials stock price target on product portfolio By Investing.com
Summary: According to InvestingPro analysis, ... it among stocks on the Most Overvalued list. For deeper insights, investors can access AMAT’s comprehensive Pro Research Report, one of 1,400+ available reports featuring expert analysis and actionable intelligence. In other recent news, Applied Materials has been the focus of several significant developments. Mizuho has raised its price target for Applied Materials to $650, maintaining an Outperform rating. This adjustment reflects increased estimates ...
Sentiment: positive
3. Headline: Applied Materials (AMAT) Stock Jumps after CEO Says AI Chip Demand Has Years to Run - TipRanks.com
Summary: Applied Materials ($AMAT) stock jumped on Thursday after CEO Gary Dickerson said that chipmakers are planning further ahead than usual, which suggests that the AI b...
Sentiment: positive
4. Headline: Applied Materials and KLA Corporation Shares Are Soaring, What You Need To Know - StockStory
Summary: The stock market overreacts to news, and big price drops can present good opportunities to buy high-quality stocks. ... Semiconductor Manufacturing company Applied Materials (NASDAQ:AMAT) jumped 5%. Is now the time to buy Applied Materials?
Sentiment: positive
5. Headline: Why Is Applied Materials Stock Soaring Thursday? - Applied Materials (NASDAQ:AMAT) - Benzinga
Summary: Susquehanna reiterated Positive and increased its price forecast to $900 on June 30. AMAT Stock Price Activity: Applied Materials shares were up 6.77% at $609.12 at the time of publication on Thursday, according to Benzinga Pro data. ... To add Benzinga News as your preferred source on Google, ...
Sentiment: positive
Powered by Brave
Recent Updates
News Summary
As of July 9, 2026. Applied Materials’ CEO Gary Dickerson emphasized sustained long-term demand for AI chips, indicating that semiconductor equipment investments are expected to continue robustly through 2030. This outlook contributed to an 8% stock rally and prompted TD Cowen to raise its price target to $700 ahead of earnings. Despite a recent chip sector selloff triggered by Samsung’s earnings report, Applied Materials remains well-positioned due to its exposure to leading chipmakers and strong growth guidance, including a forecasted semiconductor equipment business growth exceeding 30% in calendar 2026. The selloff was sector-specific and not indicative of broader market weakness, reflecting investor caution around elevated valuations and demand sustainability.
News Sentiment
The overall sentiment from recent updates is predominantly positive, driven by the CEO’s optimistic long-term demand forecast for AI-related semiconductor equipment and strong earnings guidance. This positive outlook is somewhat tempered by a sector-specific selloff following Samsung’s earnings, which raised concerns about the sustainability of high sales and margins. However, the company’s strong market position, growth prospects, and institutional support contribute to a balanced but constructive sentiment. Investors appear to be weighing robust growth potential against cyclical risks inherent in the semiconductor industry.
Source List
- https://www.tipranks.com/news/applied-materials-amat-stock-jumps-after-ceo-says-ai-chip-demand-has-years-to-run
- https://blockonomi.com/applied-materials-amat-stock-rallies-8-on-extended-chip-demand-forecast-through-2030/
Analytical Overview
Analysis Summary
Applied Materials’ valuation metrics, including a trailing P/E of 56.8 and forward P/E of 36.8, are somewhat elevated relative to the semiconductor equipment industry average P/E of 56.8, indicating premium pricing aligned with growth expectations. The PEG ratio of 1.69 suggests moderate valuation relative to earnings growth.
The company shows a strong growth trajectory with quarterly revenue growth of 11.4% and quarterly earnings growth of 31.3% year-over-year, supported by expanding AI chip demand and capital expenditures. Operating cash flow of approximately $7.99 billion and free cash flow of $3.04 billion reflect healthy cash generation.
Financial health is solid with a current ratio of 2.51, total debt to equity ratio of 0.30, and cash reserves exceeding $8.2 billion, indicating ample liquidity and manageable leverage. These metrics support operational flexibility and investment capacity.
Sector-specific opportunities include sustained AI-driven semiconductor demand and technological innovation in chipmaking equipment, while challenges involve cyclical capital spending and competitive pressures from peers.
Consideration of market positioning and competitive advantages highlights Applied Materials’ leadership in semiconductor systems and global services, supported by strong institutional ownership and strategic capacity expansions.
Overall Business and Market Assessment
Supporting Factors: Applied Materials demonstrates strong fundamentals with robust profitability, efficient capital use, and significant growth driven by AI chip demand. Key supporting factors include solid cash flow, manageable debt, and strategic investments in advanced manufacturing capacity. Risks to monitor include sector cyclicality, valuation premiums, and sensitivity to semiconductor capital expenditure cycles. A medium to long-term investment horizon may be appropriate to capture growth while managing volatility. Overall, the company presents a balanced profile with both growth potential and inherent industry risks.
Risk Factors: No data
SWOT Analysis
Strengths
- Market leadership in semiconductor equipment and materials engineering.
- Strong profitability with gross margin near 50% and net margin above 29%.
- Robust cash flow generation and solid balance sheet with low debt-to-equity ratio.
- High institutional ownership supporting governance and strategic initiatives.
Weaknesses
- Elevated valuation multiples indicating premium pricing.
- Dependence on cyclical semiconductor capital expenditure trends.
- Limited insider ownership which may impact alignment with shareholders.
- High price-to-book ratio suggesting market expectations are priced in.
Opportunities
- Growing demand for AI and advanced semiconductor manufacturing equipment.
- Expansion of cleanroom capacity and new product launches in key markets.
- Increasing semiconductor capital investments driven by technology innovation.
- Potential to capture market share through integrated service offerings.
Threats
- Volatility in semiconductor industry demand and capital spending cycles.
- Intense competition from peers with higher returns on equity.
- Regulatory and geopolitical risks affecting global supply chains.
- Market corrections impacting high-growth technology valuations.
Company Description
Applied Materials, Inc. provides materials engineering solutions, equipment, services, and software to the semiconductor and related industries worldwide, including the United States, China, Korea, Taiwan, Japan, Southeast Asia, and Europe. The company operates through two primary segments: Semiconductor Systems and Applied Global Services. The Semiconductor Systems segment develops and produces critical capital equipment for wafer fabrication, enabling key materials engineering processes such as etch, rapid thermal processing, deposition, chemical mechanical planarization, metrology and inspection, wafer packaging, and ion implantation. The Applied Global Services segment delivers integrated solutions to optimize equipment and factory performance, including spares, upgrades, services, and factory automation software for semiconductor and other products. Applied Materials, Inc. serves manufacturers of semiconductor wafers, chips, and other electronic devices, playing a pivotal role in advancing chip production technologies. Founded in 1967 and headquartered in Santa Clara, California, it maintains a leading position in the global semiconductor equipment market.