
Apple Inc (AAPL)
Stock Analysis Report
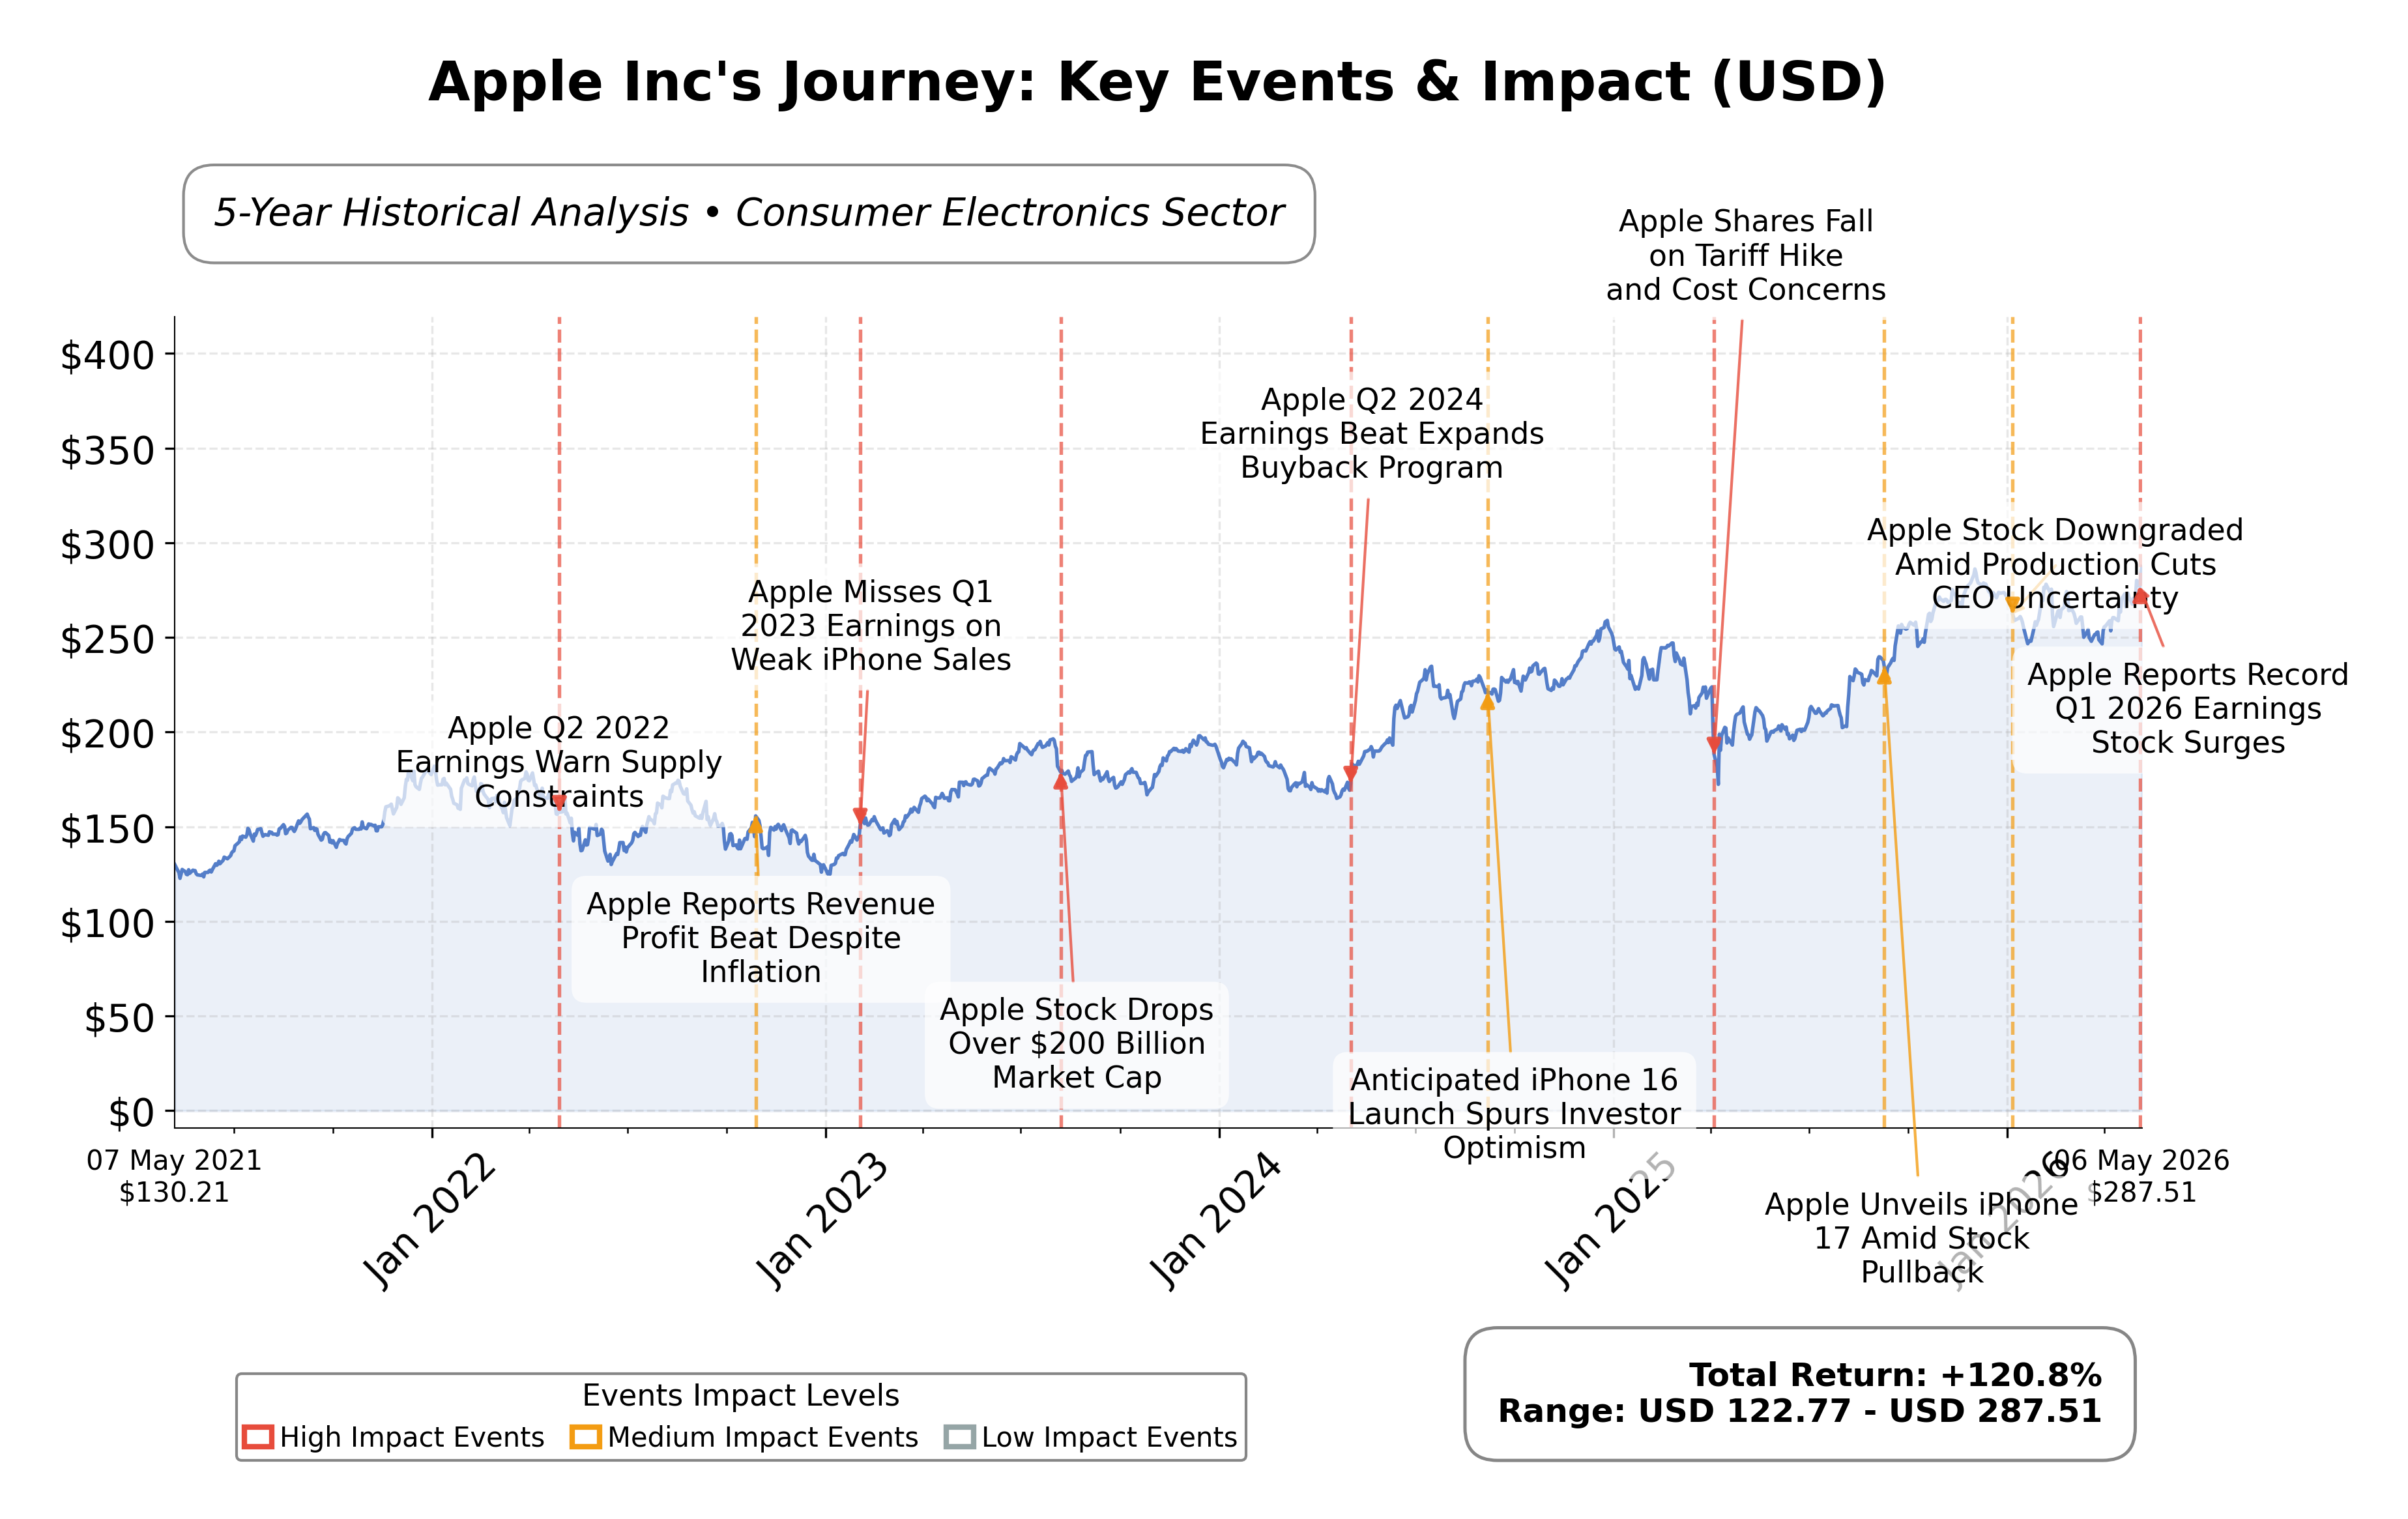
Stock Journey
Key Positives and Key Risks
Pros
- Market capitalization of $4.11 trillion reflects dominant scale and investor confidence.
- Strong profitability with a net profit margin of 27.15% and ROE of 141.47% indicates efficient capital use.
- Robust cash flow generation with operating cash flow of $140.2 billion and free cash flow of $100.5 billion supports growth and shareholder returns.
Cons
- High valuation metrics including a P/B ratio of 46.71 may limit upside potential.
- Dependence on iPhone sales for significant revenue exposes the company to product cycle risks.
- Regulatory scrutiny and recent $250 million settlement could impact brand perception and operational focus.
Disclosure: This information is for general awareness and does not constitute investment advice
Report Summary
Apple Inc. is a leading technology company listed on NASDAQ under the symbol AAPL, operating primarily in the consumer electronics sector within the technology industry. The company designs, manufactures, and markets a wide range of innovative hardware and software products, including the flagship iPhone, Mac computers, iPads, Apple Watch, and a variety of accessories. Additionally, Apple offers digital services such as the App Store, Apple Music, iCloud, and subscription platforms, enabling a comprehensive ecosystem that supports its global customer base. With a market capitalization exceeding $4.1 trillion, Apple holds a dominant position in the consumer electronics market and maintains extensive global distribution channels.
Financially, Apple reported trailing twelve months (TTM) revenue of approximately $451.4 billion, with a net profit margin of 27.15%, operating margin of 32.28%, and a return on equity (ROE) of 141.47%, indicating exceptional profitability and capital efficiency. The return on assets (ROA) stands at 26.23%, and the return on invested capital (ROIC) is reflected in an enterprise value to EBITDA ratio of 25.79, underscoring the company's effective use of assets and investments to generate earnings. Operating cash flow for the TTM period was $140.2 billion, with a levered free cash flow of $100.5 billion, demonstrating robust cash generation capabilities.
Apple’s valuation metrics show a trailing price-to-earnings (P/E) ratio of 33.92 and a forward P/E of 29.39, both above the industry average of approximately 33.92, reflecting premium pricing relative to earnings expectations. The price-to-book (P/B) ratio is notably high at 46.71, suggesting significant market confidence in the company's intangible assets and growth prospects. The stock trades near its 52-week high of $288.62, with a current price of $287.47, indicating limited upside from recent highs. Market capitalization stands at $4.11 trillion, positioning Apple among the largest publicly traded companies globally.
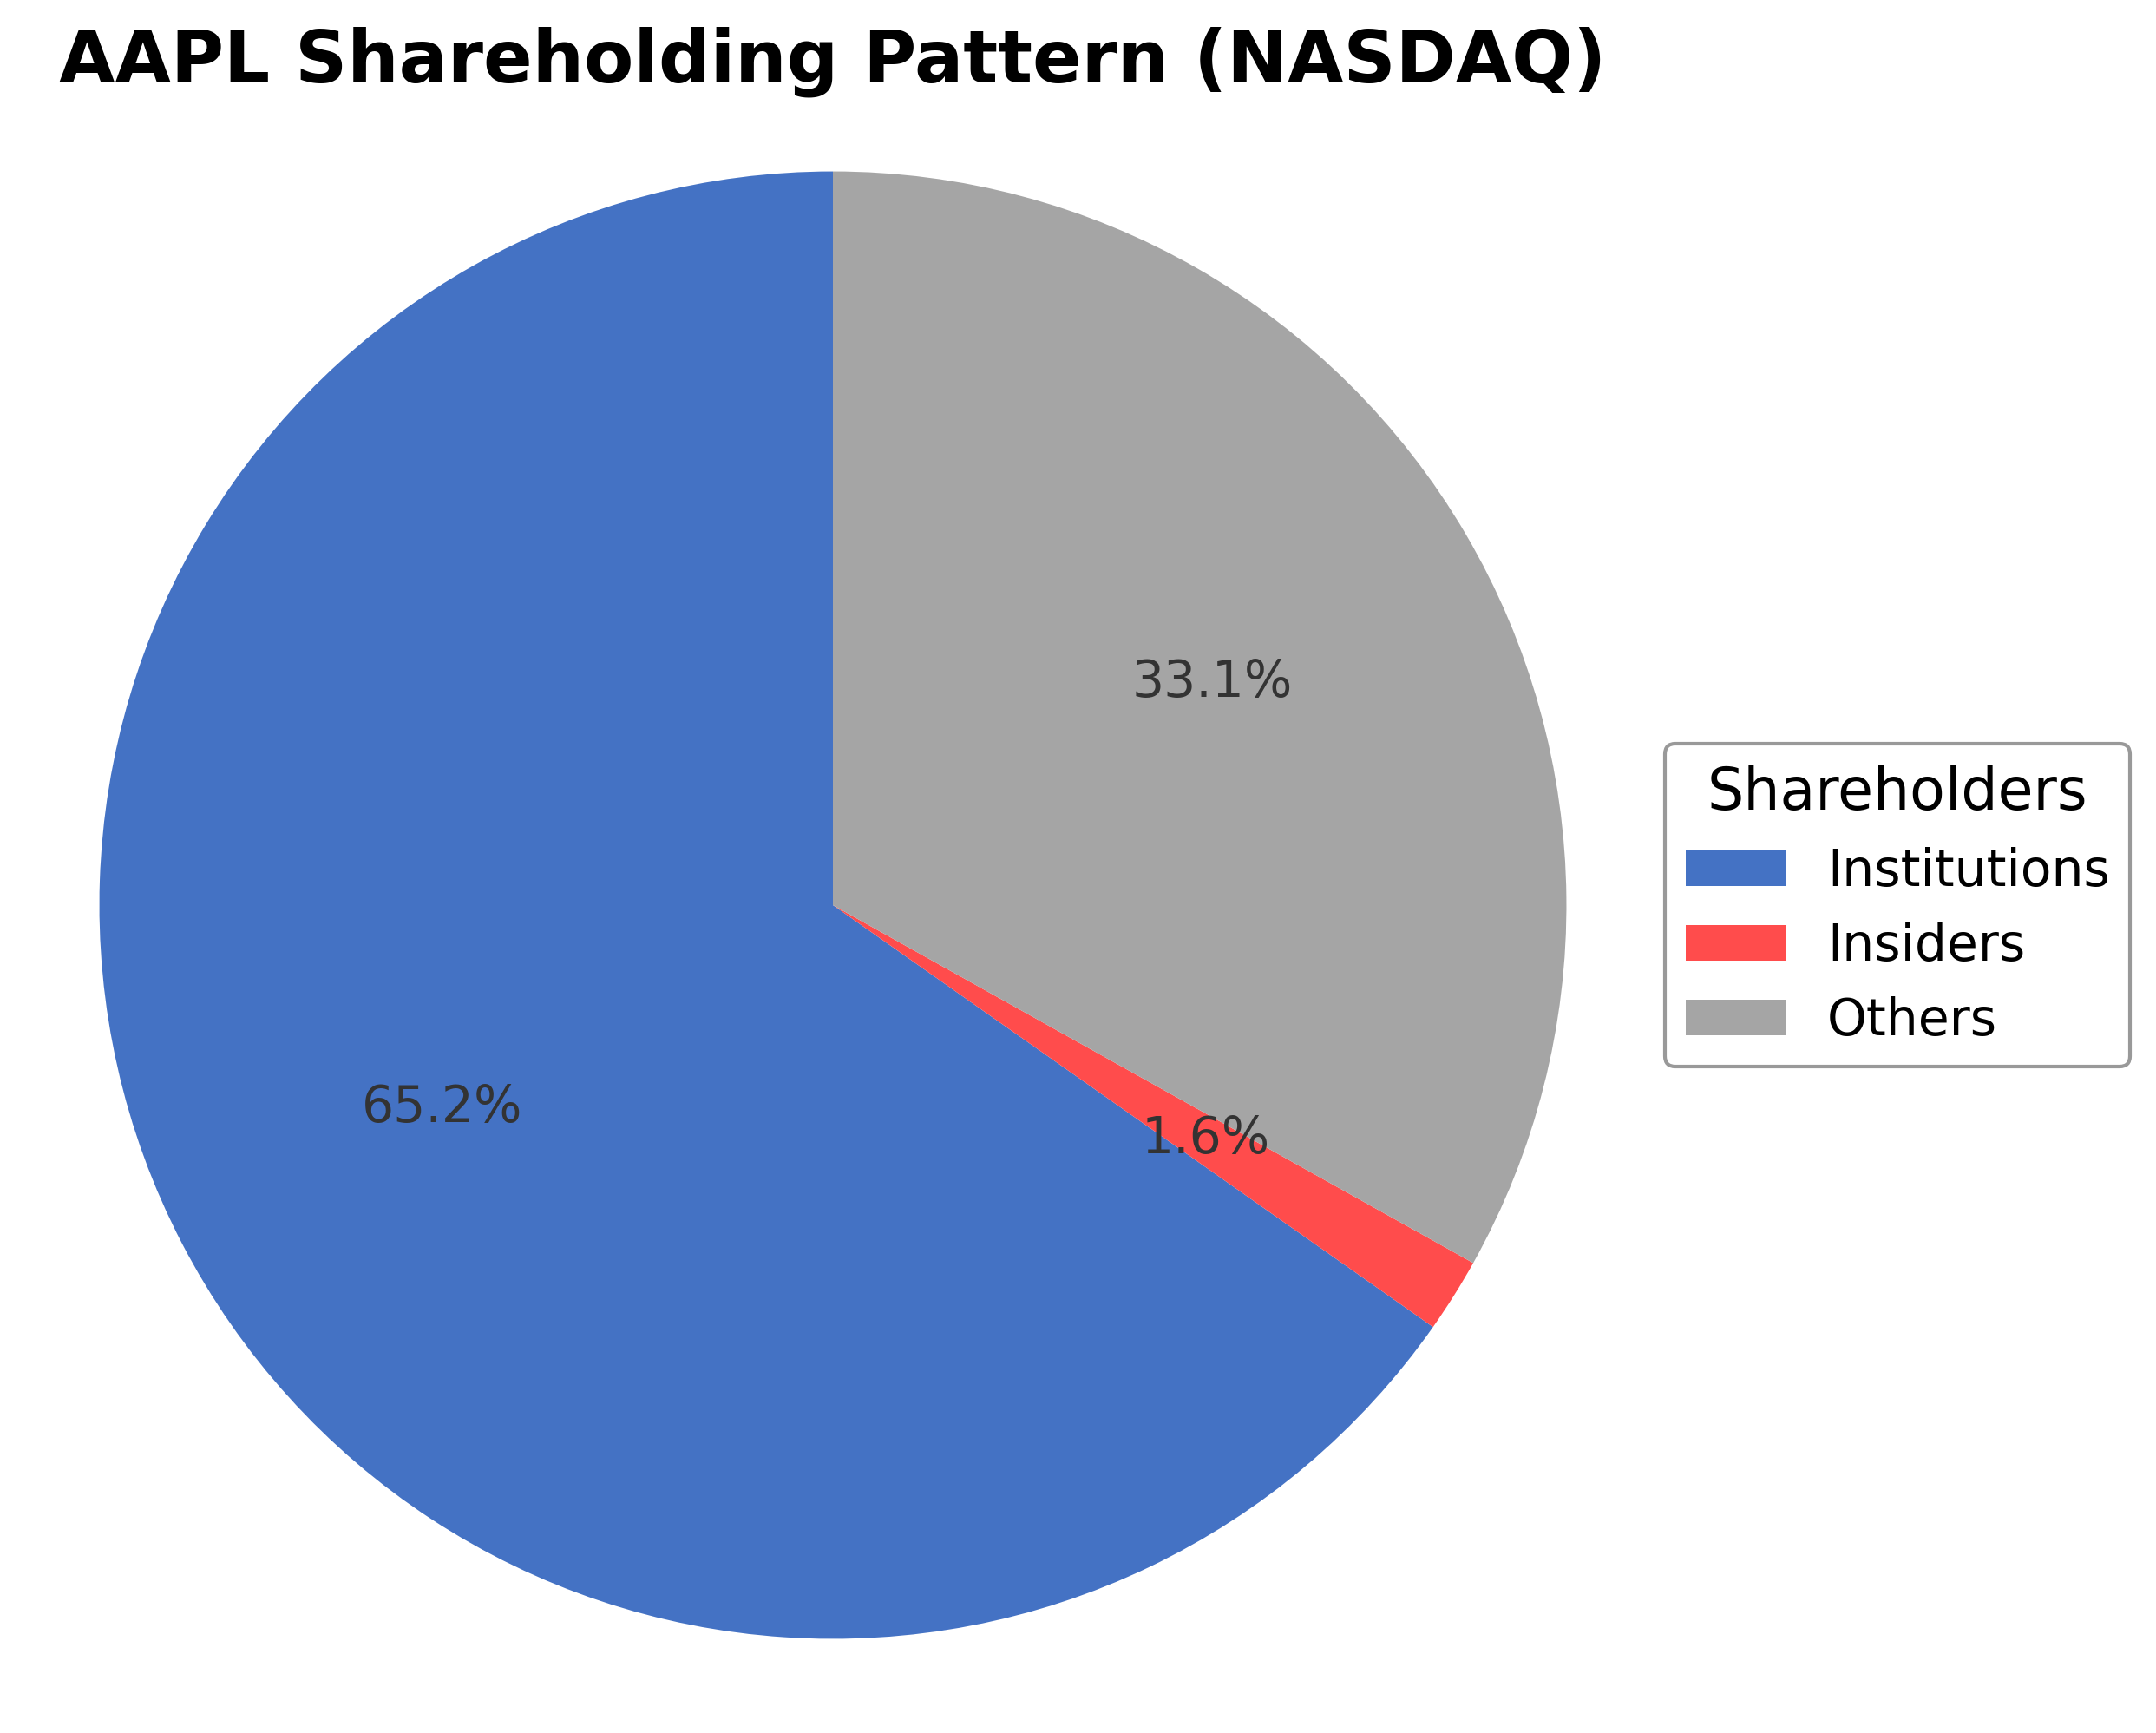
Key strengths include strong cash flow generation, a low debt-to-equity ratio of 79.55%, and a dominant market position supported by a diversified product and services portfolio. Institutional investors hold approximately 65.25% of shares, reflecting broad institutional confidence. Risks include regulatory scrutiny, competitive pressures in technology and consumer electronics, and supply chain dependencies, particularly in chip sourcing. Recent strategic developments include a $250 million settlement related to AI marketing claims, ongoing chip supply discussions with Intel, and increased R&D spending exceeding 10% of sales, highlighting a focus on innovation and growth.
Technically, Apple’s stock price is trading above its 50-day and 200-day moving averages, with momentum indicators showing strength across multiple timeframes. Recent news highlights positive sentiment driven by strong earnings, product launches, and strategic partnerships, although some caution is warranted given the stock’s proximity to all-time highs. Overall, the data suggests a balanced environment where market participants may consider accumulation or monitoring for potential consolidation, reflecting a mature and well-established market position.
Company and Industry Overview
Company Basics
Price Performance
Company Size
Shareholding Pattern
Sector and Industry Analysis
The global apple market is projected to grow by approximately USD 15.94 billion from 2024 to 2029, with a compound annual growth rate (CAGR) of 3.4%. This growth is supported by increasing consumer demand driven by health benefits and the introduction of new apple varieties. The market encompasses around 25 key vendors, including notable players such as Auvil Fruit Co. Inc., Stemilt Growers LLC, and Washington Fruit Growers, who collectively shape the competitive landscape.
Industry trends highlight a rising popularity of urban farming and expansion of retail channels, including private-label brands, which are contributing to market growth. The market is segmented by apple type—primarily red apples and Granny Smith/golden apples—and distribution channels, both offline and online. Barriers to entry include the need for efficient supply chains and differentiation through product variety and quality, while competition remains intense among established orchard operators and distributors.
Regulatory frameworks affecting the apple market focus on food safety standards, pesticide use, and import-export controls, which vary by region. Compliance with these regulations is critical for market participants to maintain access to key geographic markets such as APAC, Europe, and North America. Ongoing regulatory scrutiny is expected to influence operational practices and may drive innovation in sustainable farming and supply chain transparency.
Note: Analysis synthesized from industry research, market reports, and regulatory filings. Information is subject to change based on market conditions.
Financial Ratios Dashboard
Illustrative Scenario Analysis
DCF Assumptions:
Method: Two-Stage EPS-Priority Model
Financials
Peer Analysis
| Company Name | Market Cap | P/E Ratio | P/B Ratio | EV/EBITDA | Price to CFO |
|---|---|---|---|---|---|
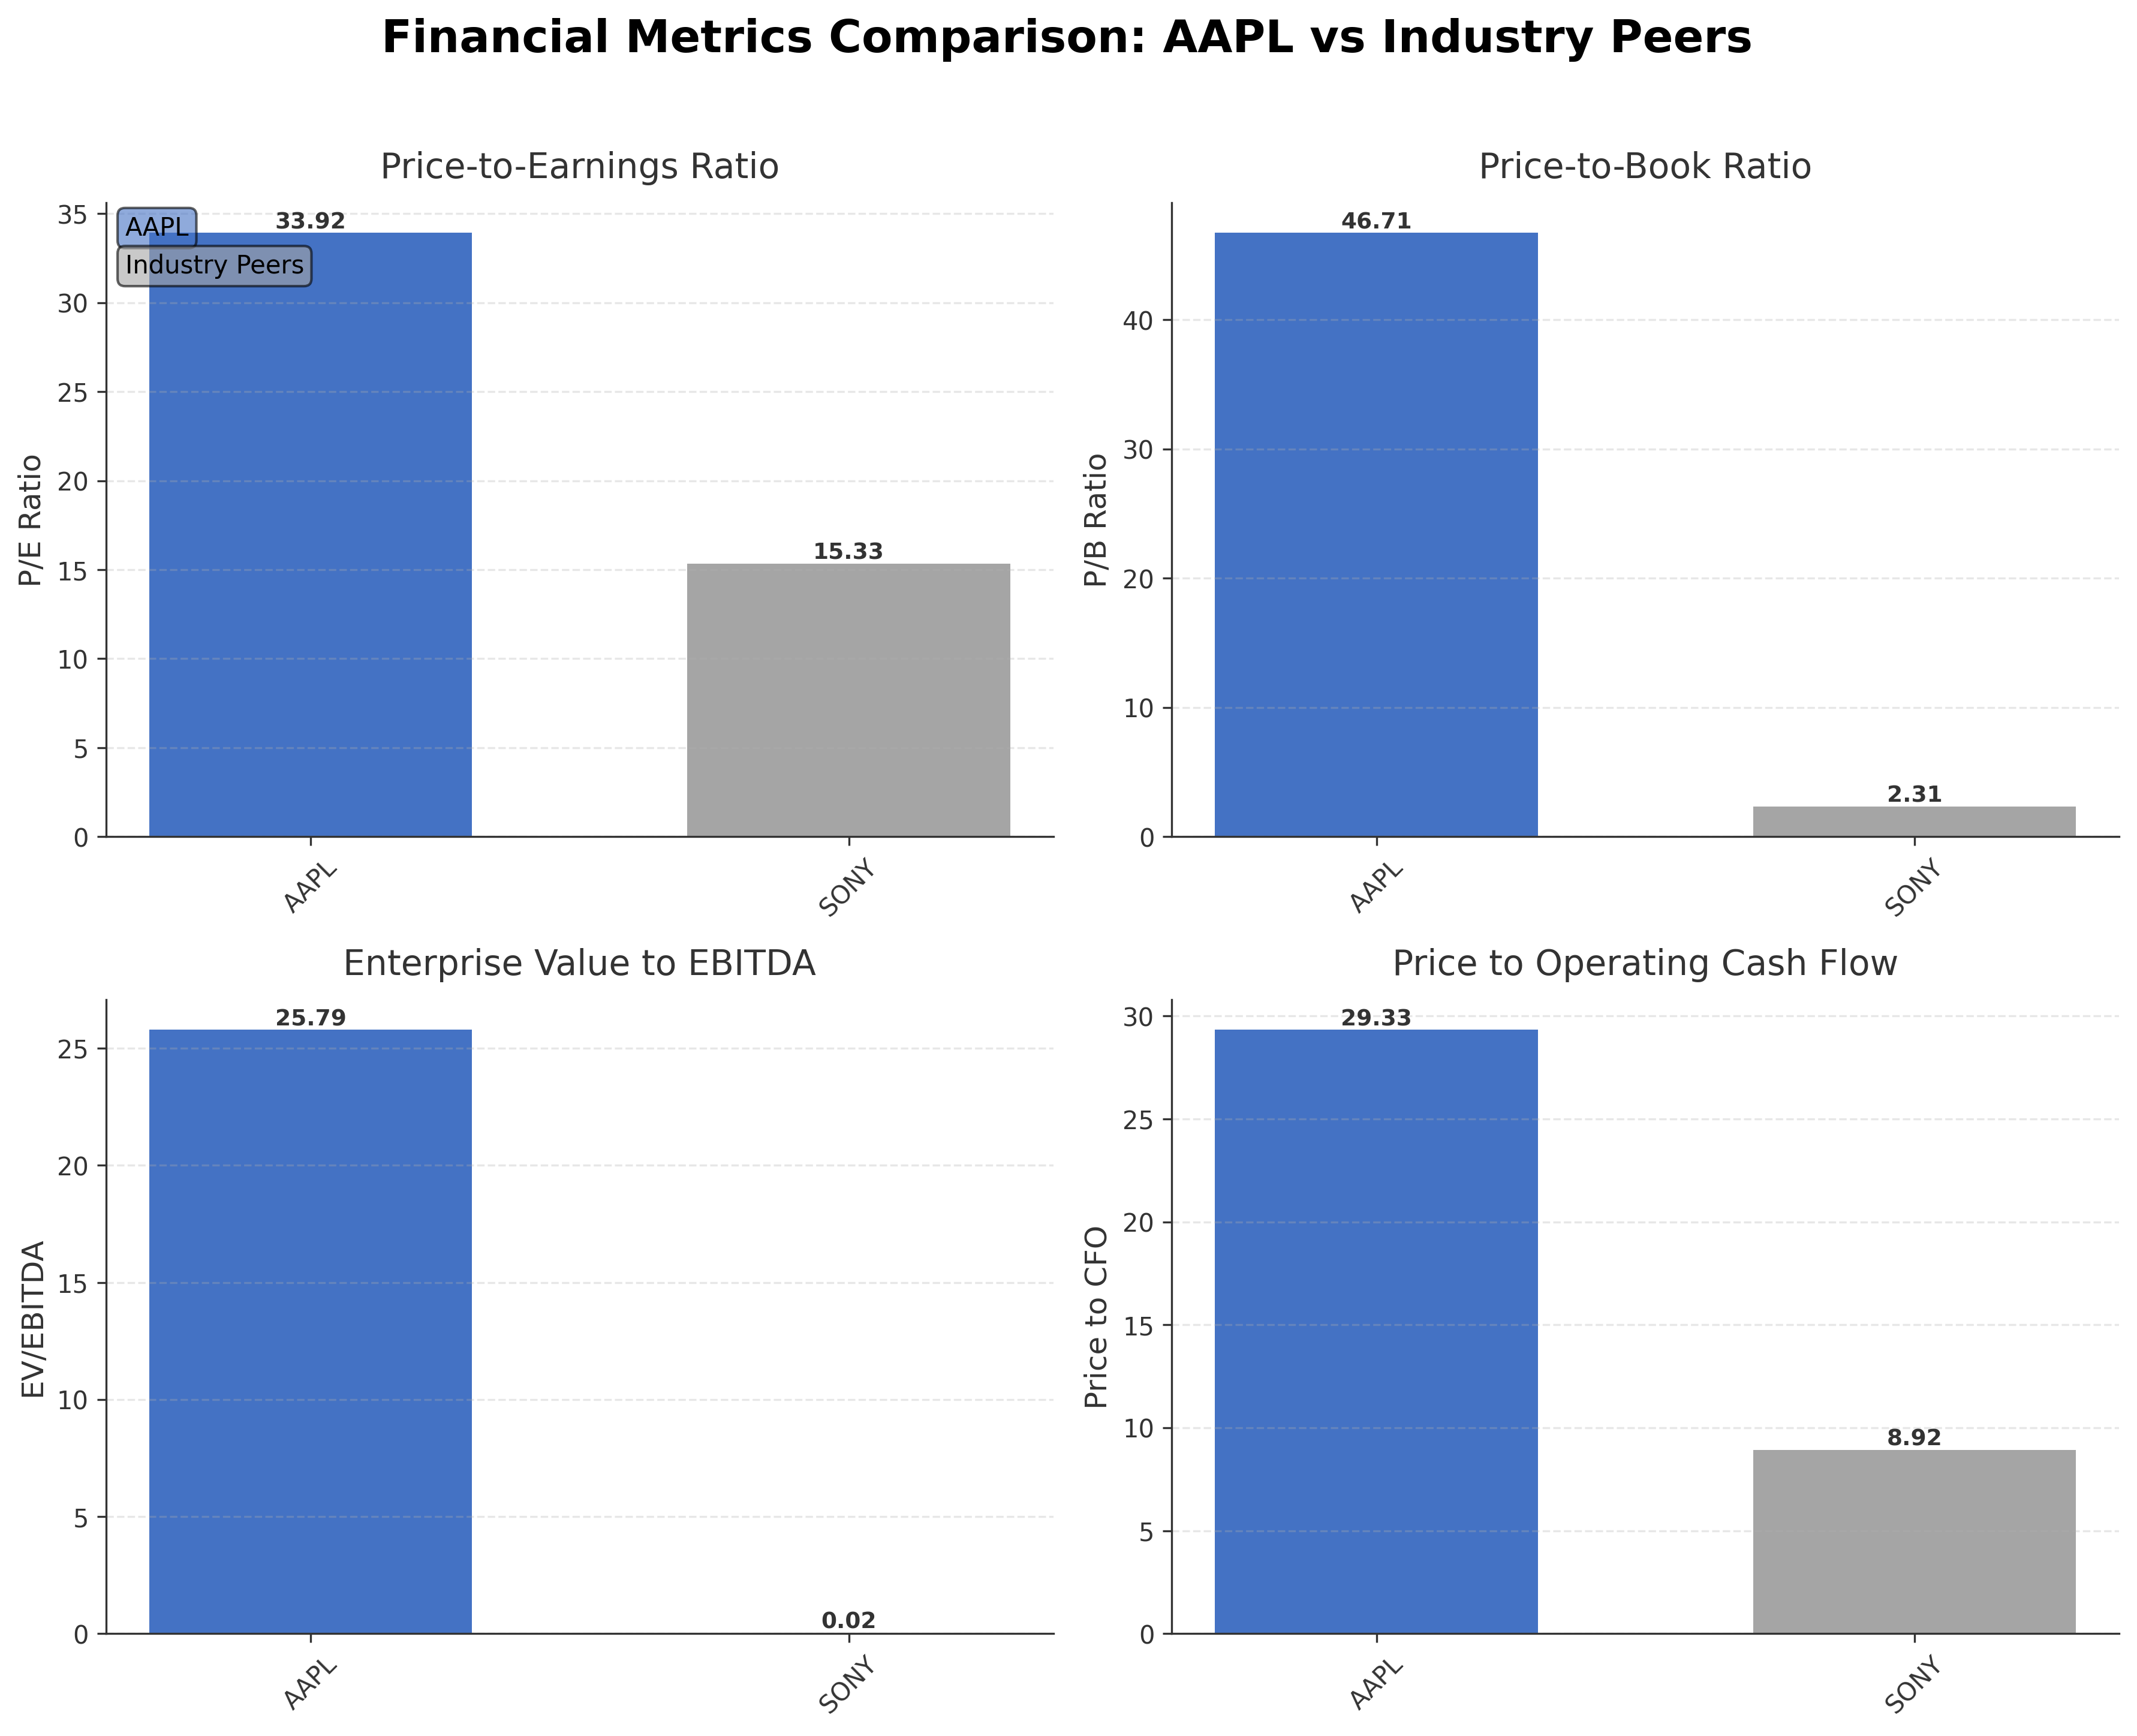
| Apple Inc | $4.11T | 33.92 | 46.71 | 25.79 | 29.33 |
| Sony Group Corporation - Sponsored American Depositary Receipt | $116.85B | 15.33 | 2.31 | 0.02 | 8.92 |
Comparison Analysis: Apple Inc. significantly outpaces its peer Sony Group Corporation in market capitalization, with a valuation exceeding $4.1 trillion compared to Sony's $116.85 billion. Apple's P/E ratio of 33.92 is more than double Sony's 15.33, reflecting higher growth expectations and premium market positioning. The P/B ratio for Apple is markedly higher at 46.71 versus Sony's 2.31, indicating substantial intangible asset valuation and investor confidence. Enterprise value to EBITDA for Apple is 25.79, substantially above Sony's 0.02, suggesting greater earnings power relative to enterprise value. Apple's return on equity of 1.41% also surpasses Sony's 0.15%, highlighting superior profitability and capital efficiency within the consumer electronics sector.
Financial Metrics Comparison with Peers
Financial Statements
Comprehensive financial data including income, balance sheet, and cash flow metrics
Income Statement
| fiscal_date | 2025-09-30 | 2024-09-30 | 2023-09-30 | 2022-09-30 | 2021-09-30 |
|---|---|---|---|---|---|
| Sales | 416.16B | 391.04B | 383.29B | 394.33B | 365.82B |
| Cost Of Goods | 220.96B | 210.35B | 214.14B | 223.55B | 212.98B |
| Gross Profit | 195.20B | 180.68B | 169.15B | 170.78B | 152.84B |
| Operating Expense Research And Development | 34.55B | 31.37B | 29.91B | 26.25B | 21.91B |
| Operating Expense Selling General And Administrative | 27.60B | 26.10B | 24.93B | 25.09B | 21.97B |
| Operating Income | 133.05B | 123.22B | 114.30B | 119.44B | 108.95B |
| Other Income Expense | -321.00M | 269.00M | -565.00M | -334.00M | 60.00M |
| Pretax Income | 132.73B | 123.48B | 113.74B | 119.10B | 109.21B |
| Income Tax | 20.72B | 29.75B | 16.74B | 19.30B | 14.53B |
| Net Income | 112.01B | 93.74B | 97.00B | 99.80B | 94.68B |
| Eps Basic | 7.49 | 6.11 | 6.16 | 6.15 | 5.67 |
| Eps Diluted | 7.46 | 6.08 | 6.13 | 6.11 | 5.61 |
| Basic Shares Outstanding | 14.95B | 15.34B | 15.74B | 16.22B | 16.70B |
| Diluted Shares Outstanding | 14.95B | 15.34B | 15.74B | 16.22B | 16.70B |
| Ebit | 133.05B | 123.22B | 114.30B | 119.44B | 111.85B |
| Ebitda | 144.75B | 134.66B | 125.82B | 130.54B | 123.14B |
| Net Income Continuous Operations | 112.01B | 93.74B | 97.00B | 99.80B | 94.68B |
| Non Operating Interest Income | N/A | N/A | 3.75B | 2.83B | 2.84B |
| Non Operating Interest Expense | N/A | N/A | 3.93B | 2.93B | 2.65B |
Source: Financial statements and regulatory filings
Balance Sheet
| fiscal_date | 2025-09-30 | 2024-09-30 | 2023-09-30 | 2022-09-30 | 2021-09-30 |
|---|---|---|---|---|---|
| Cash And Cash Equivalents | 35.93B | 29.94B | 29.96B | 23.65B | 34.94B |
| Accounts Receivable | 39.78B | 33.41B | 29.51B | 28.18B | 26.28B |
| Total Assets | 359.24B | 364.98B | 352.58B | 352.75B | 351.00B |
| Total Liabilities | 285.51B | 308.03B | 290.44B | 302.08B | 287.91B |
| Long Term Debt | 78.33B | 85.75B | 95.28B | 109.71B | 119.38B |
| Shareholders Equity | 73.73B | 56.95B | 62.15B | 50.67B | 63.09B |
Source: Financial statements and regulatory filings
Cash Flow Statement
| fiscal_date | 2025-09-30 | 2024-09-30 | 2023-09-30 | 2022-09-30 | 2021-09-30 |
|---|---|---|---|---|---|
| Operating Activities Net Income | 112.01B | 93.74B | 97.00B | 99.80B | 94.68B |
| Operating Activities Depreciation | 11.70B | 11.45B | 11.52B | 11.10B | 11.28B |
| Operating Activities Stock Based Compensation | 12.86B | 11.69B | 10.83B | 9.04B | 7.91B |
| Operating Activities Other Non Cash Items | -89.00M | -2.27B | -2.23B | 1.01B | -4.92B |
| Operating Activities Accounts Receivable | -7.03B | -5.14B | -417.00M | -9.34B | -14.03B |
| Operating Activities Accounts Payable | 902.00M | 6.02B | -1.89B | 9.45B | 12.33B |
| Operating Activities Other Assets Liabilities | -18.87B | 2.77B | -4.27B | 1.57B | -1.53B |
| Operating Activities Operating Cash Flow | 111.48B | 118.25B | 110.54B | 123.52B | 100.94B |
| Investing Activities Capital Expenditures | -12.71B | -9.45B | -10.96B | -10.71B | -11.09B |
| Investing Activities Purchase Of Investments | -24.41B | -48.66B | -29.51B | -76.92B | -109.56B |
| Investing Activities Sale Of Investments | 53.80B | 62.35B | 45.51B | 67.36B | 106.48B |
| Investing Activities Other Investing Activity | -1.48B | -1.31B | -1.34B | -2.09B | -385.00M |
| Investing Activities Investing Cash Flow | 15.20B | 2.94B | 3.71B | -22.66B | -14.58B |
| Financing Activities Long Term Debt Issuance | 4.48B | 0.00 | 5.23B | 5.46B | 20.39B |
| Financing Activities Long Term Debt Payments | -10.93B | -9.96B | -11.15B | -9.54B | -8.75B |
| Financing Activities Short Term Debt Issuance | -2.03B | 3.96B | -3.98B | 3.96B | 1.02B |
| Financing Activities Common Stock Repurchase | -90.71B | -94.95B | -77.55B | -89.40B | -85.97B |
| Financing Activities Common Dividends | -15.42B | -15.23B | -15.03B | -14.84B | -14.47B |
| Financing Activities Other Financing Charges | -6.07B | -5.80B | -6.01B | -6.38B | -5.58B |
| Financing Activities Financing Cash Flow | -120.69B | -121.98B | -108.49B | -110.75B | -92.25B |
| End Cash Position | 35.93B | 29.94B | 30.74B | 24.98B | 35.93B |
| Income Tax Paid | 43.37B | 26.10B | 18.68B | 19.57B | 25.39B |
| Free Cash Flow | 98.77B | 108.81B | 99.58B | 111.44B | 92.95B |
| Interest Paid | N/A | N/A | 3.80B | 2.87B | 2.69B |
| Operating Activities Deferred Taxes | N/A | N/A | N/A | 895.00M | -4.77B |
| Investing Activities Net Acquisitions | N/A | N/A | N/A | -306.00M | -33.00M |
| Financing Activities Common Stock Issuance | N/A | N/A | N/A | N/A | 1.10B |
Source: Financial statements and regulatory filings
Technical Analysis
Key Insights
- Apple's stock is currently in a strong uptrend, trading near its 52-week high with consistent higher highs and higher lows observed in recent price action.
- Key support levels are identified around $260 and $255, corresponding to the 50-day and 200-day moving averages respectively, while resistance is near the recent high of $288.62.
- The stock price is above the 10-day, 50-day (at $261.22), and 200-day (at $255.18) moving averages, indicating bullish momentum across short and long-term timeframes.
- Momentum indicators show the Relative Strength Index (RSI) in a moderately overbought zone, MACD remains positive with bullish crossover signals, and Stochastic oscillators suggest sustained upward momentum.
- Multi-timeframe analysis reveals daily and weekly charts support the bullish trend, while monthly charts confirm a long-term upward trajectory with no significant reversal signals.
- Current technical setup suggests potential for continued consolidation near highs with possible short-term pullbacks to support levels before resuming upward movement.
Trending News
1. Headline: Thursday Wall Street stocks by analysts include Nvidia, Apple, Uber
Summary: Here are the biggest calls on Wall Street on Thursday.
Sentiment: neutral
2. Headline: Are you eligible for a share of Apple's $250M new Siri settlement? - 9to5Mac
Summary: We reported earlier this week that Apple had reached a $250 million settlement over delays to the introduction of the...
Sentiment: positive
3. Headline: Apple agrees to $250M settlement over iPhone AI marketing claims | Fox Business
Summary: Apple agreed to a $250M settlement over claims it misled buyers about AI-powered Siri features on certain iPhones. Eligible users could receive up to $95.
Sentiment: positive
4. Headline: INTC Stock Surges on Apple Talks, but Overbought Signals Flash
Summary: Apple’s reported talks with Intel reinforce the company’s dramatic turnaround, though after a historic rally, the stock may need time to cool before its next move higher.
Sentiment: positive
5. Headline: Apple's R&D investments top 10% of sales as AI race creates 'sense of urgency'
Summary: Apple’s R&D spending has crossed 10% of revenue for the first time in at least 30 years, and increased twice as fast as sales in the latest quarter.
Sentiment: positive
Recent Updates
News Summary
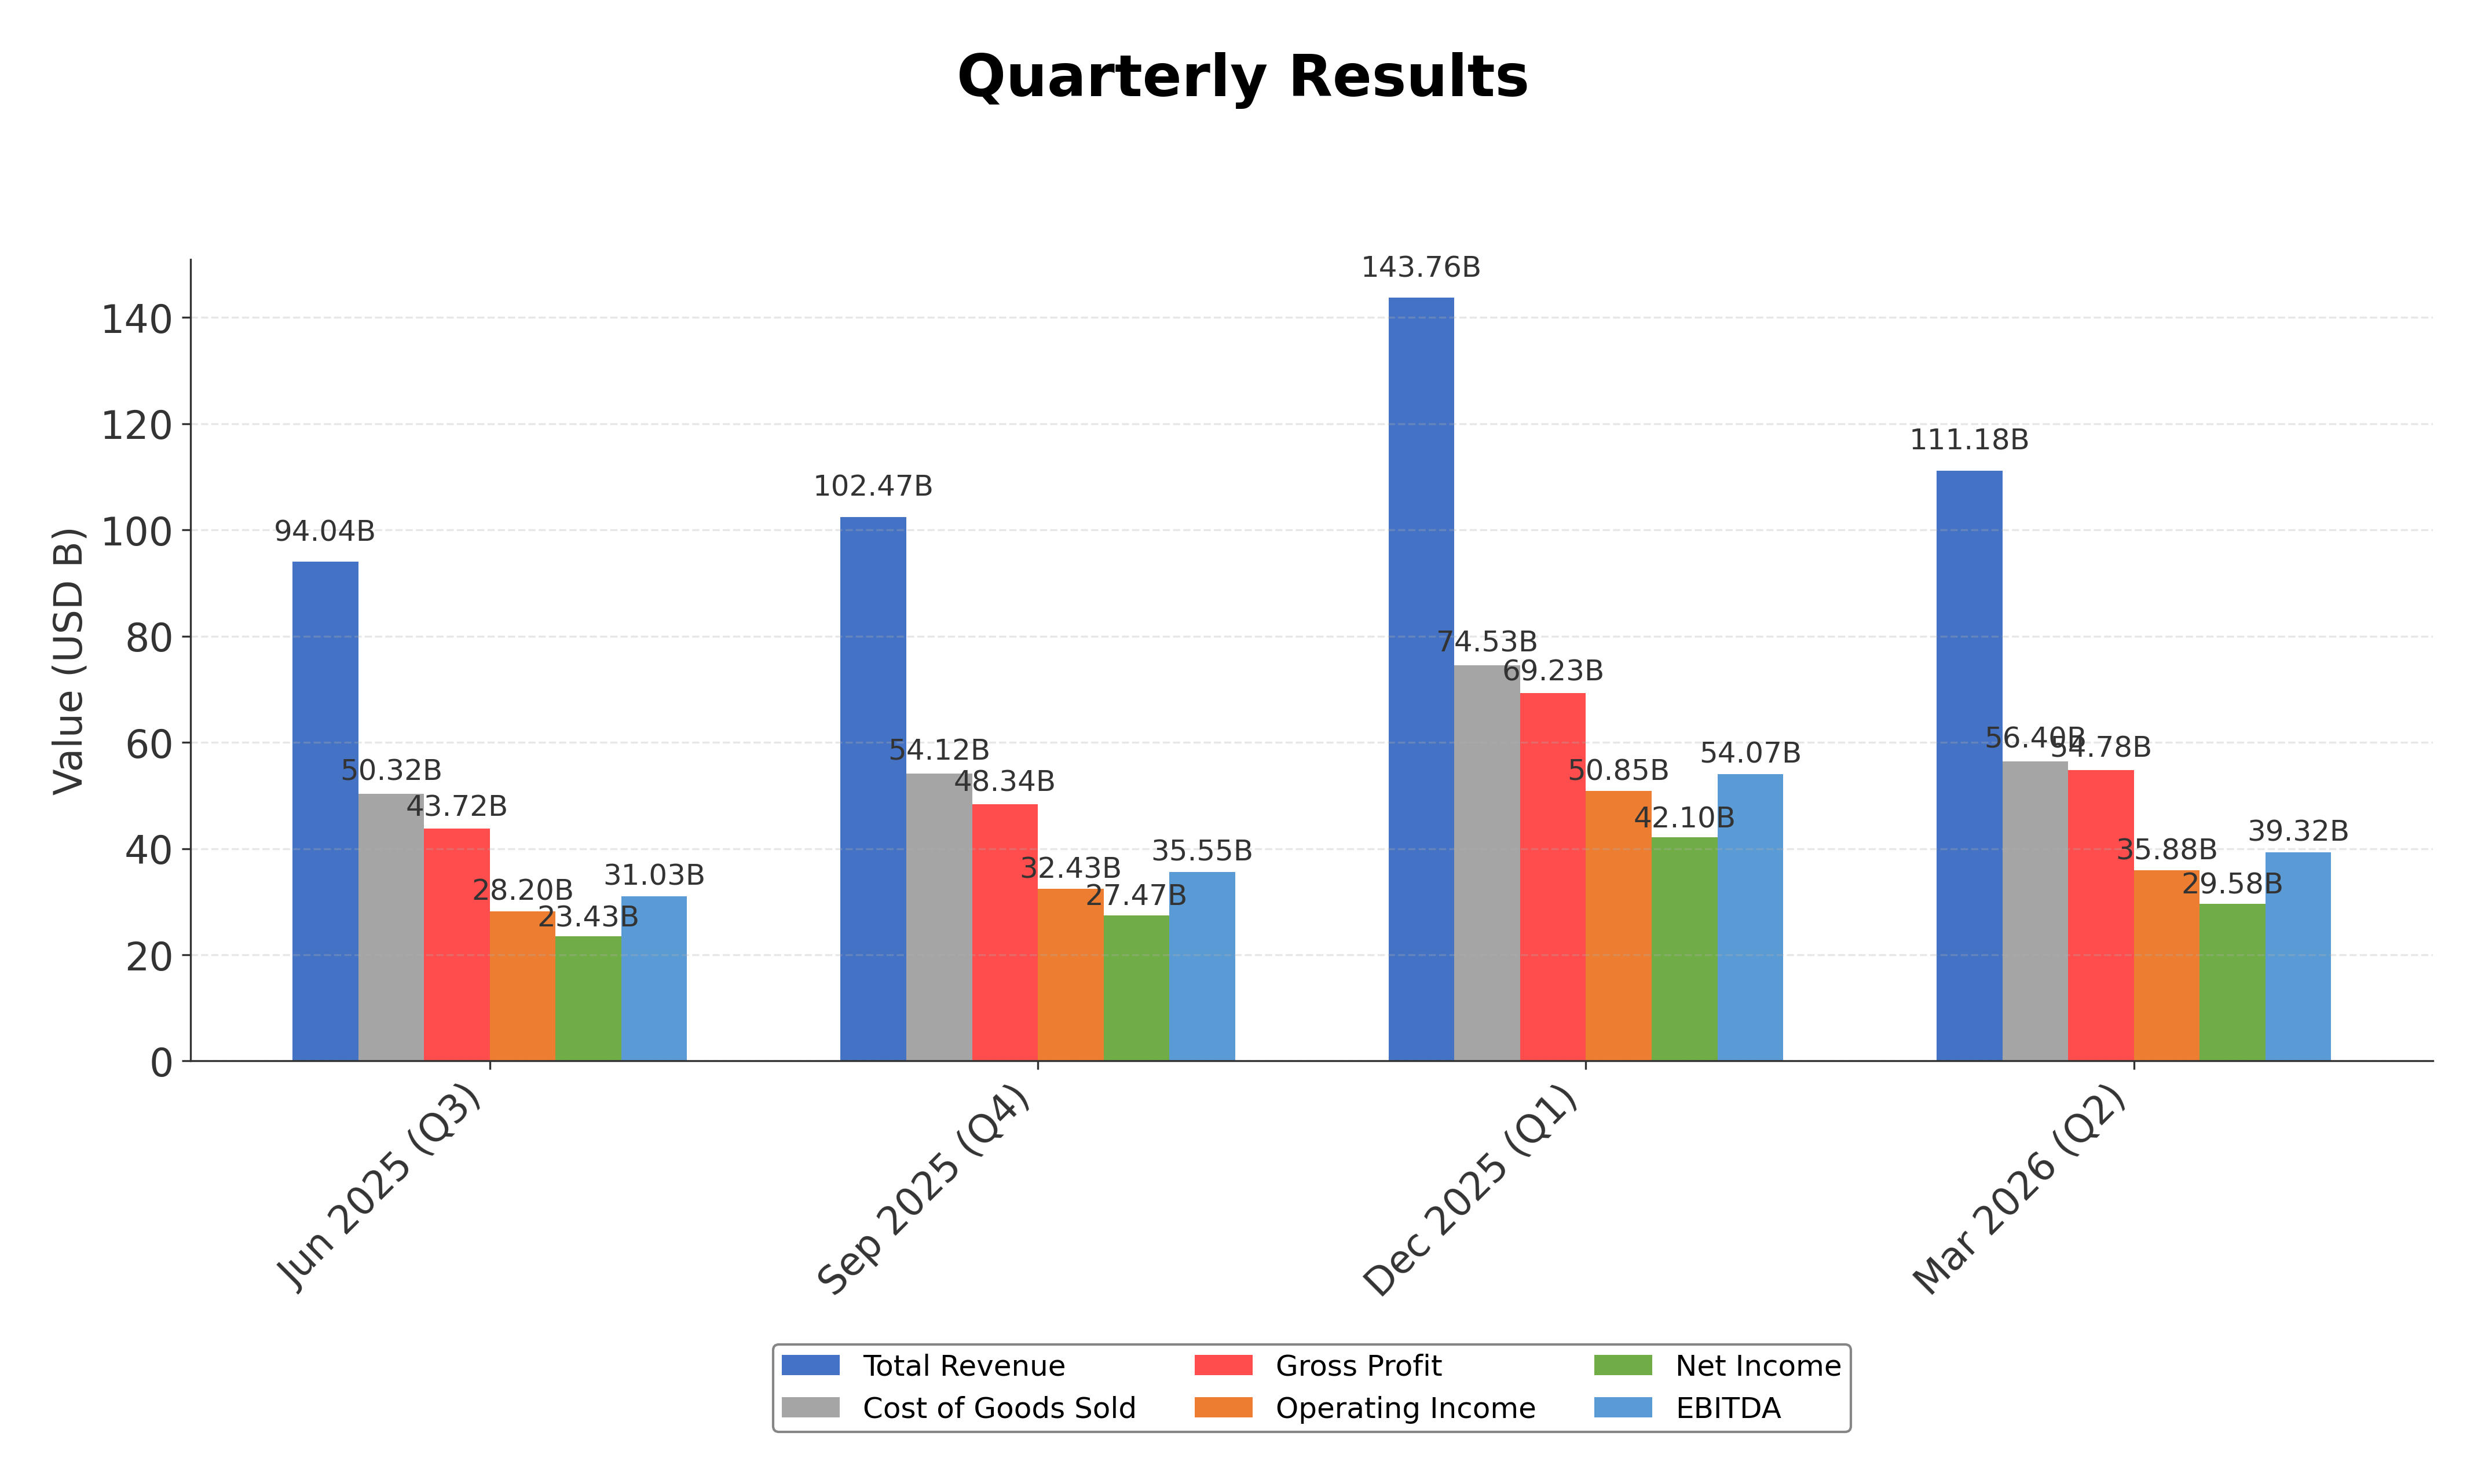
As of 2026-05-07. Intel's stock surged 13% following reports of ongoing discussions with Apple to supply chips for U.S.-manufactured devices, signaling a strategic shift in Apple's supply chain. Apple reported record-breaking second quarter fiscal 2026 results with revenue of $111.2 billion, up 17% year-over-year, and diluted EPS of $2.01, up 22%, driven by strong iPhone and Services sales. The company announced a 4% dividend increase and authorized a $100 billion share repurchase program, reinforcing shareholder returns. Additionally, Apple has increased its R&D spending to over 10% of sales, reflecting intensified investment in AI and innovation. These developments collectively indicate robust financial health and strategic initiatives aimed at sustaining growth and market leadership.
News Sentiment
The overall sentiment from recent updates is predominantly positive, driven by strong financial results, increased shareholder returns, and strategic investments in research and development. The potential chip supply partnership with Intel has generated optimism in the market, as reflected by Intel's stock surge. While legal settlements and regulatory scrutiny have been noted, they have been resolved or managed without materially affecting Apple's operational momentum. This positive tone is balanced by cautious monitoring of supply chain shifts and competitive dynamics, suggesting a stable but vigilant outlook.
Source List
Analytical Overview
Analysis Summary
Apple's valuation metrics, including a trailing P/E of 33.92 and forward P/E of 29.39, are elevated relative to industry averages, reflecting market expectations for sustained growth and premium positioning. Revenue growth of 16-17% year-over-year and strong cash flow trends, with operating cash flow exceeding $140 billion TTM, demonstrate a robust growth trajectory supported by diversified product and services demand. The company's financial health is solid, with a manageable debt-to-equity ratio of 79.55% and substantial free cash flow generation of over $100 billion, enabling ongoing shareholder returns and investment in innovation. Sector-specific opportunities include expanding AI capabilities and services revenue growth, while challenges involve supply chain adjustments and regulatory scrutiny. Consideration of global market positioning and competitive advantages highlights Apple's resilience and strategic focus in a dynamic technology landscape.
Overall Business and Market Assessment
Supporting Factors: Apple's record revenue and earnings growth driven by strong iPhone and services sales, significant cash flow generation enabling shareholder returns, and increased R&D investment signaling commitment to innovation
Risk Factors: supply chain shifts, particularly chip sourcing changes, regulatory and legal challenges, and competitive pressures in technology markets
SWOT Analysis
Strengths
- Market leadership with a diversified product and services ecosystem.
- Strong profitability with high return on equity and operating margins.
- Robust cash flow generation supporting shareholder returns and investments.
- Significant institutional investor ownership reflecting confidence.
Weaknesses
- High price-to-book ratio indicating premium valuation risk.
- Dependence on iPhone sales for a large portion of revenue.
- Moderate debt-to-equity ratio that requires ongoing management.
- Limited insider ownership which may affect alignment with shareholders.
Opportunities
- Increased investment in AI and R&D to drive innovation.
- Expansion of services segment with high-margin subscription offerings.
- Potential supply chain enhancements through chip sourcing partnerships.
- Growing installed base of active devices globally.
Threats
- Regulatory scrutiny and legal settlements impacting brand perception.
- Intense competition in consumer electronics and technology sectors.
- Supply chain disruptions and component cost inflation.
- Macroeconomic uncertainties affecting consumer spending.
Company Description
Apple Inc. is a leading technology company renowned for designing, manufacturing, and marketing innovative hardware and software products for consumers and businesses worldwide. Its flagship product, the iPhone, accounts for the majority of sales, serving as the central hub of an expansive ecosystem that includes Mac computers, iPad tablets, Apple Watch wearables, and accessories like AirPods. Apple Inc. also offers a suite of services such as the App Store, Apple Music, iCloud, Apple TV+, and Apple Fitness+, providing digital content, cloud storage, and subscription-based platforms. Operating in the consumer electronics industry within the technology sector, the company employs approximately 166,000 people and maintains a broad global presence through online stores, retail outlets, and partnerships with carriers and resellers. With a substantial market capitalization reflecting its scale, Apple Inc. plays a pivotal role in shaping consumer technology trends, emphasizing seamless integration across devices and services to enhance user experience and productivity.