


Apple Inc (AAPL)
Stock Analysis Report
Stock Journey
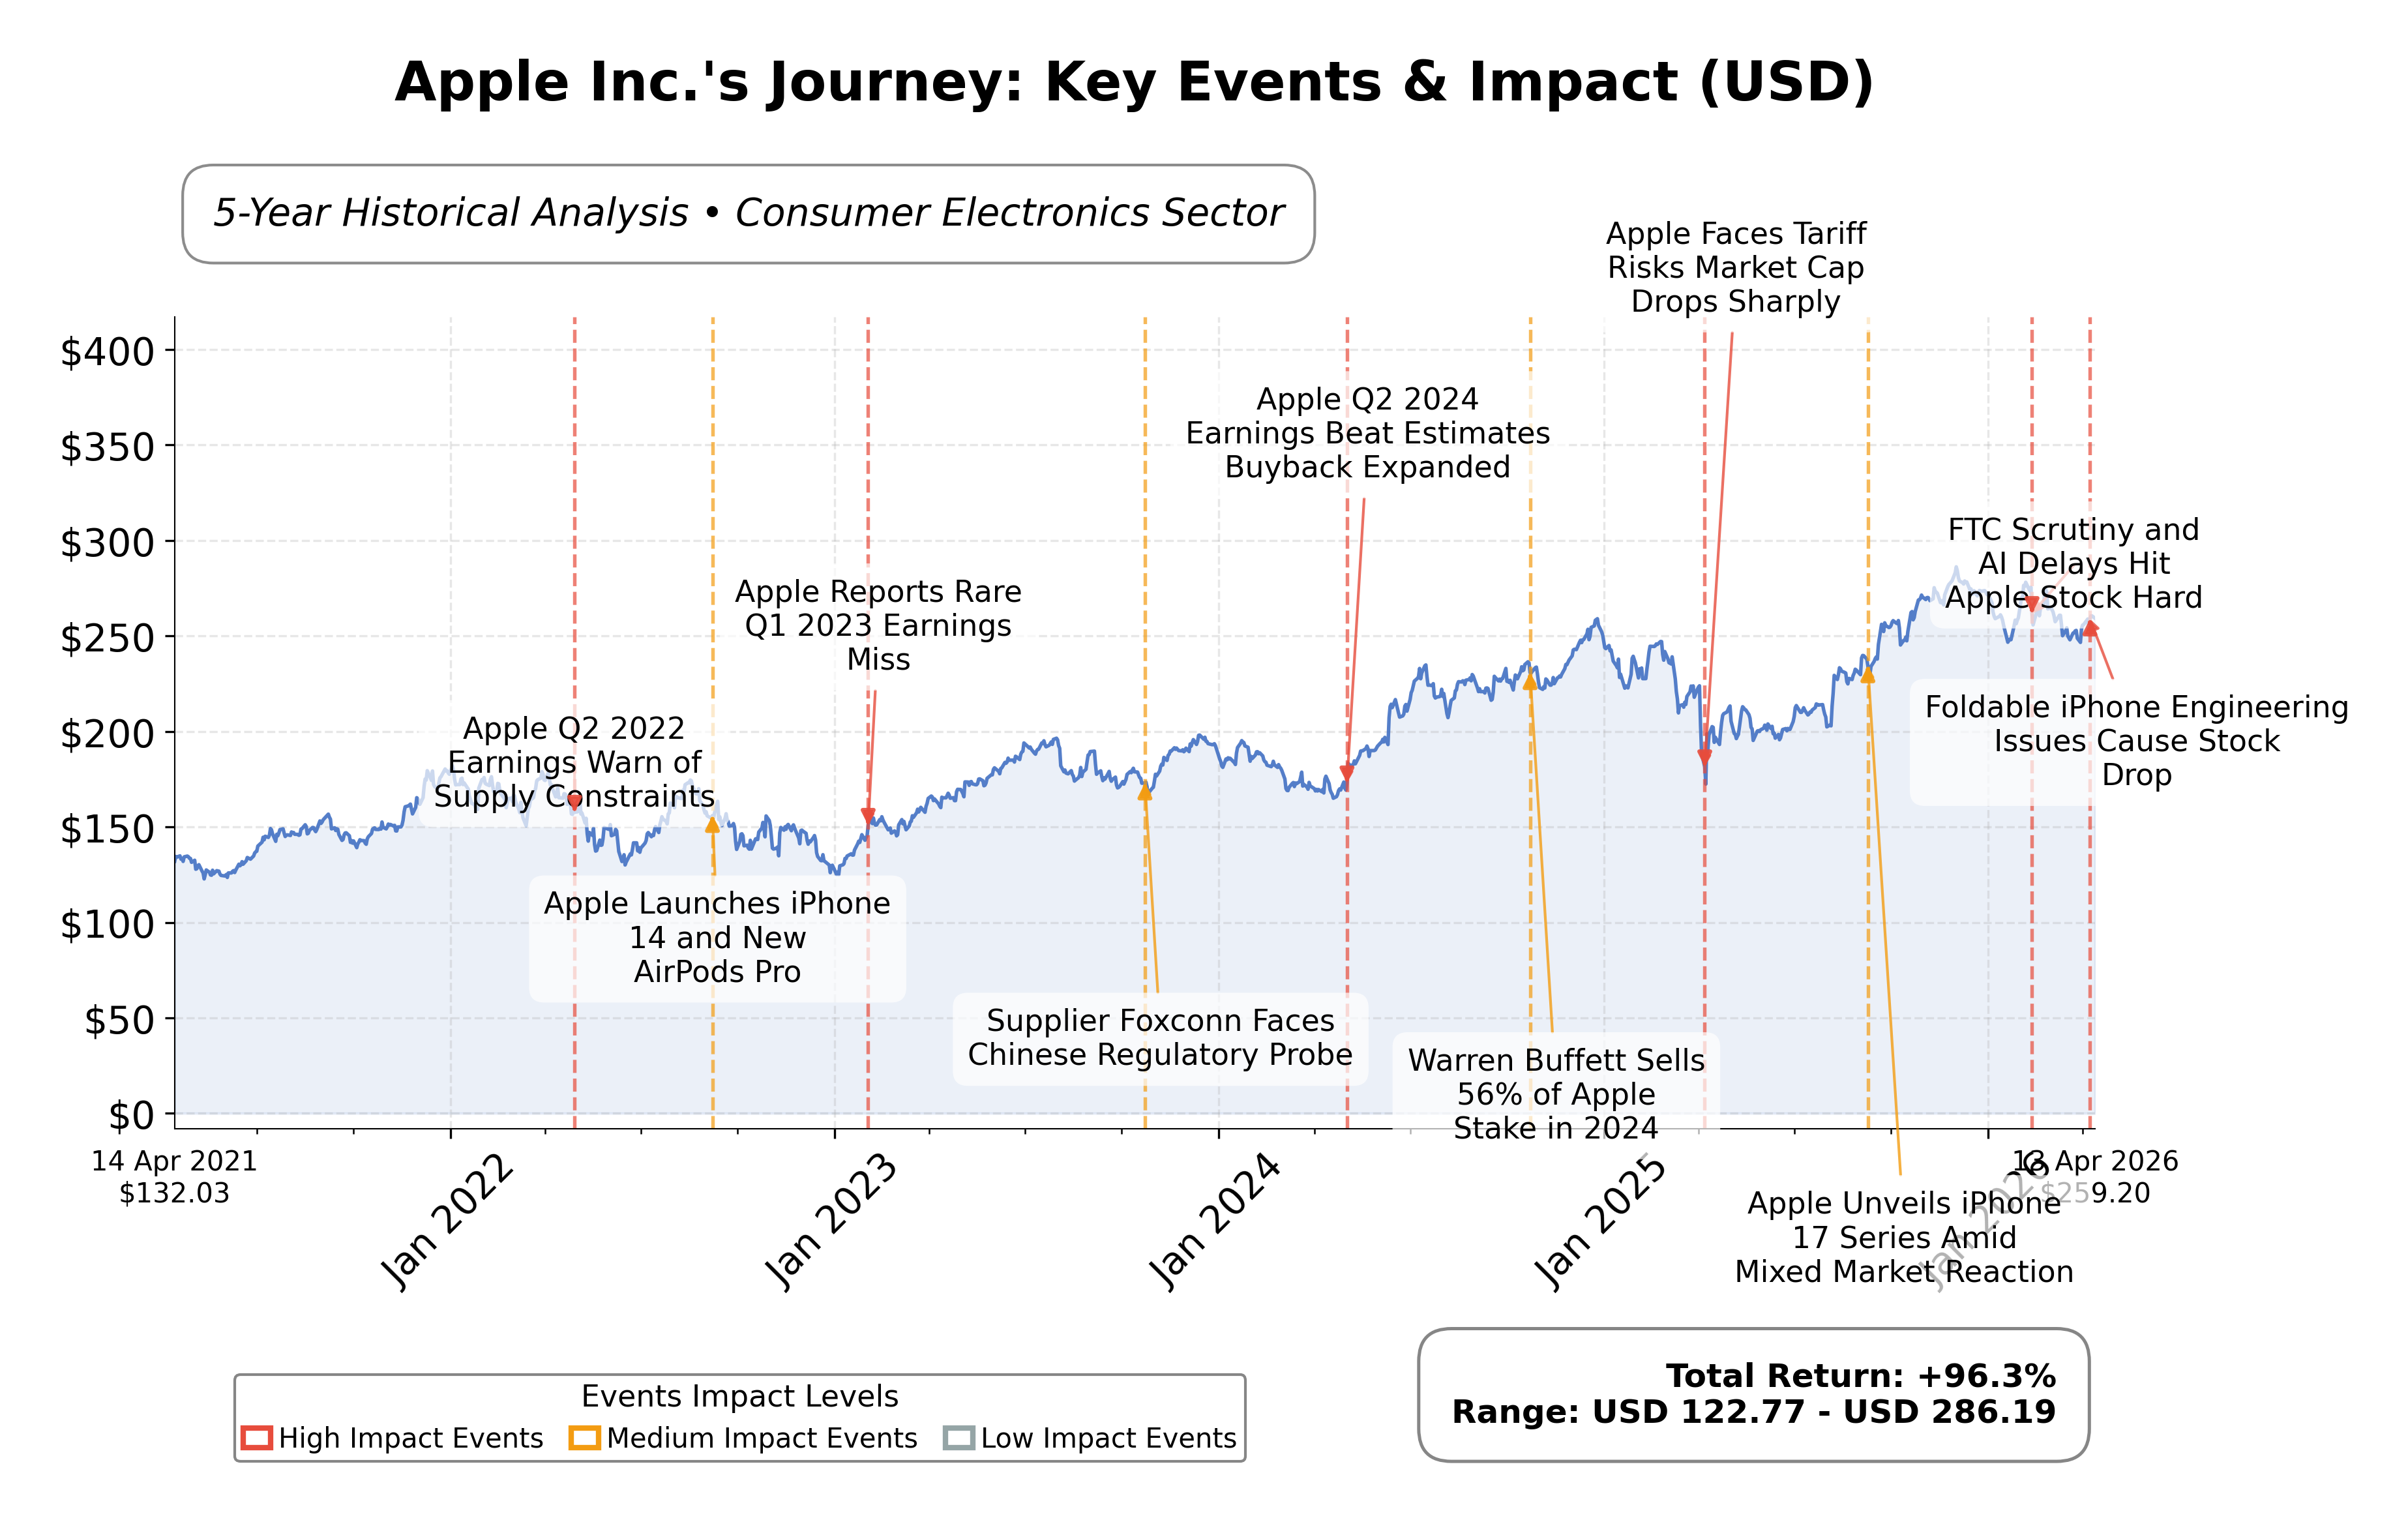
Key Positives and Key Risks
Pros
- Market capitalization of $3.83 trillion reflects Apple’s dominant industry position and scale.
- Strong revenue growth of 15.7% year-over-year underpins robust demand for products and services.
- Operating cash flow of $135.5 billion and free cash flow of $106.3 billion demonstrate excellent cash generation and financial flexibility.
Cons
- High trailing P/E ratio of 33.02 and price-to-book ratio of 43.43 indicate a premium valuation that may limit upside.
- Current ratio of 0.974 suggests tight short-term liquidity, potentially increasing operational risk.
- Regulatory scrutiny and antitrust investigations pose ongoing risks that could impact operations and market perception.
Disclosure: This information is for general awareness and does not constitute investment advice
Report Summary
Apple Inc. operates as a leading technology company primarily engaged in designing, manufacturing, and marketing consumer electronics and software products. Its flagship product, the iPhone, dominates its sales and integrates with a broad ecosystem including Mac computers, iPads, Apple Watches, and accessories like AirPods. The company also provides digital services such as the App Store, Apple Music, iCloud, and Apple TV+, positioning itself strongly within the consumer electronics industry under the technology sector on the NASDAQ exchange. Apple’s extensive global presence through retail outlets, online stores, and partnerships with carriers solidifies its market leadership.
Financially, Apple reported trailing twelve months (TTM) revenue of approximately $435.6 billion, with a gross margin of 48.16%, operating margin of 35.37%, and a net profit margin of 27.04%, reflecting robust profitability. The company’s return on equity (ROE) stands at 1.52%, and return on assets (ROA) is 24.38%, indicating efficient asset utilization and shareholder value creation. Operating cash flow for the TTM was $135.5 billion, with free cash flow of $106.3 billion, underscoring strong cash generation capacity. These metrics collectively demonstrate Apple’s operational efficiency and solid financial health.
Valuation metrics show Apple’s market capitalization at approximately $3.83 trillion, with a trailing price-to-earnings (P/E) ratio of 33.02 and a forward P/E of 27.93, suggesting a premium valuation relative to earnings expectations. The price-to-book (P/B) ratio is notably high at 43.43, and the enterprise value to EBITDA (EV/EBITDA) ratio is 25.17, indicating the stock is priced with significant growth and profitability expectations. The 52-week trading range spans from $189.81 to $288.62, with the current price near $259.21, positioning the stock below its recent highs but well above its lows.
Apple’s strengths include its dominant market position, strong cash flow generation, and a diversified product and services ecosystem. The company maintains a manageable debt level with total debt of approximately $90.5 billion against cash reserves of $66.9 billion. Key risks involve regulatory scrutiny, competitive pressures in technology and consumer electronics, and supply chain challenges. Recent strategic developments include institutional investors increasing holdings and some leadership changes, such as the departure of a key AI hire, which may influence future innovation trajectories.
Technically, Apple’s stock is trading above its 50-day ($260.80) and 200-day ($250.33) moving averages, indicating a generally positive trend, albeit with some recent volatility. Momentum indicators show mixed signals across timeframes, suggesting cautious market sentiment. Recent news highlights both positive institutional buying and concerns over valuation and competitive dynamics. Overall, the data suggests a balanced stance with attention to evolving market and company-specific factors.
Company and Industry Overview
Company Basics
Price Performance
Company Size
Shareholding Pattern
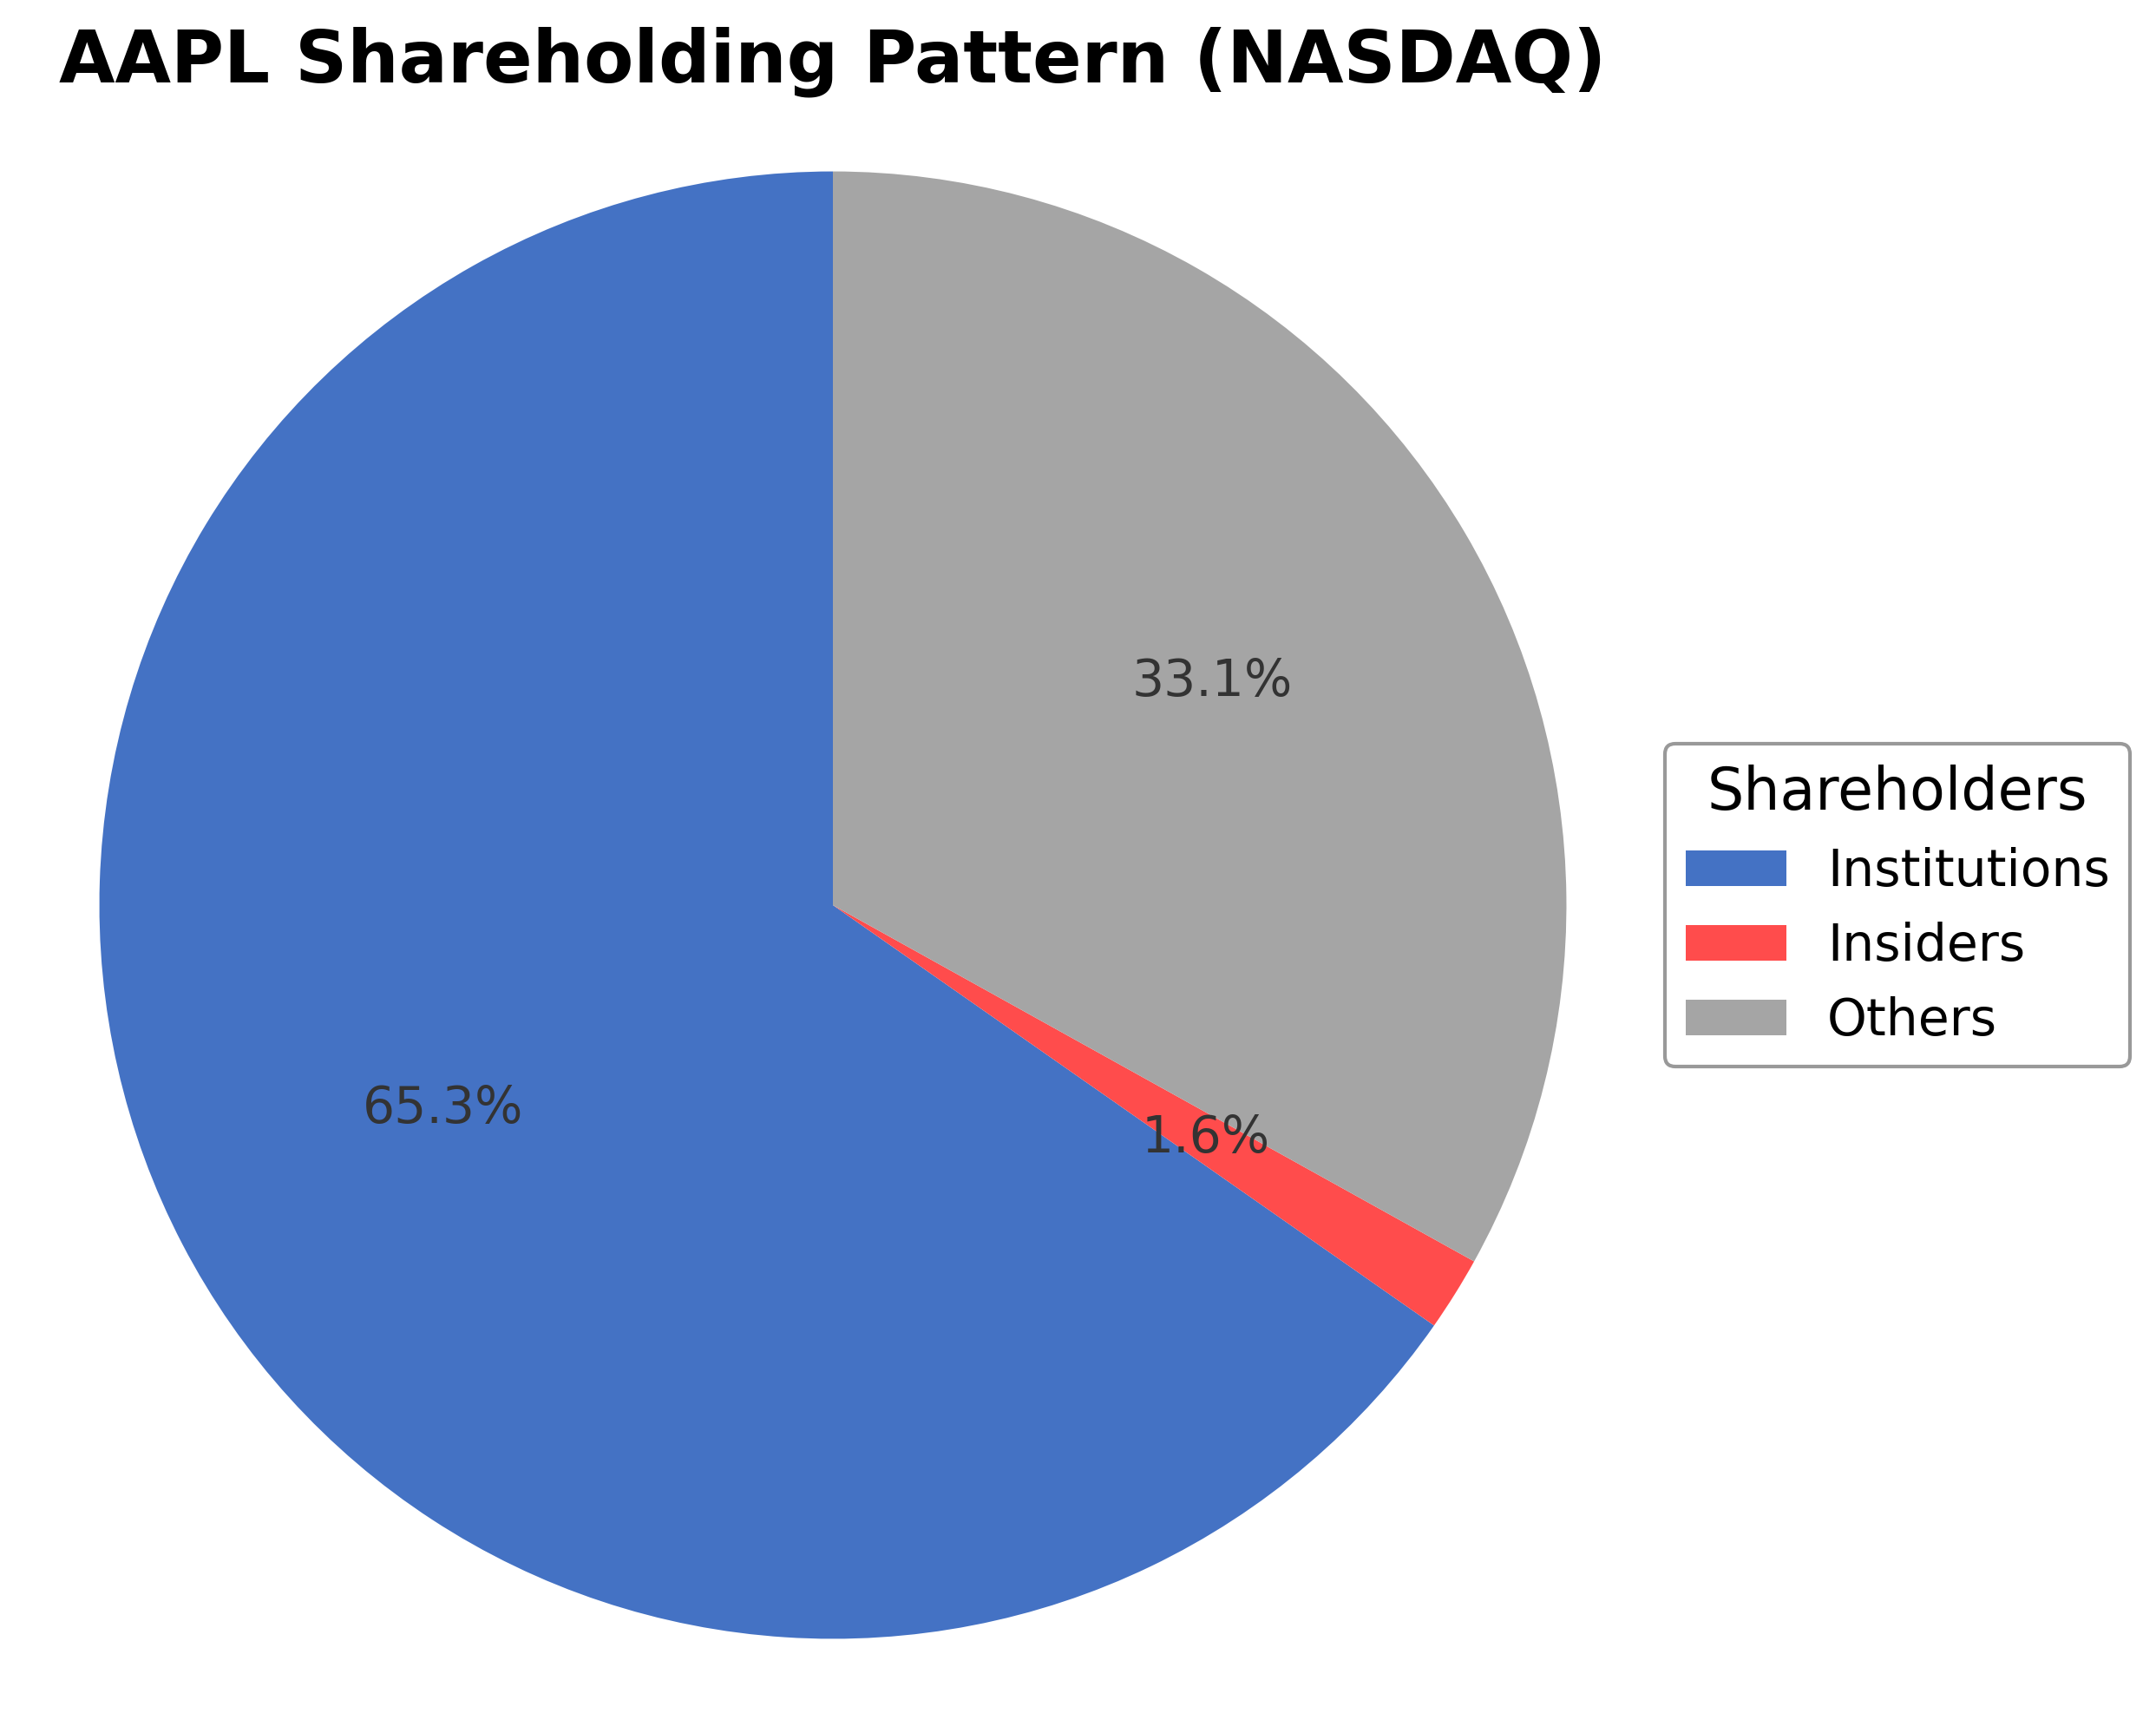
Apple Inc.'s ownership structure is characterized by a significant institutional investor presence, holding approximately 65.29% of shares, reflecting strong confidence from mutual funds, pension funds, and asset managers. Insider ownership is minimal at about 1.64%, indicating limited direct executive or board member holdings. The remaining 34.71% is held by public shareholders, including retail investors and employee stock plans. Over the past 12 to 24 months, institutional investors such as Westmount Partners LLC and My Personal CFO LLC have notably increased their stakes, while some large funds like Berkshire Hathaway have reduced holdings. This pattern suggests a mixed but generally positive market sentiment, with institutional accumulation supporting governance stability and strategic direction. The ownership distribution aligns with Apple’s status as a mature, widely held technology leader with broad market participation.
Sector and Industry Analysis
The technology sector, particularly the hardware and consumer electronics segment, represents a multi-trillion-dollar global market characterized by steady growth driven by innovation and consumer demand for connected devices. Major players include Apple, Samsung, Microsoft, and Huawei, with Apple holding a significant share due to its integrated ecosystem of hardware and software products. The sector benefits from continuous advancements in semiconductor technology, software development, and expanding digital services, contributing to robust revenue streams and market capitalization.
Within the hardware industry, the competitive landscape is shaped by rapid product cycles, high R&D investment, and strong brand loyalty. Companies like Apple differentiate through proprietary designs, vertical integration of software and hardware, and extensive ecosystems that lock in consumers. Barriers to entry are high due to capital intensity, supply chain complexity, and the need for technological expertise, while emerging trends include augmented reality, subscription services, and increased focus on sustainability in manufacturing and materials sourcing.
Regulatory scrutiny in the technology hardware sector centers on data privacy, antitrust concerns, and international trade policies, which influence supply chains and market access. Governments are increasingly enforcing stricter regulations on user data protection and competitive practices, impacting product design and business models. Additionally, export controls and tariffs affect component sourcing and manufacturing locations, requiring companies to adapt strategically to maintain compliance and operational efficiency.
Note: Analysis synthesized from industry research, market reports, and regulatory filings. Information is subject to change based on market conditions.
Financial Ratios Dashboard
Illustrative Scenario Analysis
DCF Assumptions:
Method: Two-Stage EPS-Priority Model
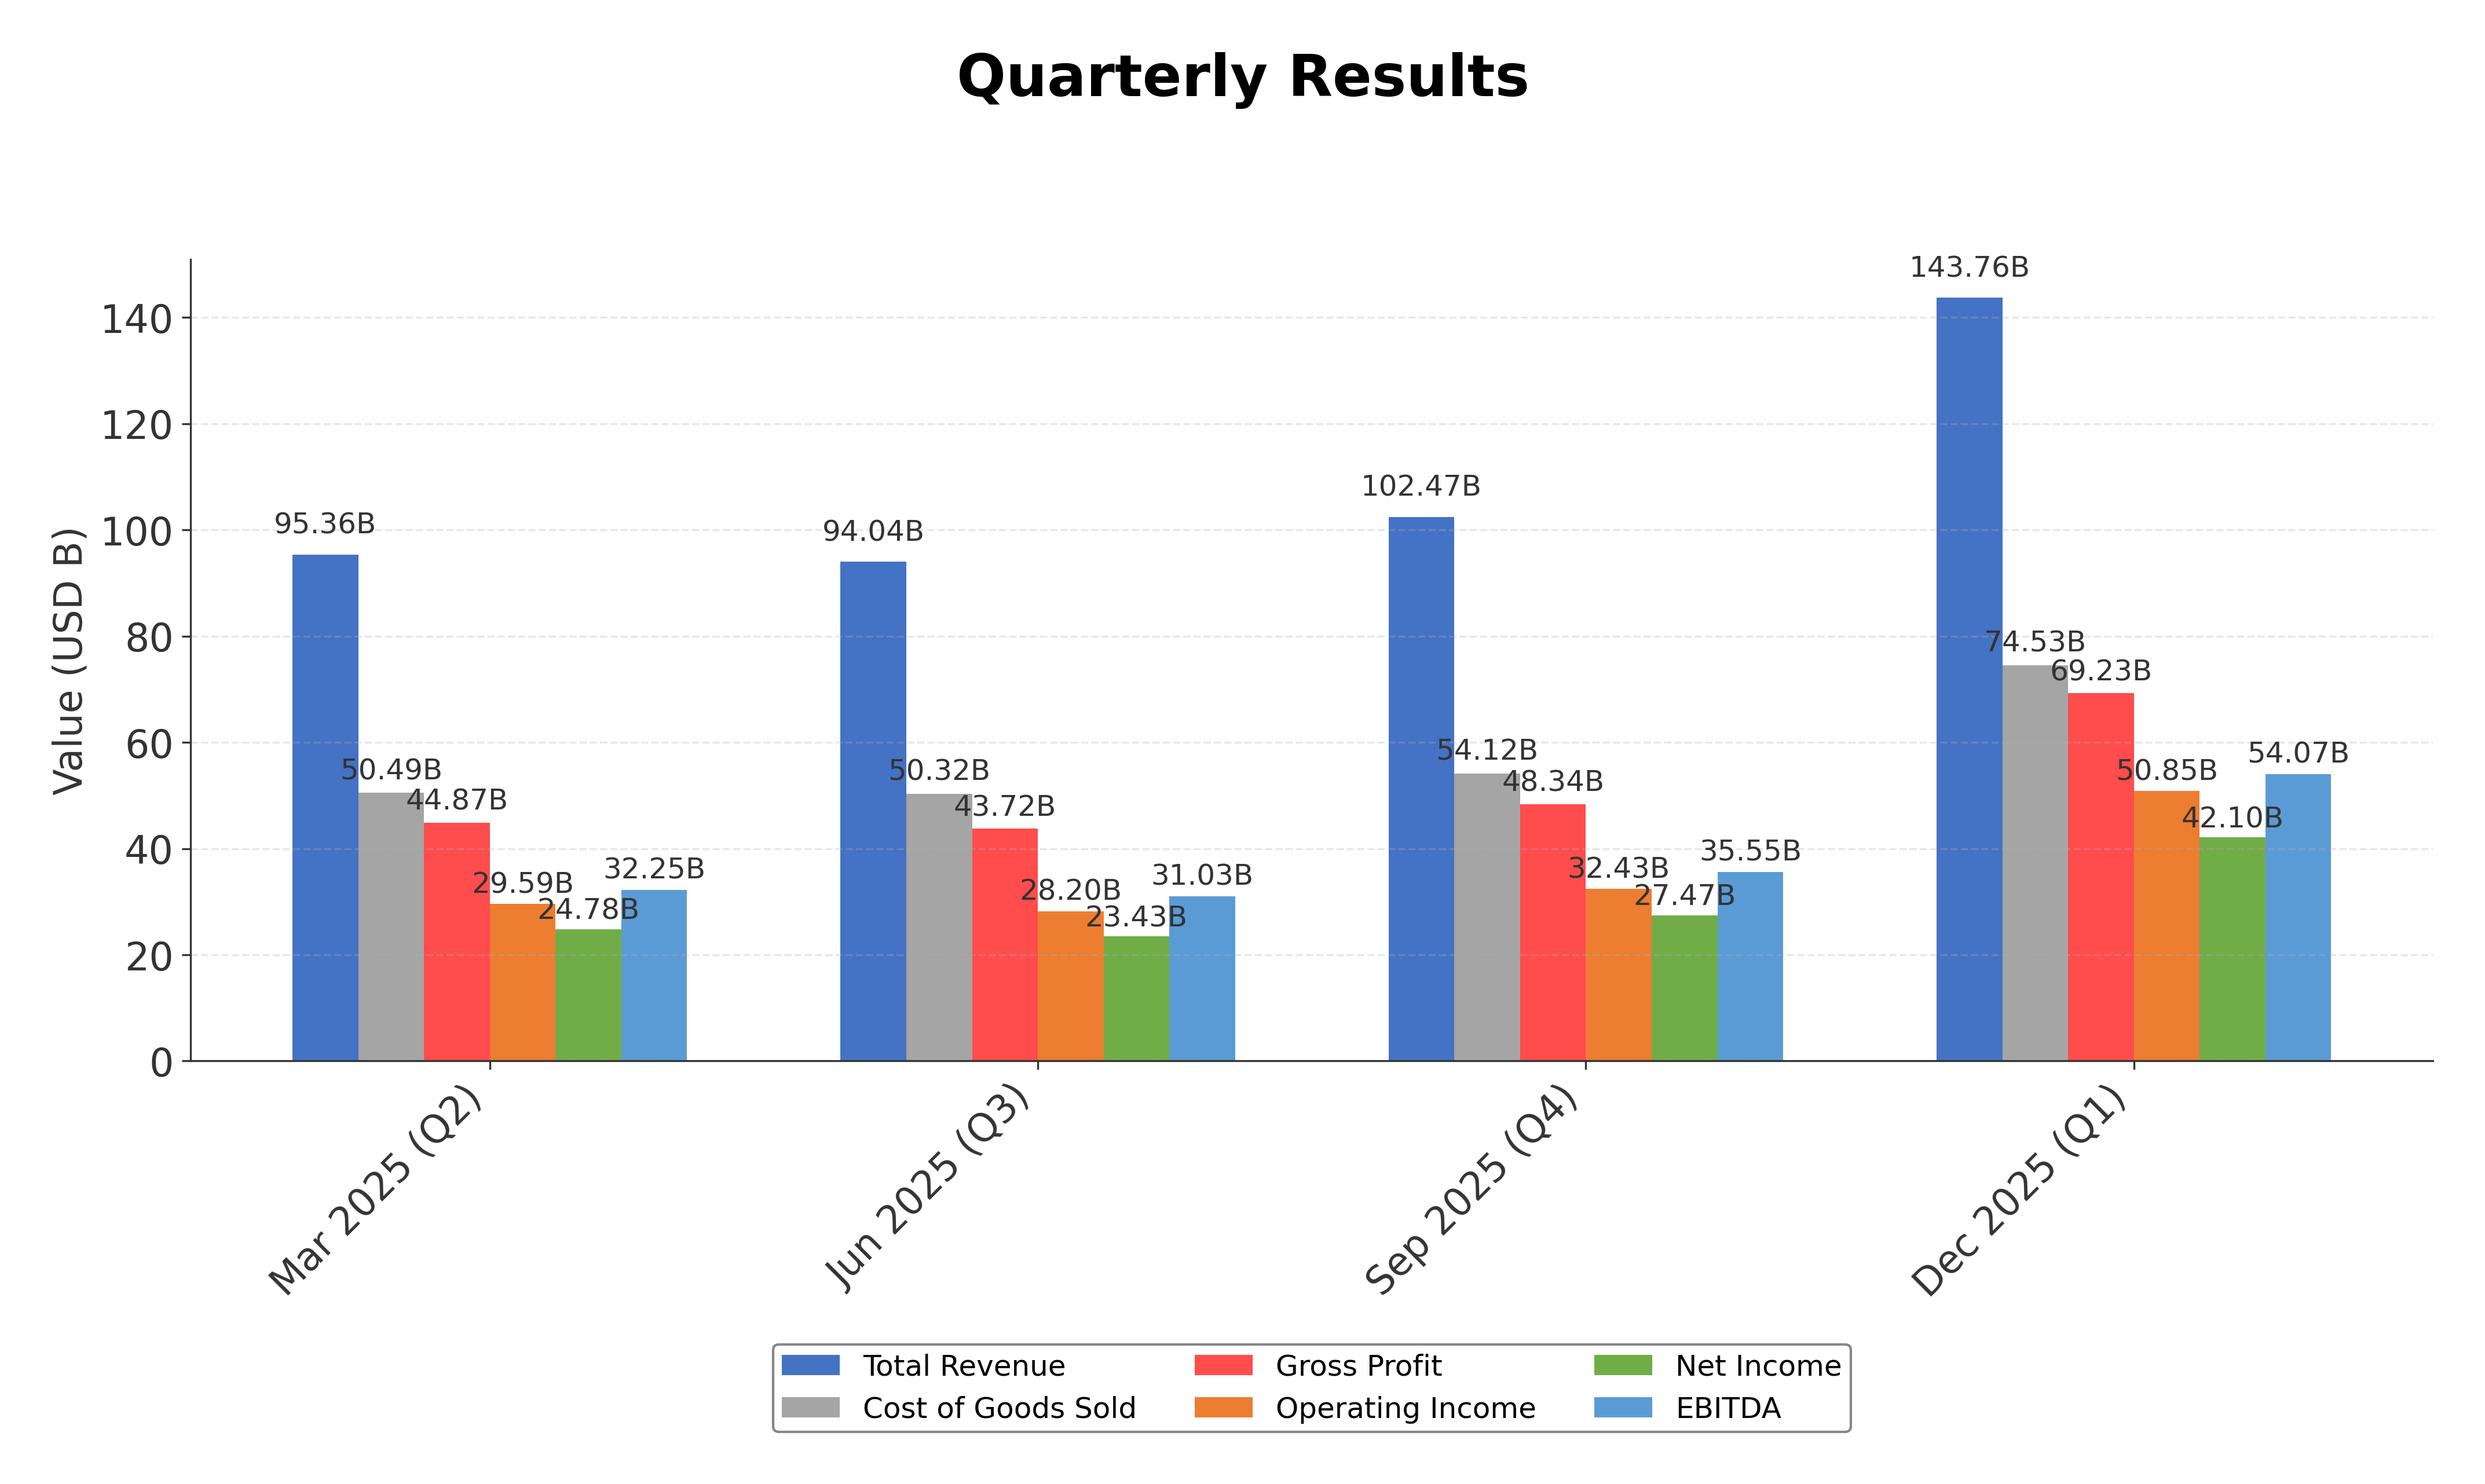
Financials
Peer Analysis
| Company Name | Market Cap | P/E Ratio | P/B Ratio | EV/EBITDA | Price to CFO |
|---|---|---|---|---|---|
| Apple Inc. | $3.83T | 33.02 | 43.43 | 25.17 | 28.26 |
| Sony Group Corporation - Sponsored American Depositary Receipt | $124.34B | 16.19 | 2.44 | 0.03 | 9.6 |
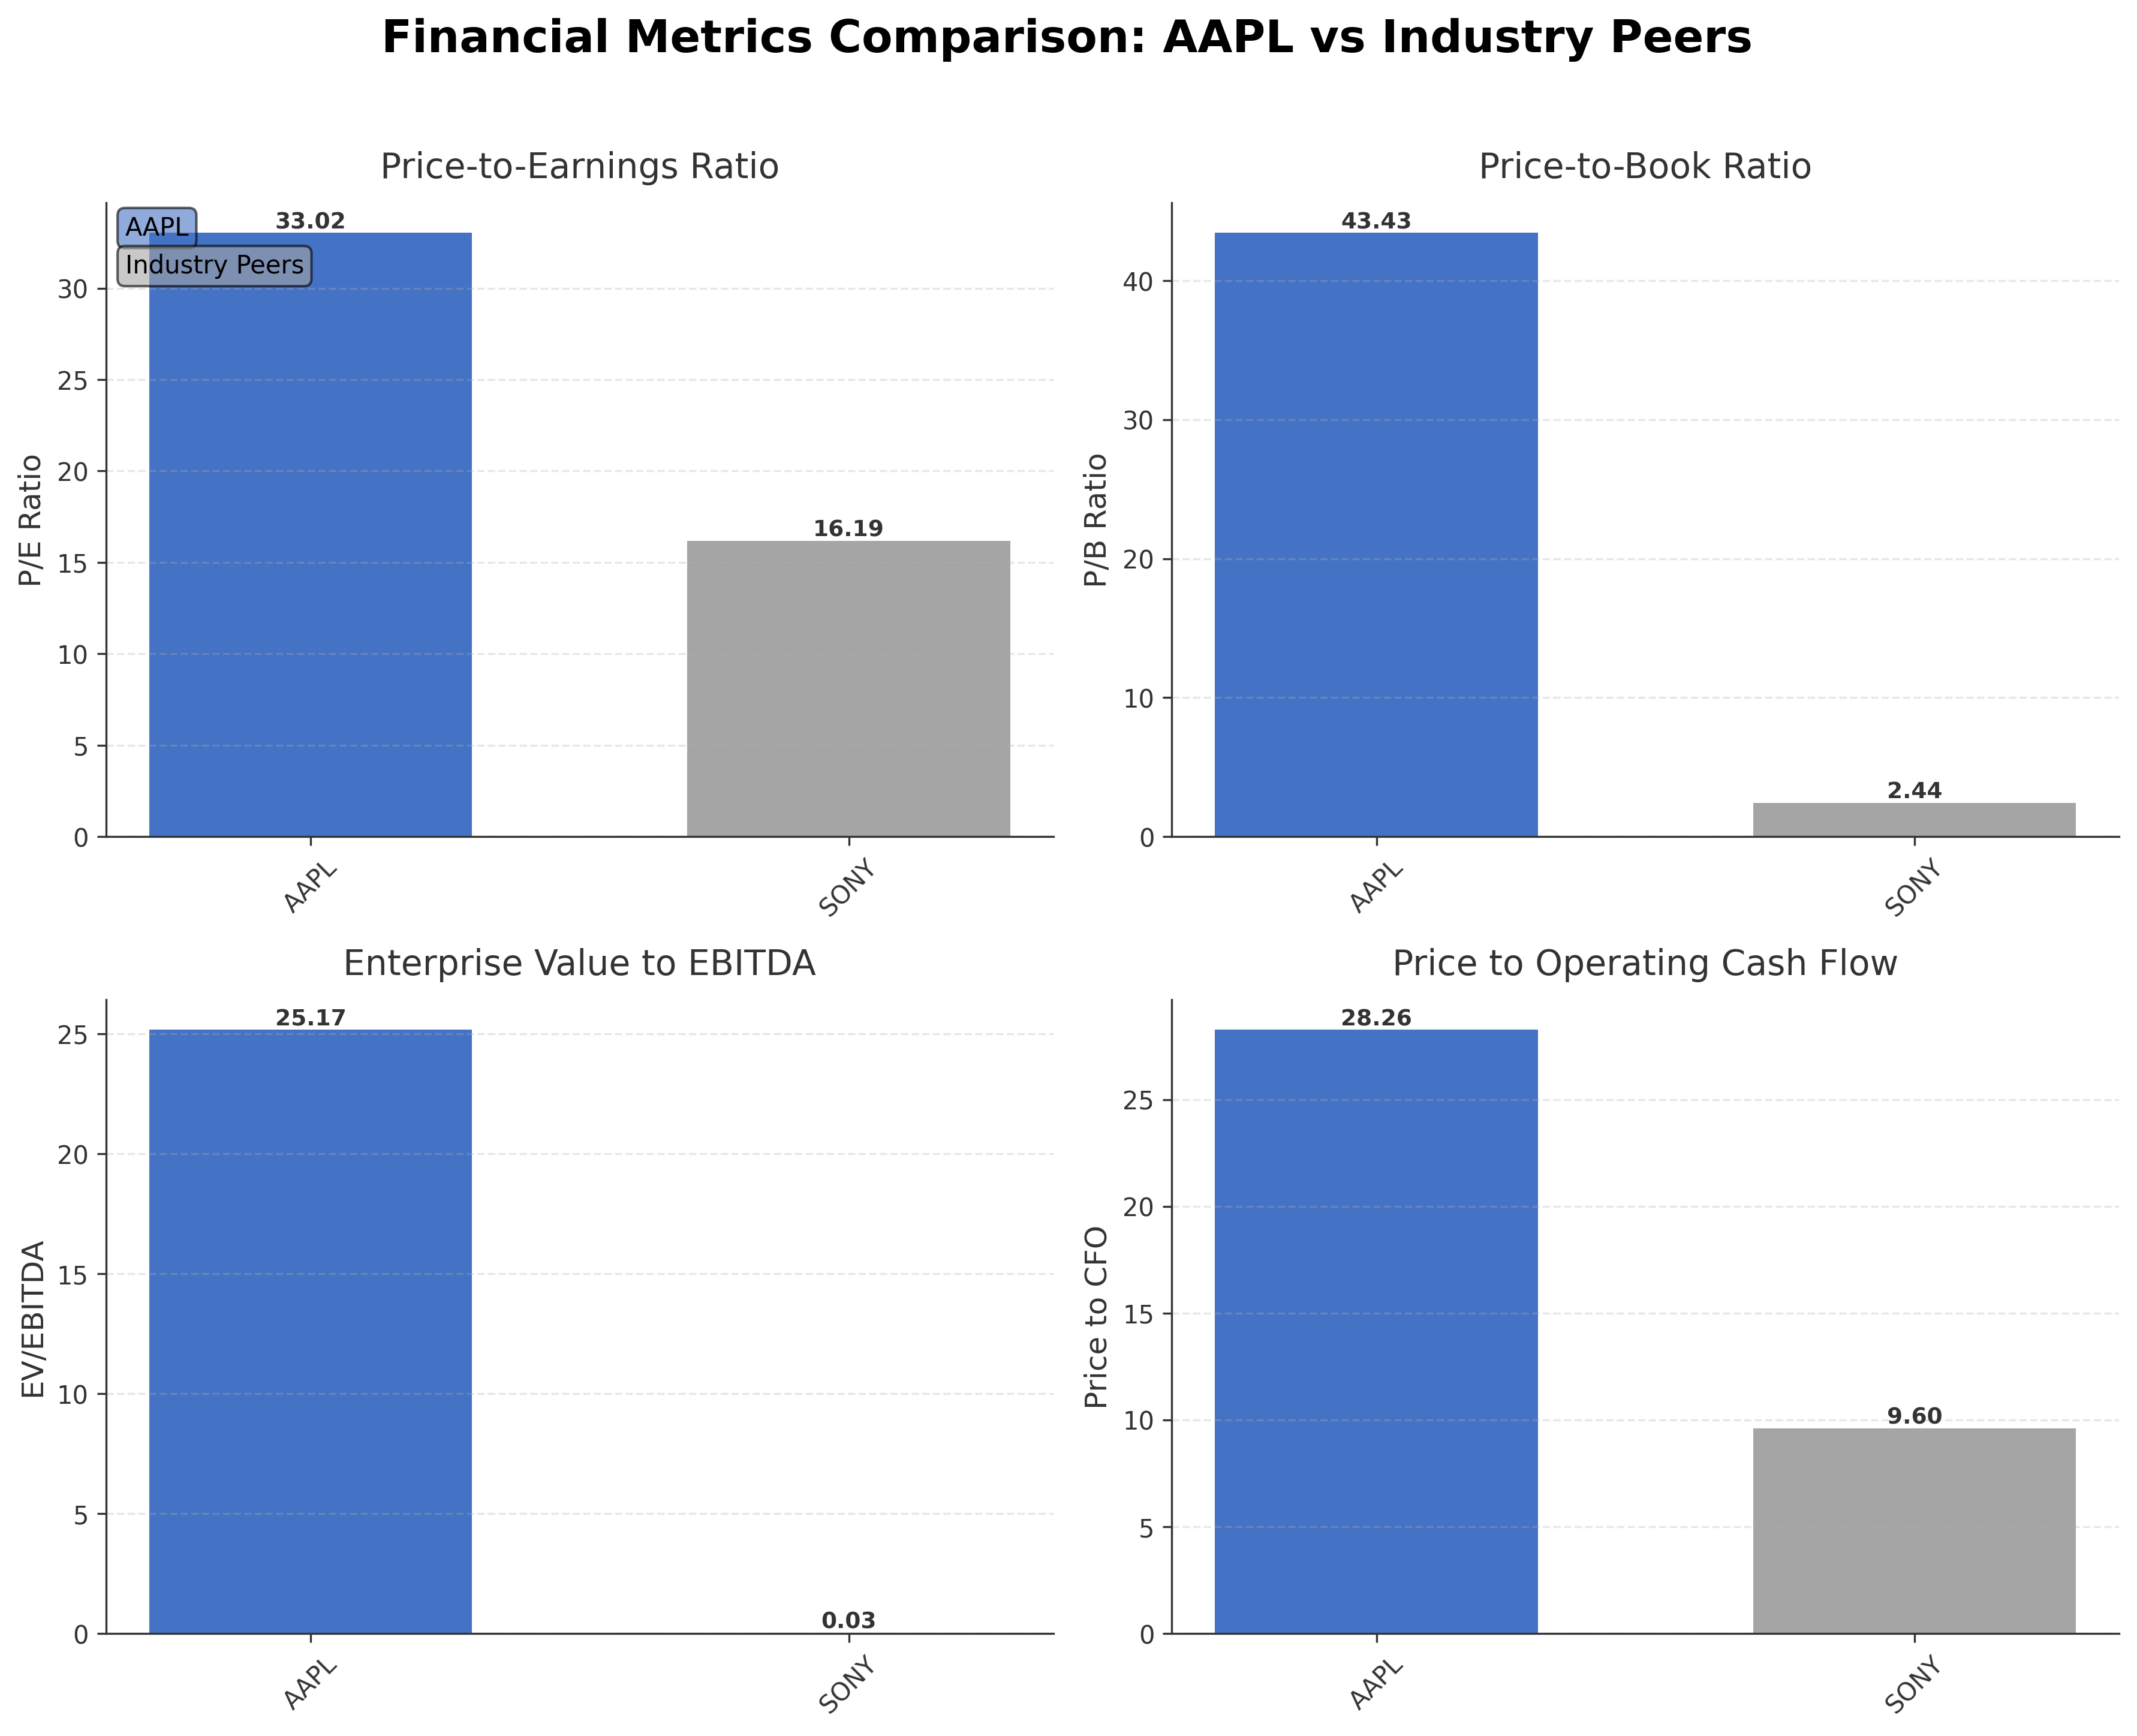
Comparison Analysis: Apple Inc. significantly outscales its peer Sony Group Corporation in market capitalization, with a valuation exceeding $3.8 trillion compared to Sony's $124.34 billion. Apple’s P/E ratio of 33.02 is more than double Sony’s 16.19, reflecting higher growth expectations and premium pricing. The P/B ratio disparity is pronounced, with Apple at 43.43 versus Sony’s 2.44, indicating Apple’s substantial intangible assets and brand value. Enterprise value to EBITDA and price to cash flow metrics also show Apple’s higher valuation multiples, consistent with its dominant market position and profitability. Return on equity for Apple at 1.52% surpasses Sony’s 0.15%, demonstrating superior capital efficiency among peers.
Financial Metrics Comparison with Peers
Financial Statements
Comprehensive financial data including income, balance sheet, and cash flow metrics
Income Statement
| fiscal_date | 2025-09-30 | 2024-09-30 | 2023-09-30 | 2022-09-30 | 2021-09-30 |
|---|---|---|---|---|---|
| Sales | 416.16B | 391.04B | 383.29B | 394.33B | 365.82B |
| Cost Of Goods | 220.96B | 210.35B | 214.14B | 223.55B | 212.98B |
| Gross Profit | 195.20B | 180.68B | 169.15B | 170.78B | 152.84B |
| Operating Expense Research And Development | 34.55B | 31.37B | 29.91B | 26.25B | 21.91B |
| Operating Expense Selling General And Administrative | 27.60B | 26.10B | 24.93B | 25.09B | 21.97B |
| Operating Income | 133.05B | 123.22B | 114.30B | 119.44B | 108.95B |
| Other Income Expense | -321.00M | 269.00M | -565.00M | -334.00M | 60.00M |
| Pretax Income | 132.73B | 123.48B | 113.74B | 119.10B | 109.21B |
| Income Tax | 20.72B | 29.75B | 16.74B | 19.30B | 14.53B |
| Net Income | 112.01B | 93.74B | 97.00B | 99.80B | 94.68B |
| Eps Basic | 7.49 | 6.11 | 6.16 | 6.15 | 5.67 |
| Eps Diluted | 7.46 | 6.08 | 6.13 | 6.11 | 5.61 |
| Basic Shares Outstanding | 14.95B | 15.34B | 15.74B | 16.22B | 16.70B |
| Diluted Shares Outstanding | 14.95B | 15.34B | 15.74B | 16.22B | 16.70B |
| Ebit | 133.05B | 123.22B | 114.30B | 119.44B | 111.85B |
| Ebitda | 144.75B | 134.66B | 125.82B | 130.54B | 123.14B |
| Net Income Continuous Operations | 112.01B | 93.74B | 97.00B | 99.80B | 94.68B |
| Non Operating Interest Income | N/A | N/A | 3.75B | 2.83B | 2.84B |
| Non Operating Interest Expense | N/A | N/A | 3.93B | 2.93B | 2.65B |
Data provided by Twelve Data
Balance Sheet
| fiscal_date | 2025-09-30 | 2024-09-30 | 2023-09-30 | 2022-09-30 | 2021-09-30 |
|---|---|---|---|---|---|
| Cash And Cash Equivalents | 35.93B | 29.94B | 29.96B | 23.65B | 34.94B |
| Accounts Receivable | 39.78B | 33.41B | 29.51B | 28.18B | 26.28B |
| Total Assets | 359.24B | 364.98B | 352.58B | 352.75B | 351.00B |
| Total Liabilities | 285.51B | 308.03B | 290.44B | 302.08B | 287.91B |
| Long Term Debt | 78.33B | 85.75B | 95.28B | 109.71B | 119.38B |
| Shareholders Equity | 73.73B | 56.95B | 62.15B | 50.67B | 63.09B |
Data provided by Twelve Data
Cash Flow Statement
| fiscal_date | 2025-09-30 | 2024-09-30 | 2023-09-30 | 2022-09-30 | 2021-09-30 |
|---|---|---|---|---|---|
| Operating Activities Net Income | 112.01B | 93.74B | 97.00B | 99.80B | 94.68B |
| Operating Activities Depreciation | 11.70B | 11.45B | 11.52B | 11.10B | 11.28B |
| Operating Activities Stock Based Compensation | 12.86B | 11.69B | 10.83B | 9.04B | 7.91B |
| Operating Activities Other Non Cash Items | -89.00M | -2.27B | -2.23B | 1.01B | -4.92B |
| Operating Activities Accounts Receivable | -7.03B | -5.14B | -417.00M | -9.34B | -14.03B |
| Operating Activities Accounts Payable | 902.00M | 6.02B | -1.89B | 9.45B | 12.33B |
| Operating Activities Other Assets Liabilities | -18.87B | 2.77B | -4.27B | 1.57B | -1.53B |
| Operating Activities Operating Cash Flow | 111.48B | 118.25B | 110.54B | 123.52B | 100.94B |
| Investing Activities Capital Expenditures | -12.71B | -9.45B | -10.96B | -10.71B | -11.09B |
| Investing Activities Purchase Of Investments | -24.41B | -48.66B | -29.51B | -76.92B | -109.56B |
| Investing Activities Sale Of Investments | 53.80B | 62.35B | 45.51B | 67.36B | 106.48B |
| Investing Activities Other Investing Activity | -1.48B | -1.31B | -1.34B | -2.09B | -385.00M |
| Investing Activities Investing Cash Flow | 15.20B | 2.94B | 3.71B | -22.66B | -14.58B |
| Financing Activities Long Term Debt Issuance | 4.48B | 0.00 | 5.23B | 5.46B | 20.39B |
| Financing Activities Long Term Debt Payments | -10.93B | -9.96B | -11.15B | -9.54B | -8.75B |
| Financing Activities Short Term Debt Issuance | -2.03B | 3.96B | -3.98B | 3.96B | 1.02B |
| Financing Activities Common Stock Repurchase | -90.71B | -94.95B | -77.55B | -89.40B | -85.97B |
| Financing Activities Common Dividends | -15.42B | -15.23B | -15.03B | -14.84B | -14.47B |
| Financing Activities Other Financing Charges | -6.07B | -5.80B | -6.01B | -6.38B | -5.58B |
| Financing Activities Financing Cash Flow | -120.69B | -121.98B | -108.49B | -110.75B | -92.25B |
| End Cash Position | 35.93B | 29.94B | 30.74B | 24.98B | 35.93B |
| Income Tax Paid | 43.37B | 26.10B | 18.68B | 19.57B | 25.39B |
| Free Cash Flow | 98.77B | 108.81B | 99.58B | 111.44B | 92.95B |
| Interest Paid | N/A | N/A | 3.80B | 2.87B | 2.69B |
| Operating Activities Deferred Taxes | N/A | N/A | N/A | 895.00M | -4.77B |
| Investing Activities Net Acquisitions | N/A | N/A | N/A | -306.00M | -33.00M |
| Financing Activities Common Stock Issuance | N/A | N/A | N/A | N/A | 1.10B |
Data provided by Twelve Data
Technical Analysis
Key Insights
- Apple’s stock exhibits an overall upward trend, trading above its 50-day moving average of $260.80 and 200-day moving average of $250.33, indicating sustained bullish momentum despite recent price fluctuations.
- Key support levels are identified near $250 and $240, while resistance is observed around the 52-week high of $288.62, marking critical price points for potential consolidation or breakout.
- The stock’s current price is slightly below the 50-day moving average but above the 200-day moving average, suggesting short-term consolidation within a longer-term uptrend.
- Momentum indicators show a relative strength index (RSI) near neutral levels, with MACD signaling mixed momentum and stochastic oscillators reflecting moderate volatility.
- Multi-timeframe analysis reveals consistent strength on weekly and monthly charts, while daily charts indicate short-term sideways movement, highlighting a balance between buying and selling pressures.
- Potential market scenarios include continuation of the uptrend if support holds, or a corrective phase if resistance near $288.62 proves strong, with momentum indicators guiding near-term price action.
Trending News
1. Headline: 3 AI Stocks That Are Way Cheaper Than Apple Right Now | The Motley Fool
Summary: Some may be surprised to see Nvidia (NVDA +0.29%) on this list, as it has a reputation for being "overvalued." However, that's far from the case. Nvidia trades for 22 times forward earnings -- nearly 50% less than Apple. That's a big discount, but it also comes with some incredible growth rates.
Sentiment: negative
2. Headline: Warren Buffett Reveals the Real Reason Berkshire Has Been Dumping Apple Stock
Summary: Warren Buffett Reveals the Real Reason Berkshire Has Been Dumping Apple Stock was originally published by The Motley Fool ... RVMD Revolution Medicines, Inc.
Sentiment: negative
3. Headline: Apple Inc. $AAPL Holdings Boosted by Westmount Partners LLC
Summary: Westmount Partners LLC grew its holdings in Apple Inc. (NASDAQ:AAPL - Free Report) by 6.5% during the 4th quarter, according to its most recent Form 13F filing with the Securities & Exchange Commission. The institutional investor owned 170,045 shares of the iPhone maker's stock after acquiring
Sentiment: positive
4. Headline: My Personal CFO LLC Increases Position in Apple Inc. $AAPL
Summary: My Personal CFO LLC boosted its holdings in Apple Inc. (NASDAQ:AAPL - Free Report) by 720.3% during the 4th quarter, according to the company in its most recent filing with the SEC. The institutional investor owned 45,200 shares of the iPhone maker's stock after acquiring an additional 39,690 shar
Sentiment: positive
5. Headline: Moody Lynn & Lieberson LLC Purchases 3,171 Shares of Apple Inc. $AAPL
Summary: Moody Lynn & Lieberson LLC boosted its position in shares of Apple Inc. (NASDAQ:AAPL - Free Report) by 1.1% during the 4th quarter, according to the company in its most recent disclosure with the Securities & Exchange Commission. The firm owned 279,130 shares of the iPhone maker's stock after b
Sentiment: positive
Powered by Brave
Recent Updates
News Summary
Recent news highlights a mixed but generally positive outlook for Apple Inc. Institutional investors such as Westmount Partners LLC and My Personal CFO LLC have notably increased their holdings, signaling confidence in the company’s growth prospects. Apple is also involved in a significant antitrust legal matter in the US, seeking assistance from Samsung, which may impact regulatory and competitive dynamics. However, some retail locations like the Apple Store at Trumbull Mall are slated for closure due to declining conditions, reflecting challenges in physical retail. Additionally, Apple’s strong iPhone and Mac portfolio is seen as a potential driver for stock recovery in fiscal year 2026, despite a year-to-date stock price decline of 4.2%. These developments collectively underscore ongoing strategic adjustments amid evolving market conditions.
News Sentiment
The sentiment across recent updates is cautiously positive, with institutional buying and product portfolio strength balancing concerns over regulatory challenges and retail store closures. Positive sentiment is evident in investor accumulation and legal strategy, while neutral to slightly negative tones arise from operational adjustments and market performance. Overall, the sentiment suggests measured optimism tempered by external risks.
Analytical Overview
Analysis Summary
Overall Business and Market Assessment
Supporting Factors: No data
Risk Factors: No data
SWOT Analysis
Strengths
- Market leader with a diversified product and services ecosystem.
- Strong profitability with gross margin near 48% and net margin over 27%.
- Robust cash flow generation supporting operational and strategic initiatives.
- Extensive global presence and brand recognition.
Weaknesses
- High price-to-book ratio indicating premium valuation.
- Current ratio below 1, suggesting tight short-term liquidity.
- Dependence on iPhone sales for majority of revenue.
- Relatively low insider ownership limiting direct executive stake.
Opportunities
- Expansion into foldable smartphone market and AI technologies.
- Growth potential in subscription-based digital services.
- Institutional investor accumulation supporting stock stability.
- Leveraging legal strategies to manage regulatory challenges.
Threats
- Regulatory scrutiny and antitrust investigations in key markets.
- Intense competition from other technology and consumer electronics firms.
- Supply chain disruptions affecting product availability.
- Potential valuation pressure from market sentiment shifts.
Company Description
Apple Inc. is a leading technology company renowned for designing, manufacturing, and marketing innovative hardware and software products for consumers and businesses worldwide. Its flagship product, the iPhone, accounts for the majority of sales, serving as the central hub of an expansive ecosystem that includes Mac computers, iPad tablets, Apple Watch wearables, and accessories like AirPods. Apple Inc. also offers a suite of services such as the App Store, Apple Music, iCloud, Apple TV+, and Apple Fitness+, providing digital content, cloud storage, and subscription-based platforms. Operating in the consumer electronics industry within the technology sector, the company employs approximately 166,000 people and maintains a broad global presence through online stores, retail outlets, and partnerships with carriers and resellers. With a substantial market capitalization reflecting its scale, Apple Inc. plays a pivotal role in shaping consumer technology trends, emphasizing seamless integration across devices and services to enhance user experience and productivity.