
Apple Inc (AAPL)
Stock Analysis Report
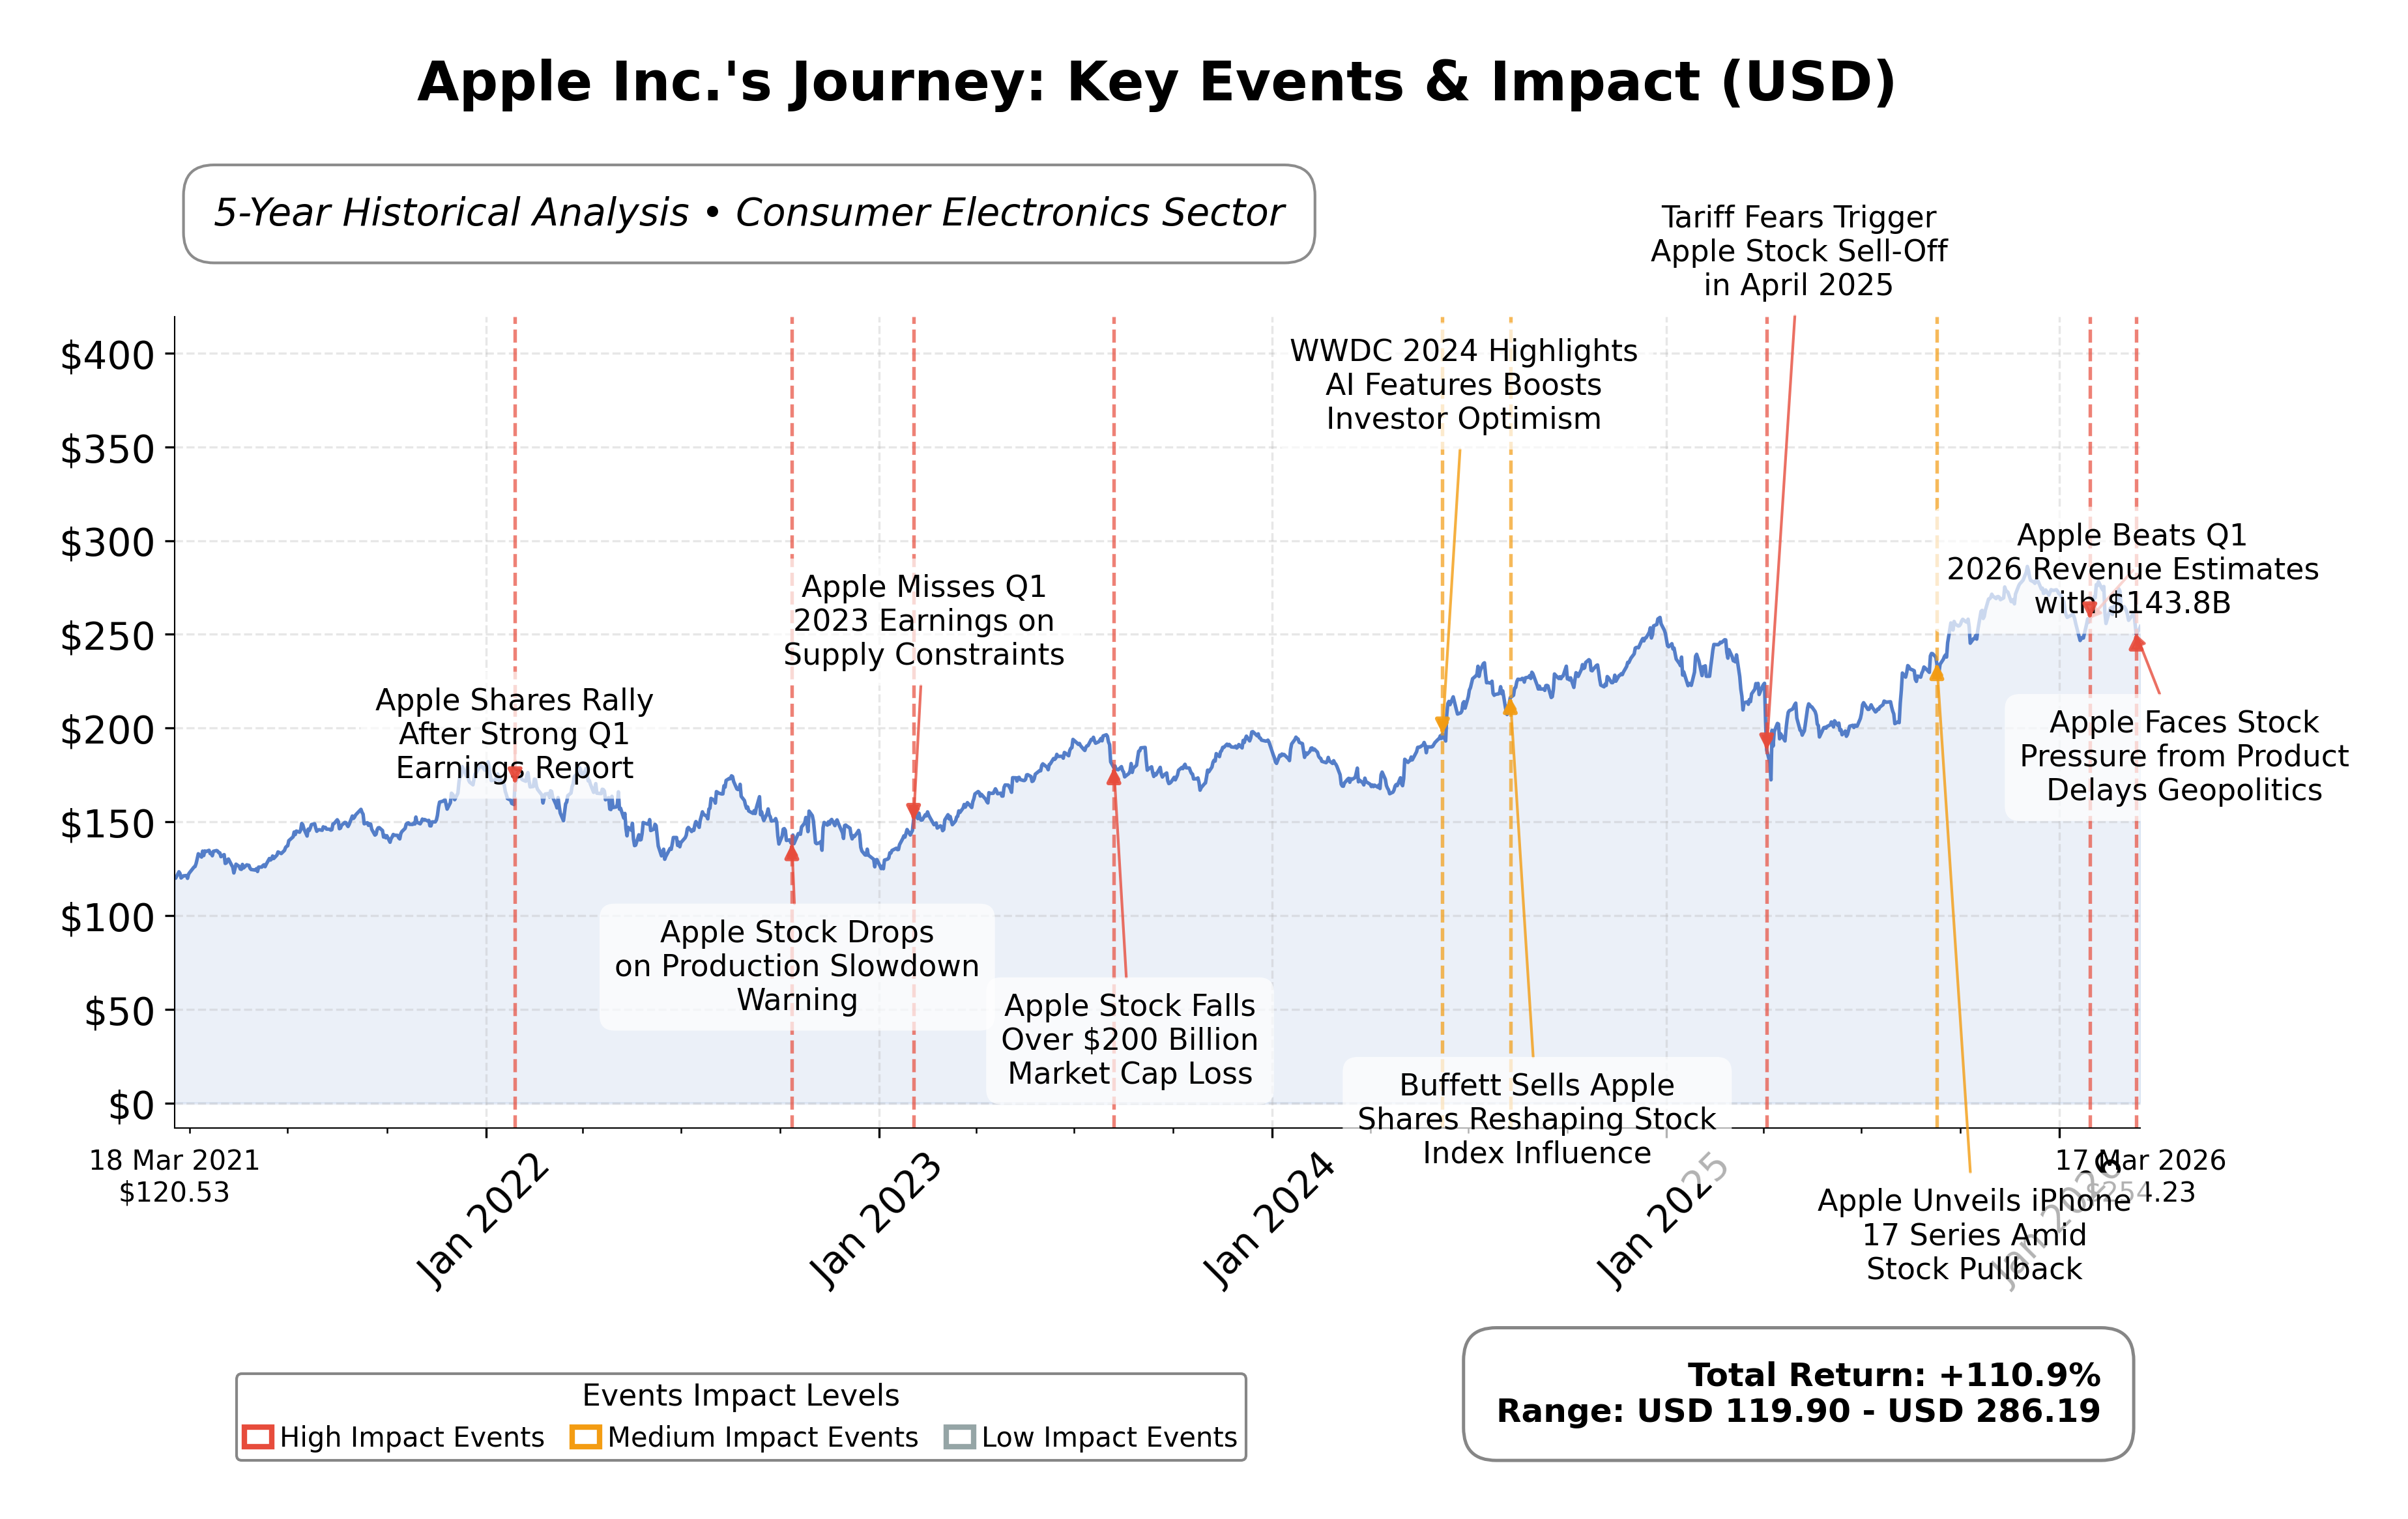
Stock Journey
Key Positives and Key Risks
Pros
- Market capitalization of $3.68 trillion underscores Apple's dominant industry position and scale.
- Quarterly revenue growth of 15.7% and earnings growth of 15.9% indicate strong operational momentum.
- Operating cash flow of approximately $135.5 billion and free cash flow of $106.3 billion reflect robust liquidity and financial flexibility.
Cons
- Price-to-book ratio of 42.64 suggests a high valuation premium relative to book value.
- Debt-to-equity ratio of 102.63% indicates elevated leverage that could impact financial risk.
- Current ratio of 0.974 points to tight short-term liquidity, which may constrain operational flexibility.
Disclosure: This information is for general awareness and does not constitute investment advice
Report Summary
Apple Inc. operates as a premier technology company specializing in the design, manufacture, and marketing of consumer electronics and software products. Its core offerings include the iPhone, Mac computers, iPads, wearables such as the Apple Watch, and a broad range of digital services including the App Store, Apple Music, and iCloud. Positioned as a leader in the consumer electronics industry, Apple maintains a significant global footprint supported by a robust ecosystem that integrates hardware and services.
Financially, Apple demonstrates strong performance with a market capitalization exceeding $3.67 trillion and a trailing P/E ratio of approximately 32.37, reflecting premium valuation in line with industry standards. The company reports a profit margin of 27.04%, operating margin of 35.37%, and a return on assets of 24.38%, underscoring efficient asset utilization and profitability. Revenue growth stands at 15.7% year-over-year, supported by substantial operating cash flow and free cash flow generation, indicating healthy liquidity and operational strength.
From a strategic and technical perspective, Apple has recently undertaken acquisitions such as MotionVFX to bolster its services segment, signaling a shift towards higher-margin subscription offerings. Leadership continuity is evident with CEO Tim Cook affirming his ongoing role, mitigating uncertainties around management transitions. Notable strengths include a diversified product portfolio and strong institutional ownership at 65.26%, while risks involve high valuation multiples and competitive pressures in consumer electronics.
Peer analysis within the consumer electronics sector in the United States reveals Appleâs dominant market capitalization and premium valuation metrics compared to peers like Sony Group Corporation, which exhibits a significantly lower market cap and valuation multiples. Apple's return on equity notably surpasses that of its peers, highlighting superior capital efficiency and profitability within its regional industry cohort.
Apple navigates a complex industry landscape marked by rapid technological innovation and evolving consumer preferences. Recent achievements include robust financial results and strategic acquisitions enhancing its service offerings. Challenges persist in maintaining growth momentum amid competitive dynamics and regulatory scrutiny. The company stands at a pivotal juncture where execution of its integrated hardware and services strategy will influence its market leadership and financial trajectory. Given the comprehensive data, a balanced stance reflecting ongoing observation of valuation and operational developments may be appropriate for those assessing the stock.
Company and Industry Overview
Company Basics
Price Performance
Company Size
Shareholding Pattern
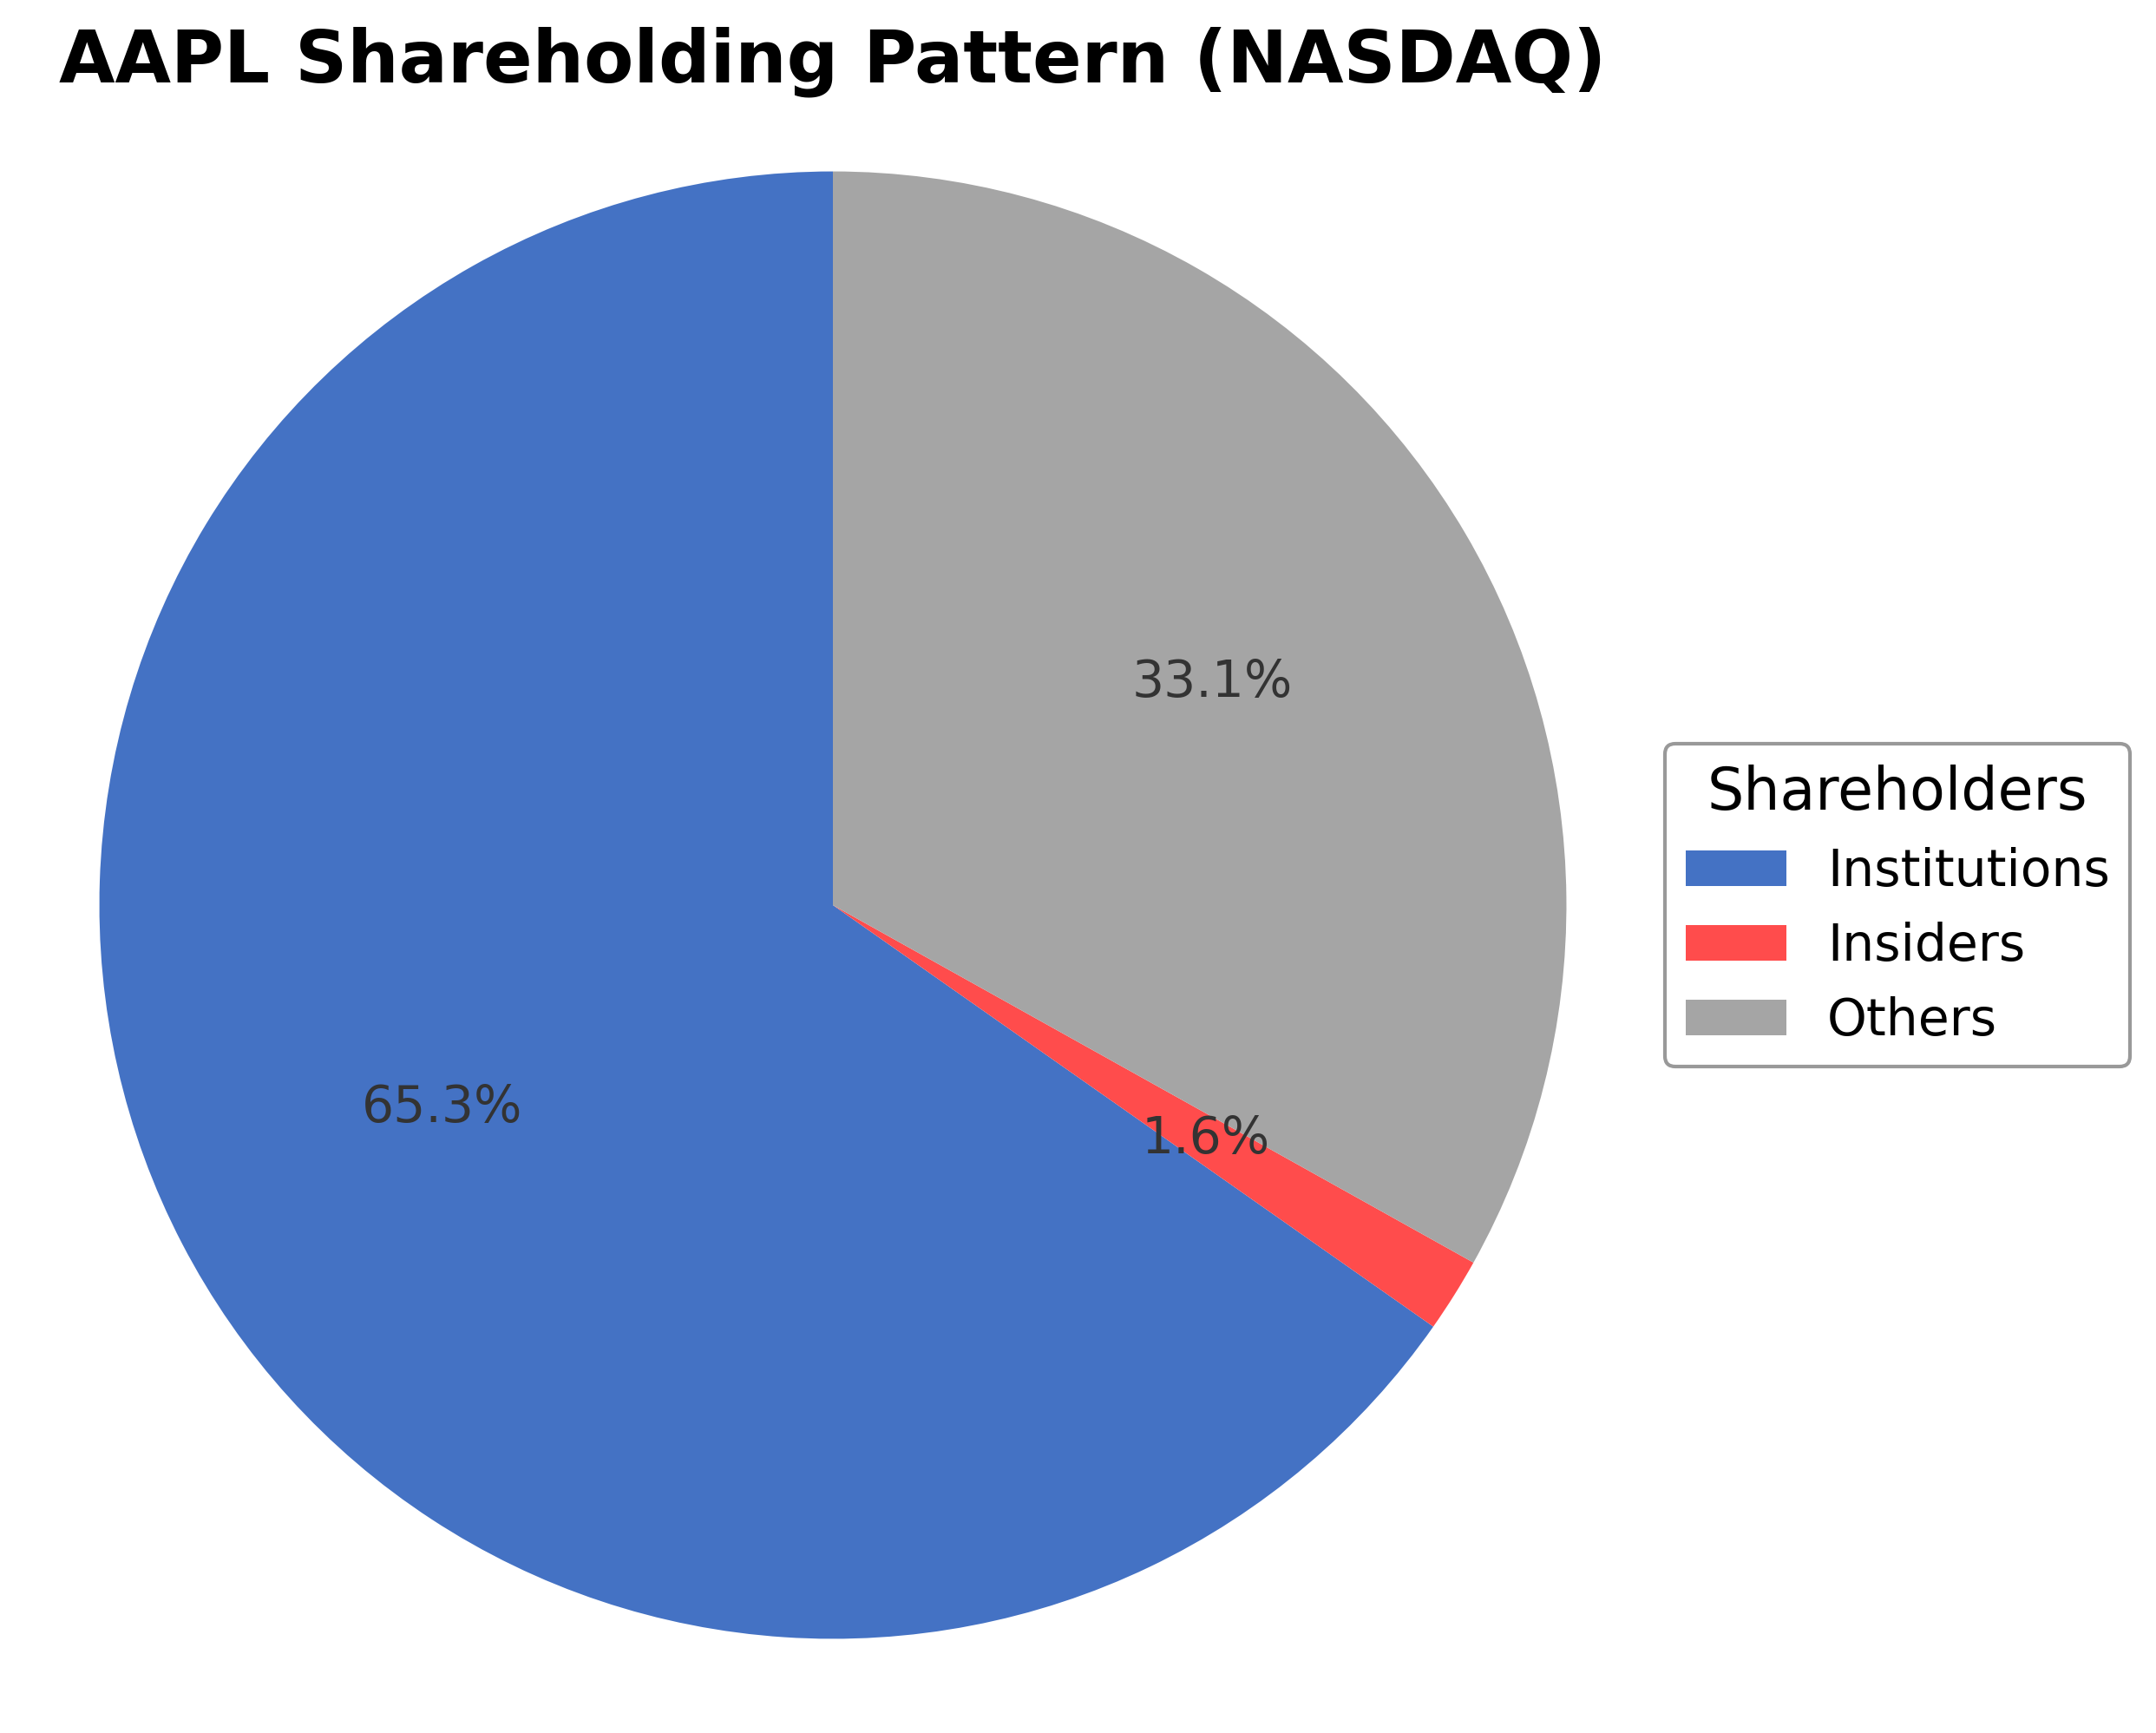
Apple Inc.'s ownership structure is characterized by a modest insider holding of approximately 1.64%, institutional investors controlling a significant majority at 65.26%, and other shareholders including retail investors comprising around 33.10%. Over the past 12-24 months, institutional accumulation has been notable, with several major funds increasing their positions, reflecting sustained confidence in the company's strategic direction. This ownership distribution suggests a strong institutional endorsement, which supports governance stability and strategic continuity. The dominant institutional presence may influence future corporate actions and underscores market sentiment favoring Apple's long-term growth prospects within the consumer electronics industry.
Sector and Industry Analysis
Apple Inc. (AAPL) operates primarily within the Technology sector, specifically in the Hardware industry, which encompasses consumer electronics, computing devices, and semiconductor components. The global hardware market is vast, with a multi-trillion-dollar valuation driven by continuous innovation and consumer demand for connected devices. Apple is a dominant player, with a market capitalization exceeding $3.7 trillion and a broad product portfolio centered on the iPhone, which accounts for the majority of its revenue. Other significant product lines include the Mac, iPad, Apple Watch, and an expanding ecosystem of software and services such as streaming, subscription bundles, and augmented reality applications. The sector’s growth trajectory is supported by ongoing digital transformation, increasing consumer reliance on mobile and wearable technology, and the integration of hardware with proprietary software and semiconductor design.
Industry trends highlight a shift towards ecosystem-centric product strategies, where hardware devices serve as entry points to software and services, enhancing customer lock-in and recurring revenue streams. Apple exemplifies this with its vertically integrated model, designing its own chips (e.g., Apple Silicon) and operating systems, while outsourcing manufacturing to partners like Foxconn and TSMC. Consumer behavior is increasingly favoring seamless interoperability, privacy, and premium user experiences, which Apple leverages through its tightly controlled hardware-software integration. Emerging opportunities include augmented reality (AR), artificial intelligence (AI)-driven features, and expansion into health and wellness markets via wearable devices. Additionally, subscription services and content streaming are becoming critical growth drivers, diversifying revenue beyond traditional hardware sales.
The regulatory landscape for the hardware and technology sector is complex and evolving, with significant scrutiny on data privacy, antitrust concerns, and international trade policies. Apple faces regulatory challenges related to its App Store practices, data security standards, and supply chain transparency. Compliance with global regulations such as GDPR in Europe, CCPA in California, and emerging digital market laws requires continuous adaptation. Trade tensions and tariffs, particularly involving China and the U.S., impact manufacturing and supply chain strategies. Environmental regulations also push companies toward sustainable sourcing and product lifecycle management. These regulatory factors influence operational costs, market access, and strategic planning within the sector.
Competitive dynamics in the hardware industry are characterized by high capital intensity, rapid innovation cycles, and significant economies of scale. Barriers to entry are substantial due to the need for advanced R&D capabilities, global supply chain networks, and brand equity. Apple’s competitive positioning is strong, supported by its integrated ecosystem, premium brand, and robust financial resources. It competes with other technology giants such as Samsung, Microsoft, Google, and emerging Chinese manufacturers who challenge on price, innovation, and ecosystem breadth. The industry also sees competition from semiconductor firms and software providers that influence hardware capabilities. Maintaining differentiation through design, user experience, and proprietary technology remains critical for sustaining market leadership.
Note: Analysis synthesized from industry research, market reports, and regulatory filings. Information is subject to change based on market conditions.
Illustrative Scenario Analysis
DCF Assumptions:
Method: Two-Stage EPS-Priority Model
Financials
Peer Analysis
| Company Name | Market Cap | P/E Ratio | P/B Ratio | EV/EBITDA | Price to CFO |
|---|---|---|---|---|---|
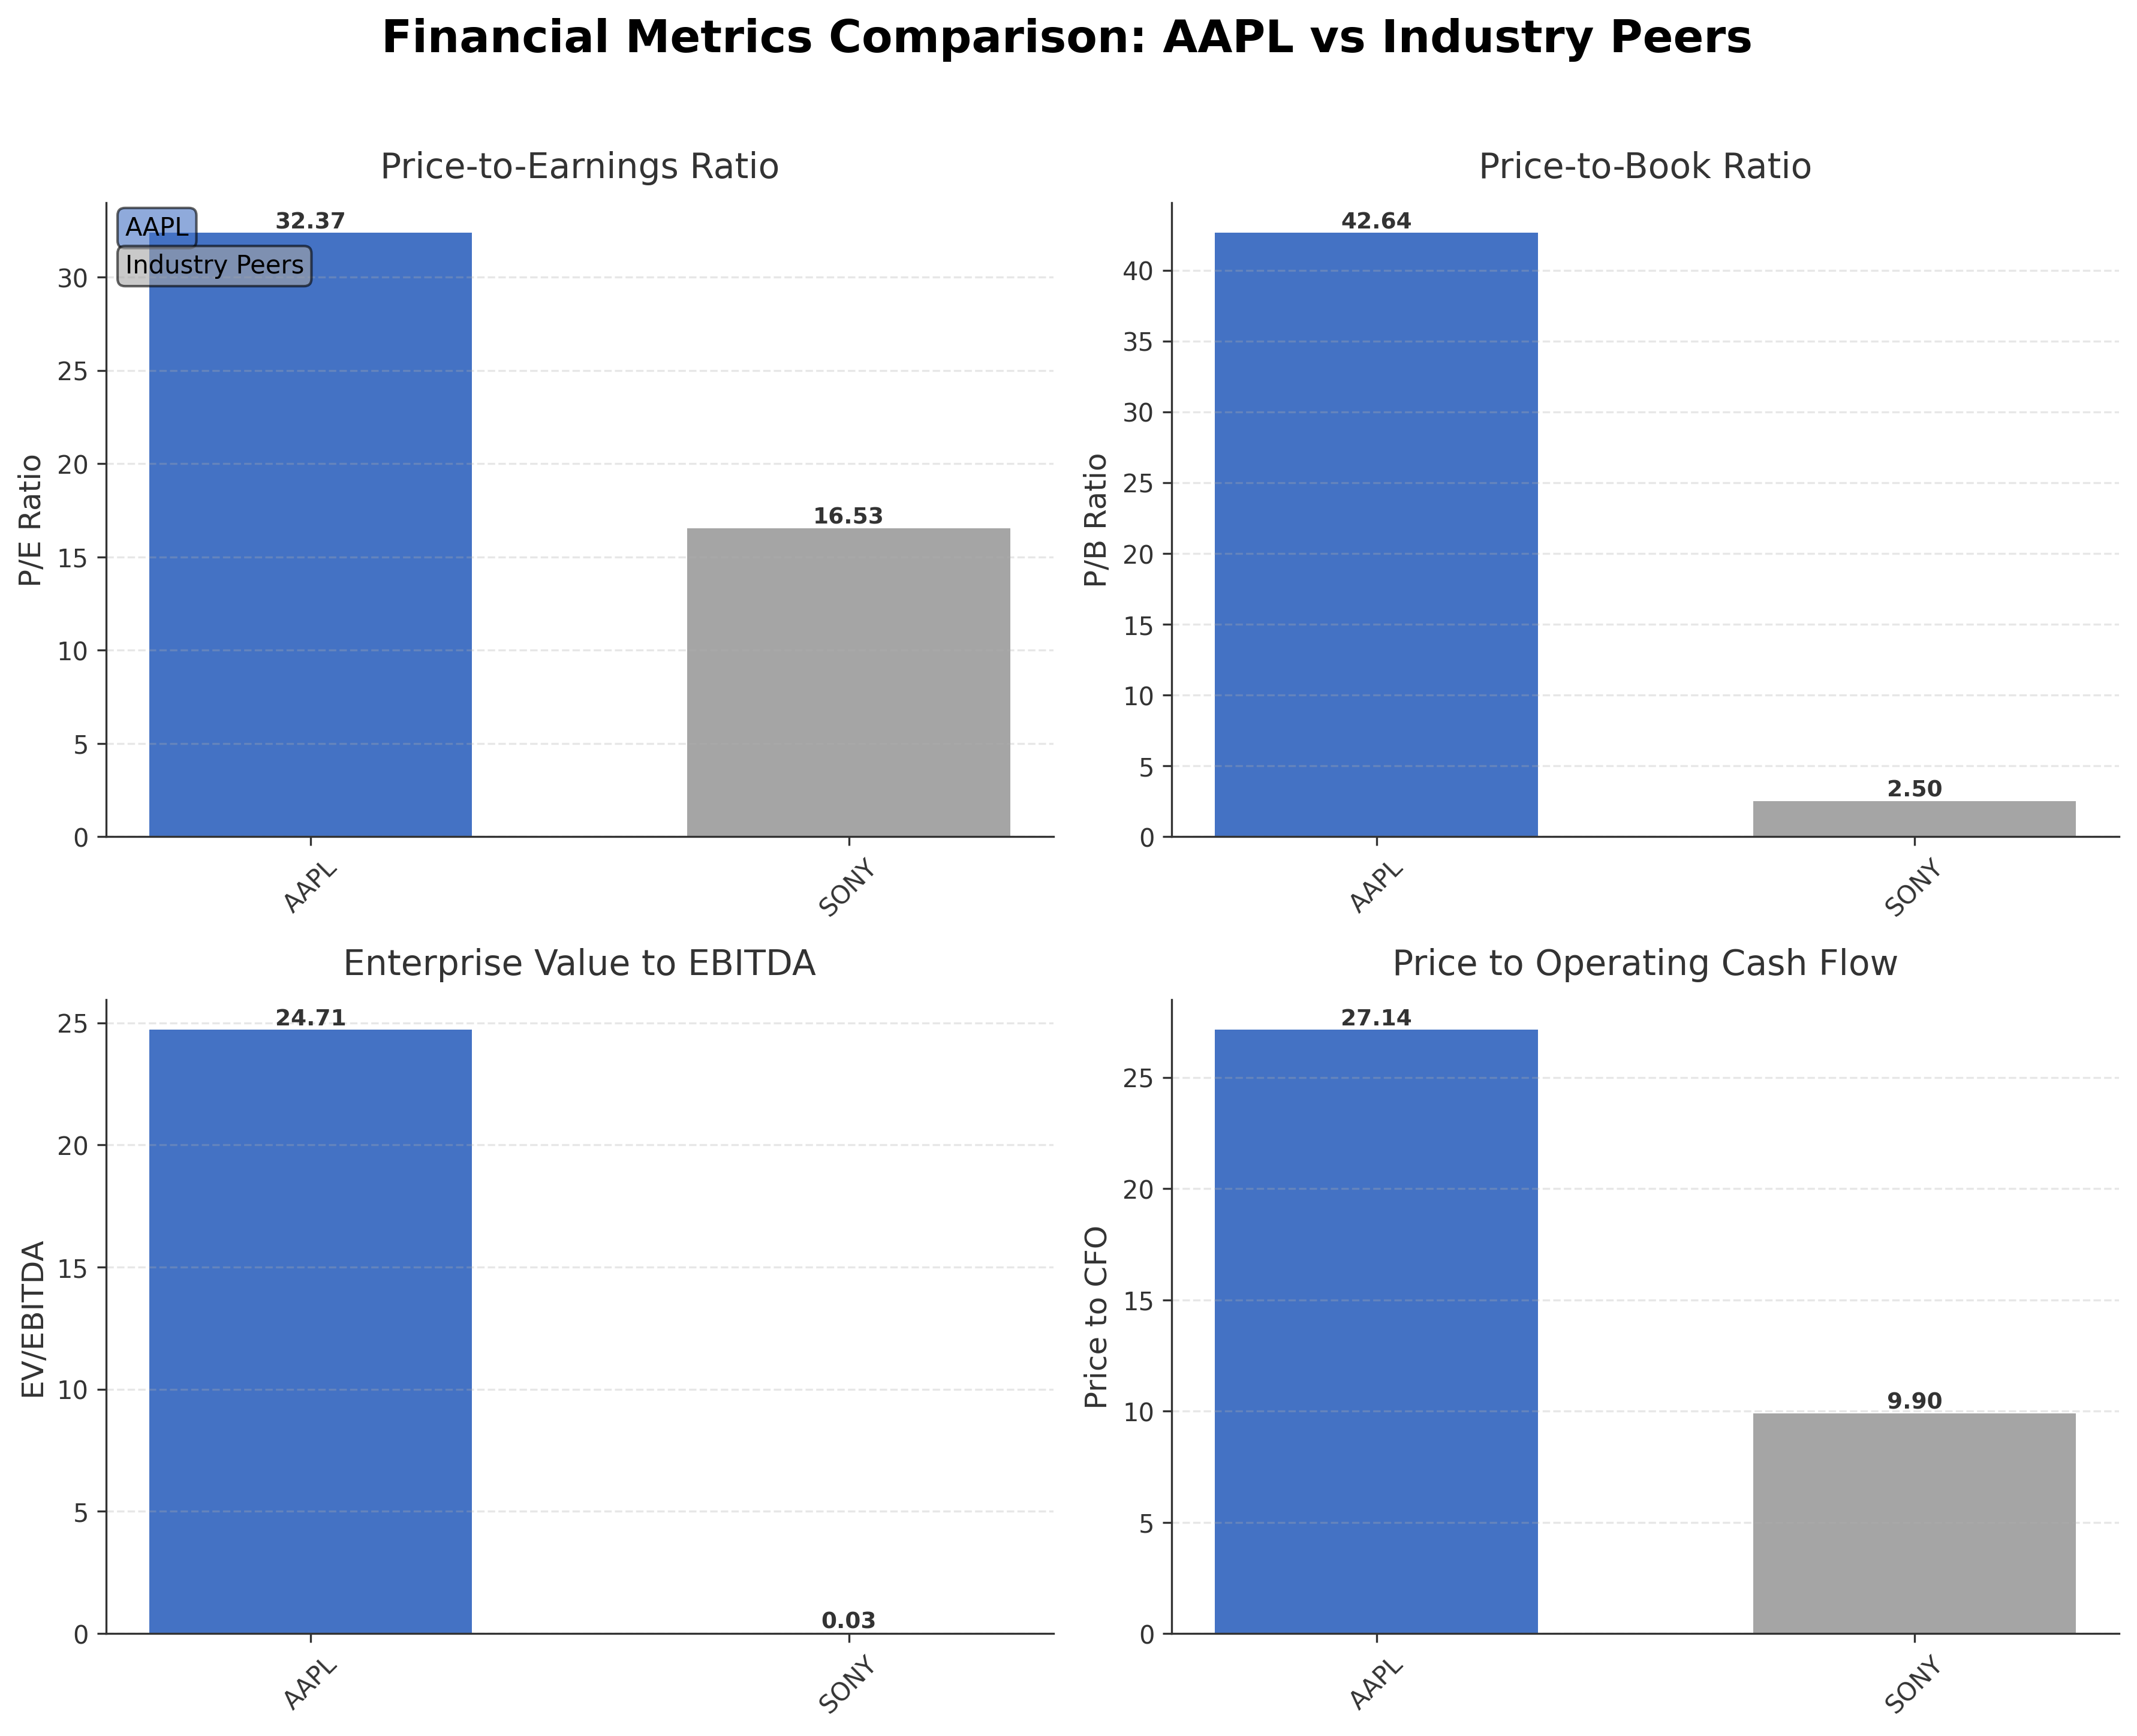
| Apple Inc. | $3.68T | 32.37 | 42.64 | 24.71 | 27.14 |
| Sony Group Corporation - Sponsored American Depositary Receipt | $127.61B | 16.53 | 2.50 | 0.03 | 9.90 |
Comparison Analysis: Apple Inc. significantly outpaces its regional peer Sony Group Corporation in market capitalization, reflecting its dominant industry position. Apple's valuation multiples, including P/E and P/B ratios, are substantially higher, indicative of premium market expectations and strong brand equity. The company's EV/EBITDA and price to CFO ratios also exceed those of Sony, suggesting higher operational profitability and cash flow generation. Return on equity for Apple is notably superior, underscoring efficient capital utilization relative to peers. This comparison highlights Apple's leadership in financial performance and market stature within the consumer electronics sector.
Financial Metrics Comparison with Peers
Financial Statements
Comprehensive financial data including income, balance sheet, and cash flow metrics
Income Statement
| fiscal_date | 2025-09-30 | 2024-09-30 | 2023-09-30 | 2022-09-30 | 2021-09-30 |
|---|---|---|---|---|---|
| Sales | 416.16B | 391.04B | 383.29B | 394.33B | 365.82B |
| Cost Of Goods | 220.96B | 210.35B | 214.14B | 223.55B | 212.98B |
| Gross Profit | 195.20B | 180.68B | 169.15B | 170.78B | 152.84B |
| Operating Expense Research And Development | 34.55B | 31.37B | 29.91B | 26.25B | 21.91B |
| Operating Expense Selling General And Administrative | 27.60B | 26.10B | 24.93B | 25.09B | 21.97B |
| Operating Income | 133.05B | 123.22B | 114.30B | 119.44B | 108.95B |
| Other Income Expense | -321.00M | 269.00M | -565.00M | -334.00M | 60.00M |
| Pretax Income | 132.73B | 123.48B | 113.74B | 119.10B | 109.21B |
| Income Tax | 20.72B | 29.75B | 16.74B | 19.30B | 14.53B |
| Net Income | 112.01B | 93.74B | 97.00B | 99.80B | 94.68B |
| Eps Basic | 7.49 | 6.11 | 6.16 | 6.15 | 5.67 |
| Eps Diluted | 7.46 | 6.08 | 6.13 | 6.11 | 5.61 |
| Basic Shares Outstanding | 14.95B | 15.34B | 15.74B | 16.22B | 16.70B |
| Diluted Shares Outstanding | 14.95B | 15.34B | 15.74B | 16.22B | 16.70B |
| Ebit | 133.05B | 123.22B | 114.30B | 119.44B | 111.85B |
| Ebitda | 144.75B | 134.66B | 125.82B | 130.54B | 123.14B |
| Net Income Continuous Operations | 112.01B | 93.74B | 97.00B | 99.80B | 94.68B |
| Non Operating Interest Income | N/A | N/A | 3.75B | 2.83B | 2.84B |
| Non Operating Interest Expense | N/A | N/A | 3.93B | 2.93B | 2.65B |
Source: Financial statements and regulatory filings
Balance Sheet
| fiscal_date | 2025-09-30 | 2024-09-30 | 2023-09-30 | 2022-09-30 | 2021-09-30 |
|---|---|---|---|---|---|
| Cash And Cash Equivalents | 35.93B | 29.94B | 29.96B | 23.65B | 34.94B |
| Accounts Receivable | 39.78B | 33.41B | 29.51B | 28.18B | 26.28B |
| Total Assets | 359.24B | 364.98B | 352.58B | 352.75B | 351.00B |
| Total Liabilities | 285.51B | 308.03B | 290.44B | 302.08B | 287.91B |
| Long Term Debt | 78.33B | 85.75B | 95.28B | 109.71B | 119.38B |
| Shareholders Equity | 73.73B | 56.95B | 62.15B | 50.67B | 63.09B |
Source: Financial statements and regulatory filings
Cash Flow Statement
| fiscal_date | 2025-09-30 | 2024-09-30 | 2023-09-30 | 2022-09-30 | 2021-09-30 |
|---|---|---|---|---|---|
| Operating Activities Net Income | 112.01B | 93.74B | 97.00B | 99.80B | 94.68B |
| Operating Activities Depreciation | 11.70B | 11.45B | 11.52B | 11.10B | 11.28B |
| Operating Activities Stock Based Compensation | 12.86B | 11.69B | 10.83B | 9.04B | 7.91B |
| Operating Activities Other Non Cash Items | -89.00M | -2.27B | -2.23B | 1.01B | -4.92B |
| Operating Activities Accounts Receivable | -7.03B | -5.14B | -417.00M | -9.34B | -14.03B |
| Operating Activities Accounts Payable | 902.00M | 6.02B | -1.89B | 9.45B | 12.33B |
| Operating Activities Other Assets Liabilities | -18.87B | 2.77B | -4.27B | 1.57B | -1.53B |
| Operating Activities Operating Cash Flow | 111.48B | 118.25B | 110.54B | 123.52B | 100.94B |
| Investing Activities Capital Expenditures | -12.71B | -9.45B | -10.96B | -10.71B | -11.09B |
| Investing Activities Purchase Of Investments | -24.41B | -48.66B | -29.51B | -76.92B | -109.56B |
| Investing Activities Sale Of Investments | 53.80B | 62.35B | 45.51B | 67.36B | 106.48B |
| Investing Activities Other Investing Activity | -1.48B | -1.31B | -1.34B | -2.09B | -385.00M |
| Investing Activities Investing Cash Flow | 15.20B | 2.94B | 3.71B | -22.66B | -14.58B |
| Financing Activities Long Term Debt Issuance | 4.48B | 0.00 | 5.23B | 5.46B | 20.39B |
| Financing Activities Long Term Debt Payments | -10.93B | -9.96B | -11.15B | -9.54B | -8.75B |
| Financing Activities Short Term Debt Issuance | -2.03B | 3.96B | -3.98B | 3.96B | 1.02B |
| Financing Activities Common Stock Repurchase | -90.71B | -94.95B | -77.55B | -89.40B | -85.97B |
| Financing Activities Common Dividends | -15.42B | -15.23B | -15.03B | -14.84B | -14.47B |
| Financing Activities Other Financing Charges | -6.07B | -5.80B | -6.01B | -6.38B | -5.58B |
| Financing Activities Financing Cash Flow | -120.69B | -121.98B | -108.49B | -110.75B | -92.25B |
| End Cash Position | 35.93B | 29.94B | 30.74B | 24.98B | 35.93B |
| Income Tax Paid | 43.37B | 26.10B | 18.68B | 19.57B | 25.39B |
| Free Cash Flow | 98.77B | 108.81B | 99.58B | 111.44B | 92.95B |
| Interest Paid | N/A | N/A | 3.80B | 2.87B | 2.69B |
| Operating Activities Deferred Taxes | N/A | N/A | N/A | 895.00M | -4.77B |
| Investing Activities Net Acquisitions | N/A | N/A | N/A | -306.00M | -33.00M |
| Financing Activities Common Stock Issuance | N/A | N/A | N/A | N/A | 1.10B |
Source: Financial statements and regulatory filings
Technical Analysis
Key Insights
- The current trend shows a consolidation phase with price action hovering near the $250 level after recent declines from the 52-week high of $288.62.
- Key support levels are identified near $245 (200-day moving average) and $169 (52-week low), while resistance is observed around $263 (50-day moving average) and $288 (52-week high).
- The stock price is trading below the 50-day moving average of $263.17 but remains above the 200-day moving average of $245.33, indicating mixed momentum across timeframes.
- Momentum indicators show RSI near neutral levels, MACD exhibits a potential bearish crossover, and stochastic oscillators suggest a possible oversold condition in the short term.
- Multi-timeframe analysis reveals daily charts indicating sideways movement, weekly charts showing mild bearish pressure, and monthly charts maintaining a long-term uptrend.
- Current technical setup suggests potential for range-bound trading with possible volatility near support and resistance zones, warranting close observation of momentum shifts.
Trending News
1. Headline: Apple Inc. $AAPL Shares Acquired by Tcfg Wealth Management LLC
Summary: Tcfg Wealth Management LLC boosted its position in Apple Inc. (NASDAQ:AAPL - Free Report) by 34.4% during the 3rd quarter, according to the company in its most recent filing with the Securities & Exchange Commission. The fund owned 84,385 shares of the iPhone maker's stock after purchasing an a
Sentiment: positive
2. Headline: 8,503 Shares in Apple Inc. $AAPL Bought by Mizuho Markets Cayman LP
Summary: Mizuho Markets Cayman LP acquired a new position in shares of Apple Inc. (NASDAQ:AAPL - Free Report) in the third quarter, according to its most recent 13F filing with the Securities and Exchange Commission (SEC). The firm acquired 8,503 shares of the iPhone maker's stock, valued at approximately $
Sentiment: neutral
3. Headline: Coldstream Capital Management Inc. Purchases 34,297 Shares of Apple Inc. $AAPL
Summary: Coldstream Capital Management Inc. raised its position in Apple Inc. (NASDAQ:AAPL - Free Report) by 6.1% during the third quarter, according to the company in its most recent disclosure with the Securities & Exchange Commission. The institutional investor owned 598,954 shares of the iPhone mak
Sentiment: positive
4. Headline: Cim Investment Management Inc. Decreases Stake in Apple Inc. $AAPL
Summary: Cim Investment Management Inc. trimmed its position in Apple Inc. (NASDAQ:AAPL - Free Report) by 52.3% in the third quarter, according to its most recent filing with the SEC. The fund owned 44,688 shares of the iPhone maker's stock after selling 49,017 shares during the period. Apple accounts for a
Sentiment: negative
5. Headline: Apexium Financial LP Has $60.87 Million Stock Holdings in Apple Inc. $AAPL
Summary: Apexium Financial LP lessened its position in Apple Inc. (NASDAQ:AAPL - Free Report) by 2.2% during the third quarter, according to its most recent 13F filing with the SEC. The institutional investor owned 239,070 shares of the iPhone maker's stock after selling 5,428 shares during the period. App
Sentiment: positive
6. Headline: Apple (AAPL) CEO Tim Cook Shoots Down Retirement Rumors - TipRanks.com
Summary: Cook made the announcement that he is not retiring during an appearance on the television program Good Morning America. There had been rampant speculation since last fall that Cook would retire from Apple later this year, paving the way for a successor to take the helm of the iPhone maker.
Sentiment: neutral
7. Headline: Ionic Capital Management LLC Takes $903,000 Position in Apple Inc. $AAPL
Summary: Ionic Capital Management LLC purchased a new stake in Apple Inc. (NASDAQ:AAPL - Free Report) in the 3rd quarter, according to its most recent filing with the Securities & Exchange Commission. The fund purchased 3,548 shares of the iPhone maker's stock, valued at approximately $903,000. A number
Sentiment: neutral
8. Headline: Hollow Brook Wealth Management LLC Buys 3,412 Shares of Apple Inc. $AAPL
Summary: Hollow Brook Wealth Management LLC boosted its stake in Apple Inc. (NASDAQ:AAPL - Free Report) by 8.8% in the third quarter, according to the company in its most recent 13F filing with the Securities & Exchange Commission. The firm owned 42,312 shares of the iPhone maker's stock after acquiring
Sentiment: positive
9. Headline: ICONIQ Capital LLC Sells 68,445 Shares of Apple Inc. $AAPL
Summary: ICONIQ Capital LLC lowered its stake in shares of Apple Inc. (NASDAQ:AAPL - Free Report) by 90.3% during the 3rd quarter, according to its most recent Form 13F filing with the Securities and Exchange Commission. The firm owned 7,327 shares of the iPhone maker's stock after selling 68,445 shares dur
Sentiment: negative
10. Headline: Apple acquires video editing company MotionVFX to boost subscribers
Summary: The move could help Apple better compete with Adobe Premiere Pro and add subscribers as it continues to lessen its reliance on devices. Apple's services business, which includes subscriptions like iCloud, Apple Music and app bundles, generally have higher profit margins than hardware like iPhones.
Sentiment: positive
Recent Updates
News Summary
Recent developments for Apple Inc. include CEO Tim Cook's visit to China amid escalating pressures on the company's App Store policies, highlighting ongoing regulatory challenges in key international markets. Market sentiment remains cautiously optimistic, supported by bullish analyses such as those from Quality Value Investing, while mixed reactions emerge from public commentary on Apple's customer engagement. Strategic expansion continues with the acquisition of Polish visual effects firm MotionVFX, aimed at enhancing Apple's services segment and diversifying revenue streams. Trading activity shows positive momentum with market predictions favoring price appreciation. These events collectively underscore Apple's efforts to navigate regulatory landscapes, innovate service offerings, and maintain market confidence amid evolving industry dynamics.
News Sentiment
Sentiment across recent news is predominantly neutral to positive, with institutional buying activity and strategic acquisitions contributing to an optimistic outlook. However, some negative commentary and regulatory scrutiny introduce caution, reflecting a balanced market perception. The diversity of news sources and topics indicates a complex environment where growth opportunities coexist with operational and regulatory risks.
Analytical Overview
Analysis Summary
Apple's valuation metrics, including a trailing P/E of 32.37 and forward P/E of 27.51, align closely with the consumer electronics industry average, reflecting market confidence in its earnings growth potential relative to peers. The PEG ratio of 1.77 suggests moderate valuation relative to expected growth.
The company exhibits a robust growth trajectory with a quarterly revenue growth rate of 15.7% and quarterly earnings growth year-over-year of 15.9%, supported by strong operating and free cash flow figures, indicating sustainable operational performance.
Financial health is solid, with total cash of approximately $66.9 billion and total debt of about $90.5 billion, resulting in a debt-to-equity ratio of 102.63%. The current ratio near 0.97 suggests adequate short-term liquidity, while strong cash flow metrics reinforce financial flexibility.
Sector-specific challenges include intense competition in consumer electronics and regulatory scrutiny, while opportunities arise from expanding services and subscription-based revenue streams, as evidenced by recent acquisitions.
Consideration of market positioning and competitive advantages highlights Apple's integrated ecosystem, brand strength, and innovation capacity as key differentiators supporting its market leadership.
Investment Conclusion
Supporting Factors: Primary supporting factors include Apple's strong revenue and earnings growth, substantial cash flow generation, and dominant market position within the consumer electronics sector.
Risk Factors: Main risk factors to monitor involve valuation premium, competitive pressures, and regulatory challenges that could impact profitability and market perception.
SWOT Analysis
Strengths
- Apple maintains a strong global brand and market leadership in consumer electronics.
- The company has a diversified product portfolio integrating hardware and services.
- Robust financial performance with high profit margins and strong cash flow generation.
- Significant institutional ownership supports governance and strategic stability.
Weaknesses
- High valuation multiples may limit upside potential in the near term.
- Debt-to-equity ratio above 100% indicates elevated leverage levels.
- Current ratio below 1 suggests tight short-term liquidity management.
- Dependence on flagship products like the iPhone for majority of revenue.
Opportunities
- Expansion of services and subscription offerings to enhance recurring revenue.
- Strategic acquisitions like MotionVFX to diversify product and service lines.
- Growth potential in emerging markets and new technology segments.
- Increasing demand for integrated ecosystems and digital content.
Threats
- Intense competition in consumer electronics and technology sectors.
- Regulatory scrutiny and policy changes impacting App Store and services.
- Global supply chain disruptions affecting production and delivery.
- Market volatility and macroeconomic factors influencing consumer spending.
Company Description
Apple Inc. is a leading technology company renowned for designing, manufacturing, and marketing innovative hardware and software products for consumers and businesses worldwide. Its flagship product, the iPhone, accounts for the majority of sales, serving as the central hub of an expansive ecosystem that includes Mac computers, iPad tablets, Apple Watch wearables, and accessories like AirPods. Apple Inc. also offers a suite of services such as the App Store, Apple Music, iCloud, Apple TV+, and Apple Fitness+, providing digital content, cloud storage, and subscription-based platforms. Operating in the consumer electronics industry within the technology sector, the company employs approximately 166,000 people and maintains a broad global presence through online stores, retail outlets, and partnerships with carriers and resellers. With a substantial market capitalization reflecting its scale, Apple Inc. plays a pivotal role in shaping consumer technology trends, emphasizing seamless integration across devices and services to enhance user experience and productivity.